2.1. Transitions of Control
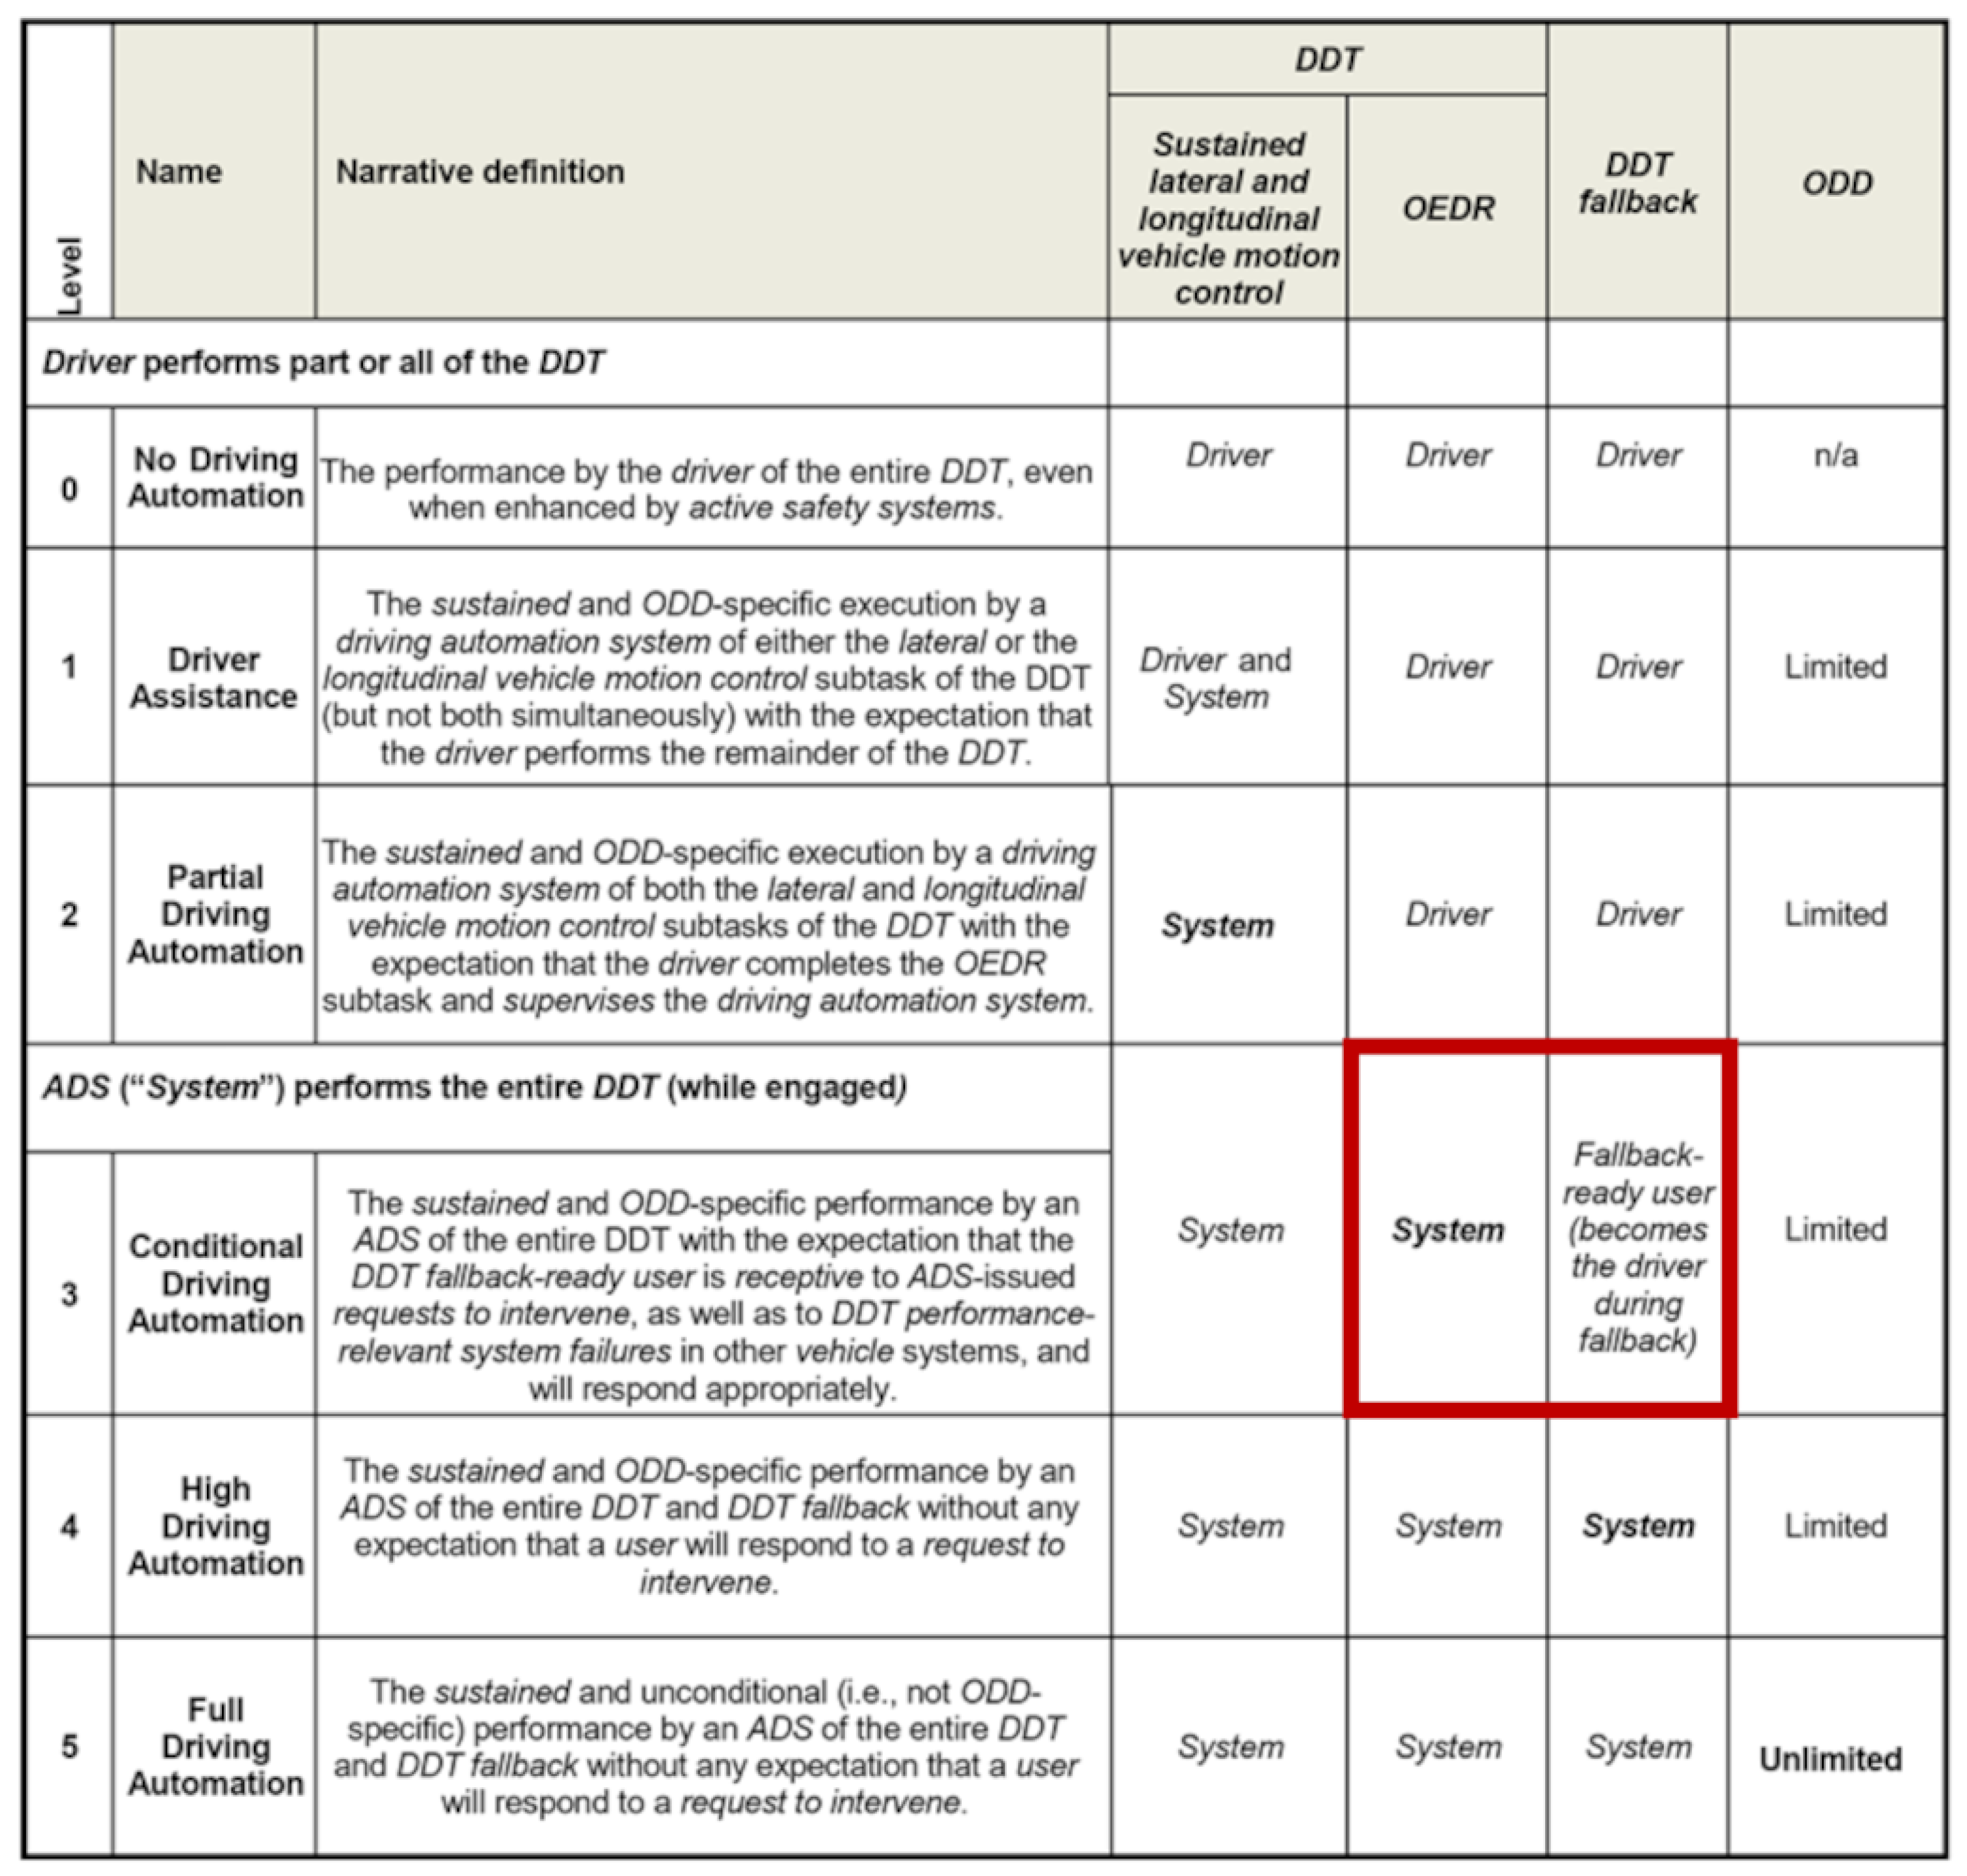
Control transitions, or transitions of control, delineate procedures that regulate the transfer of authority between the human driver and the automated vehicle (AV). The SAE taxonomy for driving automation systems [
5] defines five different levels (cf.
Figure 1); within such, ToCs constitute the transitions between those levels, typically from higher levels to zero or vice versa. In the case of upward ToCs, the driver cedes control to the AV within its predefined ODD. This transfer is facilitated through the activation of its automated driving systems, relinquishing the execution of longitudinal (acceleration/deceleration) and lateral (steering) driving tasks to those systems. For automation Levels 1–2, the human driver keeps monitoring the driving environment, whereas for Levels 3 up to 5, those monitoring tasks shift to the automation. Up to Level 3, the human driver poses as the fallback entity to ensure safe driving performance.
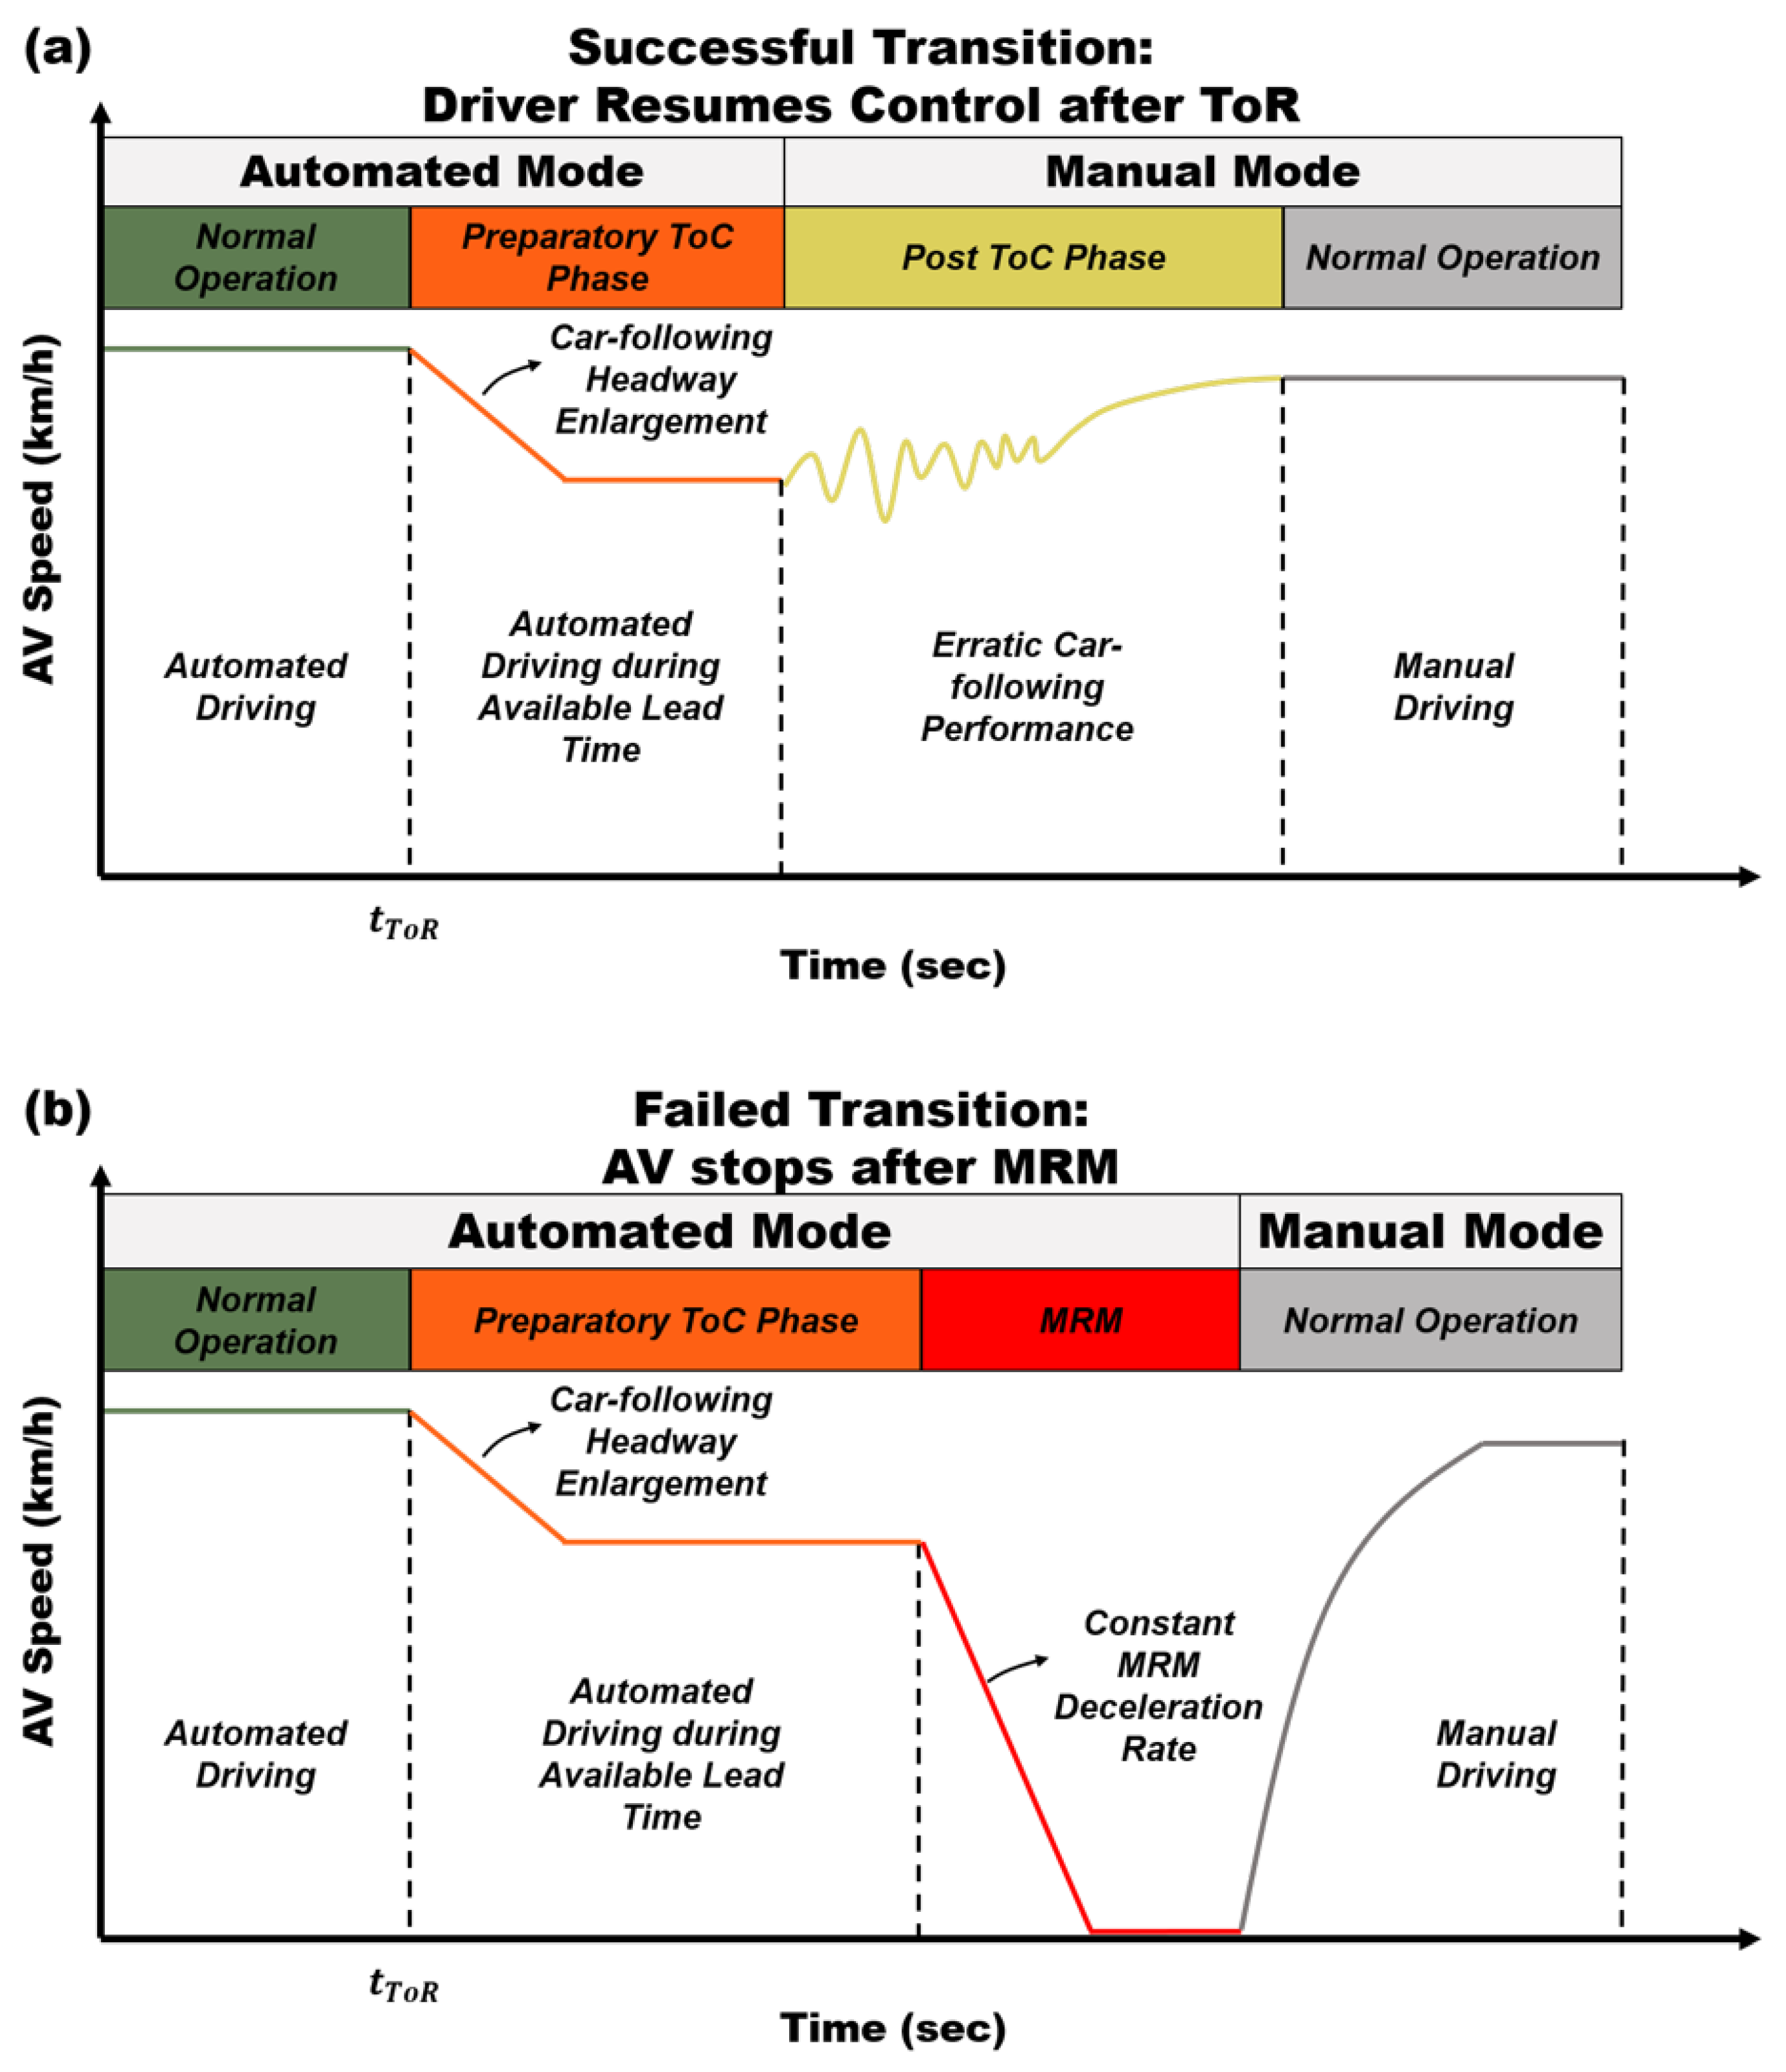
In instances for which the vehicle automation, due to a range of potential external or internal factors, cannot operate safely within its ODD anymore or is requested to disengage, a downward ToC is initiated. This prompts the AV to request the driver’s intervention in order to continue manual control of the vehicle. The mechanism employed to inform the driver of the need to re-engage in primary driving responsibilities, which may involve auditory, visual, or haptic signals or combinations thereof from the vehicle automation, is termed a ’take-over request’ (ToR). A successful downward ToC is considered complete once the driver has re-engaged and continues normal operation with fully restored situational awareness and driving skills. However, if the downward ToC fails, meaning the driver does not respond to the ToR within the specified lead time, the AV will perform a minimum risk maneuver (MRM) to come to a safe stop.
Particularly, the topic of takeover times in AVs in urgent situations has been researched in great detail over the past decade in human sciences, mostly in driving simulators aimed at specifying criteria for the appropriate design of human–machine interfaces for takeovers [
10]. A comprehensive overview of such experimental studies is provided by [
11]. Another motivational factor behind those research studies was to derive indicators of how to conceive takeover strategies in simulation models and automated driving systems with respect to lead times and post-ToC behavior. Recently, studies have focused on human responses to prototypical Level 3 automated driving systems in terms of physiological effects, risk acceptance, comfort level, trust, and various other aspects from the perspective of being in a passenger role during Level 3 operation [
12,
13,
14,
15,
16,
17,
18]. An extensive literature review examining various influential factors on takeover performance is given by [
19]. A notable approach of a generic multi-level framework for microscopic simulation by [
20] incorporates human factors such as task demand, task capacity, and situational awareness. Based on this model, ref. [
21] presented a detailed simulation study to investigate vehicle interactions, alluding to detrimental effects of accumulated ToCs in their analysis. However, most of the related research focuses on individual driving performance and local effects (collision avoidance, lateral and longitudinal safety, and risk tolerance) and is often conducted in driving simulators, small-sample-sized real-world tests, or sub-microscopic simulations. Thereby, the simplified state machine model developed by [
8] for the microscopic traffic simulation SUMO [
22], designed to efficiently capture potential disruptions in traffic caused by ToCs and to facilitate large-scale simulations, is further elucidated in the following paragraph.
Figure 2 presents an illustration of the model, with panel (a) depicting a generic velocity timeline a for successful transition and panel (b) showing a failed transition with a differing timeline. In both variants, a preparatory ToC phase is initiated after a ToR has been triggered, after which automated operation continues for a limited time span (referred to as the available lead time). Yet, the AV’s automation system takes safety precautions during the preparatory ToC phase, i.e., increasing its headway, lane change avoidance, and acceleration abstinence, and continues operation until either re-engagement from the driver (successful ToC) or expiration of the available lead time (failed ToC), at which point it starts an MRM. For the latter case of a failed ToC, the model assumes a constant deceleration rate for the MRM, which can occur in the vehicle’s current lane or the right-most lane (via a autonomous lane change maneuver) depending on traffic conditions. In the case of successful control transition, the post-ToC phase’s driving performance is determined by a driver state model that considers perception errors for imperfect driving, as detailed in [
8], which was partly adapted and based on action point models developed by [
23,
24,
25,
26].
While previous research on ToCs so far has predominantly focused on individual consequences of failed transitions by analyzing crash incidents or disengagement reports [
27,
28,
29,
30], the examination of ToCs’ large-scale effects on traffic has only gained attention in recent years. Among the first studies addressing complications induced by ToCs and exploring potential traffic management countermeasures is the work by [
9]. This study identified adverse impacts on both traffic efficiency and safety. In a small simulation study emphasizing traffic efficiency performance, Ref. [
31] developed a simplified ToC model that restricts lane changes during control transitions while approaching a bottleneck. Although the study discussed safety-related aspects of ToCs, their analysis solely focused on traffic efficiency. Another very insightful study conducted by [
32] assessed the potential impact of ToCs through a comprehensive simulation study for all of Japan. They analyzed variations in crash rates and highlighted the role of overconfidence or distrust in detrimental ToCs, which diminish the accident reduction effects they previously identified. The study generally observed an overall positive impact of vehicle automation on crash rates, particularly when the market penetration of AVs exceeded 50%. Furthermore, ref. [
33] re-simulated specific motorway scenarios, such as ‘cut-in’ situations, based on accident data from the GIDAS dataset provided by the Federal Republic of Germany. This analysis focused on the severity of changes in these driving scenarios and derived potential benefits from automated driving functions by projecting the results to a national scale. In a simulation-based case study aimed to propose potential traffic management countermeasures to mitigate adverse impacts induced by control transitions [
34], our earlier research focused on traffic efficiency performance, deferring an in-depth analysis of safety ramifications from ToCs. Therefore in
Section 3, we introduce a new case study dedicated to investigating these safety effects in greater detail, and we share our findings in
Section 4.
2.2. Surrogate Safety Measures
Surrogate safety measures are an important and helpful tool for evaluating traffic safety, particularly when crash events in data are rare or nonexistent, as in mixed-autonomy traffic scenarios. A good categorization, including mathematical definitions of relevant SSMs, can be found in a survey in [
35]. Another comprehensive and quite deliberate literature review is given in [
36], which details state-of-the-art SSMs in mixed-autonomy traffic research. Particularly, the authors critically discuss certain shortcomings of SSM-based safety assessments and point out inadequacies in simulation-based safety evaluations, which concentrate on automated driving without calibrated vehicle models. They also highlight underestimation of criticality and risk due to inadequacies in vehicle modeling, consideration of reaction times, and the interpretation of solitary SSMs with fixed but non-validated thresholds.
Typically, SSMs are categorized into two main classes: (I) SSMs for identifying individual conflicts and (II) SSM-based models for estimating crash risks or probabilities. Common sub-categories for (I) can be further divided into (i) time-based, (ii) deceleration-based, or (iii) energy-based, or combinations thereof. The time-based SSM we refer to hereafter in this work is the well-established Time to Collision (TTC) [
37], which is defined as:
with
d denoting the space gap and
being the speed difference between the leading and the following vehicles. Another representative deceleration-based SSM, denoted as the Deceleration Rate to Avoid Crash (DRAC), dates back to a concept introduced by [
38] (although not yet fully formalized as a metric in that paper). It is defined as:
For an energy-based SSM, we reference [
39] as an example, which presents an interesting, novel approach called ’extended delta-V’, which estimates the crash severity of potential conflicts. Since this work does not delve deeply into SSM-based models or other related approaches, we refer the interested reader to [
35,
36] for more comprehensive information. However, we want to allude to a few notable papers that helped us develop a feasible approach for our own case study (see
Section 3.3). In their study, ref. [
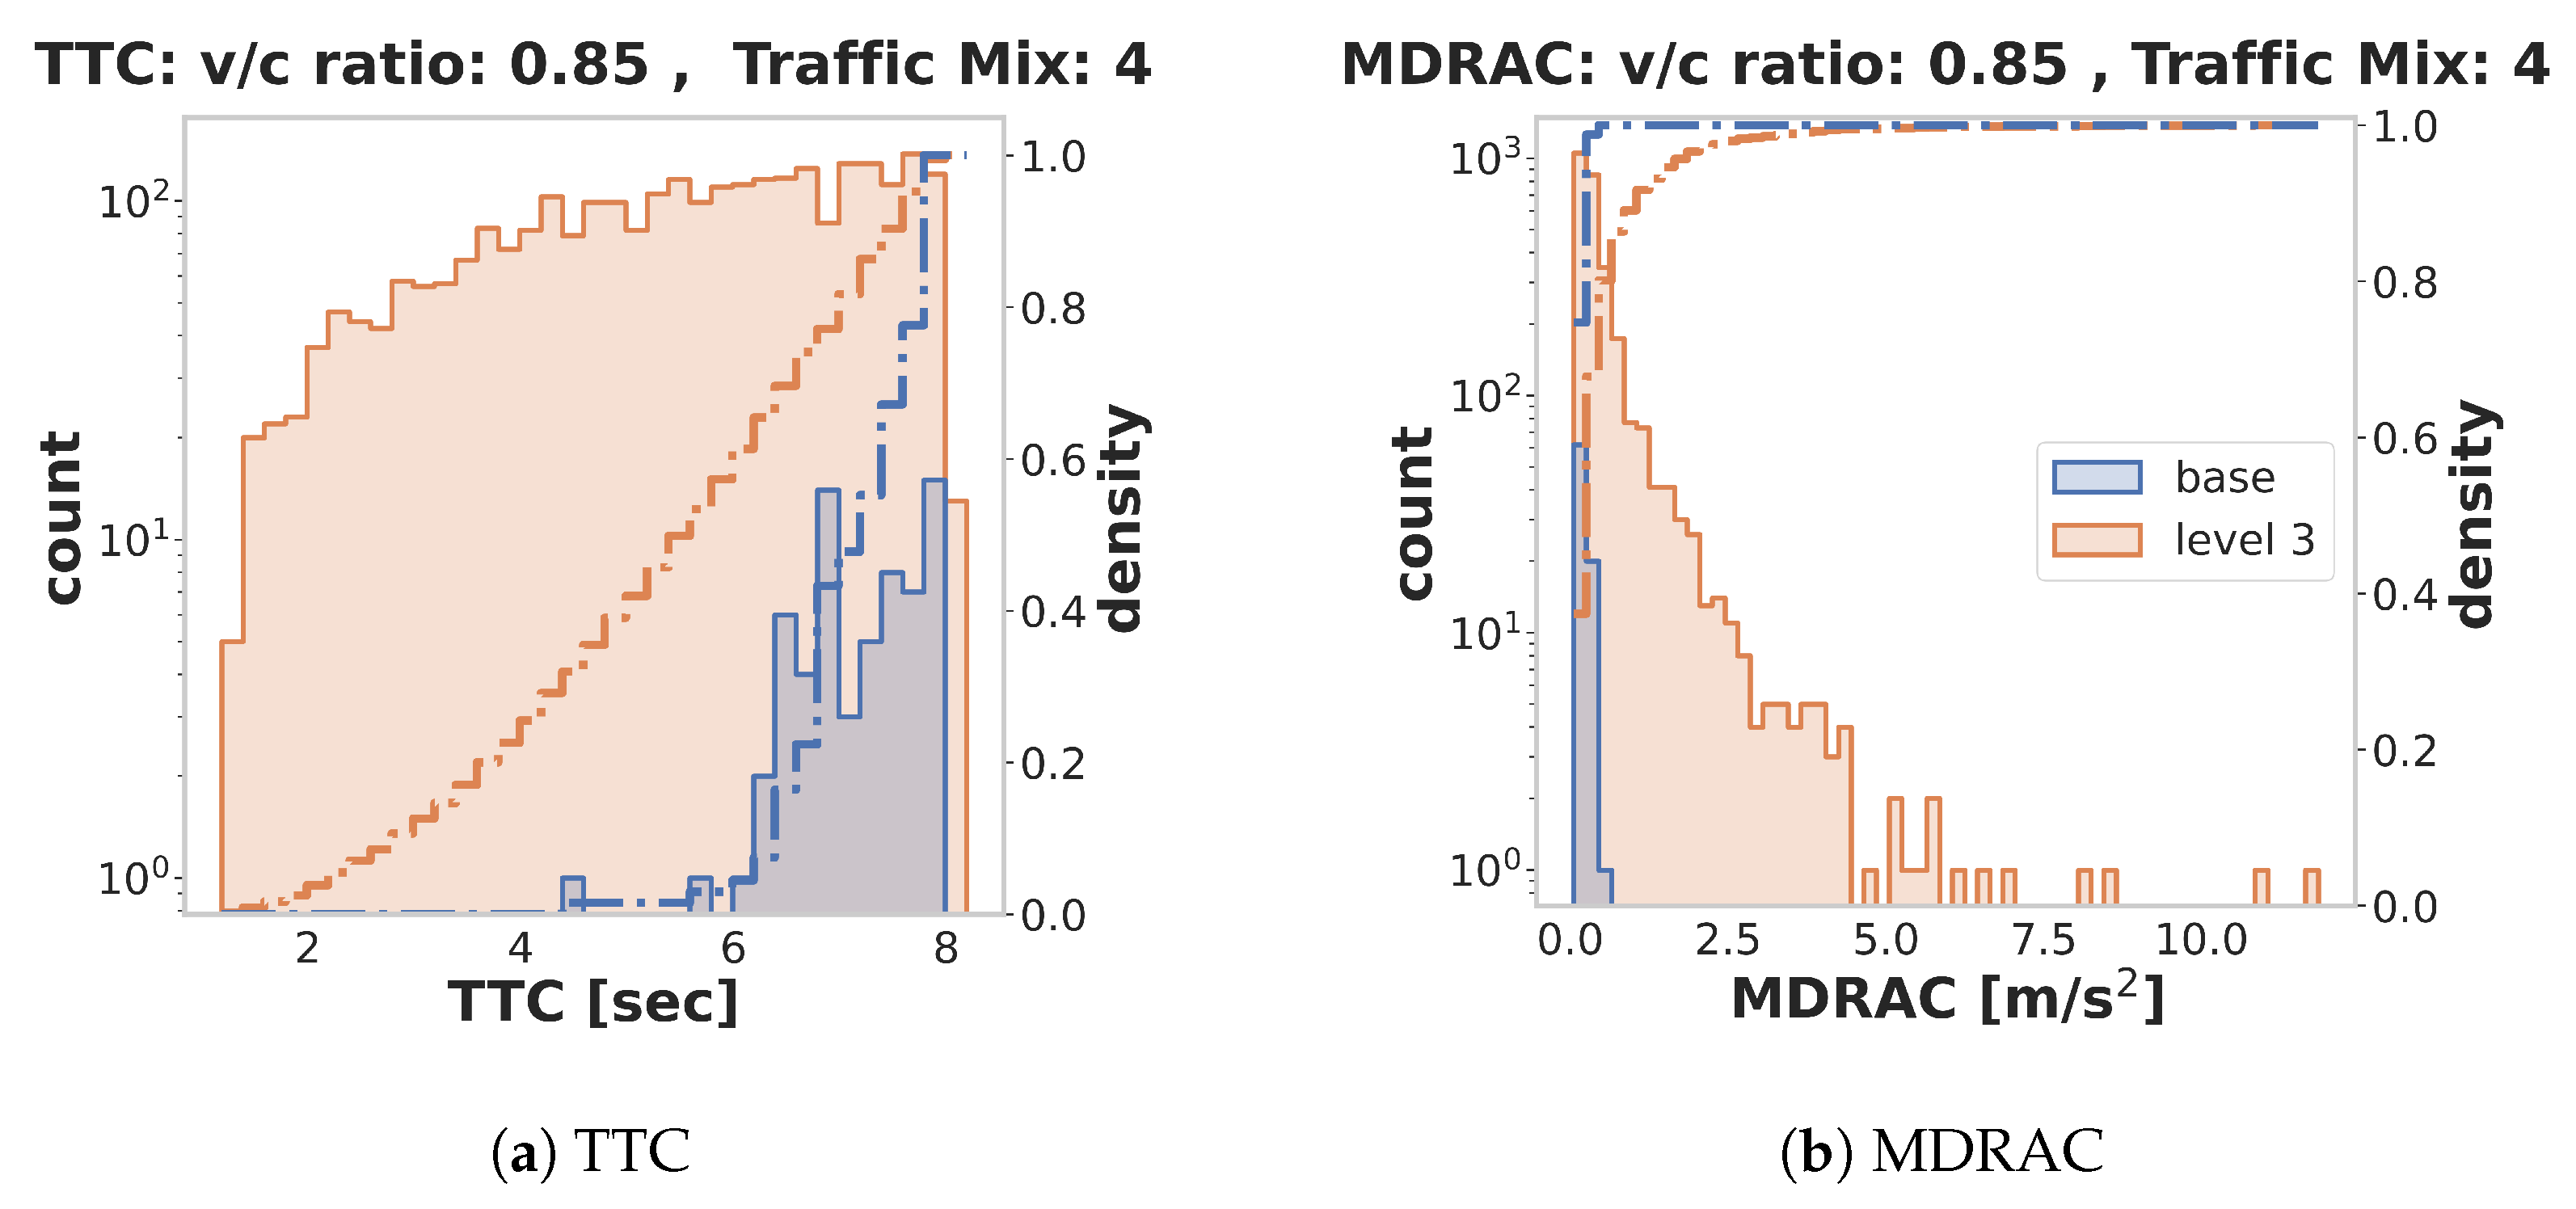
40] employed an approach for assessing the impact of connected automated vehicles on traffic safety by evaluating the distributions of TTCs rather than using a specific threshold for counting critical events. Even though their analysis is mostly descriptive, the histogram-based approach circumvents the utilization of non-validated criticality thresholds. Such so-called ’surrogate safety histograms’ (SSHs) have also been used for completely different contexts, i.e., analyzing traffic safety based on vehicle trajectories for individual vehicle conflicts, and has proved to be helpful for comparing TTC results for different conditions [
41,
42].
As pointed out by [
35,
36], the absence of human perception–reaction times (PRT) or response times (RT) is a noted concern. In response to this issue, we introduce the Modified Deceleration Rate to Avoid Crash (MDRAC), which was developed by [
43] as an enhancement over the traditional DRAC. The MDRAC takes into account a perception–reaction time (PRT) and is devised as follows:
When [
44] introduced their novel SSM, Deceleration Rate to Avoid a Crash using Constant Initial Acceleration (DCIA), they utilized the MDRAC for verification purposes. Their work inherently presented compelling data that underscored the superior sensitivity of the MDRAC compared to the traditional DRAC. (For their analysis, they used PRTs of 1.3 s and 2.02 s. We elaborate on our rationale for using a PRT of 1 s in
Section 3.3.) The DCIA model was developed with the aim of accounting for the relative acceleration between two vehicles. Similar considerations were also explored by [
45] but with a different analytical approach involving the design and introduction of a modified TTC, referred to as ‘MTTC’. Both publications emphasize the limited expressiveness of the TTC when considered individually, motivating them to develop SSMs that incorporate relative decelerations. In a thoroughly performed study, ref. [
46] validated bivariate SSM threshold pairs based on crash data, concluding that only a combination of conflict indicators can reliably estimate crashes. Their research also indicates that the DRAC, in particular, seems to systematically underestimate potential crash events.
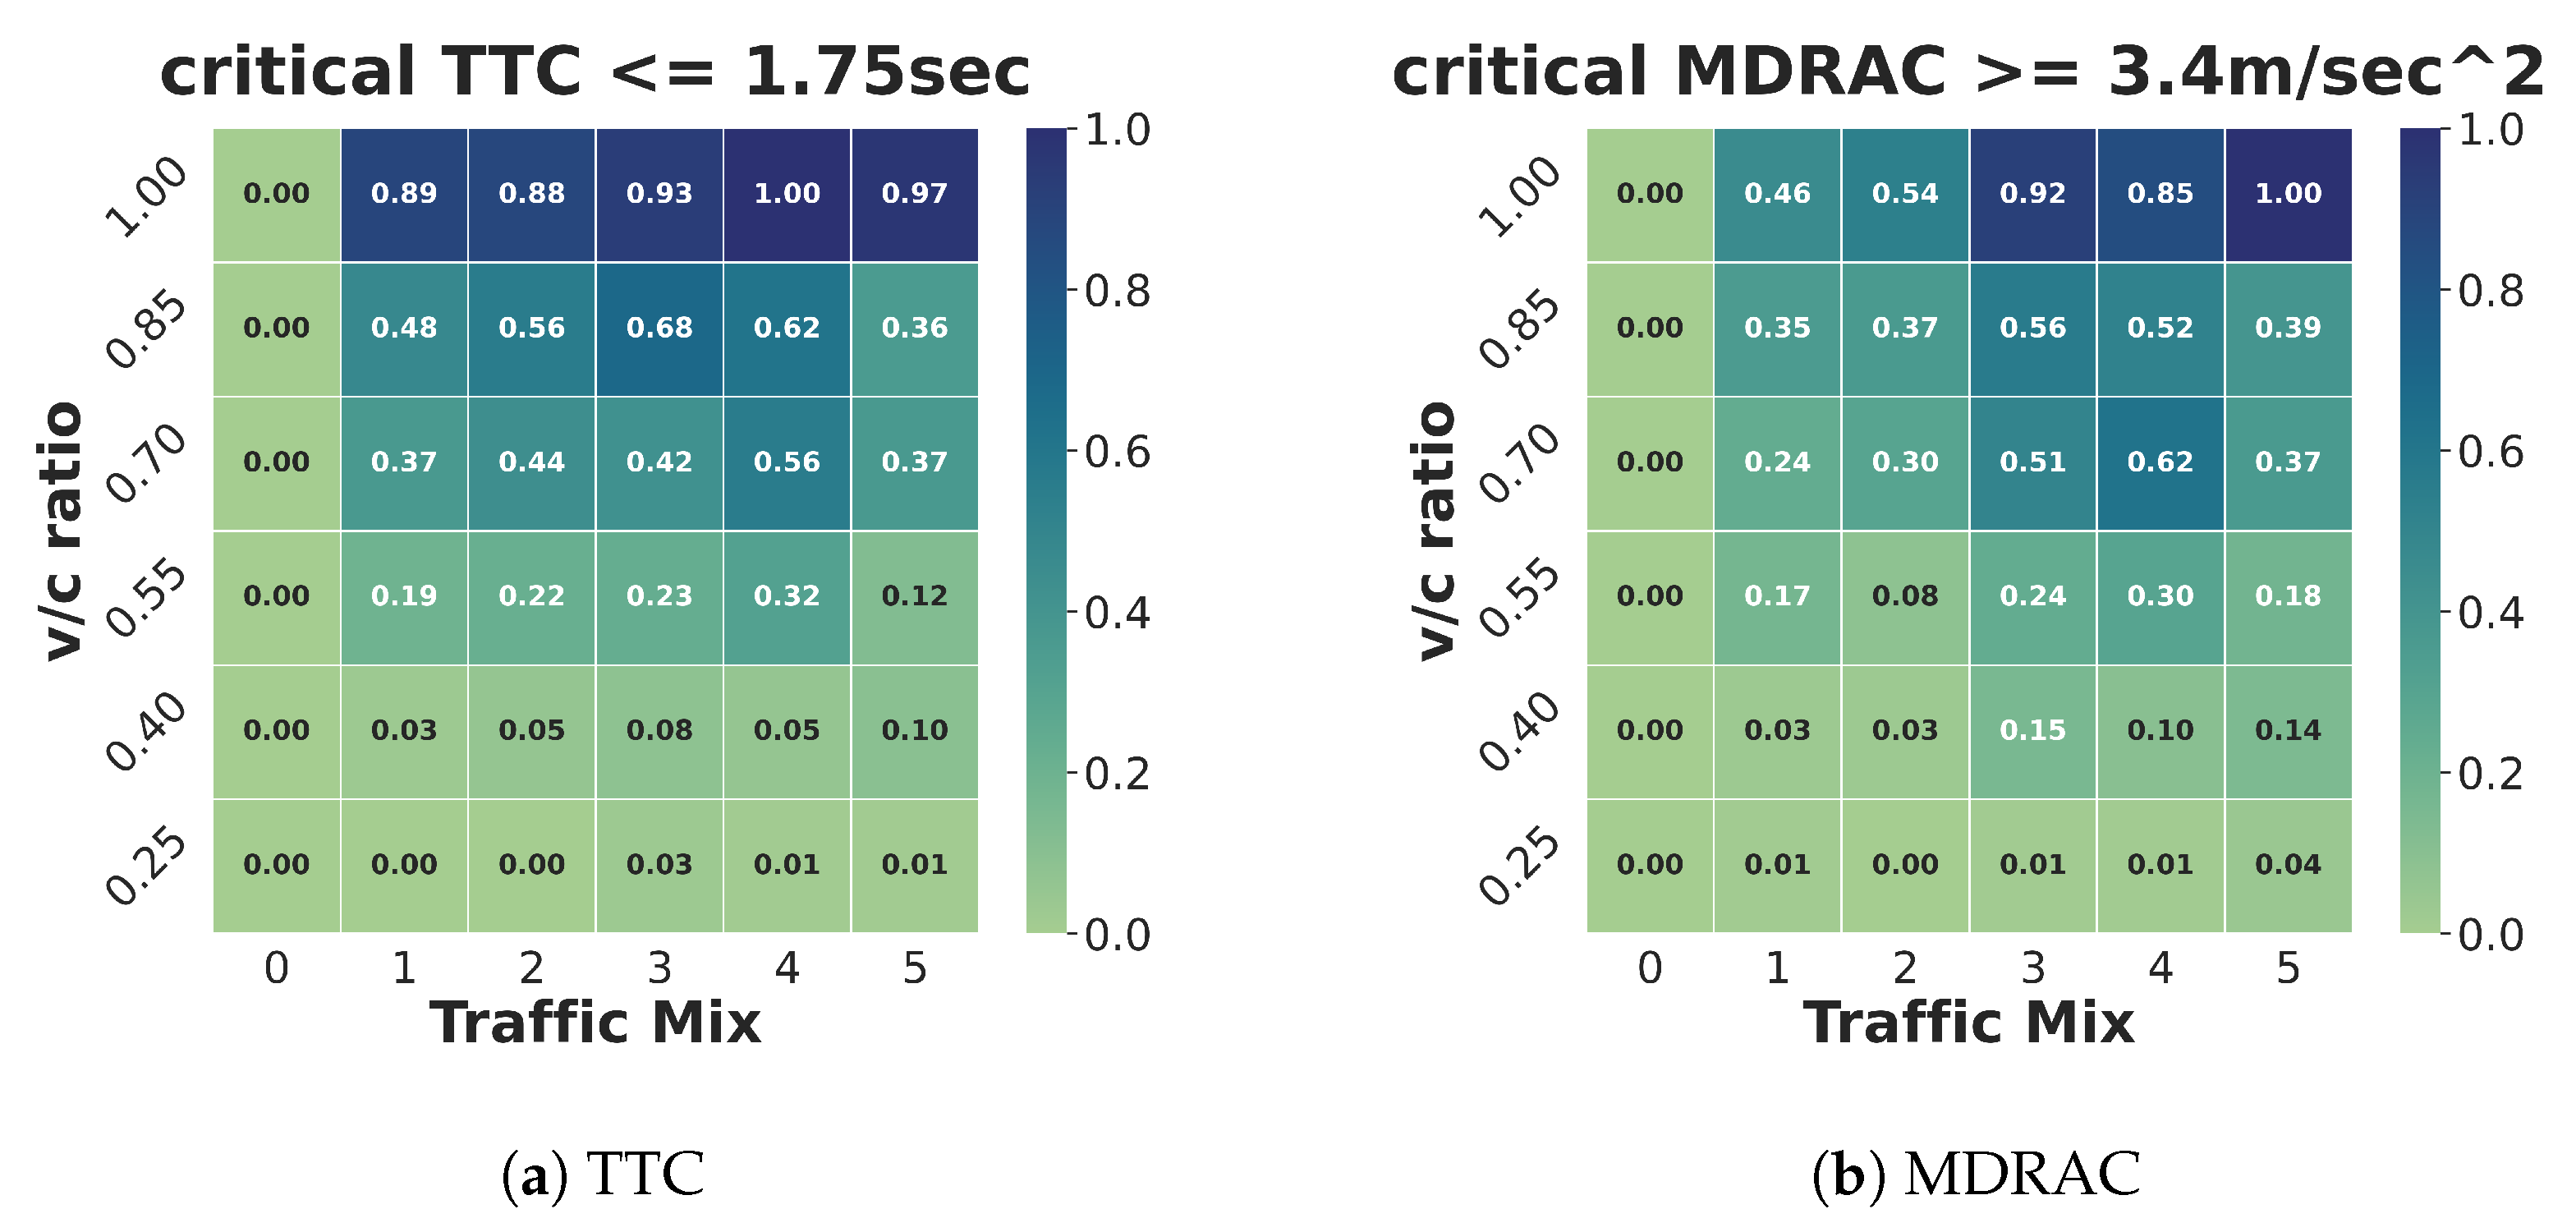
Taking into account the previously mentioned considerations, we utilize two SSMs in our subsequent safety analysis: (1) the TTC and (2) the MDRAC. In a scenario-based simulation study, we investigate safety implications of ToCs, as specified in the following sections.


