Article

Unusual Compositions of Fe-Nb Alloy Precipitates in Iron-Implanted LiNbO3

by
Almaz L. Zinnatullin
1,*,
Andrei V. Petrov
1,
Roman V. Yusupov
1,
Valerii F. Valeev
2,
Rustam I. Khaibullin
1,2 and
Farit G. Vagizov
1
1
Institute of Physics, Kazan Federal University, 420008 Kazan, Russia
2
Zavoisky Physical-Technical Institute, FRC Kazan Scientific Centre of RAS, 420029 Kazan, Russia
*
Author to whom correspondence should be addressed.
Magnetochemistry 2023, 9(5), 121; https://doi.org/10.3390/magnetochemistry9050121
Submission received: 10 February 2023 / Revised: 21 April 2023 / Accepted: 4 May 2023 / Published: 6 May 2023
(This article belongs to the Special Issue Phase Change Material and Magnetic Research)

Abstract

:
The results of a study of heavy implantation of a LiNbO3 crystal with iron ions are reported for the first time. The X-cut LiNbO3 substrate was implanted with 40-keV Fe+ ions to the fluence of 1.5·1017 ions/cm2. The sample reveals pronounced ferromagnetic properties at room temperature. However, the ferromagnetic response observed in the iron-implanted LiNbO3 differs from the magnetic behavior of other oxides implanted with iron ions under the same conditions. This difference occurs from the unusual magnetic phase composition of the implanted surface layer of the LiNbO3 in which the iron implant precipitates in the form of the nanoscale alloy of metallic iron with niobium. Based on Mössbauer spectroscopy data, we estimated the Nb content in the ion-synthesized nanosized alloy as ~12 at.%, which is much higher than the solid solubility limit of Nb in bulk Fe.

1. Introduction

LiNbO3 is a well-known ferroelectric oxide compound with a high Curie temperature of 1483 K. The ferroelectric properties are defined by the polar trigonal crystal structure of this material [1,2]. Due to excellent optical and piezoelectric characteristics, nowadays, lithium niobate finds a wide usage in various applications [3].
At the same time, fundamental studies on this material continue [4,5]. The major issue in this field is the addition of new properties to lithium niobate which are not characteristic for the virgin state of this compound. The introduction of ferromagnetic properties is one of the most promising among them. It is related to the long-standing search for materials possessing notable magnetoelectric coupling [6,7]. Such kinds of compounds are often called multiferroics [8,9]. The key feature of magnetoelectric materials is the possibility to drive magnetization via the external electric field and vice versa, i.e., electric polarization via the applied magnetic field. Based on magnetoelectric materials, new multifunctional devices may be developed [10]. However, only a limited number of single-phase materials possessing such properties are known today [11]. Furthermore, most multiferroic materials have antiferromagnetic ordering which makes them difficult to use.
One way to establish magnetoelectric properties is the growth ferromagnetic structures inside the ferroelectric materials [12,13]. Magnetoelectric coupling in such composite materials is possible via strain transfer through the interface between the ferroelectric host matrix and the ferromagnetic inclusion pieces. The strain induced in the ferroelectric host by the applied electric field places pressure on the ferromagnetic phase and compresses/stretches it. The deformation of the ferromagnetic part produces magnetization due to the inverse magnetostrictive effect [14].
For the synthesis of such ferroelectric–ferromagnetic composites, it is necessary to use methods that allow obtaining materials under certain conditions. These conditions are dictated by specific physical requirements. So, for example, the interface between the two phases mentioned above should be at the maximum to enhance the magnetoelectric effect. That requires a sufficiently high concentration of ferromagnetic nanoparticles inside the ferroelectric material. In addition, the composites must be nanosized, at least in thickness, to be used in nanoelectronic devices. Moreover, the synthesis methods must be manufacturable so that they can be easily integrated into electronic production.
The ion implantation technique is very promising for obtaining such nanocomposite materials [15]. The typical penetration depths of the relatively low-energy ions (<50 keV) implanted into oxide materials do not exceed 100 nm, except just a small part of the impurity diffused or channeled into the bulk [16]. The latter, however, usually form single paramagnetic centers and, consequently, do not significantly affect the magnetic properties of the materials. Under ion implantation, a high concentration of the implant can be achieved in the near-to-surface layer of a sample. If this concentration exceeds the solubility limit in the matrix, implanted ions precipitate, in certain cases magnetic nanoparticles in certain cases [17,18]. Composite multiferroics can be obtained following this route. Indeed, magnetoelectric coupling was observed in a cobalt-implanted BaTiO3 crystal where the metallic cobalt nanoparticles precipitated in the ferroelectric host [19].
The magnetic properties of such nanocomposite materials can be tuned by the implantation conditions, thus controlling the size and concentration of the precipitates. Another possible way to modify the magnetism of these materials is the formation of mixed-composition precipitates. Evident approaches to create alloyed precipitates are direct implantation into metals [20] or sequential implantation of the required metal ions [21,22]. One can suppose that such precipitates can also be created in the course of ion implantation to complex oxides, where some sorts of matrix cations may participate somehow in metallic precipitate formation. For example, one sort of matrix cation may be preferably “knocked out” from its sites, out-diffuse, and be sputtered from the irradiated near-to-surface layer, while other sorts reside. These non-stoichiometric matrix cations may be reduced to the metallic state and form solid solutions in precipitates based on the implanted impurity. We believe that this kind of scenario can be realized in double (and higher complexity) oxides containing light and heavy elements such as LiNbO3. Another peculiarity of ion implantation is its pronounced non-equilibrium character which may lead to violation of limits known for equilibrium-type syntheses.
There are only a limited number of works where the implantation of magnetic 3d-metal ions to LiNbO3 has been studied (see, for instance, Refs. [23,24,25,26,27,28,29]). To our knowledge, in these papers mostly the creation of substitution centers in the crystal structure of LiNbO3 was addressed, and the impurity concentration was insufficient for precipitation to nanoparticles in the irradiated layer. The observed bulk magnetic properties of the samples were analyzed in terms of electronic spin level splitting and the bound magnetic polarons model [23,28].
We have recently shown that implantation of a MgO crystal with a high dose of iron ions results in coherent growth of α-Fe nanoparticles in the matrix [30]. Here, we present a study of the LiNbO3 crystal implanted in a high dose of iron ions. To the best of our knowledge, heavy Fe-implantation to LiNbO3 has not been reported elsewhere. The results of the sample characterization by magnetometry and the conversion electron Mössbauer spectroscopy methods are presented. The peculiar magnetic properties of the sample are discussed, and they are mainly due to the formation of nanosized precipitates of Fe-Nb solid solution with unusually high Nb content of 12 at.%.

2. Experimental Part

A single-crystalline X-cut LiNbO3 substrate (epi-ready grade, MTI Corp., Richmond, CA, USA) was implanted with 40 keV Fe+ ions (enriched with 57Fe isotope to 40% content) to the fluence of 1.5·1017 ions/cm2 using an ILU-3 ion accelerator. The accelerated ions were implanted almost at a normal along the LiNbO3 surface plane. The substrate was kept at room temperature. The ion current density was maintained at ~8 μA/cm2 to prevent the sample surface from overheating. We will denote this sample as LiNbO3:Fe.
The morphology of the implanted surface was investigated by the scanning electron microscopy (SEM) technique using a Merlin (Carl Zeiss) microscope.
The bulk magnetic properties of the sample were studied with the vibrating sample magnetometry (VSM) option of the PPMS-9 system (Quantum Design).
The longitudinal magneto-optical Kerr effect (L-MOKE) measurements were performed with the experimental setup where the single-mode He-Ne laser (632.8 nm, maximal output power 0.5 W) was used. The emitted light was attenuated and focused on the investigated sample surface to the ~50 μm size spot. Then, the part of reflected from the sample light was collimated and divided into two orthogonally polarized components using the Wollaston prism that is oriented at π/4 angle relative to the polarization of the incident laser light. The intensities of these two components were detected using Si-photodiodes, and the difference signal which is proportional to the Kerr rotation angle was detected at a laser modulation frequency using the Signal Recovery SR7270 lock-in amplifier. The magnetic field was applied in the surface plane using the resistive electromagnet. The setup sensitivity was about 1 μrad.
The conversion electron Mössbauer studies (CEMS) were carried out at room temperature on the conventional spectrometer (WissEl Gmbh, Blieskastel, Germany) working in the constant acceleration mode using the RiKon-5 detector (WissEl Gmbh, Blieskastel, Germany). The 57Co(Rh) source (RITVERC, St Petersburg, Russia) with an activity of about 50 mCi was used. The velocity scale of the spectrometer was calibrated using the spectrum of thin α-Fe foil. The center shift values are reported relative to the room temperature α-Fe spectrum.
The grazing incidence X-ray diffraction study was performed using a Rigaku SmartLab diffractometer equipped with the Cu Kα radiation tube. The X-ray incidence angle was fixed at α = 0.5°, and the data were recorded in the deflection angles (2θ) range of 40°–70° with the step size of 0.2°.

3. Results and Discussion

The depth profile of the implanted LiNbO3 iron ions was simulated using TRIM code [31]. This profile is depicted by the red line in Figure 1. The shape of this profile is Gaussian, and the projected range of the ions is R p ¯ = 24 nm, while the straggling is Δ R p ¯ = 11 nm.
However, the surface sputtering processes are not considered within such simulations which is especially essential in the case of high-dose implantation. The calculated value of the surface sputtering coefficient was S = 1 at./ion, and the depth of the sputtered layer was estimated as 16 nm. Using the value of S, the depth profile of the iron ions may be recalculated using the equation where surface sputtering is considered [16]. The profile calculated this way is shown in Figure 1 by the green curve. The integral over this profile is 1.35·1017 ion/cm2, and this value is used after calculations as the resulting fluence.
The SEM image of the implanted sample surface is shown in Figure 2. The formation of a complex hole pattern was found as the result of implantation. The notable modification of surface morphology is characteristic of heavy implantation conditions, and even sponge-like structures could be observed [32,33]. The changes in the surface morphology are related to the kinetics of the ion beam-induced defects in the surface layer [32], which is especially pronounced under high-dose and high-energy ion implantation.
The bulk in-plane magnetic hysteresis loops of the sample recorded at 10 K (blue curve) and 300 K (red curve) are shown in Figure 3a. The sample shows a strong ferromagnetic response even at room temperature. The saturation magnetization at room temperature is 1.05 μB per implanted iron ion and the coercivity field is 580 Oe. Upon the decrease in temperature, these magnetic characteristics increase and are in the order of 1.2 μB/Fe below 50 K and 710 Oe at 10 K for saturation magnetization and the coercivity field, respectively (Figure 3b).
The room temperature L-MOKE hysteresis loops measured at multiple points of the implanted LiNbO3:Fe sample are shown in Figure 4. The shapes of the loops are near-identical and may be characterized by the coercivity value of ~680 Oe. The Kerr rotation angles corresponding to the saturation magnetization are also nearly the same at ~1.13 mrad. This indicates that the magnetic properties are homogenous over the implanted surface. The shapes of the VSM-measured hysteresis loop and the one obtained by the L-MOKE are almost identical as well (see the inset to Figure 4). However, the coercivity value obtained by the L-MOKE measurements is slightly larger than the value from the VSM. The same result was earlier reported for a Ni-Mn-Ga alloy and was related to the branching and pinning of fine magnetic domains at the surface [34]. A similar difference was reported for Fe-implanted ZnO film and was related to the surface and bulk sensitivities of MOKE and VSM techniques, respectively [35].
The zero-field-cooled (ZFC) and field-cooled (FC) magnetization curves of the LiNbO3:Fe sample are shown in Figure 5 with blue and red curves, respectively. During both these measurements and cooling before recording the FC curve, the magnetic field of 200 Oe was applied. Clearly, an anomaly at ~60 K is observed in these curves. This feature is intrinsic to the studied sample. Its temperature is very close to the Curie temperature of the Laves Fe2Nb phases with the Nb content of about 32 at.% [36]. Therefore, we relate the MT curve anomaly at ~60 K in Figure 5 to the magnetic ordering in some Laves Fe2Nb precipitated phase(s). The observed transition looks complex since, on cooling, the magnetization of the sample initially reduces and increases again afterward. Such non-trivial behavior may also be associated with Fe2Nb-like phases. Indeed, the Fe2Nb can be stabilized in a wide range of compositions, namely, with iron atoms content from 58 at.% to 78 at.% [37]. The magnetic phase diagram of this compound is rather complex and contains paramagnetic, ferromagnetic, antiferromagnetic, and even mixed magnetically ordered states [38]. Therefore, the observed non-trivial behavior of the magnetization at ~60 K originates most probably from various types of magnetic ordering in the off-stoichiometric Fe2Nb precipitates.
The magnetic properties of the LiNbO3:Fe sample differ from other oxides implanted with Fe ions in the same conditions. For example, we earlier reported that a MgO single crystal implanted with Fe ions under the same conditions also shows a ferromagnetic response at room temperature [26]. However, lower values for the coercivity field (~170 Oe at RT) and saturation magnetization (~0.8 μB/Fe at RT) were observed for the MgO:Fe films.
We performed Mössbauer effect studies to determine the features of the magnetic phase composition of the studied sample. The conversion electron Mössbauer spectrum of the LiNbO3:Fe sample recorded at room temperature is shown in Figure 6. The studied depth during CEMS measurements is in order of 100 nm; therefore, it is sufficient to investigate the iron-modified layer of the sample. The spectrum was fitted within the three components, namely, two doublets corresponding to the paramagnetic iron ions and one magnetically ordered component with a complex shape. The hyperfine parameters of these components are listed in Table 1.
According to the Fe-Nb phase diagram, these two metals may form two stoichiometric compounds, namely Fe21Nb19 and Fe2Nb [39]. However, the components with hyperfine parameters characteristic of these compounds [40] were not observed in our Mössbauer spectrum. As was noted above, the traces of magnetic ordering inherent to the Laves Fe2Nb compound were revealed in the magnetization curves. We suppose that the inhomogeneity and low content of Fe2Nb-like phases may lead to the broadening of the corresponding components in the Mössbauer spectrum and, consequently, to the vanishing spectral area of them.
The hyperfine parameters of the doublets, denoted as “Doublet-I” and “Doublet-II”, are characteristic of the high-spin ferrous and ferric ions in the octahedral oxygen environment, respectively. We suppose that the Fe2+ ions substitute the Li+ cationic sites, and the Fe3+ ions substitute the Nb5+ ones. Both sites have distorted octahedral oxygen coordination with the C3 symmetry. Such assignment of the impurity ions to the sites is based, first, on closeness of the ionic radii of the Li+ (0.76 Å)/Fe2+ (0.78 Å) and Nb5+ (0.64 Å)/Fe3+ (0.645 Å) ions in the 6-fold oxygen coordination [41]. Thus, the ionic radii satisfy the classic 15% size rule of isomorphism. Second, such substitution results in a minimal charge imbalance, and one oxygen vacancy is sufficient to compensate for an excess negative charge of two impurity pairs.
This specification of iron ions by sites is also consistent with Ref. [42], where 57Co and 57Fe impurities in LiNbO3 were studied by means of Mössbauer spectroscopy. The authors of the work [42] reveal two components in the spectra. The first component, the doublet with the center shift of 1.054 mm/s and quadrupole splitting of 1.743 mm/s, was related to the ferrous ions in the Li+ crystal sites. The second component had a complex line shape due to the manifestation of the slow paramagnetic relaxation phenomenon. The center shift of these components is at 0.37 mm/s, and it was associated with ferric ions in the Nb5+ cationic sites.
The hyperfine parameters revealed in our work differ somewhat from the data of Ref. [42]. Moreover, we did not observe the slow Fe3+ relaxation in our spectrum. A large concentration of radiation defects and, consequently, low crystallinity in the ion-damaged region may be the possible reasons for these differences. In our case, the high concentration of iron impurity was achieved in the implanted region. A high concentration of iron ions may also be responsible for the differences in the Mössbauer hyperfine parameters.
The third component revealed in our Mössbauer spectrum has a complex line shape due to the distribution of hyperfine magnetic fields on the 57Fe nuclei. This component has a center shift close to zero relative to α-Fe at room temperature (Table 1). Therefore, we suppose that one is associated with iron atoms in the metallic state. The quadrupole splitting is also negligible. This indicates the absence of an electric field gradient on the 57Fe nuclei and, consequently, a high symmetry of the local environment of iron atoms. For this component, the magnitude of the magnetic hyperfine splitting is close to the value characteristic for the bcc-Fe (330 kOe at RT). However, for this component, absorption is observed also in the regions corresponding to iron nuclei with reduced values of the hyperfine magnetic field. The reduction in the hyperfine magnetic fields may be associated with the introduction of niobium impurity into the metallic iron phase. Indeed, in Ref. [43] it was reported that the appearance of one Nb atom in the local environment of iron ions reduces the hyperfine magnetic field at the 57Fe nucleus by 35.5 kOe, and by 23 kOe in the case of the appearance of a niobium atom in the next nearest neighboring position. It has also been noted that the influence of several impurity atoms may be considered as the algebraic sum of each Nb atom’s effects by itself. Niobium atoms in the more distant sites have no significant effect on the hyperfine magnetic field. Almost the same results were obtained during the calculation of magnetic moments of Nb impurity and the neighboring iron atoms in bcc-Fe [44]. It was calculated that Nb impurity atoms in bcc-Fe have a negative magnetic moment (−0.46 μB), and the impurity reduces magnetic moments of iron atoms in the first coordination shell on 0.21 μB. The effect of Nb on the more distant iron atoms (the second coordination shell and beyond) was reported to be significantly less. The alloy formation was also observed at the interfaces of Fe-Nb multilayers [45].
The magnetically ordered part of the Mössbauer spectrum was processed considering the stochastic distribution of the niobium impurity in the bcc-structured iron [46]. It was suggested that the Nb impurities additively affect the iron atoms. The influence on the hyperfine magnetic fields of the 57Fe nuclei in the second shell was neglected. In this case, the magnetically ordered part is the sum of the nine sextets corresponding to the various number of Nb atoms in the first coordination shell of the iron atom (the coordination number for the bcc structure is 8). The hyperfine field of the sextets linearly decreases with the increase in the number of Nb atoms, and the relative areas of these sextets are defined by the binomial coefficients:
p = C C N n f n 1 f C N n = C N ! n ! C N n ! f n 1 f C N n .
where n—number of Nb atoms in the first shell around the iron atom, CN—coordination number, and f—the probability of the substitution of the Fe site by Nb. The latter equals the Nb concentration. The center shifts and quadrupole splitting values of these sextets were bonded to each other. The experimental spectrum was reliably fitted using this model. The resulting shape of the magnetically ordered component is depicted in Figure 6 by the light green curve. The estimated value of probability f is 0.119(2), i.e., the niobium impurity concentration in the bcc-Fe is ~12%. The hyperfine magnetic field corresponding to the subcomponent with the maximal splitting was found as 332.9(4) kOe. The effect of the Nb atom in the first shell on the hyperfine magnetic field was found to be −31.4(4) kOe, which corresponds to the decrease in the iron magnetic moment on ~0.21 μB. Thus, the obtained result is consistent with the data in Refs. [35,36].
The hyperfine magnetic field distribution may be also mathematically reconstructed during spectrum processing using the SpectrRelax 2.1 software [47]. This reconstructed distribution (green curve) as well as the relative intensities of the sextets in the used binomial distribution (red bars) are plotted in Figure 7. It is seen that the positions of the red bars corresponding to the hyperfine field magnitudes of the sextets in the binomial distribution match the maximums in the reconstructed distribution well except just the lowest intensity bars associated with four and more Nb atoms in the first shell around the Fe atom. This fact also supports the right choice of the used fitting model.
It is known that the relative areas of sextets’ lines in Mössbauer spectra depend on the angle between the incident γ-ray and the magnetization directions [48]. In our case, the areas are related as 3:4:1:1:4:3. Since in the experimental conditions γ-photons were incident by the normal to the implanted plane, this relation shows that the magnetization lies in the surface plane. Consequently, the studied sample shows easy-plane magnetic anisotropy, which is characteristic of thin magnetic films.
The estimated value of Nb concentration, 12 at.%, is markedly higher than the bulk solubility limit of the Nb in Fe, which is less than 1 at.% according to the Fe-Nb phase diagram [39], and is not higher than the experimental solid solution saturation value, 2.3 at.%, obtained for an arc-melted material [43]. We suppose that the stabilization of such a high Nb content in the iron in our sample is related, first, to the small size of the precipitated particles. Enhancement of the solid solubility in binary alloy particles with a decrease in their size was reported in Refs. [49,50,51,52,53,54]. Indeed, high-dose implantation leads to the formation of nanoparticles/nanoclusters of secondary phases in the damaged region [15]. Typically, these particles have a near-spherical shape. A decrease in size leads to an increase in the surface-to-volume ratio. Consequently, for finely dispersed nanoparticles, surface-free energy has a significant influence on some characteristics of materials, including solid solubility limits [51]. The second possible reason for such an unexpectedly high niobium content is associated with the synthesis method. In fact, ion implantation is a strongly non-equilibrium process. Therefore, even supersaturated solid solutions may form, and precipitation of Fe-Nb nanoparticles with high Nb content is also possible.
The formation of the Fe-Nb precipitates was also detected in the grazing incidence X-ray diffraction pattern (Figure 8). There are two reflexes in the pattern that are attributed to the Bragg reflections from the crystallites with the body-centered cubic structure and the lattice parameter of a = 0.2894(6) nm. This value is similar but notably larger than that of the bcc-Fe (a = 0.28664 nm). Such an expansion of the iron crystal lattice should be related to the incorporation of the niobium atoms into the iron host. Thus, the collected XRD results support our finding of the Fe-Nb precipitates formation from the Mössbauer spectroscopy. Moreover, the broadening of the reflexes is, most likely, due to the formation of solid solution precipitates with the random distribution of solute atom (Nb) in the solvent (Fe) matrix and the small size of the precipitate phase crystallites. Observation of both the (110) and (002) diffraction maxima with the intensities well-fitting the predictions of the powder XRD pattern indicate the random orientation of the precipitate’s crystal axes inside the LiNbO3 host.
We consider the following mechanism of the Fe-Nb nanoparticle precipitation. It was reported that ion implantation to LiNbO3 leads to the formation of Li-depleted regions at the surface [52]. Therefore, the stoichiometry of lithium niobate is violated in this region. We suppose that a part of the excess niobium may dynamically diffuse into the iron precipitates under intense irradiation conditions. As we have learned from the Mössabuer spectra, some of the implanted Fe+ ions are oxidized to the Fe2+ and Fe3+ states. This provides a route for the reduction of the nominal Nb5+ ions to the metallic state in the LiNbO3 crystal in the course of Fe implantation.
The Nb impurity in iron may explain the other features of the sample under study as well. The value of the hyperfine magnetic field for the maximally split component (333 kOe), which is associated with iron atoms without the niobium atoms in the first shell, is somewhat higher than for the α-Fe (330 kOe). Previously, in Ref. [44] it was reported that Nb impurity has a slight positive effect on the magnetic moments of iron atoms in its third coordination sphere and beyond. Thus, some parts of the iron may be perturbed by distant niobium atoms leading to an increase in the magnetic moment and, consequently, a hyperfine magnetic field at the nuclei. Moreover, the introduction of larger niobium atoms should lead to an expansion of the bcc-Fe lattice. The lattice expansion also increases the magnetic moment [55].
Since the precipitates in the implanted region may be considered as essentially single-domain particles, the magnetization reversal process in them is not defined by the domain wall dynamics but is governed by the magnetocrystalline anisotropy. For single-domain α-Fe particles, the maximum value of the coercive field is ~540 Oe [56]. The observed coercivity of the LiNbO3:Fe sample exceeds this value. For cubic crystals, the coercive field may be considered as:
H C K 1 M S
where K1—the first order magnetocrystalline anisotropy and MS—saturation magnetization. Thus, there are two ways to increase the coercive field, namely a reduction in MS and an increase in K1.
As was shown above, the magnetic moments of iron atoms in the vicinity of the niobium impurities are decreased, and, consequently, the magnetization of the whole magnetic system is also reduced. The mean value of the hyperfine magnetic field of the magnetically ordered component was estimated as 303 kOe and, consequently, the mean magnetic moment is 2.02 μB/Fe instead of 2.2 μB/Fe for α-Fe. Such a decrease in the magnetization can little increase the coercivity but may not be sufficient for interpretation. Furthermore, magnetization typically raises under crystal lattice expansion which is driven by the introduction of larger Nb atoms in bcc-Fe in our case.
Niobium content can affect magnetocrystalline anisotropy as well. Indeed, the magnetocrystalline anisotropy is determined by spin-orbit coupling, which is raised with the atomic number and, consequently, it is not so high in cubic 3d metals. One is the reason for the relatively low magnitude of the coercive fields of these materials [57]. The addition of heavier niobium atoms may enhance the spin-orbit coupling in the system. Moreover, lattice expansion also leads to some increase in magnetocrystalline anisotropy.

4. Conclusions

We have investigated a LiNbO3 single crystal implanted with 40 keV iron ions to the fluence of 1.5·1017 ions/cm2. The magnetic properties of the sample were characterized by both the bulk (magnetometry) and microscopic (conversion electron Mössbauer spectroscopy) methods. The formation of unusual nanosized Fe-Nb solid solution precipitates and traces of Fe2Nb phases were revealed. The Fe-Nb precipitates are responsible for the bulk ferromagnetic properties of the studied sample at room temperature. In our sample, the concentration of niobium impurity reaches 12 at.% which is notably higher than its bulk solid solubility limit. We show that this impurity, on the one hand, reduces the saturation magnetization of the sample, and, on the other hand, increases the coercive field of the magnetic system.

Author Contributions

Conceptualization, A.L.Z., R.I.K. and F.G.V.; methodology, A.L.Z., R.I.K. and F.G.V.; formal analysis, A.L.Z., R.I.K. and F.G.V.; investigation, A.L.Z., A.V.P., V.F.V., R.V.Y., R.I.K. and F.G.V.; resources, R.I.K. and F.G.V.; writing—original draft preparation, A.L.Z., R.V.Y. and F.G.V.; writing—review and editing, A.L.Z., R.V.Y., R.I.K. and F.G.V.; visualization, A.L.Z. and F.G.V.; supervision, R.I.K. and F.G.V. All authors have read and agreed to the published version of the manuscript.

Funding

The reported study was funded by RFBR, project number 20-32-90165 (Mössbauer effect and magnetometry studies, A.L.Z.).

Institutional Review Board Statement

Not applicable.

Informed Consent Statement

Not applicable.

Data Availability Statement

The data presented in this study are available upon request from the corresponding author. The data are not publicly available due to privacy restrictions.

Acknowledgments

The work of A.V.P., R.V.Y. and R.I.K. was supported by the Kazan Federal University Strategic Academic Leadership Program (PRIORITY-2030) (ion implantation, L-MOKE studies). The electron microscopy images were obtained at the Interdisciplinary Centre for Analytical Microscopy of Kazan Federal University.

Conflicts of Interest

The authors declare no conflict of interest. The funders had no role in the design of the study; in the collection, analysis, or interpretation of data; in the writing of the manuscript; or in the decision to publish the results.

References

  1. Wong, K.K. (Ed.) Properties of Lithium Niobate. In EMIS Datareviews Series No 28; Institution of Engineering and Technology: Stevenage, UK, 2002. [Google Scholar]
  2. Adachi, M.; Akishige, Y.; Asahi, T.; Deguchi, K.; Gesi, K.; Hasebe, K.; Hikita, T.; Ikeda, T.; Iwata, Y.; Komukae, M.; et al. LiNbO3. In Landolt-Börnstein—Group III Condensed Matter; Shiozaki, Y., Nakamura, E., Mitsui, T., Eds.; Springer: Berlin/Heidelberg, Germany, 2001; Volume 36A2. [Google Scholar] [CrossRef]
  3. Boes, A.; Chang, L.; Langrock, C.; Yu, M.; Zhang, M.; Lin, Q.; Lončar, M.; Fejer, M.; Bowers, J.; Mitchell, A. Lithium Niobate Photonics: Unlocking the Electromagnetic Spectrum. Science 2023, 379, eabj4396. [Google Scholar] [CrossRef] [PubMed]
  4. Sánchez-Dena, O.; Fierro-Ruiz, C.D.; Villalobos-Mendoza, S.D.; Carrillo Flores, D.M.; Elizalde-Galindo, J.T.; Farías, R. Lithium Niobate Single Crystals and Powders Reviewed—Part I. Crystals 2020, 10, 973. [Google Scholar] [CrossRef]
  5. Sánchez-Dena, O.; Villalobos-Mendoza, S.D.; Farías, R.; Fierro-Ruiz, C.D. Lithium Niobate Single Crystals and Powders Reviewed—Part II. Crystals 2020, 10, 990. [Google Scholar] [CrossRef]
  6. Song, C.; Wang, C.; Liu, X.; Zeng, F.; Pan, F. Room Temperature Ferromagnetism in Cobalt-Doped LiNbO3 Single Crystalline Films. Cryst. Growth Des. 2009, 9, 1235–1239. [Google Scholar] [CrossRef]
  7. Ye, J.; Sun, X.; Wu, Z.; Liu, J.; An, Y. Evidence of the Oxygen Vacancies-Induced Room Temperature Ferromagnetism in Multiferroic Co-Doped LiNbO3 Films. J. Alloy. Compd. 2018, 768, 750–755. [Google Scholar] [CrossRef]
  8. Algueró, M.; Gregg, J.M.; Mitoseriu, L. (Eds.) Nanoscale Ferroelectrics and Multiferroics; Wiley: Chichester, UK, 2016. [Google Scholar] [CrossRef]
  9. Khomskii, D. Classifying Multiferroics: Mechanisms and Effects. Physics 2009, 2, 20. [Google Scholar] [CrossRef]
  10. Wang, J. (Ed.) Multiferroic Materials: Properties, Techniques, and Applications, 1st ed.; CRC Press: Boca Raton, FL, USA, 2016. [Google Scholar] [CrossRef]
  11. Hill, N.A. Why Are There so Few Magnetic Ferroelectrics? J. Phys. Chem. B 2000, 104, 6694–6709. [Google Scholar] [CrossRef]
  12. Spaldin, N.A.; Ramesh, R. Advances in Magnetoelectric Multiferroics. Nat. Mater. 2019, 18, 203–212. [Google Scholar] [CrossRef]
  13. Pascual-Gonzalez, C.; Schileo, G.; Feteira, A. Single-Phase, Composite and Laminate Multiferroics. Magn. Ferroelectr. Multiferroic Met. Oxides 2018, 457–484. [Google Scholar] [CrossRef]
  14. Wang, Y.; Hu, J.; Lin, Y.; Nan, C.-W. Multiferroic Magnetoelectric Composite Nanostructures. NPG Asia Mater. 2010, 2, 61–68. [Google Scholar] [CrossRef]
  15. Stepanov, A.L.; Khaibullin, I.B. Fabrication of Metal Nanoparticles in Sapphire by Low-energy Ion Implantation. Rev. Adv. Mater. Sci. 2005, 9, 109–129. [Google Scholar]
  16. Ryssel, H.; Ruge, I. Ionenimplantation; Teubner: Stuttgart, Germany, 1978; 366p. [Google Scholar]
  17. Chen, F.; Amekura, H.; Jia, Y. Ion Irradiation of Dielectrics for Photonic Applications; Springer: Singapore, 2020. [Google Scholar] [CrossRef]
  18. Stepanov, A.L.; Khaibullin, R.I. Optics of Metal Nanoparticles Fabricated in Organic Matrix by Ion Implantation. Rev. Adv. Mater. Sci. 2004, 7, 108–125. [Google Scholar]
  19. Kazan, S.; Mikailzade, F.A.; Şale, A.G.; Maksutoğlu, M.; Acikgoz, M.; Khaibullin, R.I.; Khalitov, N.I.; Gatiiatova, J.I.; Valeev, V.F. Magnetic Properties of Co-implanted BaTiO3 Perovskite Crystal. Phys. Rev. B 2010, 82, 054402. [Google Scholar] [CrossRef]
  20. Thackery, P.A.; Nelson, R.S. The Formation of Precipitate Phases in Aluminium by Ion Implantation. Philos. Mag. 1969, 19, 169–180. [Google Scholar] [CrossRef]
  21. Wang, J.; Zhang, L.; Zhang, X.; Shen, Y.; Liu, C. Synthesis, Thermal Evolution and Optical Properties of CuZn Alloy Nanoparticles in SiO2 Sequentially Implanted with Dual Ions. J. Alloy. Compd. 2013, 549, 231–237. [Google Scholar] [CrossRef]
  22. Wang, Y.; Niu, Y.; Wang, G.; Sun, Y.; Liu, C. Enhanced Nonlinear Optical Properties of LiNbO3 Crystal Embedded with CuZn Alloy Nanoparticles by Ion Implantation. J. Alloys Compd. 2019, 778, 691–698. [Google Scholar] [CrossRef]
  23. Song, C.; Zeng, F.; Shen, Y.X.; Geng, K.W.; Xie, Y.N.; Wu, Z.Y.; Pan, F. Local Co Structure and Ferromagnetism in Ion-Implanted Co-Doped LiNbO3. Phys. Rev. B 2006, 73, 172412. [Google Scholar] [CrossRef]
  24. Li, S.; Li, D.; Li, S.; Wang, G.; Sun, X.; Xu, L.; Yuan, H. Local Structure and Room Ferromagnetism of Fe-Doped LiNbO3 Films. J. Supercond. Nov. Magn. 2022, 35, 2897–2902. [Google Scholar] [CrossRef]
  25. Sheng, P.; Zeng, F.; Tang, G.S.; Pan, F.; Yan, W.S.; Hu, F.C. Structure and Ferromagnetism in Vanadium-Doped LiNbO3. J. Appl. Phys. 2012, 112, 033913. [Google Scholar] [CrossRef]
  26. White, C.W.; McHargue, C.J.; Sklad, P.S.; Boatner, L.A.; Farlow, G.C. Ion Implantation and Annealing of Crystalline Oxides. Mater. Sci. Rep. 1989, 4, 41–146. [Google Scholar] [CrossRef]
  27. Zhou, X.; Wang, E.; Lao, X.; Wang, Y.; Yuan, H. Oxygen Vacancy Mediated Room Temperature Ferromagnetism in Cu-Doped LiNbO3 Thin Films. J. Magn. Magn. Mater. 2021, 527, 167775. [Google Scholar] [CrossRef]
  28. Zeng, F.; Sheng, P.; Tang, G.S.; Pan, F.; Yan, W.S.; Hu, F.C.; Zou, Y.; Huang, Y.Y.; Jiang, Z.; Guo, D. Electronic Structure and Magnetism of Fe-Doped LiNbO3. Mater. Chem. Phys. 2012, 136, 783–788. [Google Scholar] [CrossRef]
  29. Chen, C.; Zeng, F.; Li, J.H.; Sheng, P.; Luo, J.T.; Yang, Y.C.; Pan, F.; Zou, Y.; Huang, Y.Y.; Jiang, Z. Strong d–d Electron Interaction Inducing Ferromagnetism in Mn-Doped LiNbO3. Thin Solid Film. 2011, 520, 764–768. [Google Scholar] [CrossRef]
  30. Zinnatullin, A.L.; Gabbasov, B.F.; Lyadov, N.M.; Yusupov, R.V.; Khaibullin, R.I.; Vagizov, F.G. Endotaxial α-Fe Nanoparticles in the High-Fluence Iron-Implanted Single-Crystal MgO. Crystals 2022, 12, 1095. [Google Scholar] [CrossRef]
  31. Ziegler, J.F.; Ziegler, M.D.; Biersack, J.P. SRIM—The Stopping and Range of Ions in Matter (2010). Nucl. Instrum. Methods Phys. Res. Sect. B Beam Interact. Mater. At. 2010, 268, 1818–1823. [Google Scholar] [CrossRef]
  32. Böttger, R.; Heinig, K.-H.; Bischoff, L.; Liedke, B.; Facsko, S. From holes to sponge at irradiated Ge surfaces with increasing ion energy—an effect of defect kinetics? Appl. Phys. A 2013, 113, 53–59. [Google Scholar] [CrossRef]
  33. Stepanov, A.L.; Farrakhov, B.F.; Fattakhov, Y.V.; Rogov, A.M.; Konovalov, D.A.; Nuzhdin, V.I.; Valeev, V.F. Incoherent-Light Pulse Annealing of Nanoporous Germanium Layers Formed by Ion Implantation. Vacuum 2021, 186, 110060. [Google Scholar] [CrossRef]
  34. Veis, M.; Beran, L.; Zahradnik, M.; Antos, R.; Straka, L.; Kopecek, J.; Fekete, L.; Heczko, O. Magneto-Optical Spectroscopy of Ferromagnetic Shape-Memory Ni-Mn-Ga Alloy. J. Appl. Phys. 2014, 115, 17A936. [Google Scholar] [CrossRef]
  35. Öztürk, M.; Demirci, E.; Gürbüz, O.; Güner, S.; Valeev, V.; Vagizov, F.; Khaibullin, R.; Akdoğan, N. Formation of Different Magnetic Phases and High Curie Temperature Ferromagnetism in Fe57-Implanted ZnO Film. J. Magn. Magn. Mater. 2015, 373, 83–85. [Google Scholar] [CrossRef]
  36. Read, D.A.; Hallam, G.C.; Sahota, M.S.; Mustaffa, A. The Magnetic Properties of Fe-Nb Alloys. Phys. B+C 1977, 86–88, 66–68. [Google Scholar] [CrossRef]
  37. Paduani, C.; Schaf, J.; Persiano, A.I.C.; Raposo, M.T.; Ardisson, J.D.; Takeuchi, A.Y. Observation of Weak Ferromagnetism in the C14 Laves Phase of the (Fe1−xNix)2Nb System. Phys. Status Solidi 2009, 246, 1362–1365. [Google Scholar] [CrossRef]
  38. Crook, M.R.; Cywinski, R. Magnetic Transition in Nb1−yFe2+y. J. Magn. Magn. Mater. 1995, 140–144, 71–72. [Google Scholar] [CrossRef]
  39. Massalski, T.B.; Murray, J.L.; Bennett, L.H.; Baker, H. Binary Alloy Phase Diagrams, 1st ed.; American Society for Metals: Metals Park, OH, USA, 1986; Volume 1, 1100p. [Google Scholar]
  40. Raposo, M.T.; Ardisson, J.D.; Persiano, A.I.C.; Mansur, R.A. Characterization of Phases in the Fe-Nb System. Hyperfine Interact. 1994, 83, 235–238. [Google Scholar] [CrossRef]
  41. Shannon, R.D. Revised Effective Ionic Radii and Systematic Studies of Interatomic Distances in Halides and Chalcogenides. Acta Crystallogr. Sect. A 1976, 32, 751–767. [Google Scholar] [CrossRef]
  42. Keune, W.; Date, S.K.; Dézsi, I.; Gonser, U. Mössbauer-effect Study of Co57 and Fe57 Impurities in Ferroelectric LiNbO3. J. Appl. Phys. 1975, 46, 3914–3924. [Google Scholar] [CrossRef]
  43. Błachowski, A.; Ruebenbauer, K.; Żukrowski, J. Influence of Niobium Impurity on Spin Density in Metallic Iron. Phys. Status Solidi 2005, 242, 3201–3208. [Google Scholar] [CrossRef]
  44. Drittler, B.; Stefanou, N.; Blügel, S.; Zeller, R.; Dederichs, P.H. Electronic Structure and Magnetic Properties of Dilute Fe Alloys with Transition-Metal Impurities. Phys. Rev. B 1989, 40, 8203–8212. [Google Scholar] [CrossRef] [PubMed]
  45. Balogh, J.; Bujdosó, L.; Horváth, Z.E.; Kaptás, D.; Kiss, L.F.; Nakanishi, A.; Sajti, S.; Szilágyi, E. Alloy Formation at the Fe-on-Nb and Nb-on-Fe Interfaces. Vacuum 2020, 171, 109048. [Google Scholar] [CrossRef]
  46. Ovchinnikov, V.V. Mössbauer Analysis of the Atom and Magnetic Structure of Alloys; Cambridge International Science Publishing: Cambridge, UK, 2006; 248p. [Google Scholar]
  47. Matsnev, M.E.; Rusakov, V.S. SpectrRelax: An Application for Mössbauer Spectra Modeling and Fitting. AIP Conf. Proc. 2012, 1489, 178–185. [Google Scholar] [CrossRef]
  48. Wertheim, G.K. Mössbauer Effect: Principles and Applications; Academic Press: New York, NY, USA, 1964. [Google Scholar]
  49. Ouyang, G.; Tan, X.; Wang, C.X.; Yang, G.W. Solid Solubility Limit in Alloying Nanoparticles. Nanotechnology 2006, 17, 4257–4262. [Google Scholar] [CrossRef]
  50. Lee, J.-G.; Mori, H. Solid Solubility in Isolated Nanometer-Sized Alloy Particles in the Sn-Pb System. Eur. Phys. J. D 2005, 34, 227–230. [Google Scholar] [CrossRef]
  51. Tiwari, K.; Manolata Devi, M.; Biswas, K.; Chattopadhyay, K. Phase Transformation Behavior in Nanoalloys. Prog. Mater. Sci. 2021, 121, 100794. [Google Scholar] [CrossRef]
  52. Plaksin, O.A.; Takeda, Y.; Amekura, H.; Umeda, N.; Kono, K.; Okubo, N.; Kishimoto, N. Optical Monitoring of Nanoparticle Formation during Negative 60keV Cu Ion Implantation into LiNbO3. Appl. Surf. Sci. 2005, 241, 213–217. [Google Scholar] [CrossRef]
  53. Ferrando, R.; Jellinek, J.; Johnston, R.L. Nanoalloys:  From Theory to Applications of Alloy Clusters and Nanoparticles. Chem. Rev. 2008, 108, 845–910. [Google Scholar] [CrossRef]
  54. Dorofeev, G.A.; Elsukov, E.P. Thermodynamic Modeling of Mechanical Alloying in the Fe–Sn System. Inorg. Mater. 2000, 36, 1228–1234. [Google Scholar] [CrossRef]
  55. Dirba, I.; Komissinskiy, P.; Gutfleisch, O.; Alff, L. Increased Magnetic Moment Induced by Lattice Expansion from α-Fe to α′-Fe8N. J. Appl. Phys. 2015, 117, 173911. [Google Scholar] [CrossRef]
  56. Morrish, A.H. The Physical Principles of Magnetism; John Wiley & Sons: Nashville, TN, USA, 2001. [Google Scholar]
  57. Kuz’min, M.D.; Skokov, K.P.; Jian, H.; Radulov, I.; Gutfleisch, O. Towards High-Performance Permanent Magnets without Rare Earths. J. Phys. Condens. Matter 2014, 26, 064205. [Google Scholar] [CrossRef] [PubMed]
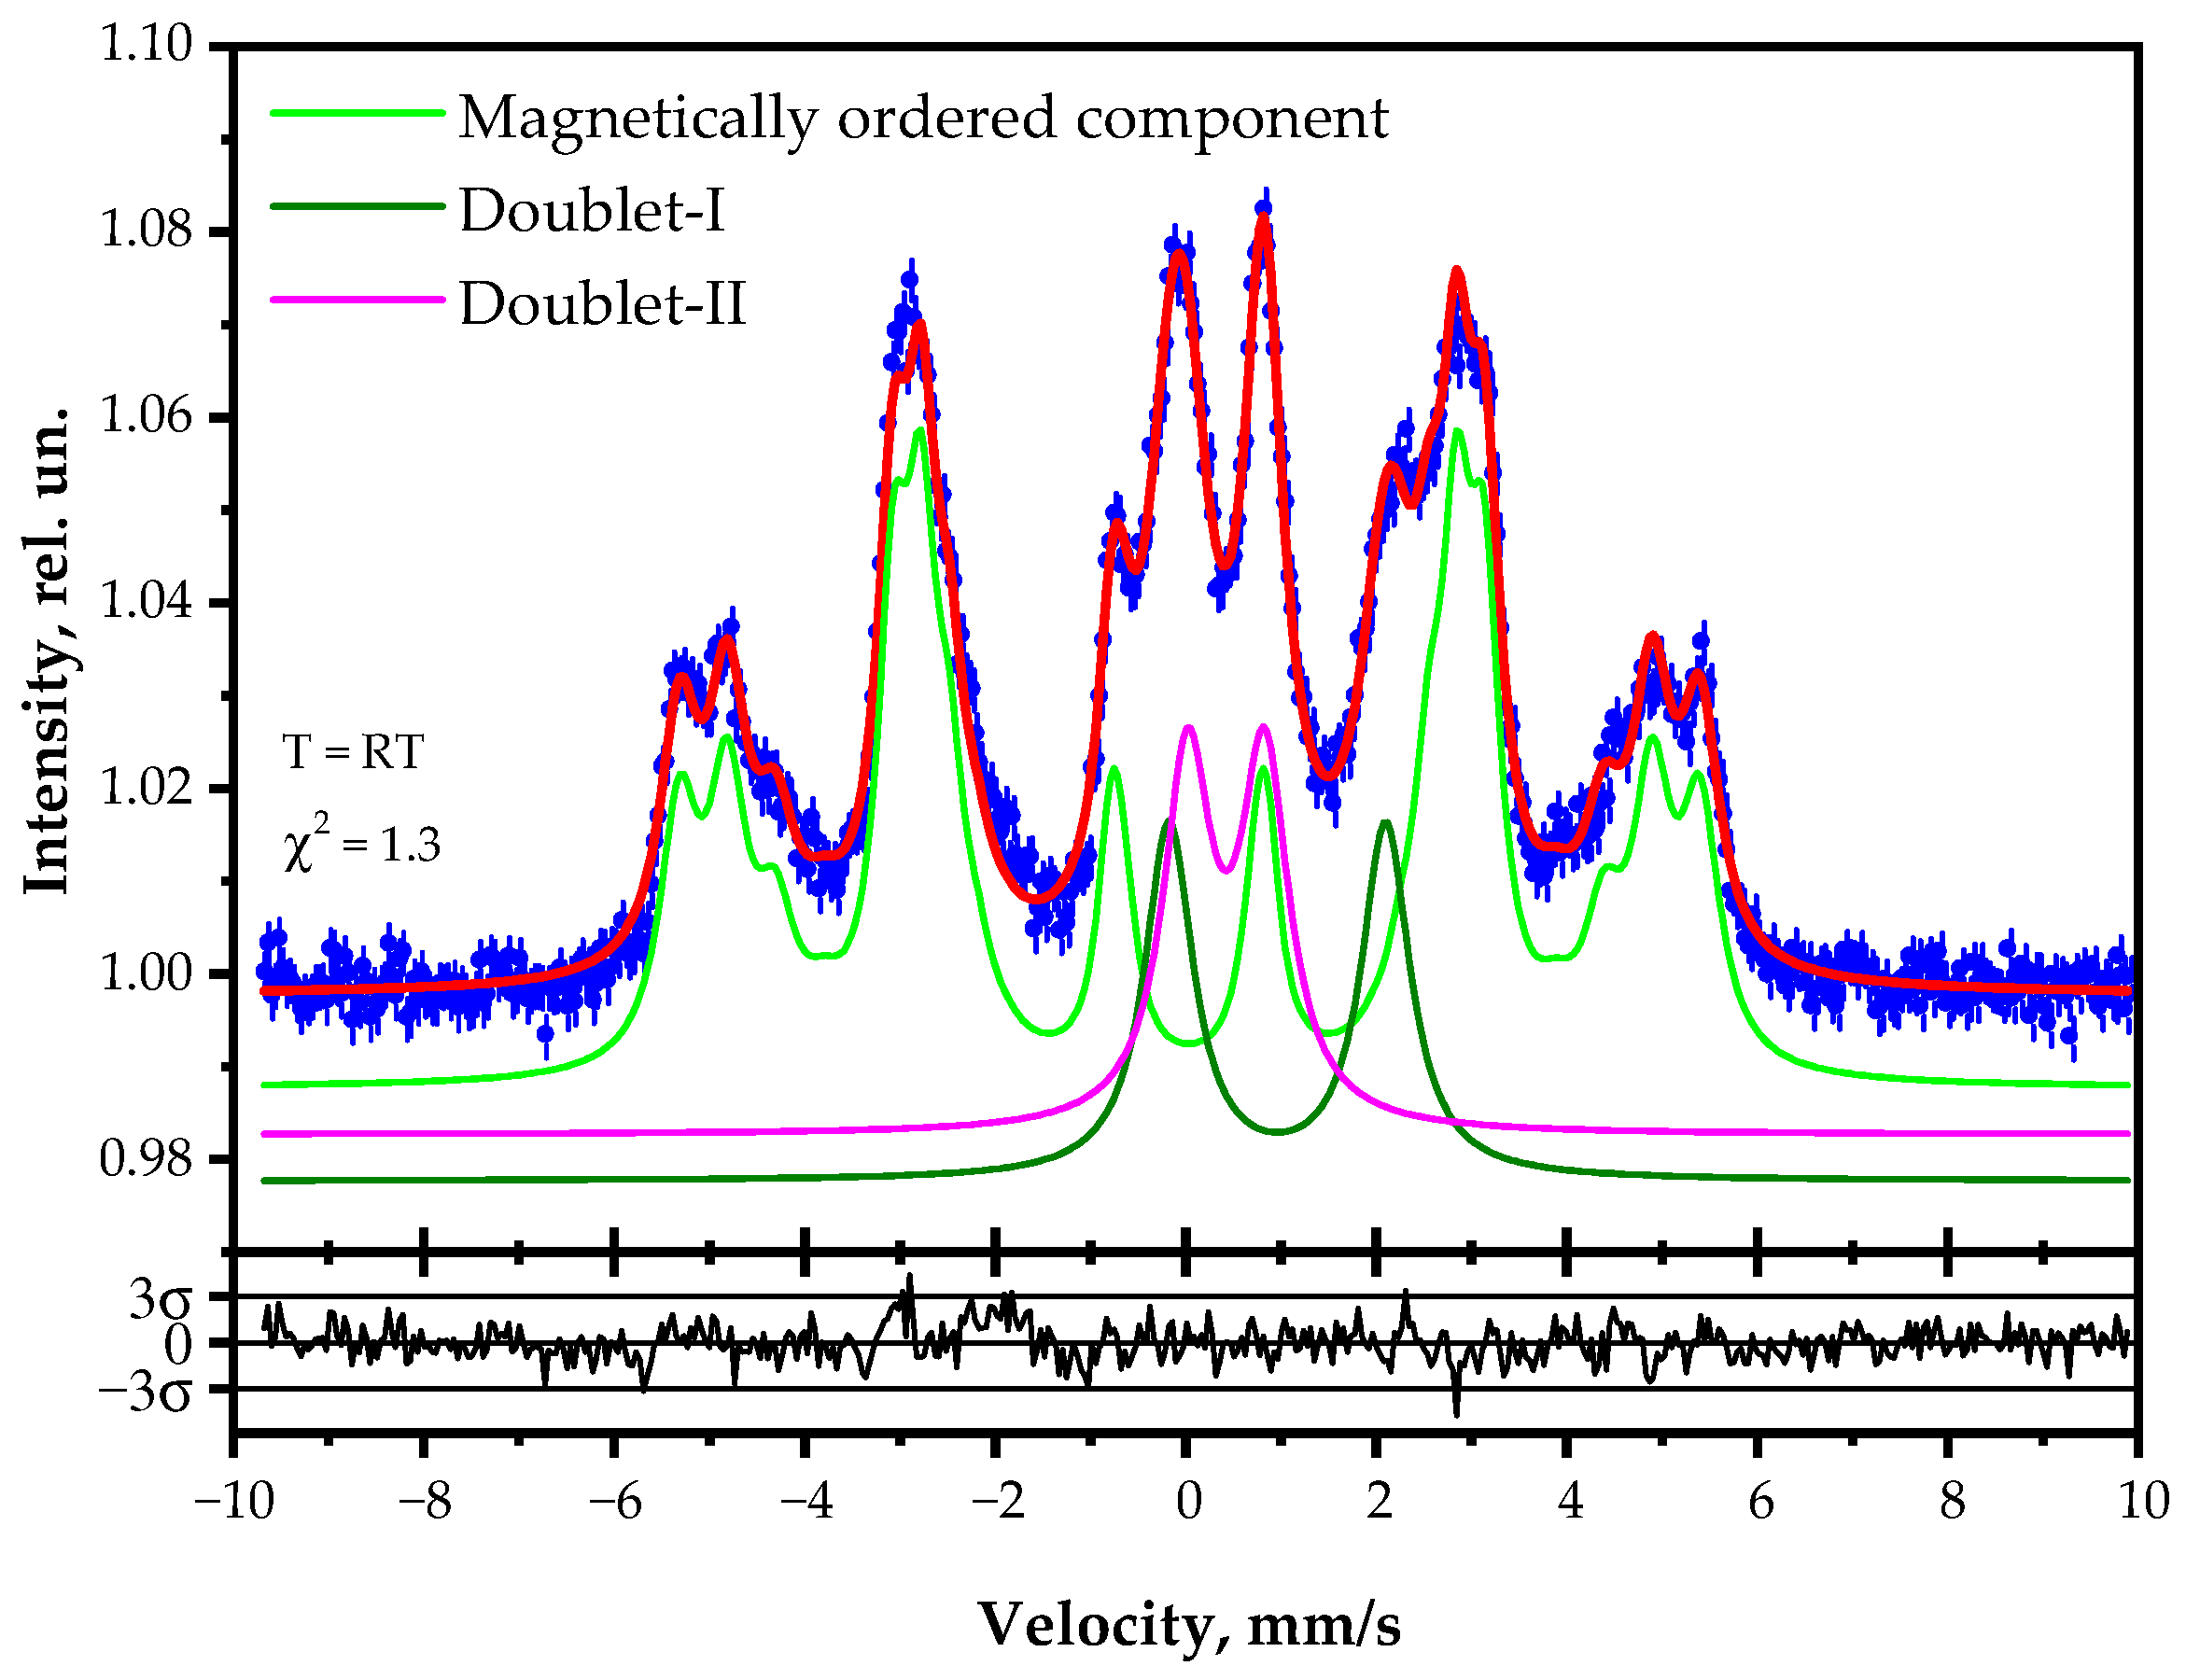
Figure 1. The calculated depth profiles of the implanted iron atoms in LiNbO3:Fe. The red curve is the TRIM-simulated profile, and the green curve is the profile considering the surface sputtering. The sputtered surface layer is depicted by the filled region.
Magnetochemistry 09 00121 g001
Figure 2. The SEM image of the LiNbO3:Fe sample implanted surface.
Magnetochemistry 09 00121 g002
Figure 3. The bulk in-plane magnetic properties of the LiNbO3:Fe sample: (a) the magnetic hysteresis loops recorded at 10 K (black curve) and 300 K (red curve), (b) the temperature dependencies of the coercivity field (blue curve) and the saturation magnetization (green curve). The magnetization values are presented in units of Bohr magnetons per implanted iron ion.
Magnetochemistry 09 00121 g003
Figure 4. The magnetic hysteresis loops measured at room temperature by the L-MOKE at multiple points of the implanted surface of the LiNbO3:Fe sample. In the inset, the comparison of the VSM- and MOKE-measured hysteresis loops is presented.
Magnetochemistry 09 00121 g004
Figure 5. Temperature dependence of LiNbO3:Fe sample magnetization recorded in the zero-field-cooled (ZFC—blue curve) and the field-cooled (FC—red curve) regimes in the applied magnetic field of 200 Oe.
Magnetochemistry 09 00121 g005
Figure 6. Room temperature conversion electron Mössbauer spectrum of the LiNbO3:Fe sample. Blue points represent the experimental data. The best-fit result is plotted by the solid red line, and the model components are shown by color lines vertically biased to the visibility.
Magnetochemistry 09 00121 g006
Figure 7. Distribution of the hyperfine magnetic field on the 57Fe nuclei reconstructed using SpectrRelax software (green curve) and the relative areas of the individual sextets in the binomial distribution (red bars). The designation of the bars shows the number of Nb atoms in the first shell around the Fe.
Magnetochemistry 09 00121 g007
Figure 8. Grazing incidence X-ray diffraction pattern of the LiNbO3:Fe sample. The reflexes corresponding to the Fe-Nb precipitates are indexed. The unidentified reflex is marked by the asterisk. The reflexes’ positions corresponding to the bcc-Fe lattice are shown by the red bars. The amplitudes of the bars correspond to the intensities of the reflexes in the powder bcc-Fe XRD pattern.
Magnetochemistry 09 00121 g008
Table 1. Parameters of the conversion electron Mössbauer spectrum model components of the LiNbO3:Fe sample.
ComponentsHyperfine Parameters 1Linewidth, mm/sRelative Area, %Valence State
δ, mm/s2ε, mm/s<HF>, kOe
Doublet-I0.96(1)2.28(2)-0.62(2)16(1)Fe2+
Doublet-II0.42(1)0.81(2)-0.62(3)17(1)Fe3+
Magnetically ordered component0.03(1)0.01(1)303(1)0.49(1) 267(1)Fe0
1 δ—center shift relative α-Fe at RT, 2ε—quadrupole splitting, and <HF>—average value of the hyperfine magnetic field on the 57Fe nuclei. 2 the width of the outer lines.
Disclaimer/Publisher’s Note: The statements, opinions and data contained in all publications are solely those of the individual author(s) and contributor(s) and not of MDPI and/or the editor(s). MDPI and/or the editor(s) disclaim responsibility for any injury to people or property resulting from any ideas, methods, instructions or products referred to in the content.

