
Old Discovery Leading to New Era: Metabolic Imaging of Cancer with Deuterium MRI

Abstract
:1. Introduction
2. Development and Principle of DMS and DMI
3. In Vivo Tumour Detection Using DMI
4. In Vivo Treatment Response Monitoring Using DMI
5. Future Perspectives for Clinical Implementation and Challenges
- Identifying more biomarkers: Deuterated glucose was the first and commonly injected label for DMS and DMI study. However, as demonstrated by other recent studies [25,27], identification of other appropriate biomarkers and thorough understanding of their journey through relevant metabolic pathways is crucial for DMI to become a powerful tool in cancer management. Adoption of strategies described in the imaging biomarker development roadmap [28] should provide guidance on a robust translational path and ensure clinical adoption based on the quality of evidence generated from clinical studies [29]. Even if some biomarkers become unsuccessful for clinical translation, they could still be valuable in basic and translational research for monitoring metabolic pathways that novel treatment agents could target. Other 2H-labeled tracers that might be taken into consideration include but not limited to acetate, fumarate, succinate… [30].
- Imaging optimisation: Early preclinical studies should further refine and improve DMI acquisition techniques to provide an effective and technically achievable method to be used in subsequent clinical trials. Dynamic DMI measurements of [6,6′−2H2]-labelled glucose with a high temporal (10 min) and spatial resolution (2.96 mL) of healthy human brain is achievable as demonstrated by Ruhm et al. [31] However, the dedicated coil design and the ultrahigh field strength of 9.4 T make the setting less available routinely in a hospital. The sensitivity of MRI and MRS improves with higher magnetic fields [32,33] but there are other optimization methods to mitigate this requirement. De Graaf et al. [34] showed that with optimal multi-receiver arrays, a nominal 1 mL resolution DMI acquisition is feasible at 7 T and proposed that clinical use field strength of 3 T should allow for a nominal 4–8 mL DMI acquisition. Kaggie et al. [35] attempted taking DMI of human brain at 3 T for the first time recently. Although there was spectral overlap between metabolites, their DMS was able to distinguish metabolic peaks corresponding to water, glucose, Glx, and lactate. Other techniques such as multi-echo balanced steady-state free precession instead of CSI [18] or deployment of deep learning [36] during data acquisition should be further tested to improve the signal to noise ratio of DMI at 3T.
- Establish reliability and repeatability: At this stage, most DMI experiments carried out are small-scaled animal studies. Animal studies provide the opportunity to better understand fundamental aspects of biochemistry and the effect of gene mutation, therapy, environmental factors on tumour pathology which is unethical to be tested in real patients. These early preclinical feasibility studies should also include tests of repeatability and precision to measure the variability of DMI results. However, ultimately, the most robust evidence for successful clinical implementation of DMI can only be established in human trials on a multi-institutional level. Early clinical trials should validate DMI against an accepted reference standard for safety, tumour characterization, monitoring and standardise the report of adverse events. Later down the line, multicentre clinical trials must be established, and appropriate investigative but pragmatic MR protocols need to be developed.
- Complementary value with other imaging modalities: Decision about the suitable imaging technique for clinical use depends not purely on the sensitivity or robustness of the method but also the cost effectiveness and accessibility of the imaging tool compared to its potential alternatives. It is plausible that optimal imaging strategy for particular clinical challenge lies with combination of complementary modalities. The availability of 2H RF coils is still very limited. If only a 1H coil is available, quantitative exchanged-labelled turnover MRS is a method presented by Rich et al. [37] which enables 2H glucose be indirectly detected via 1H MRS. The experimental sensitivity of non-hyperpolarized 13C MRSI and DMI were compared by de Graaf et al. [34] showing a higher sensitivity for DMI. However, Kaggie et al. [35] suggested that when DMI is compared with hyperpolarized 13C MRSI, 13C MRSI could probe early rapid lactate production, and DMI probe the later slower production of Glx. Therefore, 13C MRSI and DMI could have complementary role in cancer metabolism studies. A comprehensive comparison between different MRS methods concerning the sensitivity of the detection of the different labelled metabolites is still missing and should be addressed in future research studies.
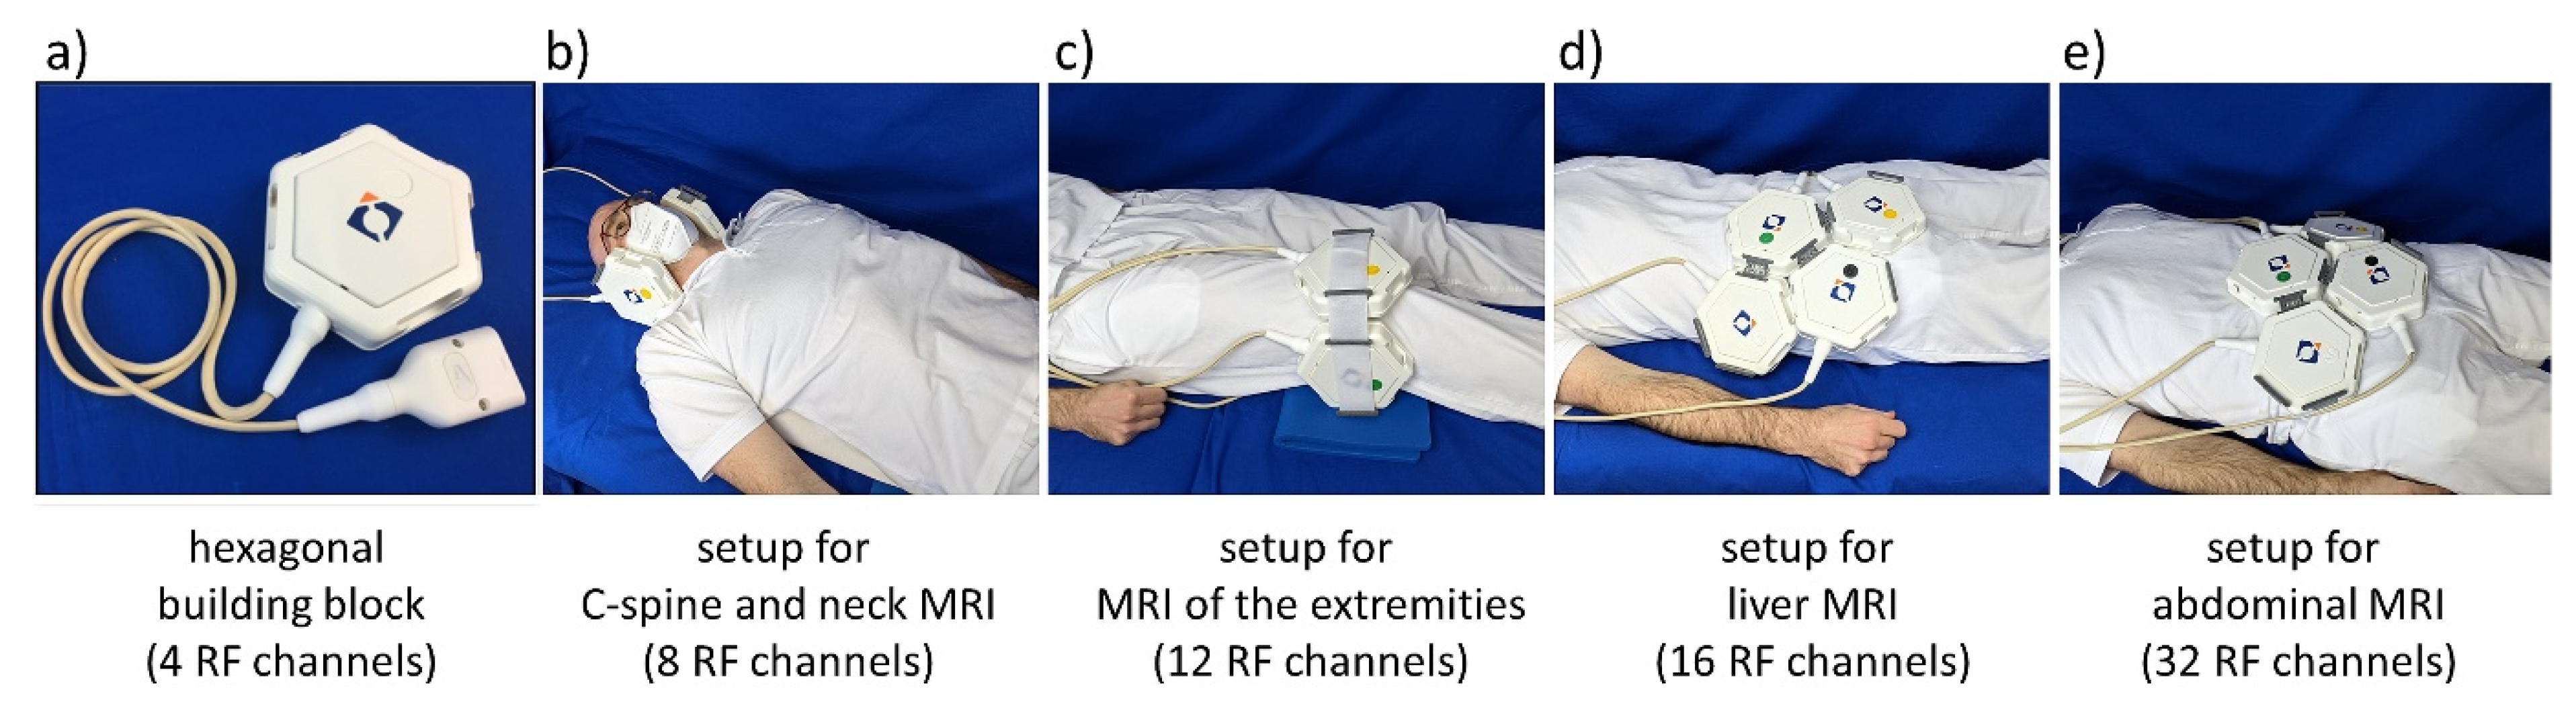
- Radiofrequency detectors for 2H sensitivity enhancement: One current road blocker and practical obstacle for clinical translation of 2H MR is the lack of appropriate radiofrequency (RF) MR detectors. This need continues to motivate new research on multi-channel RF arrays which would help to enhance sensitivity and to lower detection thresholds [38,39,40,41]. Research directions include anatomically adaptive, lightweight, elastically stretchable or flexible configurations that perfectly conform to the human body to enhance SNR through improving the filling factor. Another area of current intense research is the development of multi-purpose, modular RF receiver arrays, which may eliminate the need for RF coil arrays dedicated to specific anatomy, targets or 2H DMI/DMS applications. Figure 2 shows an example of a multi-purpose, modular transmit/receive RF array which supports 2H DMI/DMS. This is an extension of previous developments tailored for 1H MRI but uses hexagonal building blocks to form an array [42]. Each building block comprises 4 RF elements. It can be driven in the parallel transmission mode but also supports excitation using a single feeding RF channel. For the latter fixed phase settings are used for each element for transmission field (B1+) shaping depending on the target anatomy. Phase setting can be conveniently changed and hardware adapted by replacing the phase shifter module of the universal interface which is used to connect the RF array with the MR scanner.
- Extreme field MRI at 14.0 T or 20.0 T: The future of human MRI will not end at 7.0 T and the field is moving apace in this direction. The recent progress of probing the local concentrations of deuterium and other x-nuclei at 7.0 T provides convincing reasons for wide bore magnets with B0 ≥ 7.0 T which spurred the installation of a 10.5 T whole-body MR system suitable for body MRI [43]. Physicists, engineers, and pioneers from related disciplines have already taken further steps into the future. This envisions human MR at 14.0 Tesla and at 20.0 Tesla and is an important conceptual leap [44,45]. These fields will span even more of the crucial “resolution gap” in our understanding of cancer biology. Low frequency X-nuclei MR such as 2H MR would particularly benefit from the signal-to-noise ratio (SNR) gain at higher magnetic fields because SNR scales supra-linearly with the magnetic field strength [46]. This would help to lower detection levels and reduce scan times. An SNR gain of two would translate into a scan time reduction of a factor of four. The resonance frequency of 2H at 20.0 T is approximately 131 MHz, which is similar to the resonance frequency of 1H at a clinical magnetic field strength of 3.0 T. This makes technology established for 1H MR at 3.0 T ideal candidates to be perfected and fine-tuned for 2H MR at 20.0 T.
- Collaborations: From a research perspective, MR physicists, biochemists, biomedical scientists, clinical oncologists, radiologists, engineers, and computer scientists should come together to optimise the utility of DMS and DMI as described above. From a clinical adoption standpoint, opinions from patients, and various stakeholders involved in the multidisciplinary team is essential for the development of a new imaging modality.
6. Conclusions
Author Contributions
Funding
Conflicts of Interest
References
- Martinez-Outschoorn, U.E.; Peiris-Pagés, M.; Pestell, P.G.; Sotgia, F.; Lisanti, M.P. Cancer metabolism: A therapeutic per-spective. Nature reviews. Clin. Oncol. 2017, 14, 11–31. [Google Scholar] [CrossRef]
- Sprinz, C.; Altmayer, S.; Zanon, M.; Watte, G.; Irion, K.; Marchiori, E.; Hochhegger, B. Effects of blood glucose level on 18F-FDG uptake for PET/CT in normal organs: A systematic review. PloS ONE 2018, 13, e0193140. [Google Scholar] [CrossRef] [PubMed]
- Zhu, A.; Lee, D.; Shim, H. Metabolic positron emission tomography imaging in cancer detection and therapy response. Semin. Oncol. 2011, 38, 55–69. [Google Scholar] [CrossRef] [PubMed] [Green Version]
- Burtscher, I.M.; Holtås, S. Proton MR spectroscopy in clinical routine. J. Magn. Reson. Imaging 2001, 13, 560–567. [Google Scholar] [CrossRef] [PubMed]
- Ma, J.; Pinho, M.C.; Harrison, C.E.; Chen, J.; Sun, C.; Hackett, E.P.; Liticker, J.; Ratnakar, J.; Reed, G.D.; Chen, A.P.; et al. Dynamic 13C MR spectroscopy as an alternative to imaging for assessing cerebral metabolism using hyperpolarized pyruvate in humans. Magn. Reson. Med. 2022, 87, 1136–1149. [Google Scholar] [CrossRef]
- Kurhanewicz, J.; Vigneron, D.B.; Ardenkjaer-Larsen, J.H.; Bankson, J.A.; Brindle, K.; Cunningham, C.H.; Gallagher, F.A.; Keshari, K.R.; Kjaer, A.; Laustsen, C.; et al. Hyperpolarized 13C MRI: Path to Clinical Translation in Oncology. Neoplasia 2019, 21, 1–16. [Google Scholar] [CrossRef]
- De Feyter, H.M.; Behar, K.L.; Corbin, Z.A.; Fulbright, R.K.; Brown, P.B.; McIntyre, S.; Nixon, T.W.; Rothman, D.L.; de Graaf, R.A. Deuterium metabolic imaging (DMI) for MRI-based 3D mapping of metabolism in vivo. Sci. Adv. 2018, 4, eaat7314. [Google Scholar] [CrossRef] [Green Version]
- Lu, M.; Zhu, X.; Zhang, Y.; Mateescu, G.; Chen, W. Quantitative assessment of brain glucose metabolic rates using in vivo deuterium magnetic resonance spectroscopy. J. Cereb. Blood Flow Metab. 2017, 37, 3518–3530. [Google Scholar] [CrossRef]
- De Feyter, H.M.; de Graaf, R.A. Deuterium metabolic imaging—Back to the future. J. Magn. Reson. 2021, 326, 106932. [Google Scholar] [CrossRef]
- Urey, H.C.; Murphy, G.M.; Brickwedde, F.G. A Name and Symbol for H2. J. Chem. Phys. 2004, 1, 512. [Google Scholar] [CrossRef]
- Ackerman, J.J.; Ewy, C.S.; Becker, N.N.; Shalwitz, R.A. Deuterium nuclear magnetic resonance measurements of blood flow and tissue perfusion employing 2H2O as a freely diffusible tracer. Proc. Natl. Acad. Sci. USA 1987, 84, 4099–4102. [Google Scholar] [CrossRef] [PubMed] [Green Version]
- Müller, S.; Seelig, J. In vivo NMR imaging of deuterium. J. Magn. Reson. 1987, 72, 456–466. [Google Scholar] [CrossRef]
- Hagemann, R.; Nief, G.; Roth, E. Absolute isotopic scale for deuterium analysis of natural waters. Absolute D/H ratio for SMOW1. Tellus 1970, 22, 712–715. [Google Scholar]
- Al-Rawi, J.M.A.; Behnam, G.Q.; Taha, N.I. Deuterium nuclear magnetic resonance spectroscopy. 1—Larmor frequency ratio, referencing and chemical shift. Org. Magn. Reson. 1981, 16, 198–201. [Google Scholar] [CrossRef]
- Krebs, H.A. The citric acid cycle and the Szent-Györgyi cycle in pigeon breast muscle. Biochem. J. 1940, 34, 775–779. [Google Scholar] [CrossRef] [PubMed] [Green Version]
- Warburg, O.; Wind, F.; Negelein, E. The metabolism of tumors in the body. J. Gen. Phys. 1927, 8, 519–530. [Google Scholar] [CrossRef] [Green Version]
- Markovic, S.; Roussel, T.; Agemy, L.; Sasson, K.; Preise, D.; Scherz, A.; Frydman, L. Deuterium MRSI characterizations of glucose metabolism in orthotopic pancreatic cancer mouse models. NMR Biomed. 2021, 34, e4569. [Google Scholar] [CrossRef]
- Peters, D.C.; Markovic, S.; Bao, Q.; Preise, D.; Sasson, K.; Agemy, L.; Scherz, A.; Frydman, L. Improving deuterium metabolic imaging (DMI) signal-to-noise ratio by spectroscopic multi-echo bSSFP: A pancreatic cancer investigation. Magn. Reson. Med. 2021, 86, 2604–2617. [Google Scholar] [CrossRef]
- Veltien, A.; van Asten, J.; Ravichandran, N.; de Graaf, R.A.; De Feyter, H.M.; Oosterwijk, E.; Heerschap, A. Simultaneous Recording of the Uptake and Conversion of Glucose and Choline in Tumors by Deuterium Metabolic Imaging. Cancers 2021, 13, 4034. [Google Scholar] [CrossRef]
- Glunde, K.; Bhujwalla, Z.M.; Ronen, S.M. Choline metabolism in malignant transformation. Nat. Rev. Cancer 2011, 11, 835–848. [Google Scholar] [CrossRef] [Green Version]
- Eisenhauer, E.A.; Therasse, P.; Bogaerts, J.; Schwartz, L.H.; Sargent, D.; Ford, R.; Dancey, J.; Arbuck, S.; Gwyther, S.; Mooney, M.; et al. New response evaluation criteria in solid tumours: Revised RECIST guideline (version 1.1). Eur. J. Cancer. 2009, 45, 228–247. [Google Scholar] [CrossRef] [PubMed]
- Campbell, A.; Davis, L.M.; Wilkinson, S.K.; Hesketh, R.L. Emerging Functional Imaging Biomarkers of Tumour Responses to Radiotherapy. Cancers 2019, 11, 131. [Google Scholar] [CrossRef] [PubMed] [Green Version]
- Hesse, F.; Somai, V.; Kreis, F.; Bulat, F.; Wright, A.J.; Brindle, K.M. Monitoring tumor cell death in murine tumor models using deuterium magnetic resonance spectroscopy and spectroscopic imaging. Proc. Natl. Acad. Sci. USA 2021, 118, e2014631118. [Google Scholar] [CrossRef] [PubMed]
- Pérez-Tomás, R.; Pérez-Guillén, I. Lactate in the Tumor Microenvironment: An Essential Molecule in Cancer Progression and Treatment. Cancers 2020, 12, 3244. [Google Scholar] [CrossRef] [PubMed]
- Taglang, C.; Batsios, G.; Mukherjee, J.; Tran, M.; Gillespie, A.M.; Hong, D.; Ronen, S.M.; Luchman, H.A.; Pieper, R.O.; Viswanath , P. Deuterium magnetic resonance spectroscopy en-ables noninvasive metabolic imaging of tumor burden and response to therapy in low-grade gliomas. Neuro-Oncology 2022, 24, 1101–1112. [Google Scholar] [CrossRef] [PubMed]
- Hygino da Cruz, L.C.; Rodriguez, I.; Domingues, R.C.; Gasparetto, E.L.; Sorensen, A.G. Pseudoprogression and pseudoresponse: Imaging challenges in the assessment of posttreatment glioma. AJNR. Am. J. Neuroradiol. 2011, 32, 1978–1985. [Google Scholar] [CrossRef] [Green Version]
- Batsios, G.; Taglang, C.; Tran, M.; Stevers, N.; Barger, C.; Gillespie, A.M.; Ronen, S.M.; Costello, J.F.; Viswanath, P. Deuterium Metabolic Imaging Reports on TERT Expression and Early Response to Therapy in Cancer. Clin. Cancer Res. Off. J. Am. Assoc. Cancer Res. 2022, 28, 3526–3536. [Google Scholar] [CrossRef]
- O’Connor, J.P.B.; Aboagye, E.O.; Adams, J.E.; Aerts, H.J.W.L.; Barrington, S.F.; Beer, A.J.; Boellaard, R.; Bohndiek, S.; Brady, M.; Brown, G.; et al. Imaging biomarker roadmap for cancer studies. Nat. Rev. Clin. Oncol. 2017, 14, 169–186. [Google Scholar] [CrossRef]
- McShane, L.M.; Hayes, D.F. Publication of tumor marker research results: The necessity for complete and transparent reporting. J. Clin. Oncol. Off. J. Am. Soc. Clin. Oncol. 2012, 30, 4223–4232. [Google Scholar] [CrossRef]
- Hirayama, A.; Kami, K.; Sugimoto, M.; Sugawara, M.; Toki, N.; Onozuka, H.; Kinoshita, T.; Saito, N.; Ochiai, A.; Tomita, M.; et al. Quantitative Metabolome Profiling of Colon and Stomach Cancer Microenvironment by Capillary Electrophoresis Time-of-Flight Mass Spectrometry. Cancer Res. 2009, 69, 4918–4925. [Google Scholar] [CrossRef] [Green Version]
- Ruhm, L.; Avdievich, N.; Ziegs, T.; Nagel, A.M.; De Feyter, H.M.; de Graaf, R.A.; Henning, A. Deuterium metabolic imaging in the human brain at 9.4 Tesla with high spatial and temporal resolution. Neuroimage 2021, 244, 118639. [Google Scholar] [CrossRef] [PubMed]
- Pohmann, R.; Speck, O.; Scheffler, K. Signal-to-noise ratio and MR tissue parameters in human brain imaging at 3, 7, and 9.4 tesla using current receive coil arrays. Magn. Reson. Med. 2016, 75, 801–809. [Google Scholar] [CrossRef] [PubMed]
- Vaughan, J.T.; Garwood, M.; Collins, C.M.; Liu, W.; DelaBarre, L.; Adriany, G.; Andersen, P.; Merkle, H.; Goebel, R.; Smith, M.; et al. 7T vs. 4T: RF power, homogeneity, and signal-to-noise comparison in head images. Magn. Reson. Med. 2001, 46, 24–30. [Google Scholar] [CrossRef] [PubMed]
- de Graaf, R.A.; Hendriks, A.D.; Klomp, D.W.J.; Kumaragamage, C.; Welting, D.; de Castro, C.S.A.; Brown, P.B.; McIntyre, S.; Nixon, T.W.; Prompers, J.J.; et al. On the magnetic field dependence of deuterium metabolic imaging. NMR Biomed. 2020, 33, e4235. [Google Scholar] [CrossRef] [PubMed]
- Kaggie, J.D.; Khan, A.S.; Matys, T.; Schulte, R.F.; Locke, M.J.; Grimmer, A.; Frary, A.; Menih, I.H.; Latimer, E.; Graves, M.J.; et al. Deuterium metabolic imaging and hyperpolarized 13C-MRI of the normal human brain at clinical field strength reveals differential cerebral metabolism. NeuroImage 2022, 257, 119284. [Google Scholar] [CrossRef]
- Dong, S.; Feyter, H.; Graaf, R.; Duncan, J. A Deep Learning Method for Sensitivity Enhancement in Deuterium Metabolic Imaging (DMI). In Proceedings of the 28th Annual Meeting of ISMRM, Singapore, 24 July 2020. [Google Scholar]
- Rich, L.J.; Bagga, P.; Wilson, N.E.; Schnall, M.D.; Detre, J.A.; Haris, M.; Reddy, R. 1H magnetic resonance spectroscopy of 2H-to-1H exchange quantifies the dynamics of cellular metabolism in vivo. Nat. Biomed. Eng. 2020, 4, 335–342. [Google Scholar] [CrossRef]
- Zhang, B.; Sodickson, D.K.; Cloos, M.A. A high-impedance detector-array glove for magnetic resonance imaging of the hand. Nat. Biomed. Eng. 2018, 2, 570–577. [Google Scholar] [CrossRef]
- Eigentler, T.W.; Kuehne, A.; Boehmert, L.; Dietrich, S.; Els, A.; Waiczies, H.; Niendorf, T. 32-Channel self-grounded bow-tie transceiver array for cardiac MR at 7.0T. Magn. Reson. Med. 2021, 86, 2862–2879. [Google Scholar] [CrossRef]
- Gruber, B.; Rehner, R.; Laistler, E.; Zink, S. Anatomically Adaptive Coils for MRI—A 6-Channel Array for Knee Imaging at 1.5 Tesla. Front. Phys. 2020. [Google Scholar] [CrossRef]
- Vincent, J.M.; Gim, M.; Rispoli, J.V. Elastically Stretchable and Flexible RF Receive Coils for Magnetic Resonance Imaging. In Proceedings of the 2021 International Conference on Electromagnetics in Advanced Applications (ICEAA), Honolulu, HI, USA, 9–13 August 2021; p. 319. [Google Scholar]
- Graessl, A.; Renz, W.; Hezel, F.; Dieringer, M.A.; Winter, L.; Oezerdem, C.; Rieger, J.; Kellman, P.; Santoro, D.; Lindel, T.D. Modular 32-channel transceiver coil array for cardiac MRI at 7.0T. Magn. Reson. Med. 2014, 72, 276–290. [Google Scholar] [CrossRef]
- Ertürk, M.A.; Wu, X.; Eryaman, Y.; Van de Moortele, P.; Auerbach, E.J.; Lagore, R.L.; DelaBarre, L.; Vaughan, J.T.; Uğurbil, K.; Adriany, G.; et al. Toward imaging the body at 10.5 tesla. Magn. Reson. Med. 2017, 77, 434–443. [Google Scholar] [CrossRef] [PubMed]
- Budinger, T.F.; Bird, M.D.; Frydman, L.; Long, J.R.; Mareci, T.H.; Rooney, W.D.; Rosen, B.; Schenck, J.F.; Schepkin, V.D.; Sherry, D.; et al. Toward 20 T magnetic resonance for human brain studies: Opportunities for discovery and neuroscience rationale. Magma 2016, 29, 617–639. [Google Scholar] [CrossRef] [PubMed]
- Winter, L.; Niendorf, T. Electrodynamics and radiofrequency antenna concepts for human magnetic resonance at 23.5 T (1 GHz) and beyond. Magma 2016, 29, 641–656. [Google Scholar] [PubMed] [Green Version]
- Le Ster, C.; Grant, A.; Van de Moortele, P.; Monreal-Madrigal, A.; Adriany, G.; Vignaud, A.; Mauconduit, F.; Rabrait-Lerman, C.; Poser, B.A.; Ugurbil, K.; et al. Magnetic field strength de-pendent SNR gain at the center of a spherical phantom and up to 11.7T. Magn. Reson. Med. 2022, 85, 2131–2138. [Google Scholar] [CrossRef] [PubMed]


Disclaimer/Publisher’s Note: The statements, opinions and data contained in all publications are solely those of the individual author(s) and contributor(s) and not of MDPI and/or the editor(s). MDPI and/or the editor(s) disclaim responsibility for any injury to people or property resulting from any ideas, methods, instructions or products referred to in the content. |
© 2022 by the authors. Licensee MDPI, Basel, Switzerland. This article is an open access article distributed under the terms and conditions of the Creative Commons Attribution (CC BY) license (https://creativecommons.org/licenses/by/4.0/).
Share and Cite
Ding, H.; Haroon, A.; Wan, S.; Niendorf, T.; Adeleke, S. Old Discovery Leading to New Era: Metabolic Imaging of Cancer with Deuterium MRI. Magnetochemistry 2023, 9, 6. https://doi.org/10.3390/magnetochemistry9010006
Ding H, Haroon A, Wan S, Niendorf T, Adeleke S. Old Discovery Leading to New Era: Metabolic Imaging of Cancer with Deuterium MRI. Magnetochemistry. 2023; 9(1):6. https://doi.org/10.3390/magnetochemistry9010006
Chicago/Turabian StyleDing, Hao, Athar Haroon, Simon Wan, Thoralf Niendorf, and Sola Adeleke. 2023. "Old Discovery Leading to New Era: Metabolic Imaging of Cancer with Deuterium MRI" Magnetochemistry 9, no. 1: 6. https://doi.org/10.3390/magnetochemistry9010006