Article

New Manufacturing Process for Granular Texture Management in Polycrystalline BaM Hexaferrites through the Goethite Crystallite Laths Aspect Ratio, and a Specialized Law of Approach to the Magnetic Saturation for Partly Polarized Uniaxial Materials

Lab-STICC, UMR CNRS 6285, 6 av. Le Gorgeu, 29238 Brest, France
*
Author to whom correspondence should be addressed.
Magnetochemistry 2023, 9(1), 30; https://doi.org/10.3390/magnetochemistry9010030
Submission received: 16 November 2022 / Revised: 23 December 2022 / Accepted: 30 December 2022 / Published: 12 January 2023
(This article belongs to the Special Issue Magnetic Materials, Thin Films and Nanostructures)

Abstract

:
This study is aimed at the manufacture and the magnetic properties of polycrystalline M-type hexaferrites BaFe12O19 (barium ferrite, or BaM) materials of different magnetic texturing grades, going from a random distribution of the BaM crystallites to their almost complete stacking. Our target is to optimize the value of reduced-remanence magnetization MR/MS, which is among the most significant features of the self-polarized materials. In this study, we focus on the role played by the precursors hematite (isotropic spherical shape) and goethite (anisotropic lath shape). Therefore, 11 samples with a flat cylinder shape are fabricated, with an increasing hematite to goethite ratio. We demonstrate that this ratio drives the texturization of the samples by producing self-polarized materials with different MR/MS from the simple green compaction of the precursors, followed by a heat treatment. Most importantly, our study reveals the orientation of BaM particles after compaction; therefore, MR/MS, is strongly influenced by the aspect ratio of the lath-shaped goethite crystallites. Additionally, we show that finer goethite crystallites yield higher-value MR/MS. We optimize the aspect ratio of the goethite crystallites for an improved BaM texture. The optimization of the morphology of the goethite crystallites leads to an increase in the BaM particles’ orientation and stacking. The salient outcome of this work, which distinguishes it significantly from recent works, is that the particles stacking increases with the value of the shape factor η (defined as the ratio of the diameter of the laths to their length) of the goethite, evidenced by XRD results. The Rietveld refinements of powder diffractograms and the measured magnetic properties reveal a particle-stacking enhancement caused by not only the ratio of hematite: goethite but mainly by an optimal aspect ratio of the goethite crystallites. Based on this study, the BaM materials are further manufactured with a controlled magnetic texture; thus, they are partly self-polarized. They show reduced-remanence magnetization MR/MS varying from 0.5 and 0.81, while the angular dispersion of the BaM particles’ easy axis of magnetization varies from 60° to 10°. The magnetic properties of the samples are further studied in microwave experiments, from which the value of the magnetocrystalline anisotropy field HK = 16.6 kOe is deduced. The first magnetization curves of each sample are obtained using a VSM. A law of approach to the saturation suitable for the case of the uniaxial polycrystalline materials, and for which the particle stacking is only partial, is proposed for the fitting of the magnetization process. It is suggested that by using the proposed law with a known magnetocrystalline anisotropy constant K1, the angular grain-dispersion can be found.

1. Introduction

In recent years, a revival in the interest in rare-earth-free permanent magnets, such as M-type hexaferrites [1,2,3], has been observed. Among this class of materials, strontium hexaferrites and barium hexaferrites, BaFe12O19 (BaM), present intermediate performances between standard ferrite and rare-earth magnets. In addition to a strong magnetocrystalline anisotropy, the BaM hexaferrites engineered to have a sufficient magnetic texture can present the great advantage of possessing high-remanence magnetization. For these reasons, they have attracted attention for use in microwave and millimeter wave (MMW) applications [4,5,6]. The interest of such properties is obvious in the design of the integrated and miniature MMW devices, in which the external permanent magnet would be eliminated [7,8,9].
The crystals of BaM grow in a flat hexagonal platelet shape, with an aspect ratio of about 1/3. Their easy axis of magnetization is perpendicular to the basal plane. The critical single-domain size is between 0.5 and 1 µm [10]. The achievement of stacking these single-domain particles is desired in order to produce a self-polarized material.
Among the manufacturing techniques used to effectively fabricate these magnets, those operating with standard ceramic technology and mechanical processes [10] must be distinguished from those implementing soft chemistry methods [6,10,11,12,13]. The latter fabrication methods involve topotactical reactions. In addition to being inexpensive, unlike other techniques, soft chemistry methods present the notable advantage of leading to the spontaneous stacking of particles [6]. It should be made clear, however, that even if the polycrystalline material has a high-quality magnetic texture, there is always some misorientation of the easy axes of magnetization, which could hardly be limited only by applying a strong magnetic field during the compaction process. Recent works [14,15], showed that the combined use of goethite and hematite crystallites to fabricate strontium hexaferrites (SrFe12O19), allowed some degree of alignment of the crystallites after a cold compaction and a heat treatment with MR/MS = 0.71. The magnitude of this value, indicative of the degree of particle packing, is insufficient for many applications. The required MR/MS value for a self-polarized material used in a circulator, one of the major applications at present [4,16,17,18,19], should be higher than 0.83 [6,20]. In our previous work, using a coprecipitation technique, we created highly oriented bulk compacts made of BaM particles with reduced-remanence magnetization MR/MS = 0.88, which are suitable for self-biased applications [6]. In order to increase this value, we optimized several stages of the fabrication process. In the present work, we focus on the role played by the morphology of the goethite crystallites (which are used as a precursor) and on the quality of BaM particle packing. We show that the shape and aspect ratio of the goethite crystallites are critical parameters for obtaining high MR/MS values, and that they were not taken into account before [14,15].
In the case where the dispersion of the axes of easy magnetization of the material is random, i.e., when the material has no magnetic texture, the law of approach to saturation (LAS) is commonly used to describe the first magnetization curve [21]. However, when used under its most usual formulation, the LAS applies only to the specific case where the material is constituted of particles dispersed at random, and they consequently show a random distribution of their easy axes of magnetization. This state defines the lower degree of the magnetic texture. The LAS is not adapted to the case of a partly or a fully oriented material and should not be used as is. Consequently, it is desirable to have a LAS that is applicable to textured materials. Our purpose is to determine the magnetization curve of a material where the magnetic texture lies between random and perfectly oriented.
The aim of the present work is twofold. Firstly, we present a new method for manufacturing BaFe12O19 materials with different magnetic texturing grades. The novelty and salient point of our method lie in the use of goethite crystallites with an optimized shape and aspect ratio. The value obtained for the remanent magnetization MR/MS of the BaM material increases from 0.54 to 0.81 when the angular dispersion of the easy axis of magnetization varies from 60° to 10° (XRD measurements). The magnetocrystalline field HK is measured from microwave experiments. Secondly, we propose a new formulation of the LAS, partly based on structural characterizations, where the spatial dispersion of the easy axis of magnetization in grain-oriented polycrystals of hexagonal materials is considered, and from which the angular dispersion value of the BaM particles could be inferred.

2. Experimental Details

X-ray diffraction measurements are carried out on a Panalytical Empyrean with Chi-Phi-Z configuration using Cu Kα radiation over a 2θ range from 15° to 60°. The parameters Z, Chi, and Omega are adjusted for each sample.
The microstructures of the samples are imaged by a scanning electron microscope Hitachi-S-3200N (Japan). The hysteresis loops of the sintered samples are measured at room temperature using a Vibrating Sample Magnetometer EZ9 from MicroSense (Lowell, MA, USA), with maximum applied field intensity equal to 1500 kA/m. Each sample was maintained on a Pyrex sample holder, with its c-axis (this axis being defined by the direction of the applied pressure during compaction, as explained below) aligned firstly parallel, and then perpendicular, to the applied field, in order to measure the hysteresis loops in both directions. The sample oscillated at a frequency of 70 Hz and averaged for 3 s. The demagnetizing correction is further carried out by applying the relationship Hi = H-NM, where Hi is the internal filed and H the applied field. The values of the demagnetizing factor N are tabulated in [22]. The frequency evolution of the imaginary part of the magnetic permeability is extracted from S parameters measured by a ZVA67 vector network analyzer (Rohde & Schwarz, Munich, Germany) in the frequency band [10 GHz–60 GHz]. The frequency evolution of the imaginary part of the magnetic permeability is extracted in using a Rohde and Schwarz ZVA67 vector network analyzer in the frequency band [10 GHz–60 GHz]. The anisotropy field HK is deduced from the resonant frequency fR determined by the maximum of the imaginary part µ” of the intrinsic permeability of the sample from the relationship between HK and fR, which writes fR = γHK, where γ is the gyromagnetic ratio (γ = 35.12 × 10⁻³ MHz/A.m−1).

3. Results and Discussion

3.1. Manufacture of a Self-Polarized BaM Sample

The polycrystalline BaFe12O19-oriented samples were made using barium carbonate BaCO3 (Acros-organics, Nidderau, Germany, 99%) and goethite FeO(OH), which was synthetized in the laboratory from iron III hexahydrate (Sigma-Aldrich, Saint Louis, MS, USA, 98%). For the sake of confidentiality, the synthesis process is not detailed. These components were carefully mixed with a manual mortar. The mixtures obtained were pressed into cylindrical pellets (7 mm diameter and 5 mm thickness) at a pressure of 320 MPa using a uniaxial hydraulic press. The direction of the applied pressure defined the c-axis, which was normal to the upper side of the pellets. The pellets were further heated to 1040 °C with zero dwell time and heating and cooling rates of 3 K/min.
During compaction, the applied pressure orients the goethite crystallites along the compaction axis (Figure 1a). We first considered the synthesized goethite crystallites: they are lath-shaped, with a crystallographic axis [001] that is oriented perpendicular to the largest face of the crystallite (Figure 1d). The pressure applied during the molding step leads to a preferential orientation of the goethite crystallites, the [001] axes of which being predominantly parallel to the direction of the applied pressure. The X-ray diffraction pattern of the goethite before and after the pressing process confirm a preferential orientation of the goethite close to the direction [001]. The direction [101], which is closest to [001] among these that contribute to the diffraction pattern, is clearly the one that remains, with a strong intensity (Figure 1a,b), whereas all the others Bragg diffraction peaks are extinguished. The Rietveld analyses performed (Table 1) using Jana2020 (Institute of Physics, Prague, Czech Republic) [23] give a preferred orientation axis [001] with an r-factor of 0.39. This preferential orientation of the [001] axes is maintained during the various topotactic reactions that occur during the subsequent heat treatment leading to the formation of BaFe12O19 [24,25,26]. The chemical processes that lead to BaFe12O19 from oriented goethite crystallites are as follows:
2 αFeO(OH)[001] → αFe2O3[001] + H2O
αFe2O3[001] + BaCO3 → BaFe2O4[001]
BaFe2O4[001] + αFe2O3[001] → BaFe12O19[001]

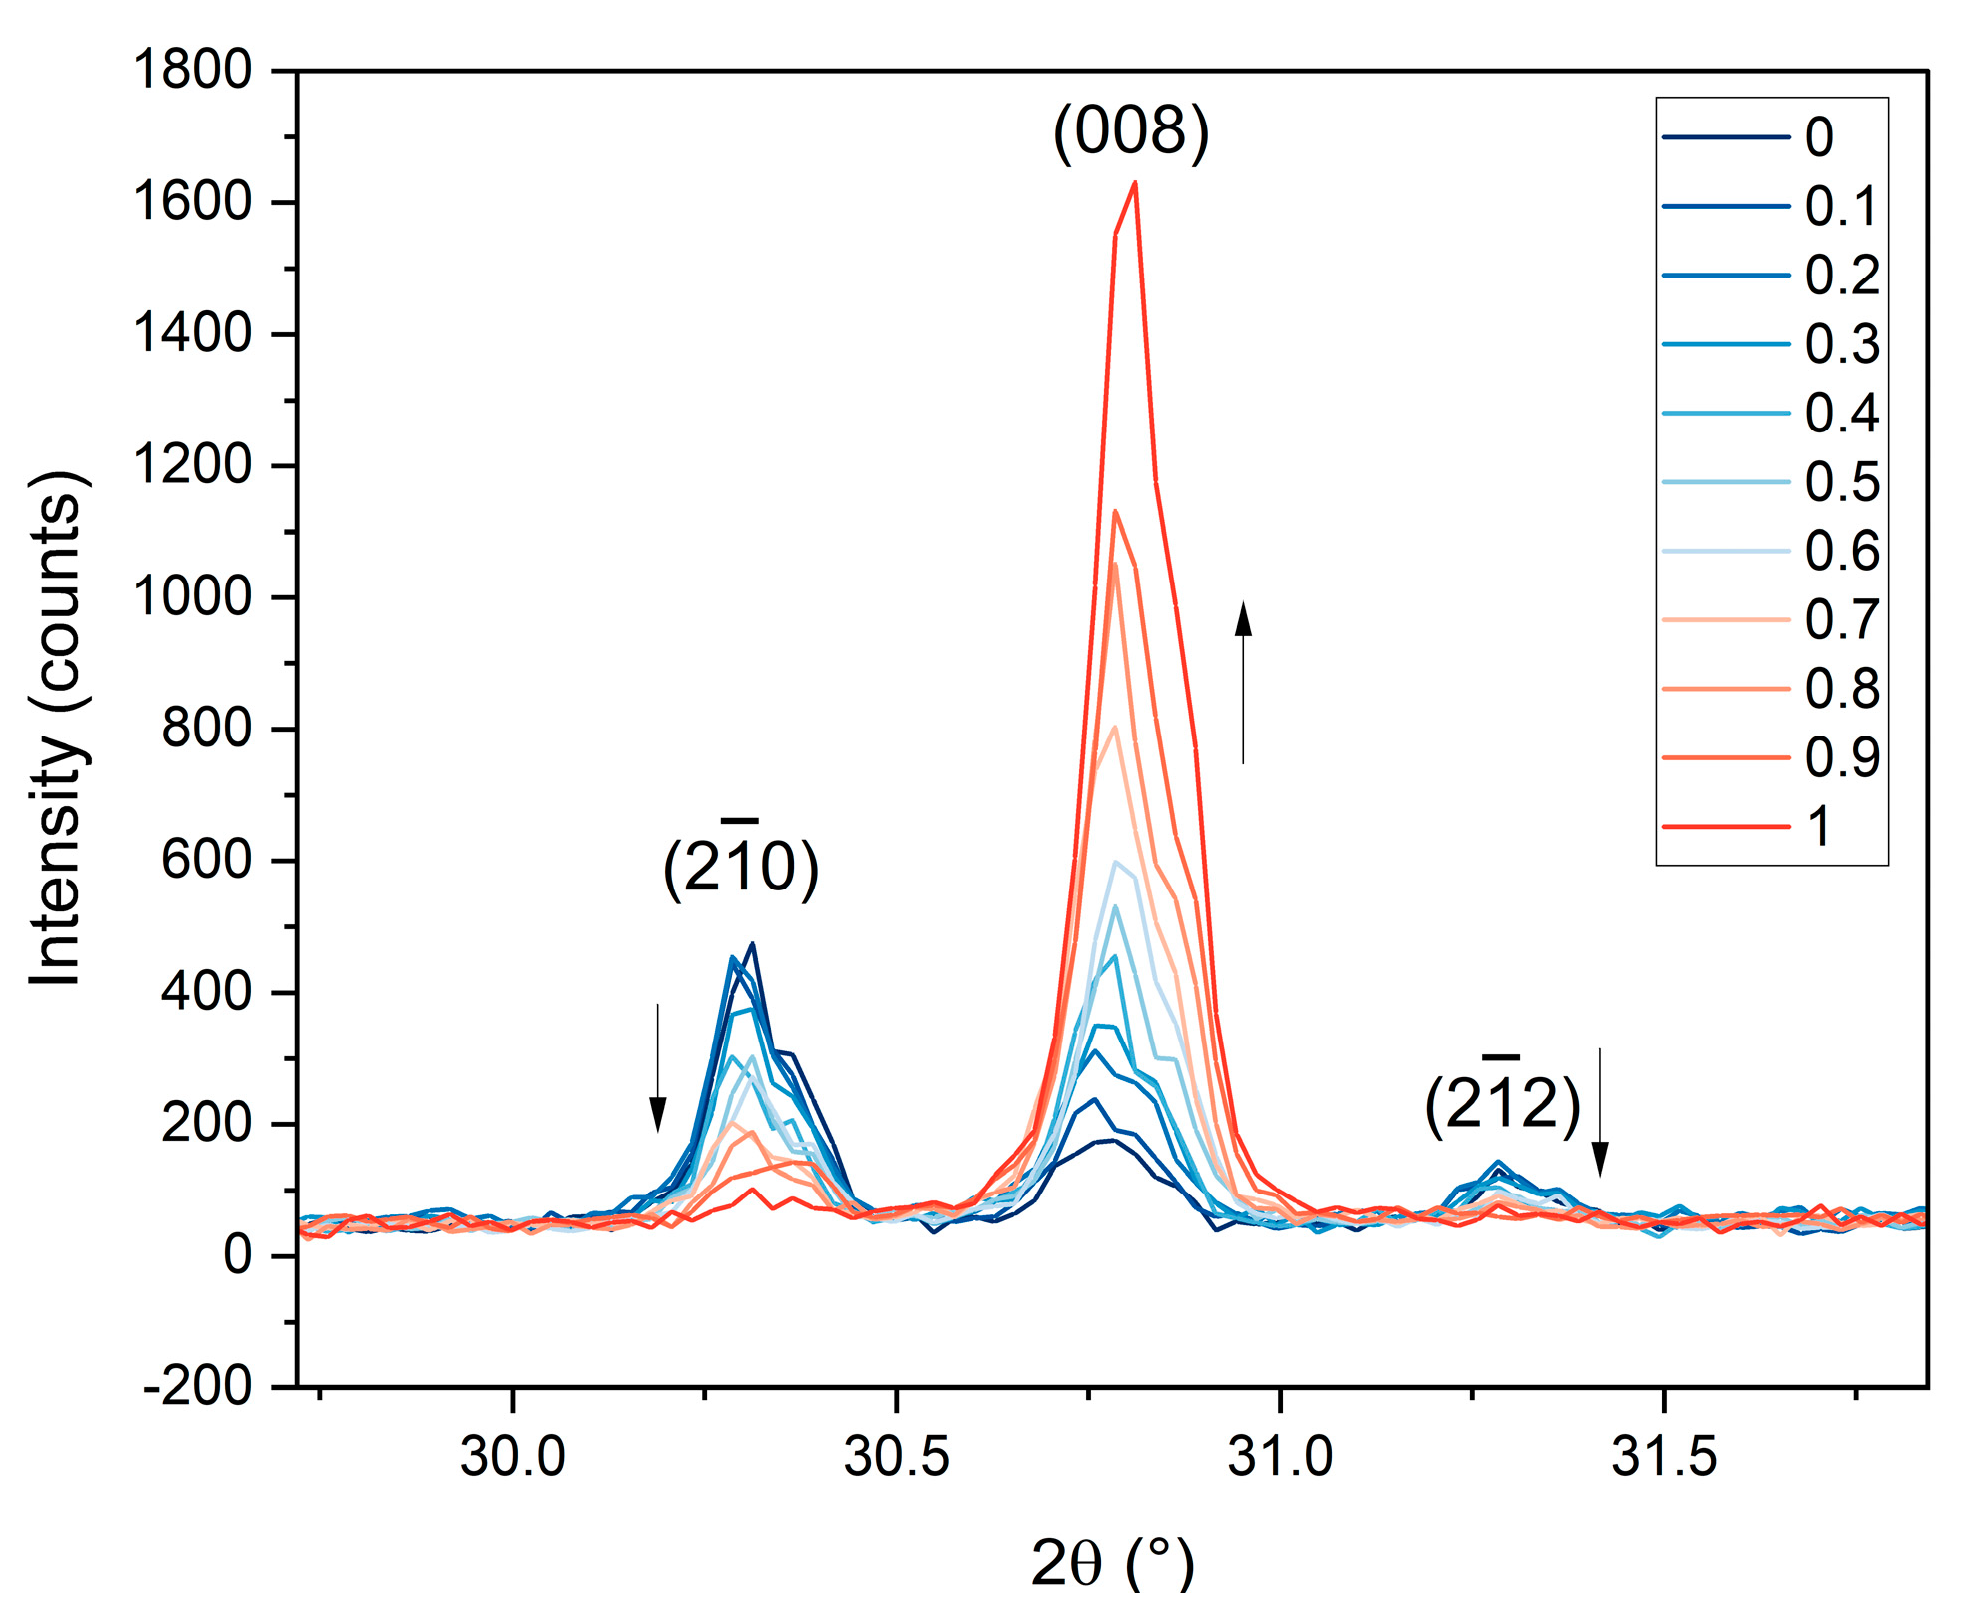
3.2. The Aspect Ratio of the Goethite Particles: Its Major Role on the Quality of the BaM Particles Stacking

It was found that the aspect ratio of width to length η of the goethite impacts the stacking quality of the resulting BaM crystallites. The X-ray patterns of the three samples obtained with G1, G2, and G3 clearly show an improvement of the stacking quality with increasing η (Figure 2d), and the intensity ratio I(008)/I(107) increases with η (Table 2). It is expected that these results might be significantly improved by optimizing the heat treatment after compaction. Further studies are ongoing.

3.3. Manufacturing of BaM Samples with Differents Grades of Orientation

The polycrystalline BaFe12O19 samples were synthesized using barium carbonate BaCO3 (Acros-organics, 99%), ferric oxide Fe2O3 (Sigma-Aldrich, 99%), and goethite FeO(OH) synthetized in the laboratory from iron III hexahydrate (Sigma-Aldrich, 98%). Keeping the 1:12 molar ratio for Ba:Fe and with different molar proportions of Fe2O3 and FeO(OH), a total of eleven samples were prepared. These components were carefully mixed with a mortar, with molar ratios ρ = Fe2O3:FeO(OH) varying from 0 to 1 (Table 3). The so-obtained mixtures were pressed into cylindrical pellets (with dimensions of 7 mm diameter and 5 mm thickness) at a pressure of 320 MPa using a uniaxial hydraulic press. The direction of the applied pressure defined the c-axis, perpendicular to the upper side of the pellets. The pellets were further heated to 1040 °C, with zero dwell time and heating and cooling rates set to 3 °C/min.
The effect of the applied pressure was different on hematite particles than on goethite crystallites. This is a key point of the manufacturing process, which we will emphasize. Now we consider the hematite particles, which have a spherical shape (Figure 3): because the applied pressure does not have any effect on the orientation of these particles, their crystallographic axes remain randomly oriented.
The initial ratio of Fe2O3:FeO(OH) drives the amount of randomly oriented or oriented BaFe12O19 crystals. Figure 4a,b are SEM images evidencing the differences in texture between randomly oriented crystallites in sample BaM-0 (prepared with hematite only) and stacked crystallites in sample BaM-100 (prepared with goethite only).

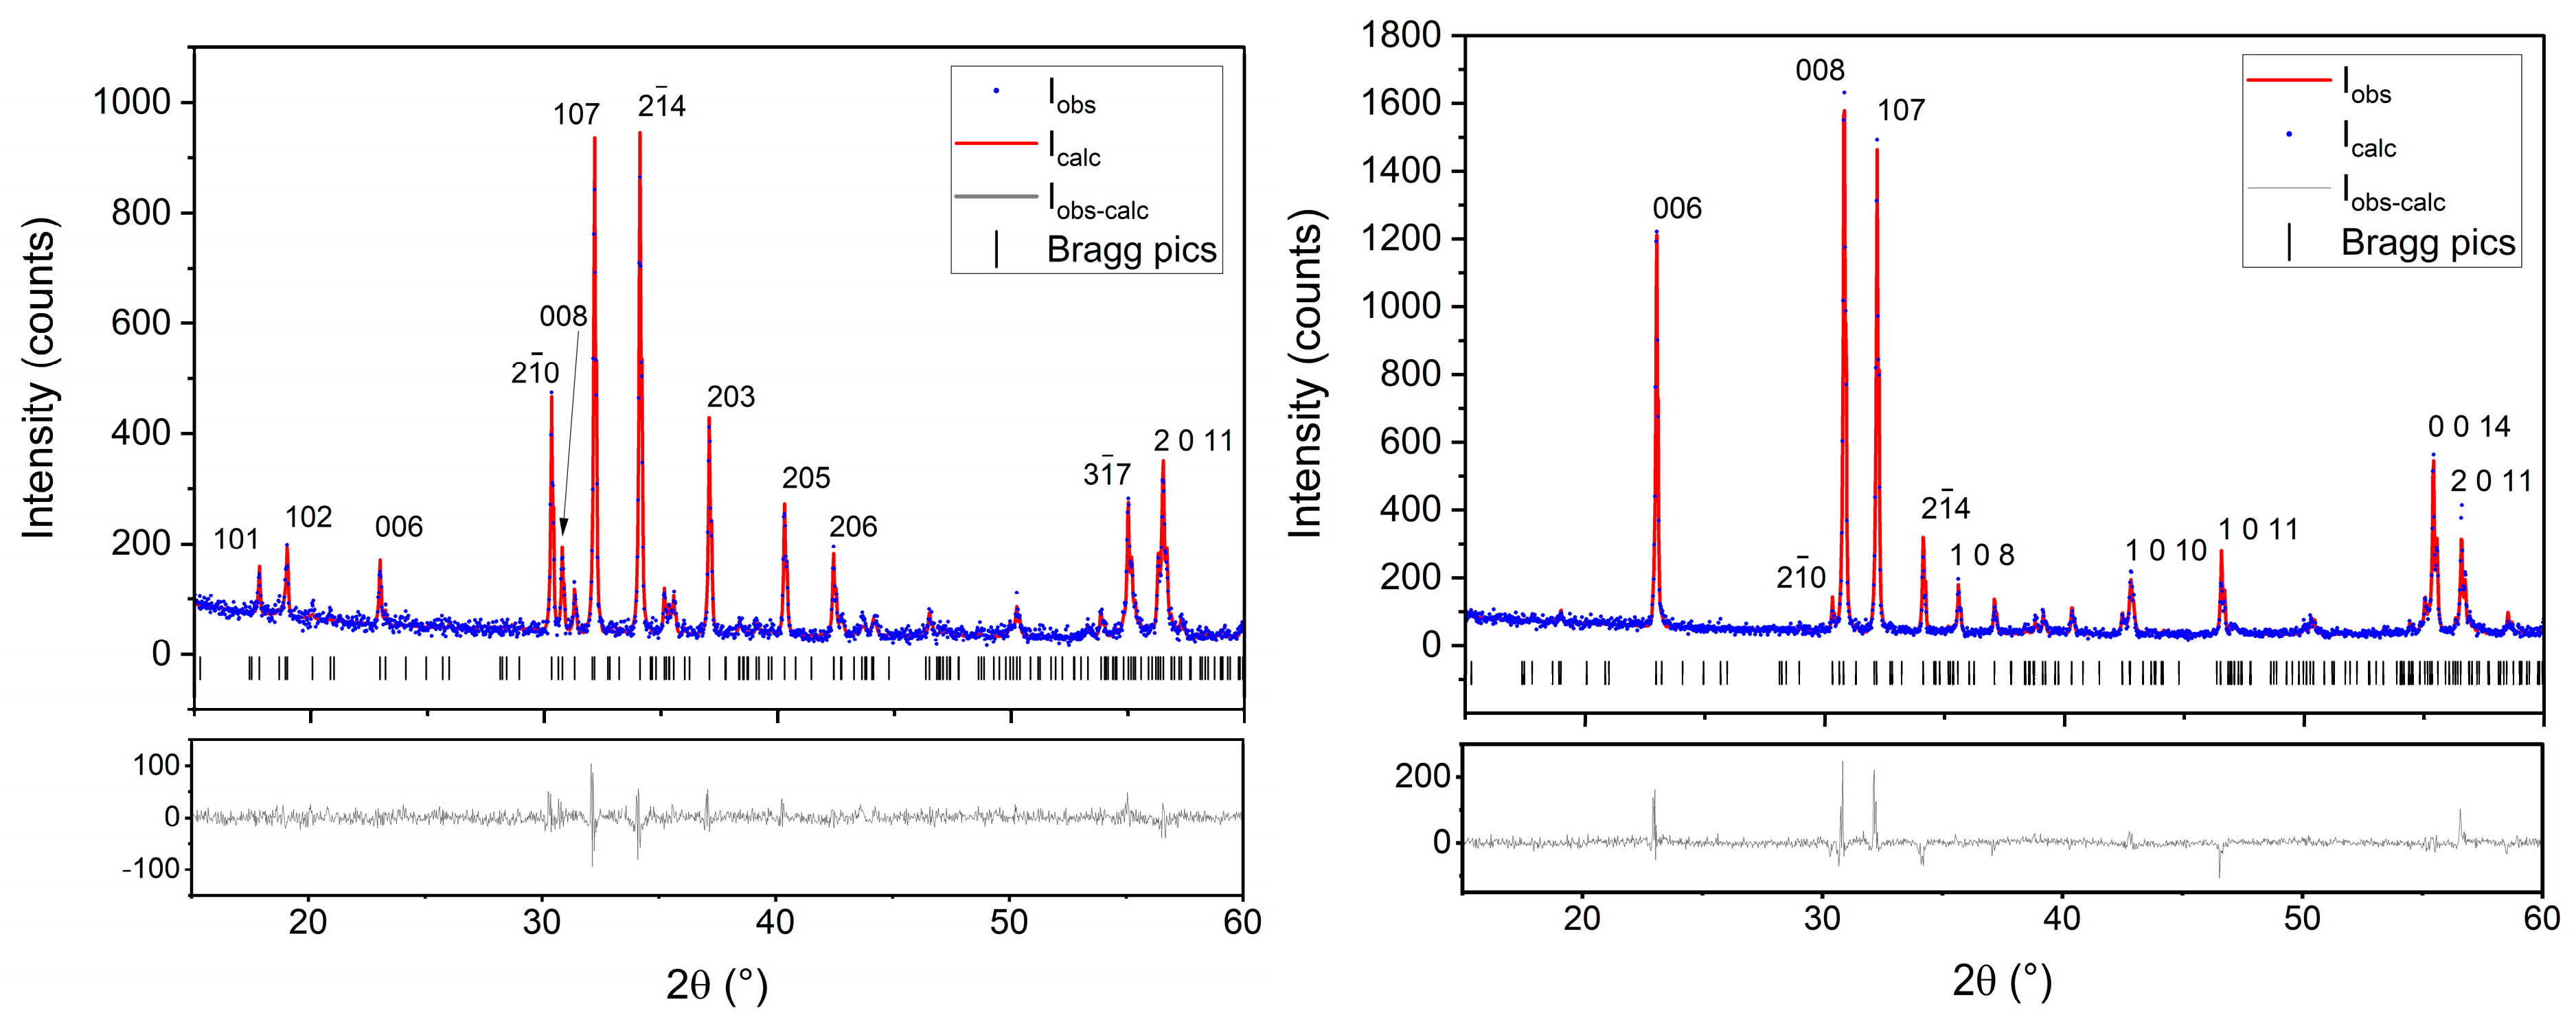
3.4. Crystallographic Study of BaM Samples Manufactured with Different Texturations

X-ray diffraction data were processed with HighScore Plus software (Panalytical, UK) [27] for phase analysis and Jana2020 for Rietveld analysis. The latter made it possible to examine the purity of the samples and to characterize the stacking of the crystallites. The crystallographic model used comes from the ICSD 259873 CIF file with cell parameters a = b = 5.8909 Å, c = 23.1882 Å and space group symmetry P63/mmc. The Rietveld analysis shows that all samples are single-phase (Figure 5). After refinement, the cell parameters and R factors for BaM-0 are a = b = 5.8928 Å, c = 23.2295 Å and Robs = 3.67, wRobs = 4.47, Rall = 4.78, wRall = 4.68, GOF = 1.19, whereas and BaM-100, they are a = b = 5.8921 Å, c = 23.2161 Å and Robs = 5.41, wRobs = 5.60, Rall = 6.42, wRall = 5.79, GOF = 1.26.
When comparing the X-Ray diffraction pattern of all the samples from BaM-0 to BaM-100, it appears that (00l) basal reflections become stronger (Figure 5). This is explained by an increasing orientation of the crystallites [28]. More specifically the (008) reflection becomes stronger with the increasing goethite to hematite molar ratio, meaning that the rate of oriented BaM particles increases as well (Figure 6).
XRD data make it also possible to obtain information on the distribution of the orientation of the crystallites. Among the several mathematical models available (e.g., Sasa-Uda [29], Capkova, and Valvoda [30]), the March–Dollase approach [31] is used for the determination of the degree of preferred orientation. The March–Dollase model, developed to describe the compaction of platelike grains under uniaxial stress [32], states that the fraction P(θ) of crystallites having the inclination angle θ between the normal to the diffraction plane and the hkl plane is defined:
P ( θ ) = ( r 2 cos 2 ( θ ) + sin 2 ( θ ) r ) 3 2
The March–Dollase factor, denoted r, defines the spread of angular distribution of the crystallite inclinations. It is extracted from XRD data using Rietveld refinement with Jana2020. If the maximum of the orientation distribution does not occur for the [001] direction, which is most often the case, the distribution is shifted so that θ = 0 represents the easy axis of magnetization [001]. Thus, for the determination of the factor r with a direction [hkl] different than [001], the relation P(θ) with ω the angle between [001] and [hkl] becomes:
P ( θ ) = ( r 2 cos 2 ( θ ω ) + sin 2 ( θ ω ) r ) 3 2  
Rietveld analyses are used to extract the r factor for each sample, with the vector [1 0 16] to define the preferred orientation. The Rocking curve (Figure 7a) shows a difference of 3.6° between the maximum intensity of (008) reflection and the diffraction plane. This result confirms that the preferred orientation vector is around [1 0 16] because the angle between [1 0 16] and [0 0 1] is 3.56°. The r-factor decreases linearly as a function of the molar percentage of goethite (Figure 7b). This result shows that the preferential orientation according to [001] is more important, as the initial proportion of goethite is greater. The variation of the orientation distributions as a function of the molar proportion of goethite is shown in Figure 8. Obviously, these conclusions might be directly applied to the spatial distribution of the easy axis of the hexagonal BaM platelets in each sample.

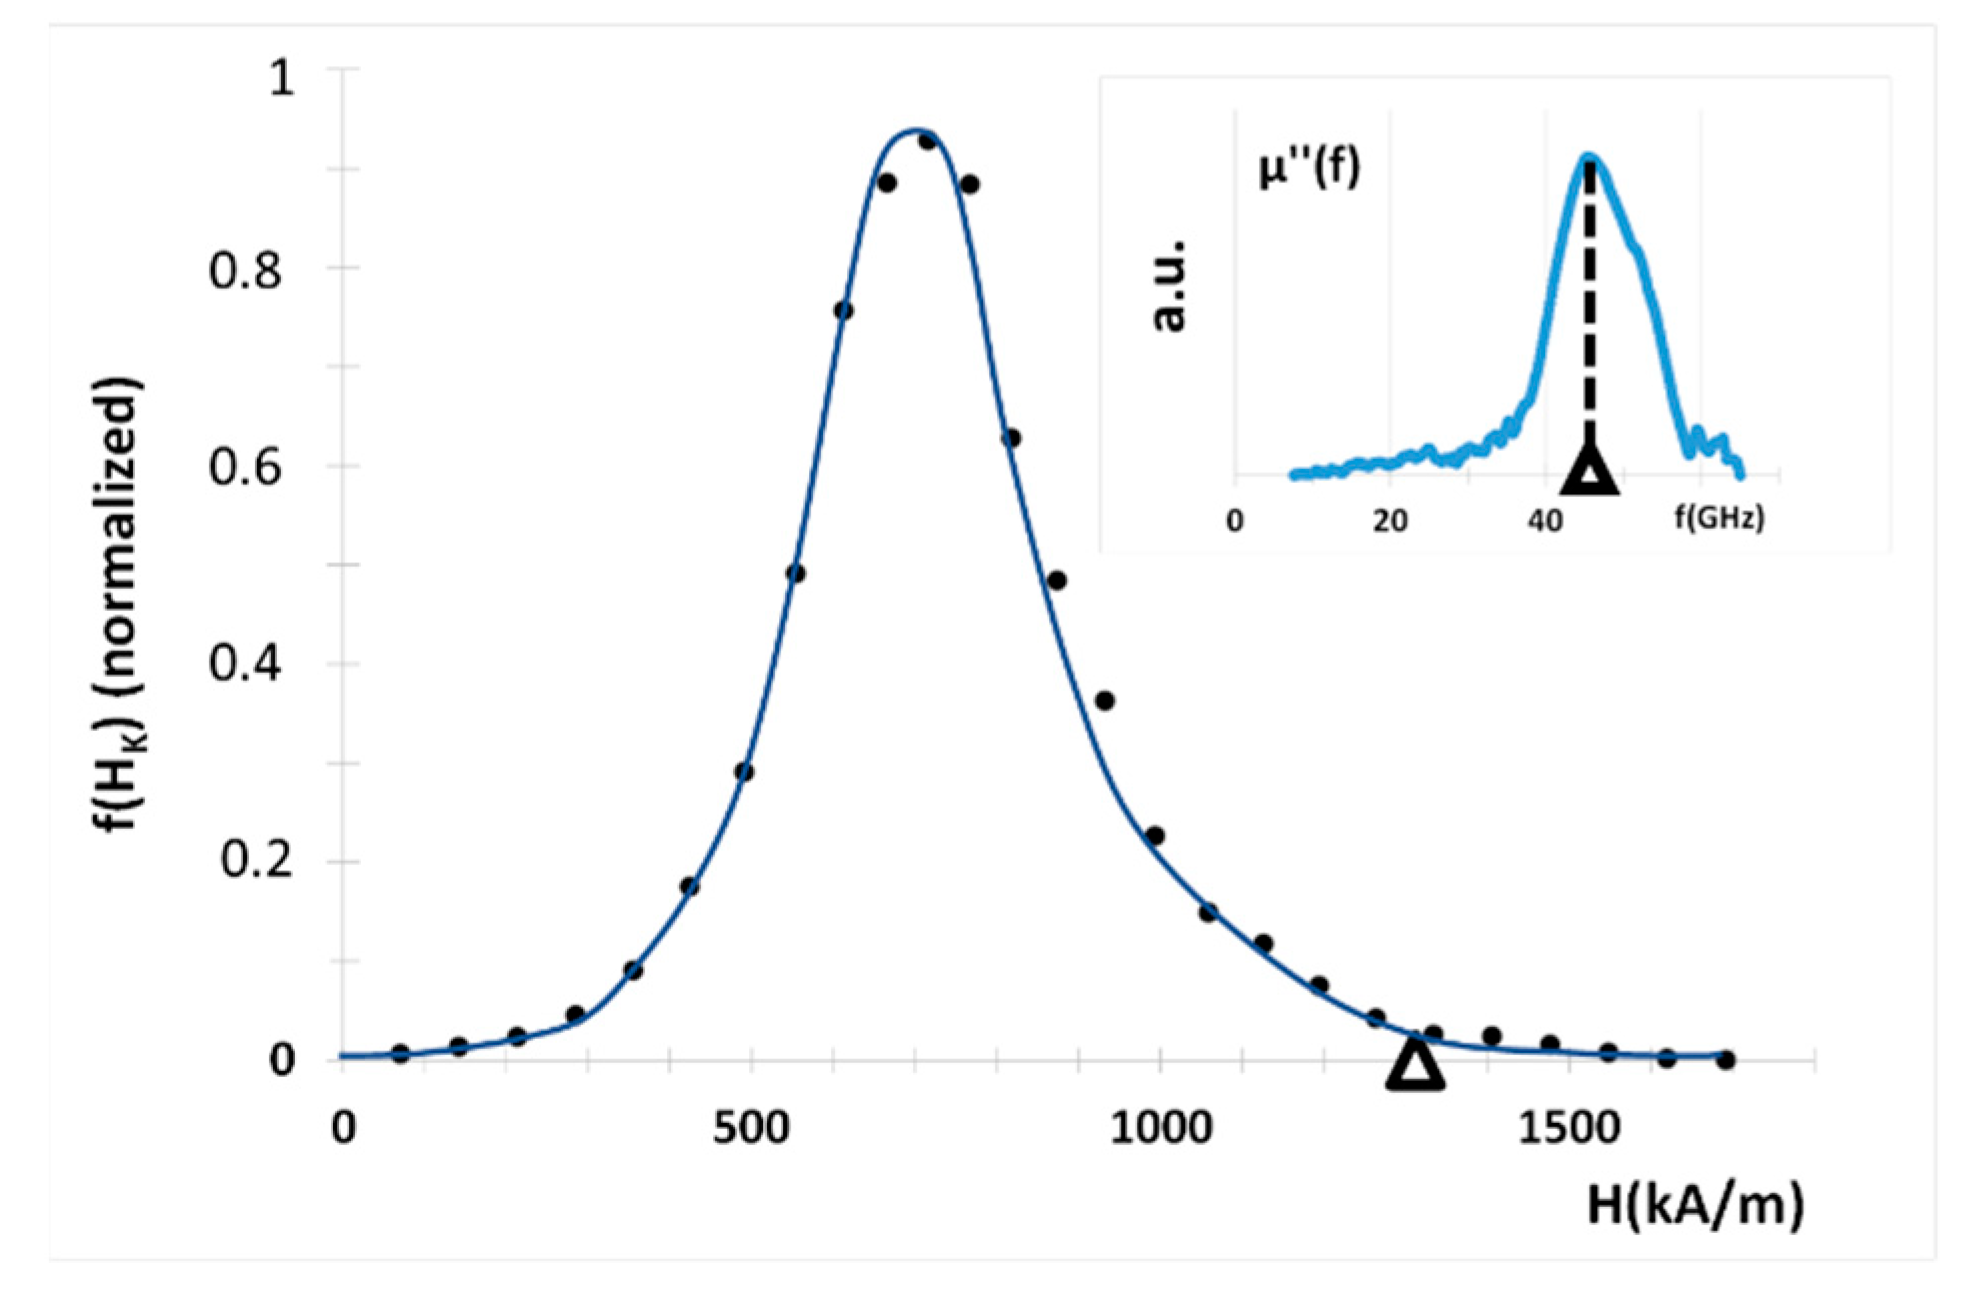
3.5. Experimental Investigations of the Magnetocrystalline Anisotropy

In the case of a hexagonal crystal, and omitting higher terms than the second order, the magnetocrystalline anisotropy energy is expressed as [2]:
E K ( θ m ) = K 1 sin 2 ( θ m ) + K 2 sin 4 ( θ m )
where K1 and K2 are magnetic anisotropy constants and θm is the angle between the magnetization and the c-axis (easy axis of magnetization.)
Then, the anisotropy field HK is given by [33]:
H K = 2 K 1 + 4 K 2 µ 0 M S
For non-substituted BaM, K2 = 0. The value of K1 is positive, equal to 5.4 105 erg/g [34], meaning that the easy axis of magnetization is parallel to the hexagonal c-axis. The uniaxial anisotropy field HK of BaM is typically in the 1320–1360 kA/m or 16.5–17 kOe range [10,35].

3.6. Microwave Measurement Method for Determining Anisotropy

A successful way of determining the magnetocrystalline anisotropy field of a magnetic material involves the measurement of its dynamic permeability in the high-frequency range. Thus, it is established that the maximum of the imaginary part µ’’ of the magnetic permeability µ (µ = µ’-jµ’’) occurs at a frequency fR which, in the absence of demagnetizing effects, is written fR = γHK, with γ and HK being the gyromagnetic ratio (γ = 2.8 MHz/kOe = 1.7608 × 10¹¹ s−1T−1) and the magnetocrystalline anisotropy field, respectively.
The broadband complex permeability of the BAM-0 sample was measured in the frequency band [10 GHz–60 GHz] by the transmission/reflection method using a Rohde and Schwarz ZVA67 vector network analyzer. The demagnetized sample was placed on the top of a high-frequency microstrip line to measure the transmission S21 and reflection S11 parameters. First, the effective permeability of the structure (microstrip line and sample) was calculated from the measured S-parameters using a specially written Matlab code based on the NRW equations [36]. Then, conformal mapping applied to permeability [37,38] was used to extract the intrinsic permeability of the sample from the effective multilayers structure. Finally, the anisotropy field HK of the hexaferrite was deduced from the resonant frequency determined by the maximum of the imaginary part µ” of the intrinsic permeability. The frequency evolution of µ’’(f) normalized to its maximum is shown in Figure 9. The maximum of µ’’(f) occurs for fR = 46.6 GHz, to which corresponds HK = 1330 kA/m (i.e., 16.6 kOe). This result agrees with the value of the anisotropy field HK of BaM ferrites, which is close to 1360 kA/m (i.e., 17 kOe). However, a distribution of switching fields inevitably appears in a given assembly of particles with shapes, sizes, morphological, and structural defects that vary from one particle to another, and then the anisotropy field thus determined should correspond to the higher value of the anisotropy field distribution f(HK).

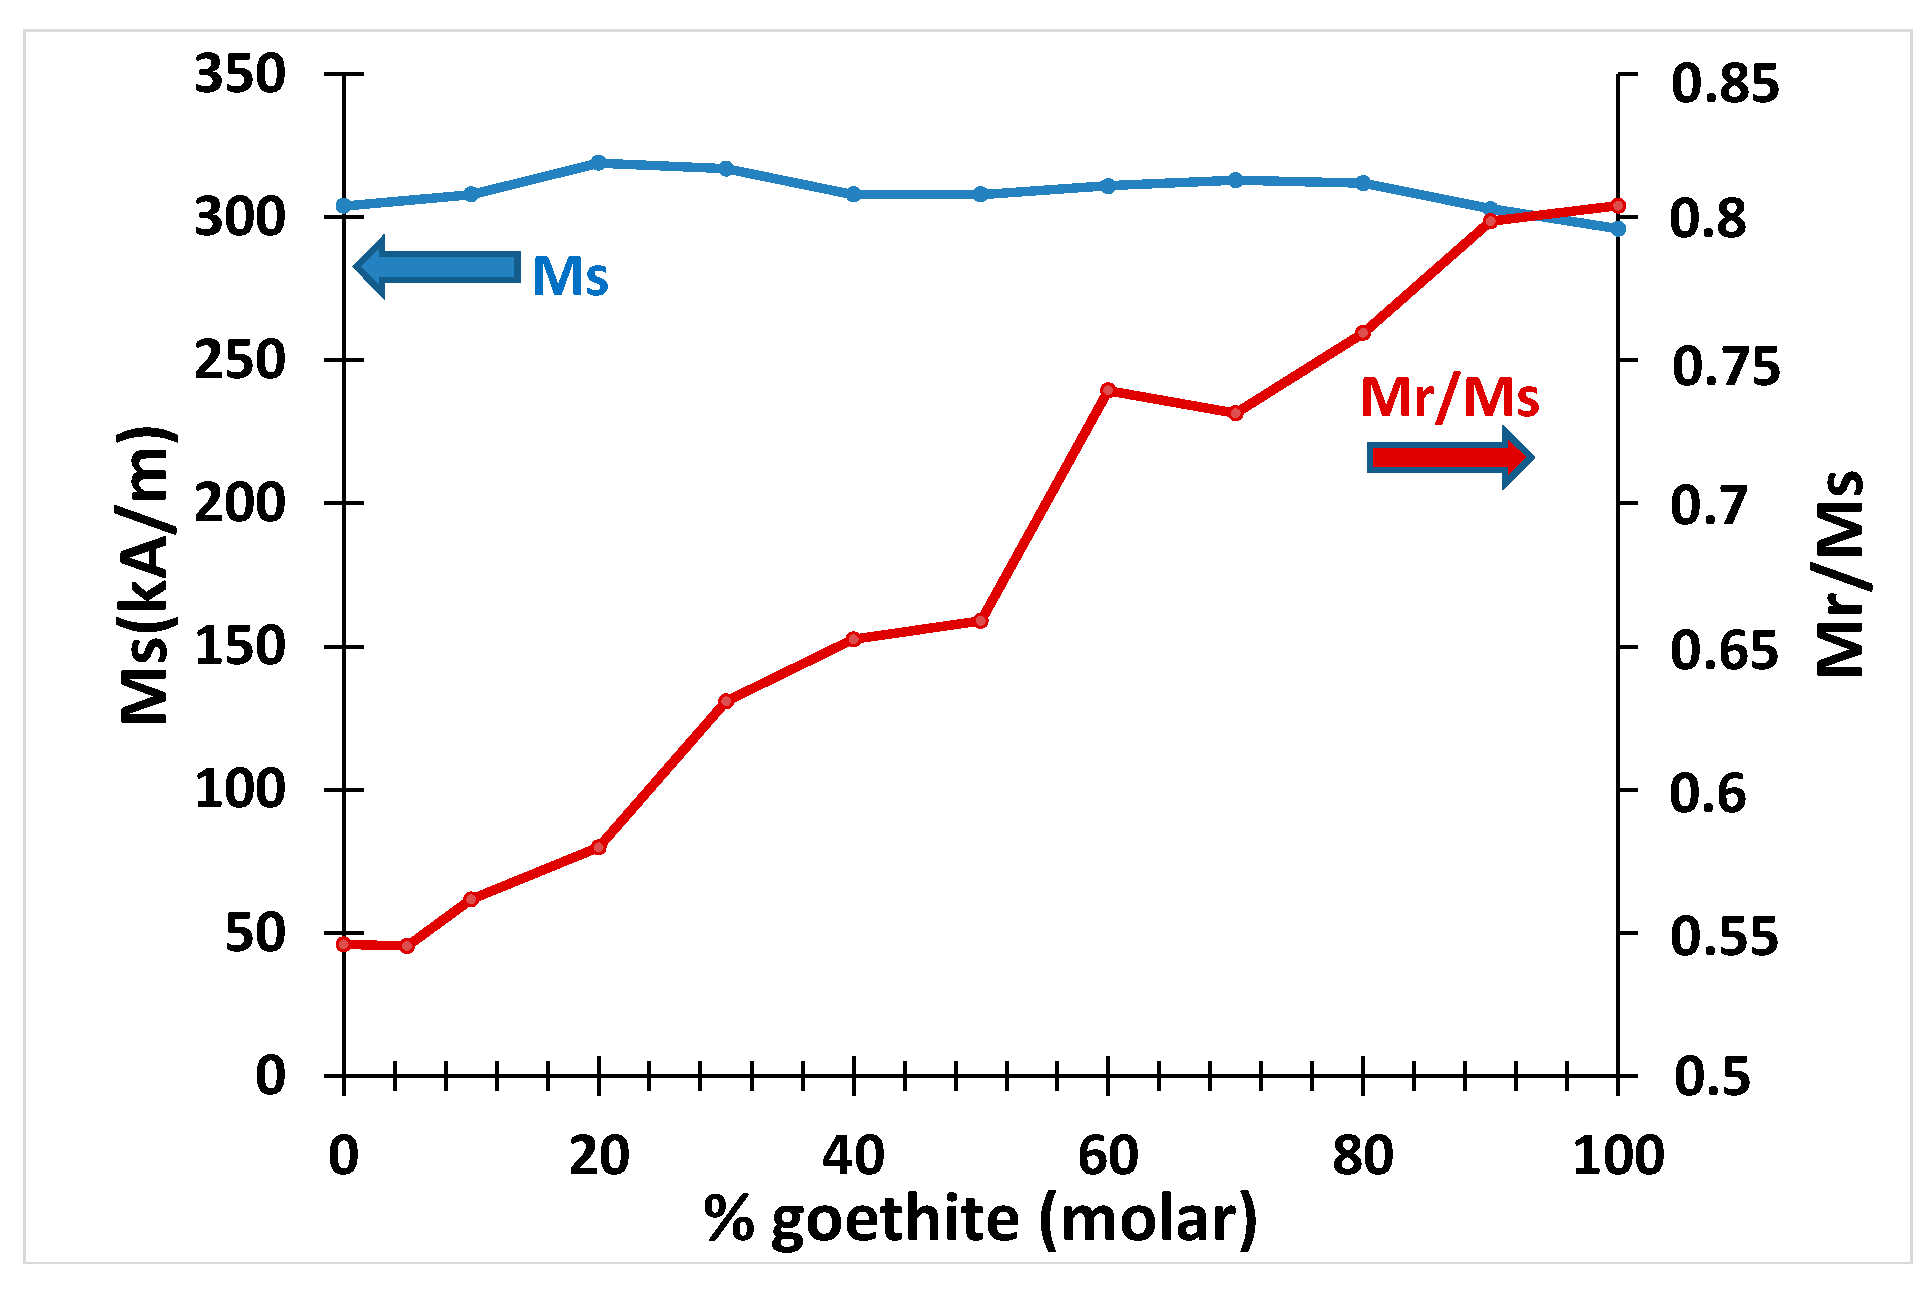
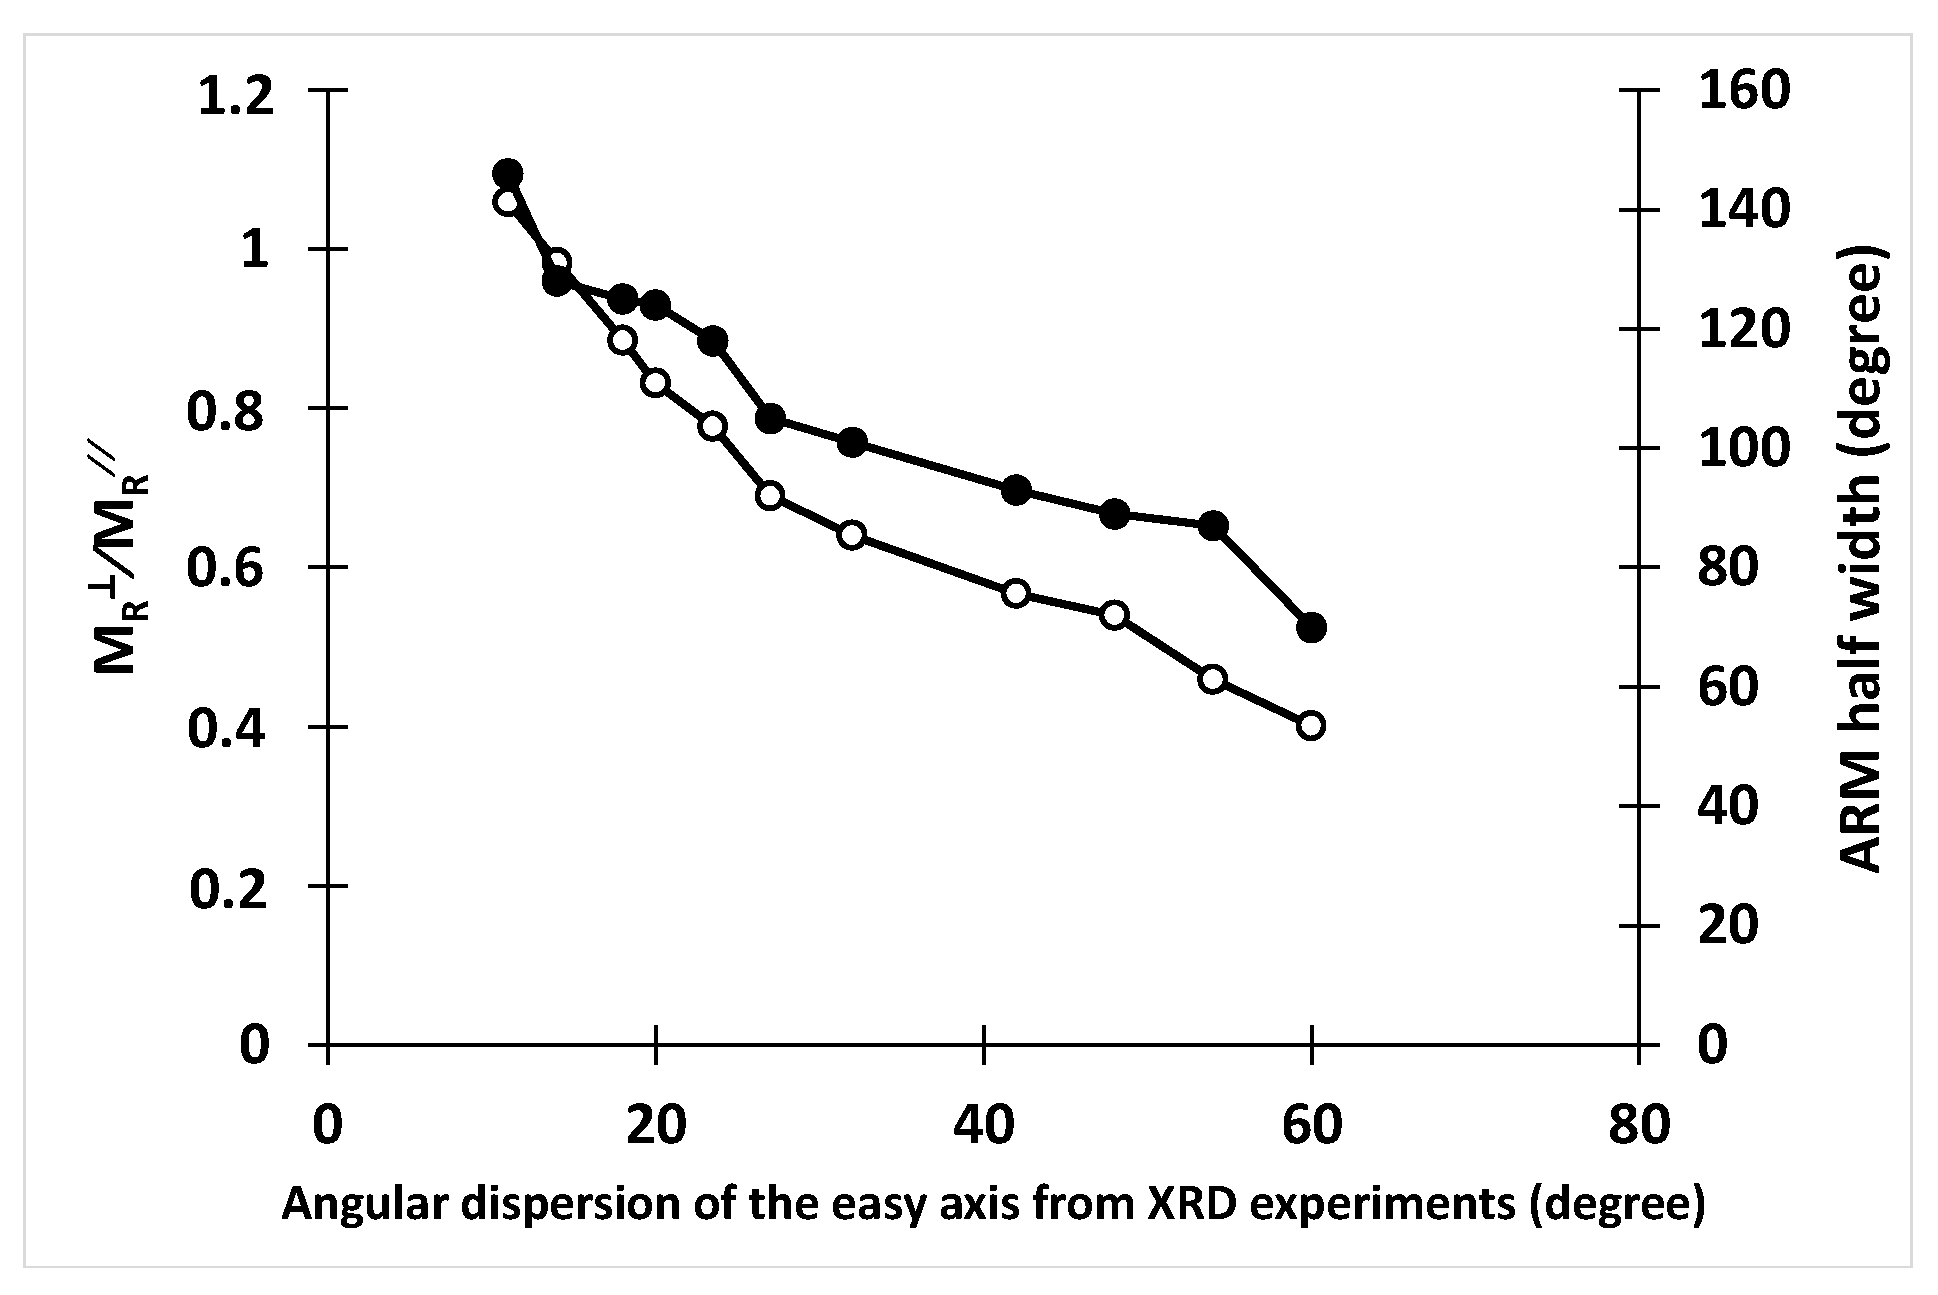
3.7. Isothermal Remanence Measurements

In order to clarify this point, we discriminated the anisotropy field distribution f(HK) from the switching field distribution. It was established that by measuring the initial remanence curve MR(H) a switching field distribution could be calculated [39], from which the HK-distribution function f(HK) could be obtained [39]. The switching field distribution was similar to the anisotropy field distribution in the situation where the particles diameter was below the critical single-domain size DC. For BaM, DC is about 0.5–1 µm [10], which is much larger than the typical diameter observed in this study. Therefore, it is legitimate to admit that SFD and f(HK) are similar. In the present study, the distribution f(HK) was obtained by the isothermal remanence measurement (IRM). The IRM measures the remanent magnetization as a function of an increasing magnetizing field starting from a demagnetized state. After demagnetizing the sample, a small field was applied and subsequently removed, after which the remanent magnetization was measured. This magnetization is plotted against the previously applied field. Next, a somewhat larger field was applied and subsequently removed, after which the next remanent magnetization was measured. The resulting curve MR(H) looks comparable to the virgin curve. For a random assembly of particles with uniaxial anisotropy, the anisotropy field distribution can be obtained by differentiating the reduced IRM curve (mR(H) = MR(H)/M, where M is for the maximum remanent magnetization value) after considering the effects of demagnetizing fields. The distribution function f(HK) is then obtained by readjusting the field scale, and where Hi is the internal magnetic field:
f ( H K ) = [ d m R ( H i ) d H i ] H i = H K 2  
Figure 10 shows f(HK) for the less-textured sample (BaM-0). In the higher fields, the distribution decreases slowly until the value ( H K ) M a x = 1370   kA / m   ( i . e .   16.6   kOe ) is reached (triangle symbol in Figure 10). The behavior in the high fields is still unclear; however, it could be ascribed to dipolar interactions between grains.
The anisotropy field value obtained from microstrip experiments, ( H K ) M a x = 16.6   kOe , is very close to the one for which f(HK) cancels. While the IRM measurements give the anisotropy field distribution, the microstrip line measurement method provides the maximum value of anisotropy field, which corresponds to the field to be applied to complete the coherent spin rotation in the Stoner and Wolfarth model [40].

3.8. The First Magnetization Curve and the Law of Approach to Saturation

The first magnetization curve of an isotropic polycrystalline material, as it approaches magnetic saturation, is commonly described using the law of approach to saturation, which expresses [2,41];
M ( H ) = M S ( 1 a H i b H i 2 ) + x P H i
MS is the saturation magnetization and Hi is the internal field (i.e., the applied field H0 corrected from the demagnetizing field: Hi = H0-Hd). The term a/H, which results from the presence of inclusions and defects, must vanish at high enough magnetic fields. The last term χP is a small high-field susceptibility, called paraprocess. It is due to high-field band splitting, and can be neglected below moderately applied fields intensities [2]. The b/H2 term arises from the magnetic moments reorientation when the anisotropy axis is misaligned with the applied field. It is directly related to the magnetocrystalline anisotropy (even HK or the first anisotropy constant K1). Then, the following relation (1) is commonly used to derived MS and the anisotropy field for an isotropic distribution of magnetic moments which can change direction only by rotating against the magnetic anisotropy [42,43]:
M ( H ) = M S ( 1 b H 2 )
If such a polycrystalline ferromagnet consists of randomly oriented, single-domain crystallites having uniaxial anisotropy, the coefficient b writes:
b = H k 2 15
The variation of M as a function of 1/H2 being linear for field values close to saturation therefore allows to determine both MS, and HK, as well as K1 (if the constant K2 is negligible compared to K1.)
The LAS can then be used to determine the magnetocrystalline anisotropy constant K1 and the saturation magnetization MS, for a random distribution of uniaxial crystals, from (7):
M ( H ) = M S ( 1 4 15 K 1 2 µ 0 M S 2 1 H 2 )  
However, the LAS as such does not apply when the spatial distribution of the particles is no longer random. This situation arises in the case of polycrystalline materials intended for the production of permanent magnets. In order to quantify more precisely the expected modifications to be applied to the LAS regarding the amount of granular texturization in the partly oriented hexaferrites used in this study, we propose to introduce in relation (9) an additional factor, which is intended to take into account the degree of disorientation of the particles, itself being a function of the initial ratio Fe2O3:FeO(OH).
To the best of our knowledge, the only work published in this area comes from Celasco et al. [44]. In [44], the saturation approach of polycrystalline magnetic materials made of randomly oriented, single-domain crystallites with cubic anisotropy and a preferential orientation was studied theoretically, and an adapted saturation-approach law was proposed. The orientation of the particles was described by an angular distribution of the axes of easy magnetization carried by the grains. The authors showed that the LAS writes:
M = M S ( 1 A c u b ( K 1 , K 2 , τ ) μ 0 × M S 2 × 1 H 2 )
where τ quantifies the orientation of the axes of easy magnetization. Following [45], the influence of the grain dispersion on the saturation-approach law is fully contained in the A c u b ( K 1 , K 2 , τ )   factor. In the case of a random dispersion of grains the function A c u b ( K 1 , K 2 , τ ) simply reduces to the usual expression for a cubic anisotropy, and to the first order [45]:
A c u b ( K 1 , K 2 , τ ) = 8 105 K 1 2
However, there is no equivalent expression in the published literature for a LAS that could be used in the case where the crystallites exhibit uniaxial anisotropy. Therefore, we have adopted an experimental approach, leading to the determination of a function A u n i ( K 1 , τ ) to the case of polycrystalline magnetic materials consisting of BaM grains of uniaxial anisotropy and with preferential spatial orientation (K2 = 0 for unsubstituted BaM). Hence, we assumed that the LAS can be written in a similar way as in [44]:
M = M S ( 1 A u n i ( K 1 , ρ ) μ 0 M S 2 1 H 2 )
Our purpose is to find out the experimental variation of the factor A u n i ( K 1 , ρ ) , where ρ is a parameter intended to take the grade of texturization into account. We made the reasonable assumption that the anisotropy field HK, as well as the anisotropy constant K1, are independent of the spatial dispersion of the platelets: the value of HK was supposed to be the one given in section IV: HK = 16.6 kOe. The value of K1 will be derived further from Equation (4), with K2 = 0.
The direction of the normal n to the basal surface of a sample defines its C axis. A magnetic field H0 is applied parallel to the C axis. The magnetization M is measured along this direction. The demagnetizing effects were taken into account, the internal field Hi being obtained by the relation Hi = H0-NZM, where NZ is the macroscopic demagnetizing field coefficient along the C axis. The value of NZ is fixed by the aspect ratio of the sample (thickness: diameter), as given in [22]. As the goethite content increases, the obtained hysteresis cycles evolve steadily from that characteristic of a random dispersion of uniaxial and monodomain particles for sample BaM-0 to that characteristic of a strongly self-polarized material for sample BaM-100 (Figure 11). For BaM-0, the hysteresis loops measured along the basal plane of the sample ( n direction) and perpendicular to n are completely identical due to the isotropy of the sample, whereas for BaM-100, these hysteresis loops are characteristic of an anisotropic material. The LAS was applied to the first magnetization curves using the relation (12) in the range of internal fields between 1384 kA/m and 1000 kA/m, typically.
The behavior of the measured magnetization M as a function of 1/Hi2 is strongly linear in this range (Figure 12), which confirms that both the constant a and the susceptibility χp of Equation (6) can be neglected in the high-field domain. The data extracted from M(H) loops and the LAS are reported in Table 4.

3.9. Discussion

The variation of the remanent magnetization MR///MS with the percentage of molar mass of goethite (Figure 13) attests the evolution of the texture of the samples from a random structure towards a state of ordered alignment of the easy axes. These results suggest that the actual angular dispersion of easy axis of magnetization (as described by MR///MS in Figure 13) is significantly larger than the angular dispersion of the crystal grains (Figure 8). This difference could be due to dipolar interactions between grains, which cannot be detected by XRD measurements.
From these fits, the value of Auni(K1,ρ)/K12 was determined for each sample (Table 4). The choice of the parameter for quantifying the spatial dispersion of the axes can be made among the following quantities: (a) the angular dispersion of the axes of easy magnetization, as determined in X-ray diffraction; (b) the ratio MRMR∕∕, where MR∕∕ and MR are the remanent magnetization measured perpendicular and parallel to the sample plane (i.e., presumably along the easy direction and in the magnetic hard plane, respectively) [4]; (c) the width at half height of the angular remanence measurement (ARM). The ARM measures the remanent magnetization as a function of the angle. This is achieved by turning the sample to a certain angle, applying the maximum field, reducing the field to zero, and measuring the resulting moment. The zero crossing marks the hard axis angle. The narrower the transition, the better defined the anisotropy direction is. By taking the derivative of this curve, a spread in the easy axis directions can be obtained (Figure 14). It is convenient to characterize the data by the full width at half-remanence α50 (see Table 4).
In [44], the angle between the cubic axis that forms the smallest angle with the direction of the applied field is chosen as to represent the grain-dispersion parameter τ (Equation (10)). There is a strong correlation between the angular dispersion of the axes of easy magnetization and both the ratio MRMR∕∕ on one hand, and with the width at half height α50 of the ARM, on the other hand (Figure 15).
Therefore, we admitted that these two parameters have a common significance, and we chose, as a parameter for quantifying the orientation of the easy axes, the half-height width of the ARM.
The variation of Auni(K1,ρ)/K12 is shown in Figure 16. Two points are added to the experimental data: one corresponding to a monocrystal, for which Auni = 0, and the other corresponding to a polycrystal with an ideal random distribution of easy axes, for which Auni = 4/15. Interestingly, these variations are not linear and have a maximum. This behavior is also reported on in [44] with regard to the calculated A c u b ( K 1 , K 2 , τ ) / K 1 2 . This was presented as a real effect and not due to the particular distribution function used to describe the dispersion of the grains in the polycrystal. As seen in Figure 16, it is obvious that the law of approach to saturation for isotropic crystals given by relation (9) is no longer suitable for textured crystals, even if the texture is weak. Instead, it is necessary to use a LAS of the same type as in relation (12), where the influence of the grain dispersion on the law of approach to saturation is fully contained in the Auni(K1,ρ) factor. In this present study, we found that once the constant K1 is determined, the angular grain-dispersion can be deduced from saturation-approach measurements.

4. Conclusions

BaM samples with different magnetic texturing grades are manufactured by controlled topotactical reaction by using hematite and goethite particles. It is demonstrated that the hematite: goethite ratio drives the texturization of the samples. The novelty of this study lies in the optimization of the aspect ratio of the goethite crystallites in view of an improved BaM texturization. We show that the optimization of the morphology of goethite crystallites improves the BaM particles’ orientation and stacking. The salient result of this study is the demonstration that by using a single cold compression process and a heat treatment, we can organize BaM particles stacking, which increases with the value of the aspect ratio of the goethite crystallites. The Rietveld refinements of powder diffractograms clearly revealed a particles-stacking enhancement, which is dependent not only of the hematite: goethite ratio but also of the optimal aspect ratio of goethite crystallites. This optimization resulted in a significant improvement of the remanent magnetization value, increasing it to 0.82 compared with the most recent literature. Additionally, we expect in the near future to further improve this value by optimizing the heat treatment after compaction. Based on this study, BaM materials are further manufactured with a controlled magnetic texture; therefore, they are partly self-polarized. They show a reduced-remanence magnetization MR/MS varying from 0.5 to 0.81, while the angular dispersion of the BaM particles’ easy axis of magnetization varies from 60° to 10°. The magnetocrystalline anisotropy field was measured: microwave measurements provided its maximum value, while its distribution function is obtained from IRM experiments. A law of approach to saturation was proposed and adapted to the case of uniaxial polycrystalline materials for which the particles stacking is only partial. In this law, the influence of the grain dispersion on the saturation approach is fully contained in an additional factor Auni(K1,ρ). The experimental values of Auni(K1,ρ) compare well with numerical data from the single study on this topic. It is suggested that by using the proposed law once the constant K1 is determined, the angular grain-dispersion can be deduced from saturation-approach measurements.

Author Contributions

A.H. has carried out the synthesis and the structural characterizations of the samples, he has contributed to the writing of the paragraphs dealing with the chemical parts and more generally to the review and editing of this research article. He has also contributed to the conceptualization and analysis of the materials. A.C. has performed the microwave measurements, and he has contributed to the writing of the paragraphs dealing with microwave measurements and the law of approach to saturation, as well as to the review of the article. J.-L.M. is a supervisor of the research project, supporting the work reported in this article. He has contributed to the conceptualization, methodology, and review of the work, he performed the magnetic measurements, and contributed to the writing of the associated paragraphs. All authors have read and agreed to the published version of the manuscript.

Funding

This work is partially supported by a public grant overseen by the French National Research Agency (ANR-20-ASTR-0010, CONTACT project).

Institutional Review Board Statement

No ethical approval required.

Informed Consent Statement

Not applicable.

Data Availability Statement

Data sharing is not applicable to this article.

Conflicts of Interest

The authors declare no conflict of interest.

References

  1. Mazaleyrat, F.; Zehani, K.; Pasko, A.; Loyau, V.; LoBue, M. XXIst century ferrites. J. Phys. Conf. Ser. 2012, 365, 12001. [Google Scholar] [CrossRef] [Green Version]
  2. Coey, J.M.D. Magnetism and Magnetic Materials; Cambridge University Press: Cambridge, UK, 2010. [Google Scholar]
  3. Coey, J.M.D. Permanent magnets: Plugging the gap. Scr. Mater. 2012, 67, 524–529. [Google Scholar] [CrossRef]
  4. Harris, V.G.; Geiler, A.; Chen, Y.; Yoon, S.D.; Wu, M.; Yang, A.; Chen, Z.; He, P.; Parimi, P.V.; Zuo, X.; et al. Recent advances in processing and applications of microwave ferrites. J. Magn. Magn. Mater. 2009, 321, 2035–2047. [Google Scholar] [CrossRef]
  5. Geiler, A.; Daigle, A.; Wang, J.; Chen, Y.; Vittoria, C.; Harris, V. Consequences of magnetic anisotropy in realizing practical microwave hexaferrite devices. J. Magn. Magn. Mater. 2012, 324, 3393–3397. [Google Scholar] [CrossRef]
  6. Mattei, J.L.; Le, C.N.; Chevalier, A.; Maalouf, A.; Noutehou, N.; Queffelec, P.; Laur, V. A simple process to obtain anisotropic self-biased magnets constituted of stacked barium ferrite single domain particles. J. Magn. Magn. Mater. 2018, 451, 208–213. [Google Scholar] [CrossRef]
  7. Turki, H.; Huitema, L.; Monediere, T.; Lenoir, B.; Breuil, C. Complete Methodology of Low-loss Ultra-wideband Junction Circulator. In Proceedings of the IEEE MTT-S International Microwave Symposium Digest, Philadelphia, PA, USA, 10–15 June 2018; Volume 2018, pp. 746–749. [Google Scholar]
  8. Olivier, V.; Huitema, L.; Lenoir, B.; Turki, H.; Breuil, C.; Pouliguen, P.; Monediere, T. Dual-Band Ferrite Circulators Operating on Weak Field Conditions: Design Methodology and Bandwidths’ Improvement. IEEE Trans. Microw. Theory Tech. 2020, 68, 2521–2530. [Google Scholar] [CrossRef]
  9. Turki, H.; Huitema, L.; Monediere, T.; Lenoir, B.; Breuil, C. New concept validation of low-loss dual-band stripline circulator. IEEE Trans. Microw. Theory Tech. 2019, 67, 845–850. [Google Scholar] [CrossRef]
  10. Pullar, R.C. Hexagonal ferrites: A review of the synthesis, properties and applications of hexaferrite ceramics. Prog. Mater. Sci. 2012, 57, 1191–1334. [Google Scholar] [CrossRef]
  11. El Shater, R.; El-Ghazzawy, E.; El-Nimr, M.K. Study of the sintering temperature and the sintering time period effects on the structural and magnetic properties of M-type hexaferrite BaFe12O19. J. Alloys Compd. 2018, 739, 327–334. [Google Scholar] [CrossRef]
  12. Barrera, V.; Betancourt, I. Hard magnetic properties of nanosized Sr(Fe,Al)12O19 hexaferrites obtained by Pechini method. J. Phys. Chem. Solids 2016, 93, 1–6. [Google Scholar] [CrossRef]
  13. Lotgering, F.K. Topotactical reactions with ferrimagnetic oxides having hexagonal crystal structures—I. J. Inorg. Nucl. Chem. 1959, 9, 113–123. [Google Scholar] [CrossRef]
  14. Vijayan, H.; Povlsen, A.; Thomas-Hunt, J.; Mørch, M.I.; Christensen, M. Exploiting different morphologies of non-ferromagnetic interacting precursor’s for preparation of hexaferrite magnets. J. Alloys Compd. 2022, 915, 165333. [Google Scholar] [CrossRef]
  15. Vijiayan, H. Ultrathin nanoplatelets of six-line ferrihydrite enhances the magnetic properties of hexaferrite. Mater. Chem. Front. 2021, 5, 3699–3709. [Google Scholar] [CrossRef]
  16. Sakai, T.; Chen, Y.; Chinnasamy, C.N.; Vittoria, C.; Harris, V.G. Textured Sc-Doped Barium—Ferrite Compacts for Microwave Applications Below 20 GHz. IEEE Trans. Magn. 2006, 42, 3353–3355. [Google Scholar] [CrossRef]
  17. Chen, Y.; Fitchorov, T.; Gao, J.; Koblischka-Veneva, A.; Koblischka, M.R.; Vittoria, C.; Harris, V.G. Topochemical growth of textured polycrystalline barium hexaferrite from oriented antiferromagnetic α-FeOOH nanorods. Nanotechnology 2009, 20, 445606. [Google Scholar] [CrossRef] [Green Version]
  18. Wang, J.; Yang, A.; Chen, Y.; Chen, Z.; Geiler, A.; Gillette, S.M.; Harris, V.G.; Vittoria, C. Self biased Y-junction circulator at Ku band. IEEE Microw. Wirel. Compon. Lett. 2011, 21, 292–294. [Google Scholar] [CrossRef]
  19. Harris, V.G.; Sokolov, A.S. The Self-Biased Circulator: Ferrite Materials Design and Process Considerations. J. Supercond. Nov. Magn. 2019, 32, 97–108. [Google Scholar] [CrossRef]
  20. Chen, Y.; Geiler, A.L.; Sakai, T.; Yoon, S.D.; Vittoria, C.; Harris, V.G. Microwave and magnetic properties of self-biesed barium ferrite sreen printed thick films. J. Appl. Pysics 2006, 99, 08M904. [Google Scholar] [CrossRef]
  21. Andreev, S.; Bartashevich, M.; Pushkarskya, V.; Maltsev, V.; Pamyatnykh, L.; Tarasov, E.; Kudrevatykh, N.; Goto, T. Law of approach to saturation in highly anisotropic ferromagnets Application to Nd-Fe-B melt-spun ribbons. J. Alloys Compd. 1997, 260, 196–200. [Google Scholar] [CrossRef]
  22. Chen, D.X.; Brug, J.A.; Goldfarb, R.B. Demagnetizing factors for cylinders. IEEE Trans. Magn. 1991, 27, 3601–3619. [Google Scholar] [CrossRef]
  23. Petrícek, V.; Dušek, M.; Palatinus, L. Crystallographic computing system JANA2006: General features. Z. Krist. 2014, 229, 345–352. [Google Scholar] [CrossRef]
  24. Cudennec, Y.; Lecerf, A. Topotactic Transformations of Goethite and Lepidocrocite into Hematite and Maghemite. Solid State Sci. 2005, 7, 520–529. [Google Scholar] [CrossRef]
  25. Pankov, V.; Bartholdson, Å.; Stukalov, O.; Smolenchuk, S.; Babushkin, O.; Gremenok, V. Growth of BaFe12O19 Thin Films Formed by Reactive Diffusion. J. Cryst. Growth 2003, 252, 382–390. [Google Scholar] [CrossRef]
  26. Timofeev, A.V.; Kostishin, V.G.; Chitanov, D.N. The influence of power ferritization technology on the degree of magnetic structure in plates of BaFe12O19 and SrFe12O19 hexaferrites. Technical Physics Letters 2019, 45, 401–403. [Google Scholar] [CrossRef]
  27. Degen, T.; Sadki, M.; Bron, E.; König, U.; Nénert, G. The HighScore Suite. Powder Diffr. 2014, 29, S13–S18. [Google Scholar] [CrossRef] [Green Version]
  28. Cullity, B.D.; Stock, S.R. Elements of X-ray Diffraction; Prentice-Hall: Hoboken, NJ, USA, 2001; ISBN 0201610914. [Google Scholar]
  29. Uda, M. The Structure of synthetic Fe3S4 and the Nature of Transition to FeS Z. Anorg. Allg. Chem. 1967, 350, 105. [Google Scholar] [CrossRef]
  30. Capkova, P.; Valvoda, V. Preferred orientation in powder samples of magnesium and magnesium-cadmium alloys. Czech. J. Phys. 1974, 24, 891–900. [Google Scholar]
  31. Dollase, W.A. Correction of intensities for preferred orientation in powder diffractometry: Application of the March model. J. Appl. Crystallogr. 1986, 19, 267. [Google Scholar] [CrossRef]
  32. Zevin, L.; Kimmel, G. Quantitative X-ray Diffractometry; Springer: New York, NY, USA, 1995. [Google Scholar]
  33. Durst, K.D.; Kronmüller, H. Determination of intrinsic magnetic material parameters of Nd2Fe14B from magnetic measurements of sintered Nd15Fe77B8 magnets. J. Magn. Magn. Mater. 1986, 59, 86–94. [Google Scholar] [CrossRef]
  34. Kreisel, J.; Vincent, H.; Tasset, F.; Paté, M.; Ganne, J.P. An investigation of the magnetic anisotropy change in BaFe12-2xTixCoxO19 single crystals. J. Magn. Magn. Mater. 2001, 24, 17–29. [Google Scholar] [CrossRef]
  35. Smit, J.W. Ferrites: Physical Properties of Ferrimagnetic Oxydes in Relation to Their Technical Applications; Wiley: New York, NY, USA, 1959. [Google Scholar]
  36. Baker-Jarvis, J.; Janezic, M.D.; Riddle, B.F.; Johnk, R.T.; Kabos, P.; Holloway, C.L.; Geyer, R.G.; Grosvenor, C.A. Measuring the Permittivity and permeability of Lossy Materials: Solid, Metals, Building Materials, and Negative-Index Materials; U.S. Government Printing Office: Washington, DC, USA, 2004.
  37. Pucel, R.; Masse, D. Microstrip propagation on magnetic substrates—Part I: Design theory. IEEE Microw. Theory Tech. 1972, 20, 304–308. [Google Scholar] [CrossRef]
  38. Wan, C.; Hoorfar, A. Improved Design Equations for Multilayer Microstrip Lines. IEEE Microw. Guided Wave Lett. 2000, 10, 223–224. [Google Scholar]
  39. Pfeiffer, H. Determination of Anisotropy Field Distribution. Phys. Satus Soliidi A 1990, 118, 295–306. [Google Scholar] [CrossRef]
  40. Stoner, E.C.; Wolhfarth, E.P. A mecanism of hysteresis in heterogeneous alloys. Philos. Trans. R. Soc. A Math. Phys. Eng. Sci. 1948, 840, 599–642. [Google Scholar]
  41. Grossinger, R. A Critical Examination of the Law of Approach to Saturation. Phys. Stat. Sol. 1981, 66, 665–674. [Google Scholar] [CrossRef]
  42. Néel, L.; Pautenet, R.; Rimet, G.; Giron, V. On the laws of magnetization of ferromagnetic single crystals and polycrystals. Application to uniaxial compounds. J. Appl. Phys. 1960, 31, S27–S29. [Google Scholar] [CrossRef]
  43. Herbst, J.; Pinkerton, F. Law of approach to saturation for polycrystalline ferromagnets: Remanent initial state. Phys. Rev. B Condens. Matter Mater. Phys. 1998, 57, 10733–10739. [Google Scholar] [CrossRef]
  44. Celasco, M.; Mazzeti, P. Saturation Approach Law for Grain-Oriented Polycrystalline Magnetic Materials. IEEE Trans. Magn. 1969, 5, 372–378. [Google Scholar] [CrossRef]
  45. Grössinger, R.; Sassik, H.; Holzer, D.; Pillmayr, N. Magnetic characterization of soft magnetic materials—Experiments and analysis. J. Magn. Magn. Mater. 2003, 254–255, 7–13. [Google Scholar] [CrossRef]
Figure 1. (a) Schematic representation of the alignment in the basal plane of goethite crystallites, observed after uniaxial pressure. (b,c) Rietveld analysis of goethite before and after pressing process, respectively. (d) TEM images of lath-shaped goethite crystallites.
Magnetochemistry 09 00030 g001
Figure 2. (ac) Goethites G1, G2, G3, respectively. (d) X-Ray pattern of oriented BaM samples (13) obtained with G1, G2, G3, respectively.
Magnetochemistry 09 00030 g002
Figure 3. TEM images of spherical crystallites of hematite.
Magnetochemistry 09 00030 g003
Figure 4. SEM images show the evolution of the texturization between BaM-0 (a) and BaM-100 (b).
Magnetochemistry 09 00030 g004
Figure 5. Diffraction pattern and Rietveld analysis of BaM-0 (left) and of BaM-100 (right).
Magnetochemistry 09 00030 g005
Figure 6. The intensity of XRD (008) reflection increases with the molar ratio between goethite and hematite.
Magnetochemistry 09 00030 g006
Figure 7. (a) Rocking curve for the intensity of the (008) Bragg diffraction pic. (b) Evolution of the March–Dollase factor as a function of mole percentage of goethite.
Magnetochemistry 09 00030 g007
Figure 8. Probability density of crystallite orientations, from March–Dollase model.
Magnetochemistry 09 00030 g008
Figure 9. Frequency evolution of the normalized intrinsic permeability of sample BAM-0.
Magnetochemistry 09 00030 g009
Figure 10. Anisotropy field distribution f(HK) of the sample BaM-0. The triangle shows the value of HK as measured by using microwave experiment (see main text). Inset: the frequency variation of the imaginary part of permeability (µ’’) shows a maximum at frequency fR = 46.6 GHz. To this value of fR corresponds the maximum value HK of the anisotropy field distribution (both are marked by a triangle), the relationship beween fR and HK being fR = γHK.
Magnetochemistry 09 00030 g010
Figure 11. Hysteresis cycles measured for samples BaM-0 (left) and BaM-100 (right). Black symbols: H // n , open symbols: H n . The dashed lines in red are the first magnetization curves.
Magnetochemistry 09 00030 g011
Figure 12. Law of approach to saturation of some BaM samples. The determination coefficients R2 in M vs. 1/Hi2 linear relations are better than 0.999 in any case.
Magnetochemistry 09 00030 g012
Figure 13. Variations of the saturation magnetization (MS) and reduced-remanence magnetization (MR///MS) with the molar percentage of goethite.
Magnetochemistry 09 00030 g013
Figure 14. Measured angular dispersion and full width at half-remanence α50 for BaM-0 (open circles) and BaM-100 (full circles).
Magnetochemistry 09 00030 g014
Figure 15. Correlation between 2θ, MRMR∕∕ (open symbols) and ARM (full symbols).
Magnetochemistry 09 00030 g015
Figure 16. Variation of A u n i ( K 1 , ρ ) / K 1 2 as a function of the ARM half-height width (the full line is only a guide for the eyes).
Magnetochemistry 09 00030 g016
Table 1. Rietveld refinement values (self-polarized material).
Goethite before CompactionGoethite after Compaction
a, b, c (Å)9.9734(12), 3.0288(4), 4.6257(7)9.9740(6), 3.0255(15), 4.6151(8)
Space GroupPnmaPnma
March–Dollase r10.3997
Robs, wRobs, Rall, wRall,
GOF
6.15, 6.53, 6.57, 6.54,
1.39
13.98, 13.15, 14.36, 13.16,
1.39
Table 2. Influence of the aspect ratio of the goethite on BaM particles stacking.
GoethiteG1G2G3
η0.060.150.2
I(008)/I(107)0.50.81.2
Table 3. Details on the prepared samples.
Goethite (% molar)051020
Hematite (% molar)100959080
Notation in this paperBaM-0BaM-5BaM-10BaM-20
Goethite (% molar)30405060
Hematite (% molar)70605040
Notation in this paperBaM-30BaM-40BaM-50BaM-60
Goethite (% molar)708090100
Hematite (% molar)3020100
Notation in this paperBaM-70BaM-80BaM-90BaM-100
Table 4. Data obtained from hysteresis loops and the law of approach to saturation. MS is the saturation magnetization, MR// and MR the remanent magnetizations measured along the easy axis and perpendicular to the easy axis, respectively. α50 is the full width at half remanence measured in ARM. For Auni(K1,ρ), see Equation (12) and main text.
MS
(kA/m)
MR// (kA/m)MR///MS (kA/m)MR///MR (kA/m)α50 (°)Auni(K1,ρ)/K12
BaM-03041660.551.061540.33
BaM-53191740.5511500.29
BaM-103081730.560.981280.29
BaM-203191850.580.881250.28
BaM-303172000.630.831230.24
BaM-403082010.650.781180.23
BaM-503082030.660.691050.21
BaM-603112290.740.641010.19
BaM-703132300.730.57930.17
BaM-803122370.760.54890.16
BaM-903032420.80.46870.12
BaM-1002992380.810.40700.1
Disclaimer/Publisher’s Note: The statements, opinions and data contained in all publications are solely those of the individual author(s) and contributor(s) and not of MDPI and/or the editor(s). MDPI and/or the editor(s) disclaim responsibility for any injury to people or property resulting from any ideas, methods, instructions or products referred to in the content.

