
Preparation and Optimization of the Adsorbent for Phosphorus Removal Using the Response Surface Method

Abstract
:1. Introduction
2. Materials and Methods
2.1. Materials and Chemicals
2.2. Synthesis Procedure
2.3. Characterization
2.4. Adsorption Experiment
3. Results and Discussion
3.1. RSM
3.1.1. RSM Design
3.1.2. Experimental Results of RSM
3.2. Characterization
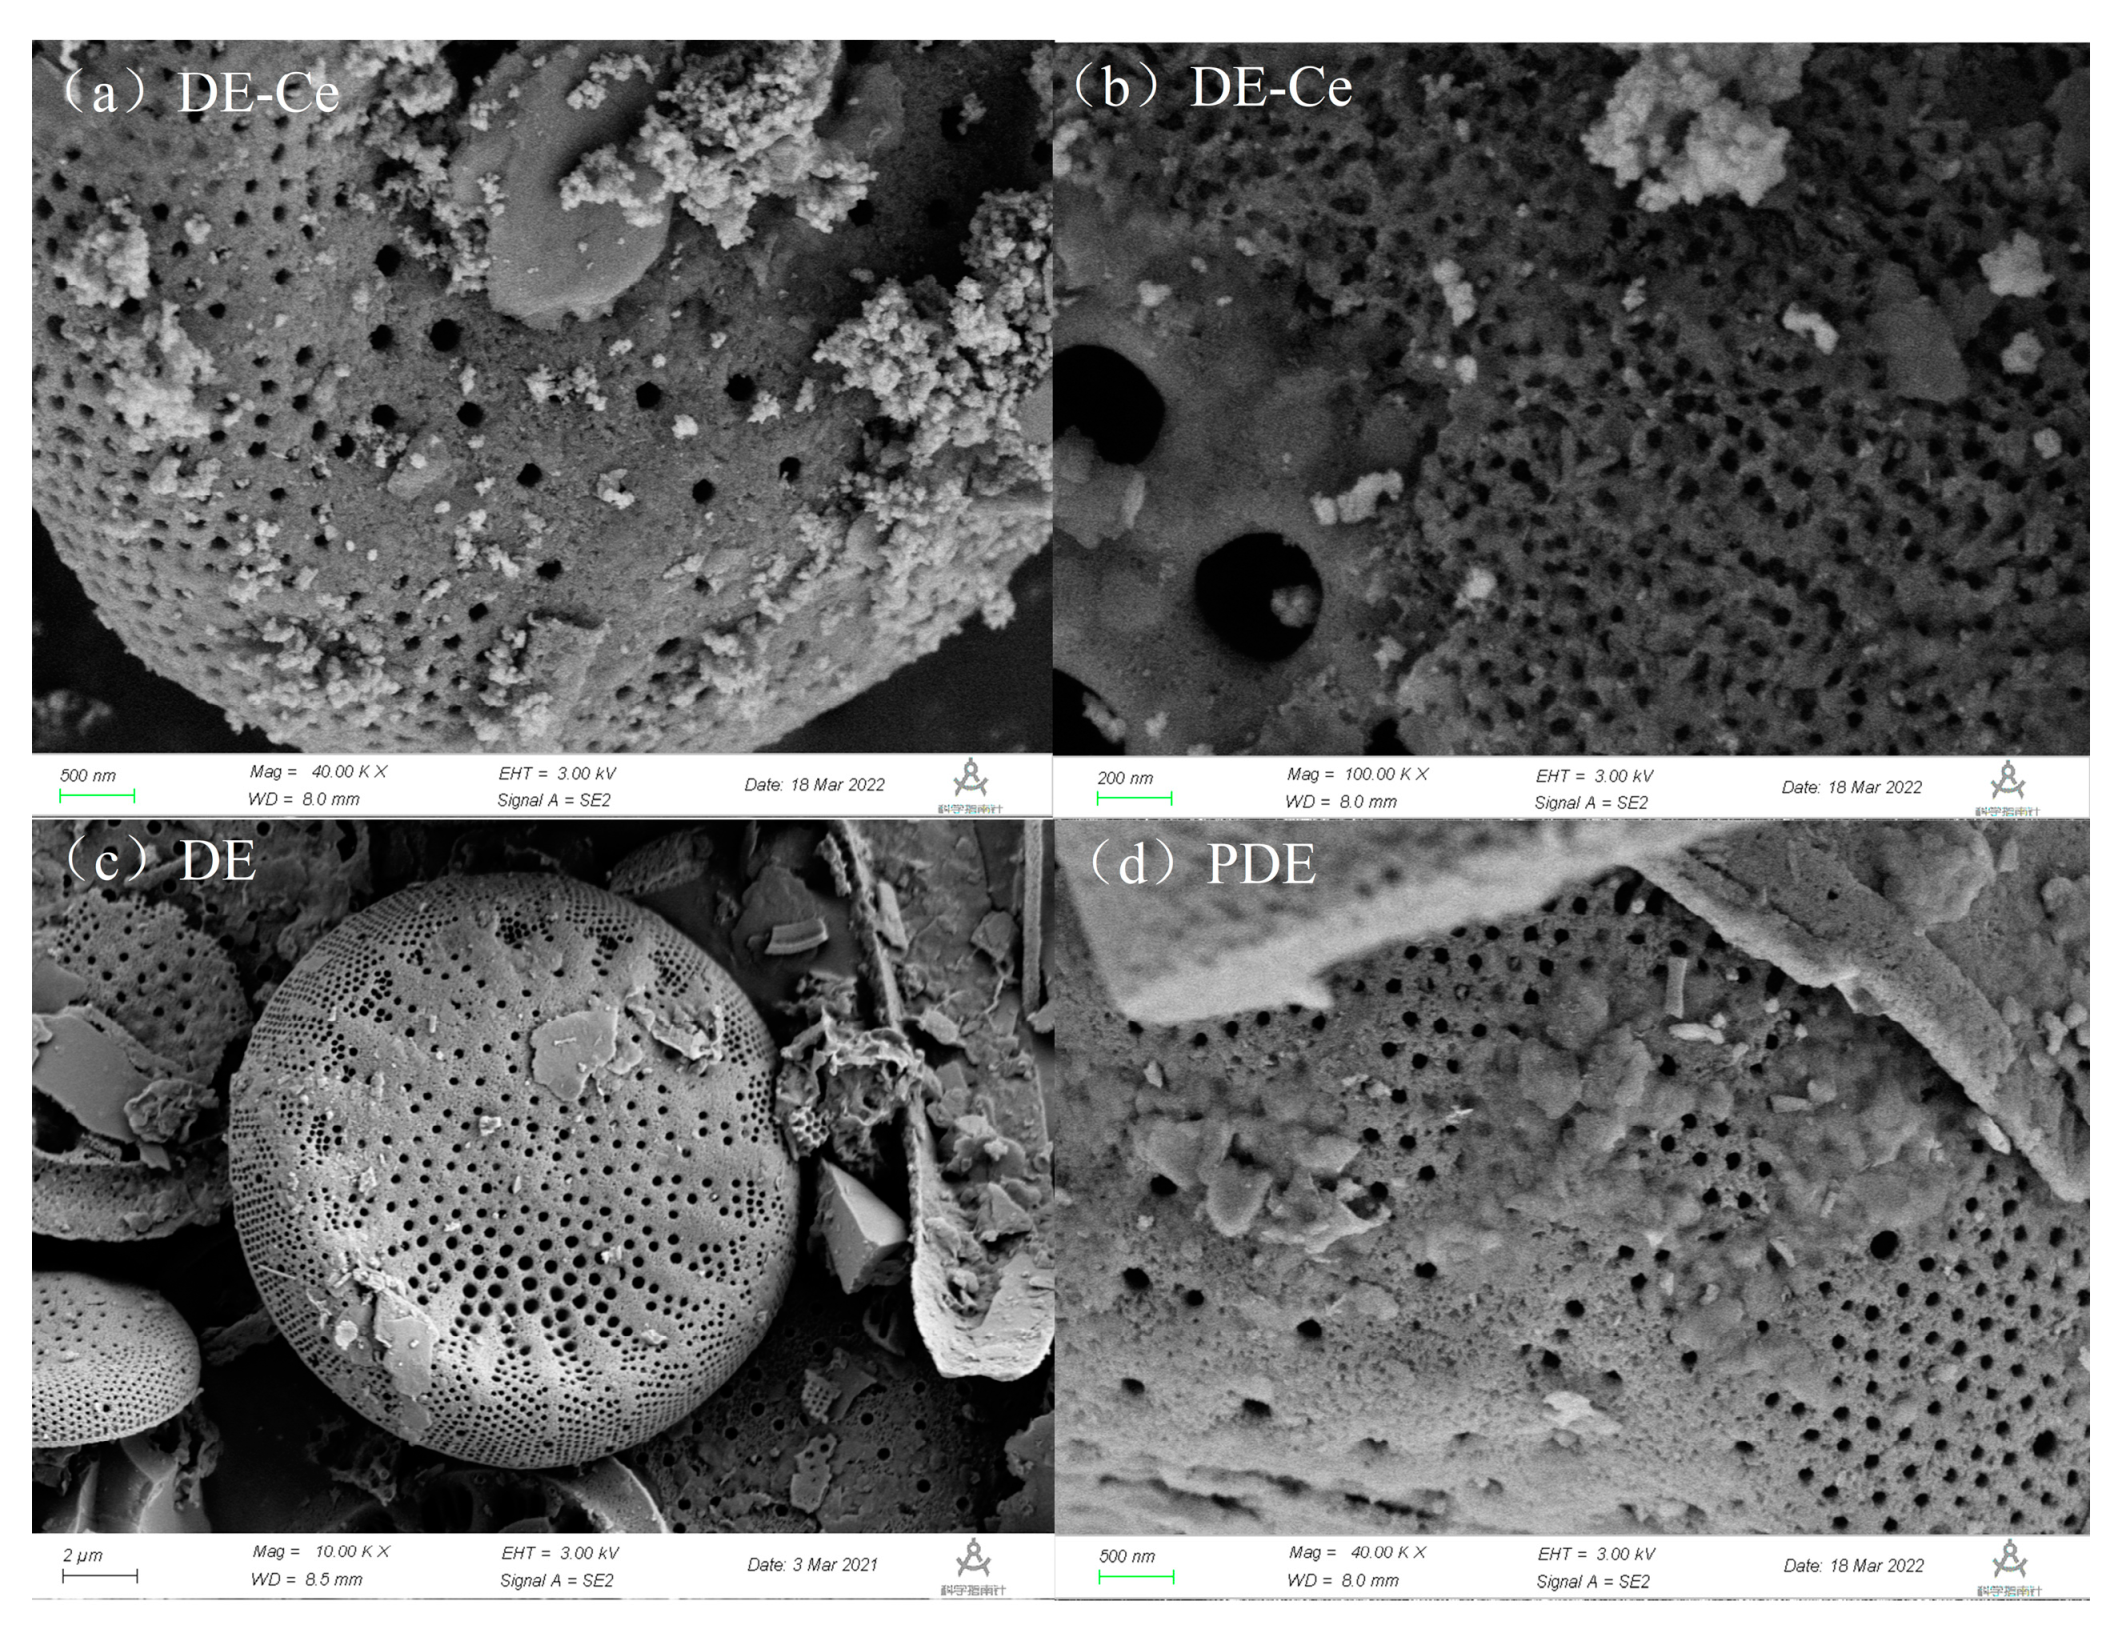
3.2.1. SEM
3.2.2. XRF
3.2.3. BET
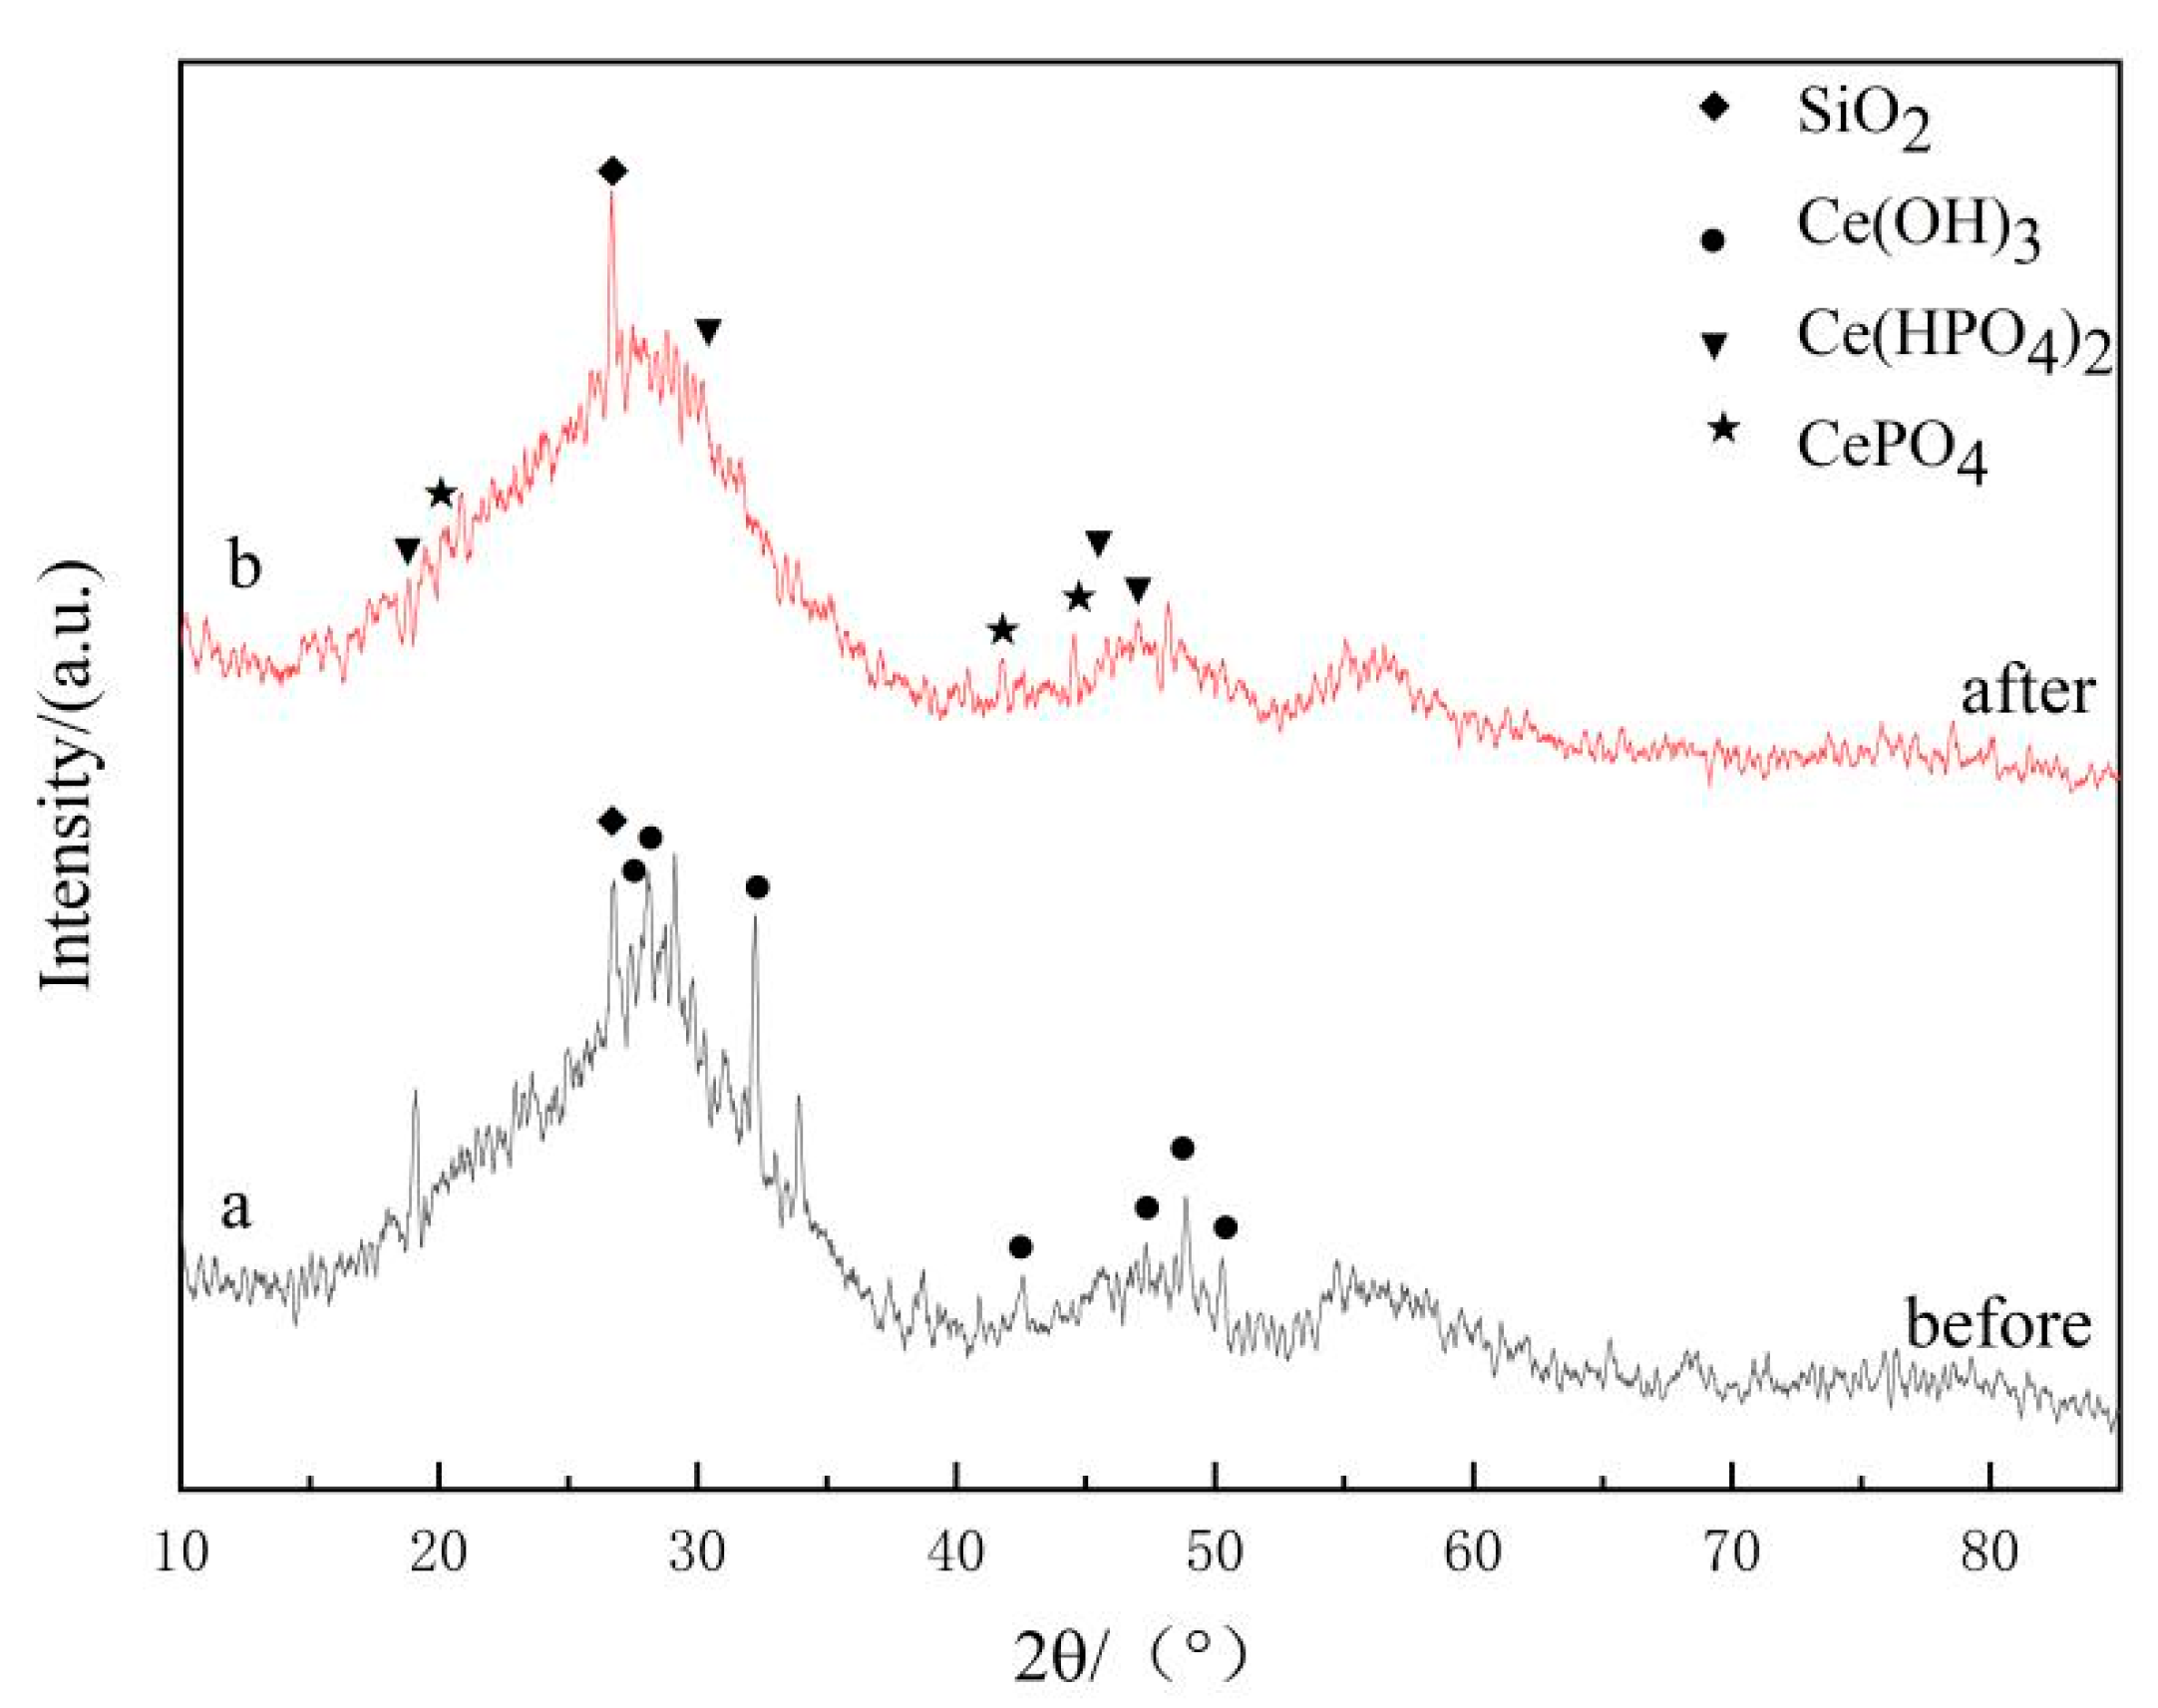
3.2.4. XRD
3.2.5. VSM
3.3. Adsorption Kinetic Analysis
3.4. Adsorption Isothermal Analysis
3.5. Adsorption Mechanism
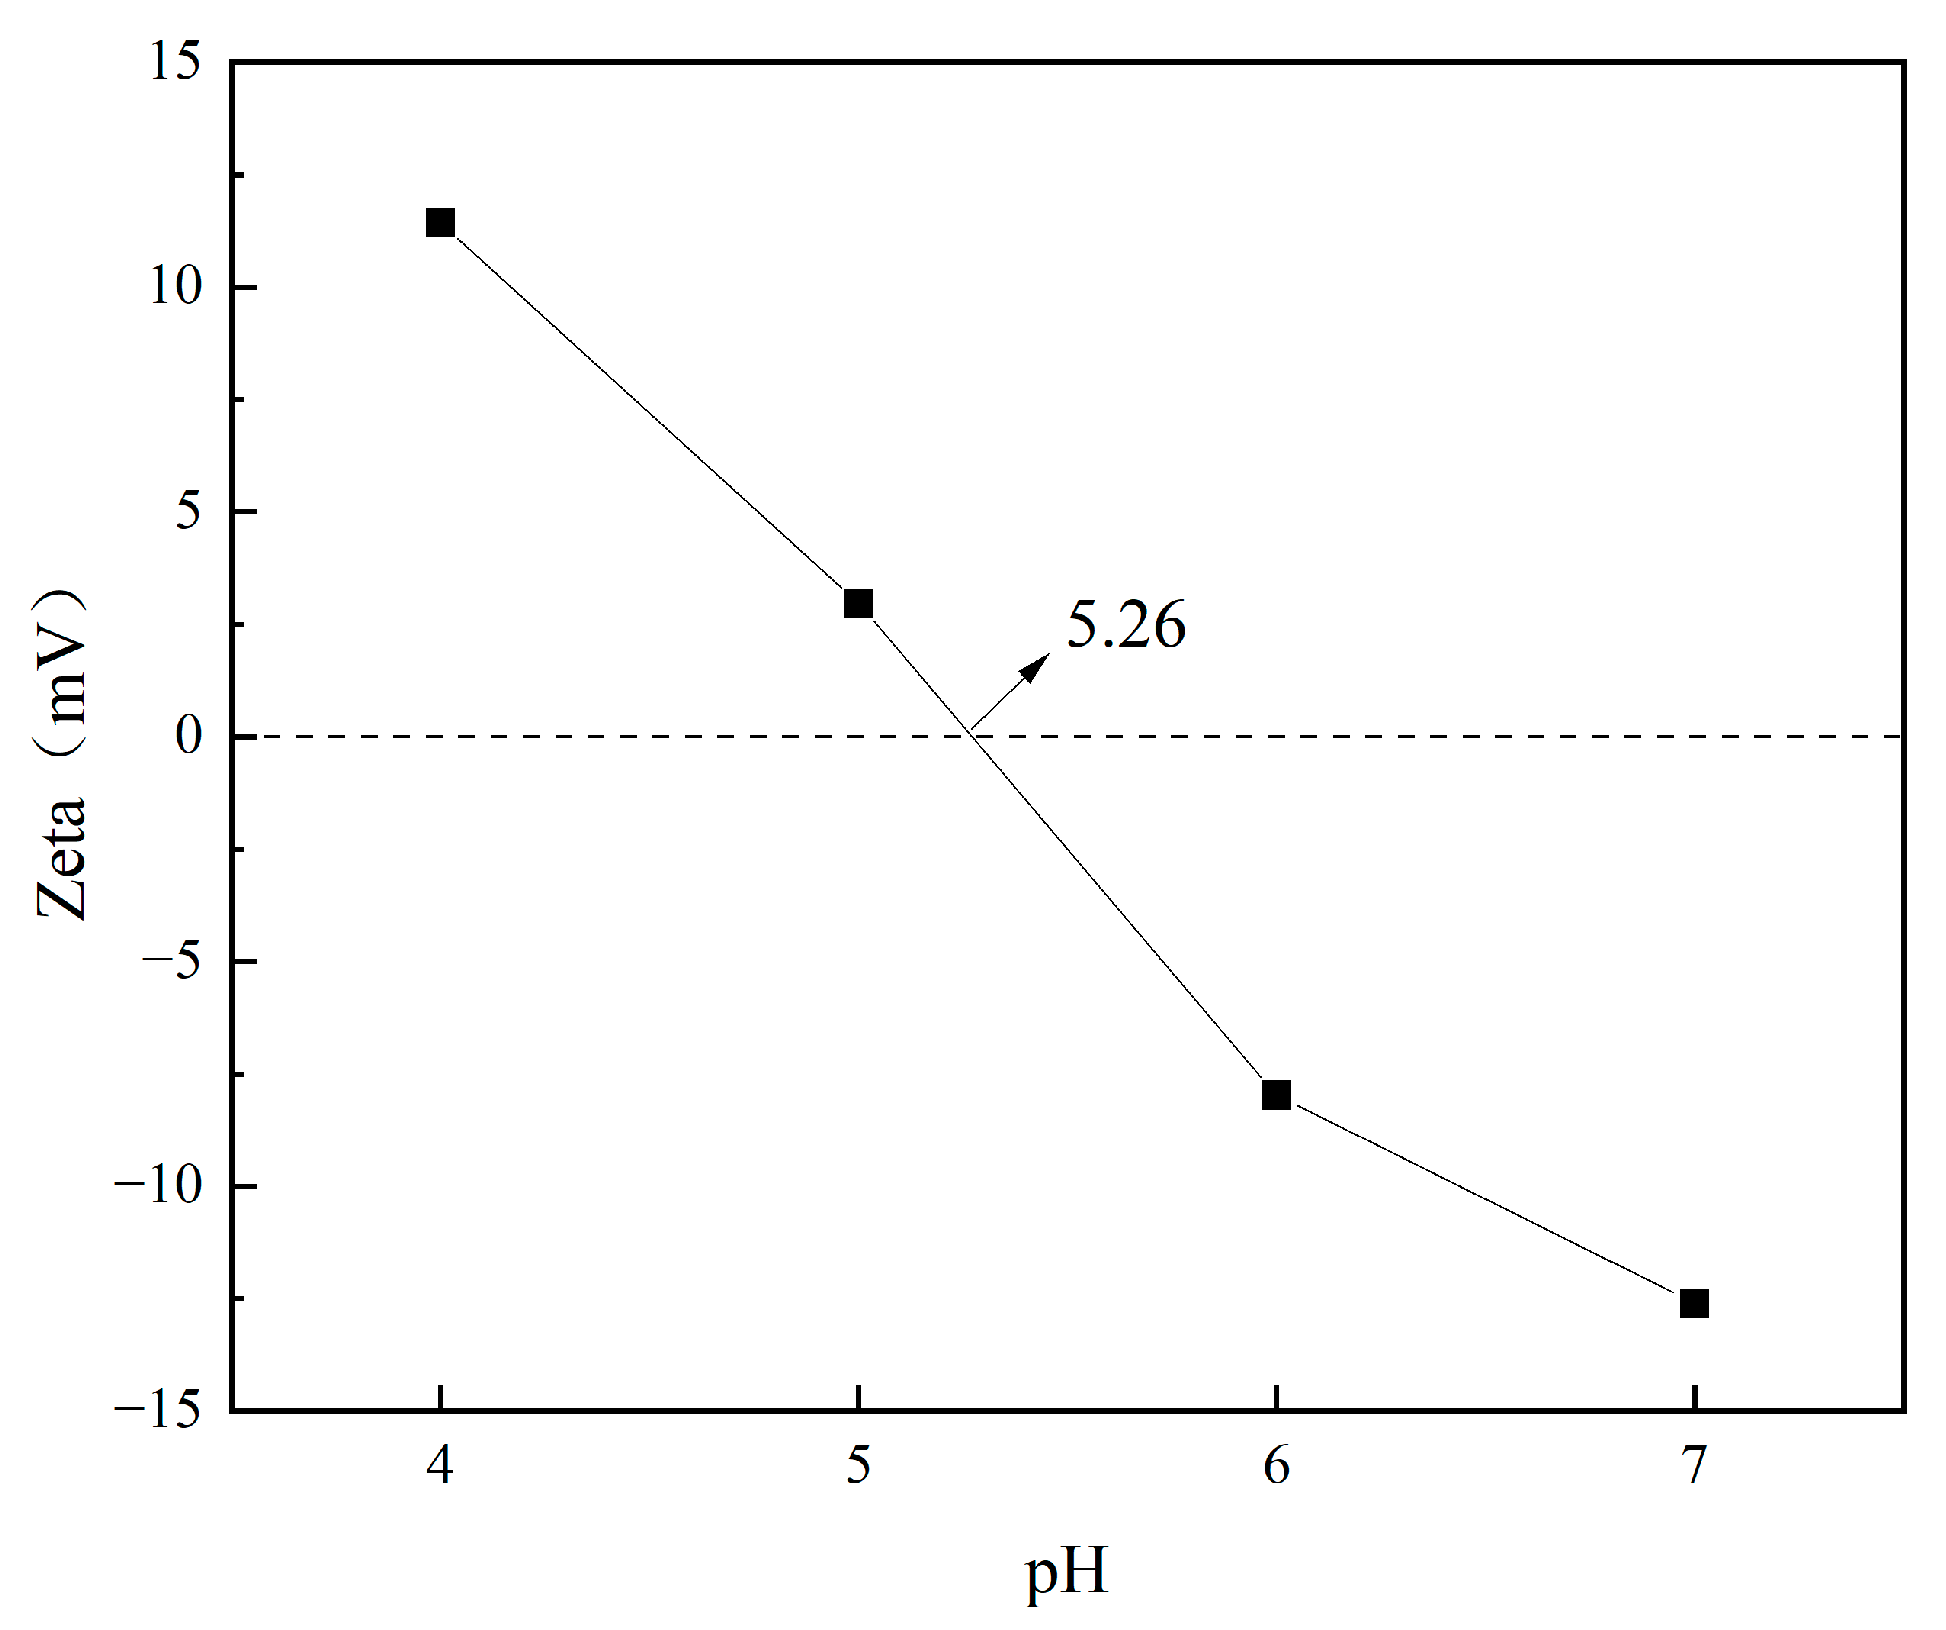
3.5.1. Electrostatic Adsorption and Sedimentation
3.5.2. Ligand Exchange
4. Conclusions
Author Contributions
Funding
Data Availability Statement
Conflicts of Interest
References
- Su, Y.; Yang, W.; Sun, W.; Li, Q.; Shang, J.K. Synthesis of mesoporous cerium–zirconium binary oxide nanoadsorbents by a solvothermal process and their effective adsorption of phosphate from water. Chem. Eng. J. 2015, 268, 270–279. [Google Scholar] [CrossRef]
- Wang, Z.; Lin, Y.; Wu, D.; Kong, H. Hydrous iron oxide modified diatomite as an active filtration medium for phosphate capture. Chemosphere 2016, 144, 1290–1298. [Google Scholar] [CrossRef] [PubMed]
- Zou, H.; Wang, Y. Phosphorus removal and recovery from domestic wastewater in a novel process of enhanced biological phosphorus removal coupled with crystallization. Bioresour. Technol. 2016, 211, 87–92. [Google Scholar] [CrossRef] [PubMed]
- Li, M.; Cao, X.; Wu, Z.; Li, J.; Cui, Y.; Liu, J.; Li, B. Insights on nitrogen and phosphorus removal mechanism in a single-stage Membrane Aeration Biofilm Reactor (MABR) dominated by denitrifying phosphorus removal coupled with anaerobic/aerobic denitrification. J. Water Process Eng. 2023, 52, 103583. [Google Scholar] [CrossRef]
- Wu, Z.; Han, Y.; Zan, F.; Ye, Y.; Ren, Y.; Han, K.; Jiang, W. Highly efficient removal of phosphate by La–diatomite and sodium alginate composite hydrogel beads. Environ. Sci. Water Res. Technol. 2023, 9, 1205–1215. [Google Scholar] [CrossRef]
- Chen, J.; Yan, L.G.; Yu, H.Q.; Li, S.; Qin, L.L.; Liu, G.Q.; Du, B. Efficient removal of phosphate by facile prepared magnetic diatomite and illite clay from aqueous solution. Chem. Eng. J. 2016, 287, 162–172. [Google Scholar] [CrossRef]
- Kim, D.; Kim, Y.; Choi, J.H.; Ryoo, K.S. Evaluation of Natural and Calcined Eggshell as Adsorbent for Phosphorous Removal from Water. Bull. Korean Chem. Soc. 2020, 41, 650–656. [Google Scholar] [CrossRef]
- Jung, J.; Choi, M.; Police, A.K.R.; Lee, J.; Bae, S. Removal of Phosphorus by Ferric Ion-Rich Solutions Prepared Using Various Fe (III)-Containing Minerals. Water 2022, 14, 3765. [Google Scholar] [CrossRef]
- Acelas, N.Y.; Martin, B.D.; López, D.; Jefferson, B. Selective removal of phosphate from wastewater using hydrated metal oxides dispersed within anionic exchange media. Chemosphere 2015, 119, 1353–1360. [Google Scholar] [CrossRef]
- López, J.; Reig, M.; Licon, E.; Valderrama, C.; Gibert, O.; Cortina, J.L. Evaluating the integration of nanofiltration membranes in advanced water reclamation schemes using synthetic solutions: From phosphorous removal to phosphorous circularity. Sep. Purif. Technol. 2022, 290, 120914. [Google Scholar] [CrossRef]
- Koh, K.Y.; Zhang, S.; Chen, J.P. Improvement of ultrafiltration for treatment of phosphorus-containing water by a lanthanum-modified aminated polyacrylonitrile membrane. ACS Omega 2020, 5, 7170–7181. [Google Scholar] [CrossRef] [PubMed]
- He, Q.; Zhao, H.; Teng, Z.; Wang, Y.; Li, M.; Hoffmann, M.R. Phosphate removal and recovery by Lanthanum-based adsorbents: A review for current Advances. Chemosphere 2022, 303, 134987. [Google Scholar] [CrossRef] [PubMed]
- Li, S.; Zeng, W.; Ren, Z.; Jia, Z.; Wu, G.; Peng, P. Performance Difference of Hydrated Phosphorophilic Metal Oxides in Modifying Diatomite and Recovering Phosphorus from Wastewater. Colloids Surf. A Physicochem. Eng. Asp. 2021, 623, 126763. [Google Scholar] [CrossRef]
- Bacelo, H.; Pintor, A.M.; Santos, S.C.; Boaventura, R.A.; Botelho, C.M. Performance and prospects of different adsorbents for phosphorus uptake and recovery from Water. Chem. Eng. J. 2020, 381, 122566. [Google Scholar] [CrossRef]
- Hoang, V.A.; Yoshizuka, K.; Nishihama, S. Oxidative adsorption of arsenic from water environment by activated carbon modified with cerium oxide/Hydroxide. Chem. Eng. Res. Des. 2022, 186, 161–173. [Google Scholar] [CrossRef]
- Al-Ghouti, M.A.; Khraisheh, M.A.M.; Allen, S.J.; Ahmad, M.N. The removal of dyes from textile wastewater: A study of the physical characteristics and adsorption mechanisms of diatomaceous Earth. J. Environ. Manag. 2003, 69, 229–238. [Google Scholar] [CrossRef] [PubMed]
- Jemutai-Kimosop, S.; Orata, F.; Shikuku, V.O.; Okello, V.A.; Getenga, Z.M. Insights on adsorption of carbamazepine onto iron oxide modified diatomaceous earth: Kinetics, isotherms, thermodynamics, and Mechanisms. Environ. Res. 2020, 180, 108898. [Google Scholar] [CrossRef]
- Tohdee, K.; Mukjinda, S.; Semmad, S.; Jotisankasa, A.; Praserthdam, P.; Jongsomjit, B. A comparative performance of heterogeneous catalyst derived from DE, empty fruit bunch, and montmorillonite treated by acid and metal oxide for ethyl lactate Production. J. Taiwan Inst. Chem. Eng. 2023, 142, 104670. [Google Scholar] [CrossRef]
- Wang, J.; Zhang, G.; Qiao, S.; Zhou, J. Magnetic Fe0/iron oxide-coated diatomite as a highly efficient adsorbent for recovering phosphorus from Water. Chem. Eng. J. 2021, 412, 128696. [Google Scholar] [CrossRef]
- Gitari, W.M.; Izuagie, A.A.; Gumbo, J.R. Synthesis, characterization and batch assessment of groundwater fluoride removal capacity of trimetal Mg/Ce/Mn oxide-modified diatomaceous earth. Arab. J. Chem. 2020, 13, 1–16. [Google Scholar] [CrossRef]
- Wu, Y.; Li, X.; Yang, Q.; Wang, D.; Xu, Q.; Yao, F.; Huang, X. Hydrated Lanthanum Oxide-Modified Diatomite as Highly Efficient Adsorbent for Low-Concentration Phosphate Removal from Secondary Effluents. J. Environ. Manag. 2019, 231, 370–379. [Google Scholar] [CrossRef] [PubMed]
- Zhao, Y.F.; Su, X.; Zhang, W.H. Study on the treatment of phosphorus-containing wastewater by adsorption of modified diatomaceous earth. Appl. Chem. Ind. 2018, 47, 883–886. [Google Scholar]
- He, J.; Pei, C.; Yang, Y.; Lai, B.; Sun, Y.; Yang, L. The structural design and valence state control of Cerium-based metal-organic frameworks for their highly efficient phosphate Removal. J. Clean. Prod. 2021, 321, 128778. [Google Scholar] [CrossRef]
- Kajjumba, G.W.; Marti, E.J. A review of the application of cerium and lanthanum in phosphorus removal during wastewater treatment: Characteristics, mechanism, and recovery. Chemosphere 2022, 309, 136462. [Google Scholar] [CrossRef] [PubMed]
- Li, R.; Li, Q.; Gao, S.; Shang, J.K. Exceptional arsenic adsorption performance of hydrous cerium oxide nanoparticles: Part A. Adsorption capacity and mechanism. Chem. Eng. J. 2012, 185, 127–135. [Google Scholar] [CrossRef]
- Wang, L.N.; Wei, N. Room-temperature ferromagnetic origin of undoped CeO2. J. Silic. 2018, 46, 952–956. [Google Scholar]
- Luo, K.; Lin, N.; Li, X.; Pang, Y.; Wang, L.; Lei, M.; Yang, Q. Efficient hexavalent chromium removal by nano-cerium oxide functionalized biochar: Insight into the role of reduction. J. Environ. Chem. Eng. 2023, 11, 110004. [Google Scholar] [CrossRef]
- Yan, R.; Qiu, Z.; Bian, X.; Yang, J.; Zhou, A. Effective adsorption of antimony from aqueous solution by cerium hydroxide loaded on y-tape molecular sieve adsorbent: Performance and mechanism. Colloids Surf. A Physicochem. Eng. Asp. 2020, 604, 125317. [Google Scholar] [CrossRef]
- Ping, N.I.N.G.; Honghong, Y.I.; Qiongfen, Y.U.; Xiaolong, T.A.N.G.; Liping, Y.A.N.G.; Zhiqing, Y.E. Effect of zinc and cerium addition on property of copper-based adsorbents for phosphine adsorption. J. Rare Earths 2010, 28, 581–586. [Google Scholar] [CrossRef]
- Lu, M.; Fang, S.; Li, G.; Wang, W.; Tan, X.; Wu, W. Optimization of adsorption performance of cerium-loaded intercalated bentonite by CCD-RSM and GA-BPNN and its application in simultaneous removal of phosphorus and ammonia nitrogen. Chemosphere 2023, 336, 139241. [Google Scholar] [CrossRef]
- Zeng, Y.; Li, Y.; Jia, X.; Hu, G.; Bi, H.; Zhang, X.; Chang, F. A novel electric spark precipitation and electrospinning strategy to prepare cerium hydroxide nanocomposite for phosphate uptake from aqueous solutions. J. Environ. Chem. Eng. 2023, 11, 110178. [Google Scholar] [CrossRef]
- Liu, M.; Huang, Q.; Li, L.; Zhu, G.; Yang, X.; Wang, S. Cerium-doped MIL-101-NH2 (Fe) as superior adsorbent for simultaneous capture of phosphate and As (V) from Yangzonghai coastal spring water. J. Hazard. Mater. 2022, 423, 126981. [Google Scholar] [CrossRef] [PubMed]
- Li, X.L.; Liang, H.Y.; Zhong, L.Y. Preparation and phosphorus removal performance of Ce-Zn composite adsorbent. Ind. Water Treat. 2023, 43, 107–113. [Google Scholar]
- Liu, Y.X.; Guo, H.C. Deep treatment of phosphorus-containing wastewater with hydrated cerium oxide loaded zeolite. J. Jimei Univ. (Nat. Sci. Ed.) 2009, 14, 131–136. [Google Scholar]
- Li, C.M.; Zhang, Y.S.; Wang, X.P.; Yin, X.B.; Luo, N.N.; Khayambashi, A.; Wei, Y.Z. The synthesis and characterization of hydrous cerium oxide nanoparticles loaded on porous silica micro-sphere as novel and efficient adsorbents to remove phosphate radicals from water. Microporous Mesoporous Mater. 2019, 279, 73–81. [Google Scholar] [CrossRef]
- Wang, R.; Lu, M.; Wang, J. Co-Utilization of Sewage Sludge and Rice Husk in Ceramsite Preparation with Selective Adsorption Capacity to Pb. Materials 2022, 15, 4310. [Google Scholar] [CrossRef]
- Cheng, F.; Wang, Y.; Fan, Y.; Huang, D.; Pan, J.; Li, W. Optimized Ca-Al-La modified biochar with rapid and efficient phosphate removal performance and excellent pH stability. Arab. J. Chem. 2023, 16, 104880. [Google Scholar] [CrossRef]
- Tan, C.; Zhang, X.; Liao, C.; Huang, Y.; Zheng, J.; Chen, H.; He, H. Optimization of fishbone biochar preparation process based on adsorption performance. Sustain. Chem. Pharm. 2023, 32, 101015. [Google Scholar] [CrossRef]
- Roy, H.; Islam, M.S.; Arifin, M.T.; Firoz, S.H. Chitosan-ZnO decorated Moringa oleifera seed biochar for sequestration of methylene blue: Isotherms, kinetics, and response surface Analysis. Environ. Nanotechnol. Monit. Manag. 2022, 18, 100752. [Google Scholar] [CrossRef]
- Zhang, Z.R.; Luo, S.H.; Wang, J.C.; Sun, M.Y.; Yan, S.X.; Wang, Q.; Lei, X.F. Optimization of preparation of lignite-based activated carbon for high-performance supercapacitors with response surface methodology. J. Energy Storage 2022, 56, 105913. [Google Scholar] [CrossRef]
- Beyan, S.M.; Prabhu, S.V.; Sissay, T.T.; Getahun, A.A. Sugarcane bagasse based activated carbon preparation and its adsorption efficacy on removal of BOD and COD from textile effluents: RSM based modeling, optimization and kinetic aspects. Bioresour. Technol. Rep. 2021, 14, 100664. [Google Scholar] [CrossRef]
- Wang, Y.Q.; Zhang, X.P.; Wei, Y.F. Study on the adsorption of lanthanum loaded with diatomaceous earth on phosphate in water. Ind. Water Treat. 2019, 39, 41–44. [Google Scholar]
- Cui, Y.W.; Li, J.; Du, Z.F. Comparative study on the performance and mechanism of lanthanum and cerium modified zeolites for phosphorus removal from wastewater. Chin. J. Rare Earths 2016, 34, 460–468. [Google Scholar]
- Wang, J.; Zhang, G.; Qiao, S.; Zhou, J. Comparative assessment of formation pathways and adsorption behavior reveals the role of NaOH of MgO-modified diatomite on phosphate Recovery. Sci. Total Environ. 2023, 876, 162785. [Google Scholar] [CrossRef] [PubMed]
- Zong, E.; Huang, G.; Liu, X.; Lei, W.; Jiang, S.; Ma, Z.; Song, P. A lignin-based nano-adsorbent for superfast and highly selective removal of phosphate. J. Mater. Chem. A 2018, 6, 9971–9983. [Google Scholar] [CrossRef]
- Wang, Y.; Xie, X.; Chen, X.; Huang, C.; Yang, S. Biochar-loaded Ce3+-enriched ultra-fine ceria nanoparticles for phosphate adsorption. J. Hazard. Mater. 2020, 396, 122626. [Google Scholar] [CrossRef] [PubMed]
- Qiu, H.; Ye, M.; Zeng, Q.; Li, W.; Fortner, J.; Liu, L.; Yang, L. Fabrication of agricultural waste supported UiO-66 nanoparticles with high utilization in phosphate removal from water. Chem. Eng. J. 2019, 360, 621–630. [Google Scholar] [CrossRef]
- He, J.; Xu, Y.; Wang, W.; Hu, B.; Wang, Z.; Yang, X.; Yang, L. Ce(III) nanocomposites by partial thermal decomposition of Ce-MOF for effective phosphate adsorption in a wide pH range. Chem. Eng. J. 2020, 379, 122431. [Google Scholar] [CrossRef]
- Hu, S.H. Study on Phosphorus Adsorption and Removal by Cerium-Based MOF Polymetallic Nanomaterials. Master’s Thesis, Minnan Normal University, Zhangzhou, China, 2022. [Google Scholar]
- Wang, R.; Dangerfield, R. Seed-mediated synthesis of shape-controlled CeO2 nanocrystals. RSC Adv. 2014, 4, 3615–3620. [Google Scholar] [CrossRef]
- Wang, G.Z.; Zeng, W.; Li, S.S. Adsorption Characteristics of Phosphate on Cerium Modified Water Hyacinth Biochar. Huan Jing Ke Xue Huanjing Kexue 2021, 42, 4815–4825. [Google Scholar] [CrossRef]
- He, J.; Xu, Y.; Xiong, Z.; Lai, B.; Sun, Y.; Yang, Y.; Yang, L. The enhanced removal of phosphate by structural defects and competitive fluoride adsorption on cerium-based adsorbent. Chemosphere 2020, 256, 127056. [Google Scholar] [CrossRef] [PubMed]
- Su, S.; Zhang, R.; Rao, J.; Yu, J.; Jiang, X.; Wang, S.; Yang, X. Fabrication of Lanthanum-modified MOF-808 for phosphate and arsenic(V) removal from Wastewater. J. Environ. Chem. Eng. 2022, 10, 108527. [Google Scholar] [CrossRef]


| Material | Ce Type | Method | Pollutant | Capacity (mg/g) | Ref |
|---|---|---|---|---|---|
| BC-Ce | Ce(NO3)3 (CeO2) * | impregnation–precipitation–pyrolysis | Cr(VI) | 47.83 | [27] |
| NaY@Ce | CeCl3 (cerium hydroxide) * | coprecipitation method | Sb(III) Sb(V) | 24.65 7.28 | [28] |
| Cu45Zn3Ce1/AC | Ce(NO3)3·6H2O | impregnation method | PH3 | 61.86 | [29] |
| Ce-bentonite | cerium sulfate | P NH3–N | 1.261 0.884 | [30] | |
| CHP | cerium hydroxide * | hydrothermal method | phosphates | 86.7 | [31] |
| Ce-MIL-101-NH2 | CeCl3·eC2O (cerium hydroxide) * | solvothermal method | phosphate As(V) | 341.5 249 | [32] |
| Variable | Scope and Level | |||
|---|---|---|---|---|
| Factor Coding | −1 | 0 | +1 | |
| Roasting temperature (°C) | X1 | 500 | 550 | 600 |
| Cerium concentration (mol/L) | X2 | 0.07 | 0.11 | 0.15 |
| HCl concentration (mol/L) | X3 | 2.0 | 3.0 | 4.0 |
| Serial Number | Variable Value | Actual Value | Response Value (Y, %) (P Removal Rate) | ||||
|---|---|---|---|---|---|---|---|
| X1 | X2 | X3 | X1 (°C) | X2 (mol/L) | X3 (mol/L) | ||
| 1 | −1 | −1 | 0 | 500 | 0.07 | 3 | 90.49 |
| 2 | +1 | −1 | 0 | 600 | 0.07 | 3 | 92.64 |
| 3 | −1 | +1 | 0 | 500 | 0.15 | 3 | 92.15 |
| 4 | +1 | +1 | 0 | 600 | 0.15 | 3 | 93.52 |
| 5 | −1 | 0 | −1 | 500 | 0.11 | 2 | 92.75 |
| 6 | +1 | 0 | −1 | 600 | 0.11 | 2 | 94.81 |
| 7 | −1 | 0 | +1 | 500 | 0.11 | 4 | 92.8 |
| 8 | +1 | 0 | +1 | 600 | 0.11 | 4 | 92.98 |
| 9 | 0 | −1 | −1 | 550 | 0.07 | 2 | 95.15 |
| 10 | 0 | +1 | −1 | 550 | 0.15 | 2 | 96.59 |
| 11 | 0 | −1 | +1 | 550 | 0.07 | 4 | 94.34 |
| 12 | 0 | +1 | +1 | 550 | 0.15 | 4 | 95.42 |
| 13 | 0 | 0 | 0 | 550 | 0.11 | 3 | 99.28 |
| 14 | 0 | 0 | 0 | 550 | 0.11 | 3 | 99.02 |
| 15 | 0 | 0 | 0 | 550 | 0.11 | 3 | 98.91 |
| 16 | 0 | 0 | 0 | 550 | 0.11 | 3 | 98.57 |
| 17 | 0 | 0 | 0 | 550 | 0.11 | 3 | 98.67 |
| Source | Sum of Squares | Freedom | Mean Square | F | p > F | Significance |
|---|---|---|---|---|---|---|
| Mode | 128.29 | 9 | 14.25 | 188.25 | <0.0001 | Significant |
| X1 | 4.15 | 1 | 4.15 | 54.77 | 0.0001 | |
| X2 | 3.20 | 1 | 3.20 | 42.27 | 0.0003 | |
| X3 | 1.77 | 1 | 1.77 | 23.34 | 0.0019 | |
| X1X2 | 0.15 | 1 | 0.15 | 2.01 | 0.1993 | |
| X1X3 | 0.88 | 1 | 0.88 | 11.67 | 0.0112 | |
| X2X3 | 0.032 | 1 | 0.032 | 0.43 | 0.5339 | |
| X12 | 80.22 | 1 | 80.22 | 1059.46 | <0.0001 | |
| X22 | 22.76 | 1 | 22.76 | 300.58 | <0.0001 | |
| X32 | 5.96 | 1 | 5.96 | 78.74 | <0.0001 | |
| Residual | 0.53 | 7 | 0.076 | |||
| Lack of fit | 0.20 | 3 | 0.070 | 0.87 | 0.5252 | Not significant |
| Pure error | 0.32 | 4 | 0.080 | |||
| Cor total | 128.82 | 16 | ||||
| R2 = 0.9959 | R2(Adj) = 0.9906 | Adeq Precision = 39.031 | ||||
| Pseudo-First-Order Kinetic Model | Pseudo-Second-Order Kinetic Model | ||
|---|---|---|---|
| K1 (min−1) | 0.927 | K2 (min−1) | 5.074 |
| qe (mg/g) | 3.004 | qe (mg/g) | 0.950 |
| R2 | 0.968 | R2 | 0.981 |
| Samples | Langmuir | Freundlich | ||||
|---|---|---|---|---|---|---|
| qm (mg/g) | KL (L/mg) | R2 | n | KF ((mg/g) (mg/L) −n) | R2 | |
| pH = 4.0 | 16.317 | 3.838 | 0.994 | 4.246 | 8.231 | 0.876 |
| pH = 7.0 | 17.133 | 3.867 | 0.974 | 3.912 | 8.379 | 0.919 |
| pH = 10.0 | 15.794 | 2.977 | 0.983 | 4.125 | 7.689 | 0.868 |
Disclaimer/Publisher’s Note: The statements, opinions and data contained in all publications are solely those of the individual author(s) and contributor(s) and not of MDPI and/or the editor(s). MDPI and/or the editor(s) disclaim responsibility for any injury to people or property resulting from any ideas, methods, instructions or products referred to in the content. |
© 2024 by the authors. Licensee MDPI, Basel, Switzerland. This article is an open access article distributed under the terms and conditions of the Creative Commons Attribution (CC BY) license (https://creativecommons.org/licenses/by/4.0/).
Share and Cite
Zhang, Z.; Zou, Z.; Ren, X.; Huang, Y.; Deng, Y.; Zheng, H. Preparation and Optimization of the Adsorbent for Phosphorus Removal Using the Response Surface Method. Magnetochemistry 2024, 10, 5. https://doi.org/10.3390/magnetochemistry10010005
Zhang Z, Zou Z, Ren X, Huang Y, Deng Y, Zheng H. Preparation and Optimization of the Adsorbent for Phosphorus Removal Using the Response Surface Method. Magnetochemistry. 2024; 10(1):5. https://doi.org/10.3390/magnetochemistry10010005
Chicago/Turabian StyleZhang, Zhanmei, Zuqin Zou, Xiaoyu Ren, Yunxuan Huang, Yang Deng, and Huaili Zheng. 2024. "Preparation and Optimization of the Adsorbent for Phosphorus Removal Using the Response Surface Method" Magnetochemistry 10, no. 1: 5. https://doi.org/10.3390/magnetochemistry10010005