Article

Classification and Identification of Apple Leaf Diseases and Insect Pests Based on Improved ResNet-50 Model

1
College of Automation, Zhongkai University of Agriculture and Engineering, Guangzhou 510225, China
2
Guangdong Agricultural Products Cold Chain Transportation and Logistics Engineering Technology Research Center, Guangzhou 510225, China
3
College of Mechanical Engineering, Zhongkai University of Agriculture and Engineering, Guangzhou 510225, China
4
College of Mechanical and Electronic Engineering, Northwest A&F University, Xianyang 712100, China
*
Author to whom correspondence should be addressed.
Horticulturae 2023, 9(9), 1046; https://doi.org/10.3390/horticulturae9091046
Submission received: 25 July 2023 / Revised: 9 September 2023 / Accepted: 14 September 2023 / Published: 16 September 2023
(This article belongs to the Special Issue Advances in Intelligent Orchard)

Abstract

:
Automaticidentification and prevention of leaf diseases and insect pests on fruit crops represent a key trend in the development of smart agriculture. In order to address the limitations of existing models with low identification rates of apple leaf diseases and insect pests, a novel identification model based on an improved ResNet-50 architecture was proposed, which incorporated the coordinate attention (CA) module and weight-adaptive multi-scale feature fusion (WAMFF) to enhance the ResNet-50’s image feature extraction capabilities. Transfer learning and online data enhancement are employed to boost the model’s generalization ability. The proposed model achieved a top-1 accuracy rate of 98.32% on the basis of AppleLeaf9 datasets, which is 4.58% higher than the value from the original model, and the improved model can effectively improve the localization of lesion features. Furthermore, compared with mainstream deep networks, such as AlexNet, VGG16, DenseNet, MNASNet, and GoogLeNet on the same dataset, the top-1 accuracy rate increased by 7.3%, 3.19%, 4.98%, 6.04% and 3.87%, respectively. The experimental results demonstrate that the improved model is effective in improving the identification accuracy of apple leaf diseases and insect pests and enhancing the model’s effective feature extraction capabilities.

1. Introduction

China has become the world’s largest producer and consumer of apples, with an apple planting area that exceeds 50% of the world’s total planting area. In 2019/2020, apple production in China reached 33 million tons, and the national apple planting area accounted for 54.07% of the world’s total [1,2]. However, apple leaf diseases and insect pests seriously affect apple production and quality [3]. Common apple leaf diseases and insect pests include mosaic disease, rust fruit disease, rot disease, defoliation disease, and anthrax [4]. Currently, the identification of apple leaf diseases and insect pests mainly relies on the experience of planters and online expert diagnosis. Traditional manual methods are inefficient, waste manpower and material resources, and cannot meet the needs of modern agricultural production. Therefore, it is necessary to study intelligent apple leaf disease and insect pest image recognition methods that are more accurate and cost-effective to cope with pest identification in large-scale, modern apple plantations.
As one of the fruit crops, the image recognition algorithm for crop diseases and insect pests is mainly divided into machine learning methods and deep learning methods, and some research has been conducted in different directions. Yang et al. [5] developed a K-means clustering segmentation technology and support vector machine (SVM) classifier to identify the leaf disease of Ophiopogon japonicus. Prajapati [6] compared three different segmentation techniques to show that the K-means clustering method of hue, saturation, and value (HSV) color space had the highest accuracy rate for rice disease and pest segmentation, reaching 96.71%. Wen et al. [7] used SVM and a regional growth algorithm to integrate it into the identification of four types of vegetable diseases and insect pests, and its identification accuracy reached 93%. Zhang et al. [8] combined the super pixel segmentation, EM algorithm (expectation maximization), and pyramid histogram of oriented gradient (PHOG) features to classify and identify cucumber diseases and insect pests, and the average recognition rate reached 91.48%. Lu et al. [9] used the Harr feature extraction algorithm and cascade AdaBoost classifier to identify large borer pests, and the recognition rate reached 95.71% in simple background and 86.67% in complex background. Khan et al. [10] designed an insect pest sorting system for cucumber leaf and used M-SVM to identify five kinds of cucumber leaf insect pests and diseases, with an accuracy rate of 98.08%. The above machine learning-based pest identification method requires manual feature extraction, with cumbersome steps, poor robustness, and cannot achieve end-to-end learning.
In recent years, deep learning methods have developed rapidly in the field of image processing and are involved in classification recognition, image segmentation, and object detection [11,12,13]. By using CNN (convolutional neural networks) to extract features from images in an end-to-end manner, deep learning has strong representation capabilities and has made breakthroughs in the field of plant characterization, such as plant type parameter acquisition, plant identification, plant pest detection, and yield estimation [14,15,16,17,18]. Therefore, deep learning has become the mainstream research direction for crop pest identification at this stage. Peng et al. [19] proposed an identification model for the pests of lightweight crops using an improved ShuffleNet V2 CNN with a higher accuracy and detection speed. In this study, the lightweight multi-scale feature fusion (LMFF) module was designed to strength the feature extraction ability for pests at different scales. The adaptive and efficient channel attention (AECA) attention mechanism was then obtained to introduce into ShuffleNet V2 CNN to improve the cross channel interaction ability; Wang et al. [20] proposed an improved coordination attention EfficientNet (CA-ENet) network to identify different apple diseases with an accuracy of 98.92%. Di et al. [21] applied the tiny-YOLO network and optimized the network structure based on the structure of Darenet-19 to identify apple leaf disease with a faster identification speed and higher accuracy of leaf disease. Zhu et al. [22] proposed a novel real-time model LAD-Net (lightweight model using asymmetric and dilated) to achieve real-time diagnosis on early apple leaf pets and diseases, and the recognition rate could reach 98.58% on mobile devices. Nagaraju et al. [23] applied transfer learning and improved the VGG16 network structure for leaf disease identification by reducing the amount of computation, and the recognition accuracy reached 97.87% compared with original VGG16 model.
Although the image recognition method of pests and diseases based on CNN has made great progress in recent years, there are still the following problems: (1) In the complex environment of orchards, when the surrounding environment of fruit trees changes, the existing deep CNN models have insufficient ability to generalize apple tree diseases and pests; (2) some types of fruit tree diseases and pests have similar characteristics on the surface, but the feature differences are small, and the general network has insufficient feature extraction ability. To solve the above problems, ResNet-50 is taken as the feature extraction backbone network, and coordinate attention (CA) and weight-adaptive multi-scale feature fusion (WAMFF) are added to the ResNet-50 model to strengthen the image feature extraction and suppress invalid background information in our work, improving the accuracy rate and generalization ability of the backbone feature extraction network.
The remainder of the paper is organized as follows. Section 2 gives the datasets for apple tree leaf diseases and insect pets, as well as the improved ResNet-50 network model training. Section 3 describes the model test and the obtained results. Section 4 presents a comparison and discussion with the result in different methods. Finally, Section 5 concludes the paper and suggests some future works.

2. Materials and Methods

2.1. Experimental Materials for Apple Tree Leaf Diseases and Insect Pests

To validate the effectiveness of the algorithm proposed in this study for identifying diseases and insect pests on apple tree leaves, the publicly available datasets ATLDSD (Apple Tree Leaf Disease Segmentation datasets) [24] was used from the Science Data Bank. This datasets, collected by Northwest Agriculture and Forestry University, comprises images of common apple leaf diseases and pests. In addition, we combined them with the AppleLeaf9 datasets, which was fused with the PVD, PPCD2020, and PPCD2021 datasets, to increase the amount of data and the categories. The total includes Alternaria spot, brown spot, frog eye spot, grey spot, mosaic, powdery mildew, rust, and scab, as depicted in Figure 1. The datasets were captured under various weather and lighting conditions, capturing diverse temporal and spatial characteristics that align with the complex environmental factors of orchards. Notably, the characteristics of leaf spot and brown spot were similar, and they shared similar surface features. Consequently, utilizing thesedatasets enabled us to evaluate the performance of the proposed algorithm.
Our experimental materials utilize 14,582 images from the datasets. These images were divided into training, validation, and test sets in a ratio of 6:2:2, with 8745, 2916, and 2921 images, respectively. The distribution of images among the sets for various diseases is shown in Table 1.

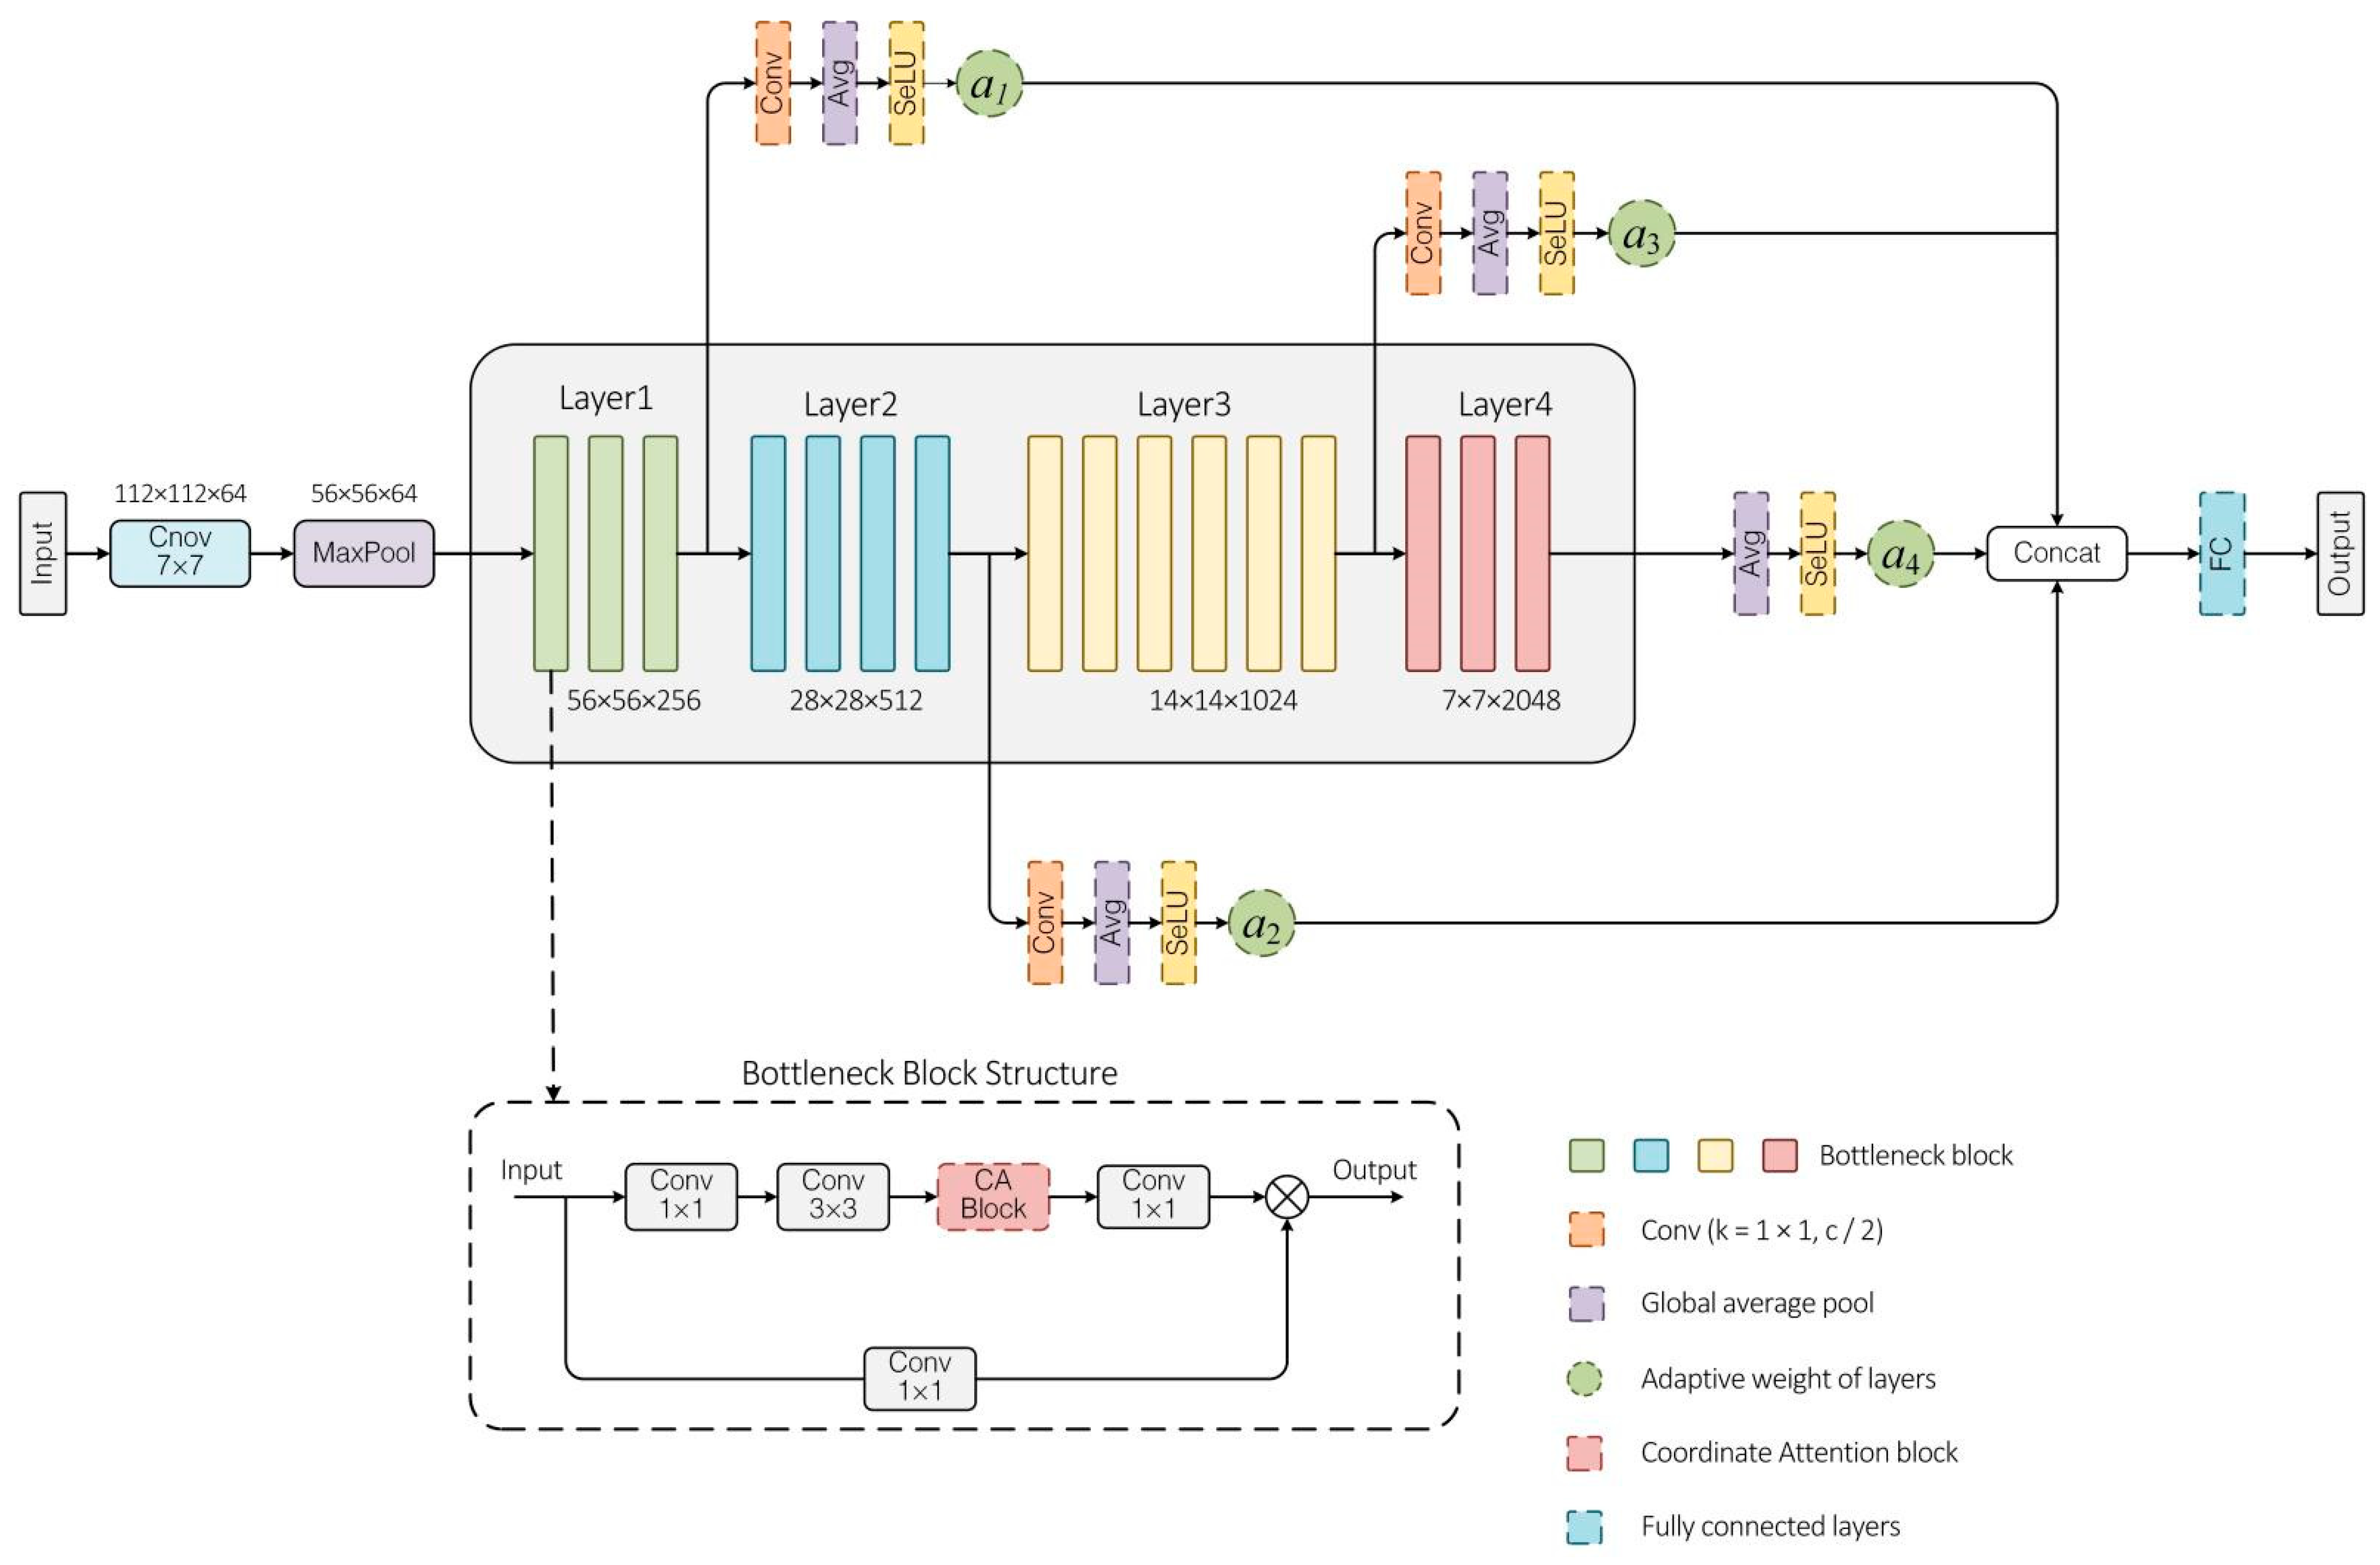
2.2. CA–ResNet-50–WAMSFF Network Model

Due to the uneven distribution and differing sizes of disease spots on apple leaves caused by pests and diseases, some diseases and pest types share surface characteristics that are also similar to those of healthy leaves. This similarity makes it challenging to effectively distinguish between various diseases and pests, which is not ideal for training the network model to identify different categories of apple tree leaf pests and diseases. To accurately identify various types of apple leaf disease spots, we used the ResNet-50 model as the backbone feature extraction network, and after comparative experiments with VGG16, DenseNet, and AlexNet, we found that the ResNet-50 model demonstrated better classification performance on the datasets. To further improve the model’s accuracy, the CA module and weight-adaptive multi-scale feature fusion (WAMSFF) were introduced to create the CA–ResNet-50–WAMSFF network. The experiments showed that this model significantly improved the recognition rate of various apple leaf disease spots.

2.2.1. Model Network Analysis

The ResNet-50 basic network is comprised of four layers, each with a varying number of bottlenecks [25]. The first layer contains three bottlenecks, the second layer contains four bottlenecks, the third layer contains six bottlenecks, and the fourth layer contains three bottlenecks, as shown in Figure 2. A bottleneck is constructed by a basic residual module that includes a 3-point convolution and a 3 × 3 convolution kernel. Once an image is input, it undergoes a 7 × 7 convolution followed by max pooling before being fed into the four layers. The final output size is 2048 num_classes (data category) of weight information, which is obtained through average pooling and fully connected layers.
Since some characteristics (color, texture, shape) of individual types of apple leaf diseases and pests are similar, and the general network is challenging to recognize, the CA attention mechanism module [26] was introduced. The CA attention module is a lightweight attention module, as shown in Figure 3, which can be easily and flexibly embedded in the classical classification network, thereby improving the feature expression ability of the backbone feature extraction network. The CA module decomposes the two-dimensional global pooled feature codes of the early squeeze and excitation (SE) module into two parallel one-dimensional codes, perceiving and mapping feature information at both horizontal and vertical scales, which will more effectively obtain channel and spatial information and improve image feature extraction capabilities.
If the input image tensor is X = x 1 , x 2 , x 3 , x 4 , x 5 x c , X R C × H × W , where R represents the set of real numbers, C represents the channel, H represents the image height, and W represents the image width. The CA attention module decomposes the two-dimensional global pooling operation, and converts it into two one-dimensional global pooling feature codes, and then stitches spatial dimension information in two different directions to obtain X R ( C / r ) × 1 × ( W + H ) , in which spatial positions are encoded in the horizontal and vertical directions, r represents the scaling factor, which is used for the scaling of channels, and X is decomposed into two separate feature maps along two different channels and through two point convolution transformation functions. Then, the final feature maps F   a n d   F are obtained by nonlinear activation function, the input image X is multiplied by the elements with the feature maps F   a n d   F in both directions of the position information, and the Y feature map output by the CA module is obtained, as shown in the following Equation (1):
Y = X · F · F
The main objective of multi-scale feature fusion is to manipulate low-level features obtained during the “coding” phase to achieve feature fusion at different scales. This enables the “coding” stage to obtain features with varying receptive field sizes. There are two primary methods for multi-scale feature fusion, including image pyramid and feature pyramid. In this paper, the study focused on the disease and insect pest characteristics of apple tree leaves. The differences between various disease spots are too small to distinguish. Furthermore, disease spots represent a small portion of the overall area and vary in size. As a result, different receptive field sizes are necessary to extract characteristic information from the disease spots. To address this issue, the researchers applied multi-scale feature fusion to various layers of the ResNet-50 model simultaneously. They also added an attention mechanism and introduced weight-adaptive multi-scale feature fusion, which allowed the model to determine the appropriate layer weight for feature fusion based on the data feature distribution [27]. Consequently, the original backbone network can more effectively extract disease spot feature information of varying scales. Equations (2) and (3) for feature fusion are as follows:
F f = α 1 · F l a y e r 1 + α 2 · F l a y e r 2 + α 3 · F l a y e r 3 + α 4 · F l a y e r 4  
a i = e w i j · e w j ( i = 1,2 , 3,4 ; j = 1,2 , 3,4 )
where F f is the network output after multi-scale feature fusion, a i is the normalized weight, w i is the initial weight, w j is the feature weight, and l a y e r i ( i = 1,2 , 3,4 ) are the four layers of ResNet-50 model. After adding weight-adaptive multi-scale feature fusion, the feature signal also changes with the adaptive weight; in this case, the feature transformation layer for the fixed parameter can only single transform for different feature distributions, which may lead to different strength of feature extraction signals. Two parameters are introduced to make the feature transformation layer adapt to different situations, thereby improving the robustness of the model, and finally mark the adaptive feature transformation after adding the parameters as F c as in the following Equations (4) and (5):
F M = x f x n x f 2
F c = β · F M + σ · F f + ϵ
where F M is the feature after L2 normalization, x f is the extracted feature, x f 2 is L2 normalization, x n is the n th dimension of the feature, and β , σ , and ϵ are the weight parameters of the linear transformation. The F c replaces the original F f as the output after feature fusion.

2.2.2. CA–ResNet-50–WAMSFF Model Improvement Analysis

The improvement method utilized the ResNet-50 model as the backbone extraction model. The overall structure of the model is shown in Figure 4. The CA attention mechanism module is embedded into the bottleneck of the ResNet-50 model. The CA module is behind the residual module and does not decrease the feature extraction ability of the original residual module. The CA module can capture the long-term feature information dependence between network channels, while retaining accurate location information. This step enables the network to capture areas related to apple leaf disease spots without losing precise location information.
After each layer was connected by the CA module, the weight parameters were adjusted by combining the characteristics of the convolution layer. The CA module applied greater weight to the important feature channels and smaller weights to other unimportant channels. This enhanced the global attention of the convolutional neural network, ensuring that the network did not lose the key information of disease spots due to the convolution operation of the previous residual network. This step improved the model’s ability to distinguish different disease spots.
The four layers of ResNet-50 are subjected to multi-scale feature fusion. The input image size is 224 × 224 × 3, with 3 channels. The number of channels in the input image is transformed from 64 to 256 by the first layer, 256 to 512 by the second layer, 512 to 1024 by the third layer, and finally to 2048 by the fourth layer. The channel number in the latter layer is kept as the same as the previous layer after up-sampling and the channel number in each layer is multiplied by the corresponding layer adaptive weight. After feature fusion, the channel size of the feature map changed to 3072. The size of the feature map remains unchanged, but the dimensions of the channels are reduced from 3072 to 2048 after dimension reduction by point convolution. The max pooling layer and average pooling layer are then used to reduce the size of the feature map to the size of 7 × 7 × 2048. The channels number is output by the fully connected layer as the number of data categories, and the results of apple leaf pest identifications are obtained.

2.3. Model Network Training Design

2.3.1. Training Method

Transfer learning was employed in this experiment because images from different datasets often share common underlying features, which makes transfer learning a stable approach for model training. The CA–ResNet-50–WAMSFF network was proposed for transfer learning training. The specific method was as follows. Firstly, the ResNet-50 network model was used to train the initial weights on the large-scale public datasets from ImageNet. Next, the trained weights were transferred to the CA–ResNet-50–WAMSFF network for parameter initialization, and the network model parameters were adjusted for the datasets to enhance the learning performance of the network model, further improving the model’s generalization ability. The stochastic gradient descent (SGD) optimizer was utilized, with an initial learning rate of 0.001. The learning rate was decayed using the cosine descent method, and the model was trained for 100 epochs, with a batch size of 16. The loss function used in the experiment was cross entropy.

2.3.2. Data Augmentation

Given that the datasets were sourced from publicly available data on the Internet, they suffers from an uneven distribution of various types of apple leaf diseases and pests, and the datasets are relatively limited in terms of the number of samples. To enhance the diversity of the datasets and improve the generalization ability of the deep learning network, online data augmentation techniques were applied to the input batch of images at each network layer. This process modified the original input images, effectively increasing the complexity and diversity of the training data without expanding the size of the datasets, which enabled the images to be fed into the network during training, with each iteration further enhancing the input images to improve the generalization ability and robustness of the model. In light of the unique characteristics of apple leaf disease and pest images, the offline enhancement methods include rotation, random color perturbation, and Gaussian blur, as depicted in Figure 5. These data augmentation techniques do not alter the image content, but instead modify the image geometry and color contrast to enhance their complexity and diversity.

2.3.3. Experimental Environment

The software environment employed PyTorch 1.8.1 with CUDA and cuDNN as the deep learning framework, using Python 3.8 as the programming language and Ubuntu 20.04LTS as the operating system. The hardware was equipped with an Intel Xeon Silver CPU, 64 GB of memory, and a GeForce GTX 1070 graphics card with 8GB of video memory.

2.3.4. Experimental Setting

For this experiment, the ResNet-50 network were utilized as the backbone feature extraction network and augmented with the CA attention module and WAMSFF. To demonstrate the effectiveness of our proposed method on the ATLDSD datasets, the model was compared with external baseline models, including VGG16 [28], AlexNet [29], MNASNet [30], DenseNet [31], and GoogLeNet [32]. Furthermore, an internal comparison were conducted among ResNet-50+CA, ResNet-50+WAMSFF, and the standard ResNet-50 under the same testing environment. The experimental design was illustrated in Figure 6.
The evaluation metrics include top-1 accuracy, average recall, and average precision, as in the following Equation (6):
Top - 1 = n u m c n u m a l l × 100 %
where n u m c represents the correct prediction number of samples for apple pests and diseases and n u m a l l represents the total number of samples tested for apple pests and diseases.
P r e c i s i o n i represents the accuracy rate for each category on the datasets, and R e c a l l i represents the recall rate for each category in the datasets, and these are capcualted with the following Equation (7):
P r e c i s i o n i = T P T P + F P R e c a l l i = T P T P + F N
where TP, FP, TN, and FN indicate true positive, false positive, true negative, and false negative, respectively.
Average recall represents the sum of the recalls for each class divided by the total number of classes, and the average precision represents the sum accuracy rates for each category divided by the total categories number, as in the following Equation (8):
A v e r a g e   P r e c i s i o n = i = 0 i = n u m s P r e c i s i o n i n u m s A v e r a g e   R e c a l l = i = 0 i = n u m s R e c a l l i n u m s
where i represents the dataset type, and n u m s represents the number of overall dataset categories.

3. Experimental Results

3.1. CA–ResNet-50–WAMSFF Model Loss Function Analysis

The model was trained using the training method described in Section 2.3.1. The training and validation loss curves were presented in Figure 7. As seen in Figure 7, the training and validation loss decreased rapidly before the 5th epoch, after which the loss values tended to converge at the 20th epoch. The classification precision rate also tended to stabilize, while the verification loss basically converged after the 40th epoch. This indicated that the model reached a saturation state, which demonstrated its effectiveness and rationality.

3.2. CA–ResNet-50–WAMSFF Model Ablation Test

Ablation tests are essential for deep learning research, as they allow the analysis of network modules that have a significant impact on model performance. The control variable method was used to remove parts of the model network modules. Four ablation protocols were employed as follows: (1) Only using the ResNet-50 model; (2) only adding the CA attention mechanism module to the bottleneck of the ResNet-50 model; (3) only adding the weight-adaptive multi-scale feature fusion (WAMSFF) module to the ResNet-50 model; (4) fusing method 2 and method 3 to create the CA–ResNet-50–WAMSFF model presented in this paper.
The results of the four ablation tests were shown in Table 2. Under the same ATLDSD datasets and training environment, the ResNet-50+CA model showed 3.44% higher accuracy, 3.03% higher average recall, and 3.18% higher average precision than the ResNet-50 top-1. The ResNet-50+WAMSFF model showed a 2.66% higher top-1 accuracy, 2.35% higher average recall, and 2.47% higher average precision than ResNet-50. Both the CA module and WAMSFF module improved the model performance, with the CA module showing a slightly higher value-added effect than the WAMSFF module. These results indicate that the CA attention mechanism and WAMSFF module enhanced the effective extraction of input image features and improved the accuracy prediction rate of the model. Moreover, adding both the CA module and WAMSFF module significantly improved the evaluation index of the original model, with a 4.58% higher accuracy rate for top-1, 3.99% higher average recall rate, and 4.54% higher average precision rate. These results confirmed the feasibility and effectiveness of the proposed model.

3.3. Categorical Heat Maps Analysis

To visually demonstrate the effectiveness of the proposed CA-ResNet-50–WAMSFF model, the XGrad-CAM [33] technology was applied to visualize the classification heatmaps after model improvement. Eight representative types of pests and diseases were selected as the characteristics of other diseases and pests. The results are shown in Figure 8.
As can be seen from the figure, for the same pictures of diseases and pests, the image feature information obtained by the original ResNet-50 network is relatively scattered and unable to accurately locate the disease spot. Furthermore, the network only focused on a partial area of the image and was vulnerable to background interference. On the other hand, the improved CA–ResNet-50–WAMSFF model can effectively locate the general position of the disease spots in the image, and the interference from the background area was significantly reduced, which indicated that the CA module and the WAMSFF module can effectively extract the key area information of fine features and are not affected by the background’s non-related feature areas. These results demonstrate that the proposed method has a stronger model characterization ability and can effectively improve the accuracy of apple leaf disease and pest identification.

4. Comparison and Discussion

4.1. Comparison and Discussion in Deep Neural Networks

Ablation testing was used to determine the impact of internal modules on the performance of a model network, in order to better reflect the performance superiority of an improved network. Mainstream deep neural networks, including AlexNet, VGG16, DenseNet, MNASNet, and GoogLeNet, were selected as comparison networks. To ensure fairness of comparison, the same dataset ATLDSD was used. The PyTorch open-source deep learning framework was employed, along with the training method described in Section 2.3.1. The basic architecture of the aforementioned deep learning models was kept unchanged, and the output number of the fully connected layer was modified to 4 to adapt to the 4 categories of diseases and pests in the ATLDSD datasets. All networks employed transfer learning with the same data augmentation methodology.
Table 3 presents the recognition accuracy data of all comparative model networks in the datasets. As seen in Table 3, DenseNet achieves better classification performance than the other networks and is close to that of ResNet-50. VGG16, MNASNet, and GoogLeNet have similar classification performances and belong to deep networks. Since the datasetsare small and the data types are limited, the classification network obtained good classification results.

4.2. Comparison and Discussion with Related Work in the AppleLeaf9 Datasets

To evaluate the performance of the proposed the CA–ResNet-50–WAMSFF model, we made a comparison with the work in the paper [34] using the EfficientNet-MG model in the same AppleLeaf9 datasets. The highest accuracy with EfficientNet-MG model is 99.11%. We validated that the best accuracy with our method was 99.66%, higher than the highest accuracy of 99.11% in the paper [34]. The accuracy usually was 97.06–99.69%, and fluctuated between 1–3%. Given this, we did not take the highest accuracy obtained from training as the final value, but instead took a relatively average value of 98.32%.
The accuracy difference is caused by two factors. Firstly, some images were labeled incorrectly in the datasets, and some images were not clearly characterized as being caused by pests or diseases and cannot be distinguished and labeled correctly. This led to significant randomness in the results. Actually, we found that, in the process of dataset partitioning, if these images are divided into validation or testing sets, it will result in a significant decrease in accuracy; however, if these images are assigned to the training set, the accuracy will improve. Secondly, we considered the issue of overfitting in small datasets. Many pest and disease images are determined coincidentally due to the influence of other noise. In view of this issue, we used the GradCAM method to judge the output of each layer in the network.
Although the previous research on apple leaf disease classification and identification has made some progress, there are still some shortcomings. It is difficult to classify and detect the early apple leaf diseases and insect pests, and there are too few parameters.

5. Conclusions and Future Work

In conclusion, the proposed algorithm using the CA–ResNet-50–WAMSFF model demonstrates excellent performance in the classification and identification of leaf pests of apple disease. By introducing a CA attention mechanism and weight-adaptive multi-scale feature fusion, the proposed algorithm overcomes the limitations of the traditional ResNet-50 model in terms of feature extraction and identification information loss. The top-1 accuracy rate of 98.32% on the AppleLeaf9 datasets, which is 4.58% higher than the value from the original model, shows that the improved model can effectively improve the localization of lesion features. Furthermore, compared with mainstream deep networks, such as AlexNet, VGG16, DenseNet, MNASNet and GoogLeNet on the same datasets, the top-1 accuracy rate increased by 7.3%, 3.19%, 4.98%, 6.04% and 3.87%, respectively. This exceeds the performance of similar mainstream deep network models, demonstrating the potential of the proposed algorithm as a visual recognition scheme for smart agriculture.
However, further improvements are necessary to apply the algorithm to practical scenarios. Firstly, reducing the number of model parameters and optimizing the model further is necessary to deploy the model on mobile devices. Future research will focus on solving these challenges to enable the proposed algorithm to be used in practical applications with large-scale datasets, without sacrificing accuracy.

Author Contributions

Conceptualization, X.Z., F.S. and W.Z.; methodology, X.Z. and F.S.; software, Q.L.; validation, S.S.; formal analysis, R.Z.; investigation, H.L. and S.S.; resources, R.Z.; data curation, X.Z., H.L. and S.S.; writing—original draft preparation, H.L. and X.Z.; writing—review and editing, X.Z. and S.S.; supervision, X.Z.; project administration, F.S.; funding acquisition, W.Z. All authors have read and agreed to the published version of the manuscript.

Funding

This research is co-supported by the Common Technical Innovation Team of Guangdong Province on Preservation and Logistics of Agricultural Products (2023KJ145), National Natural Science Foundation China (52175229), and Guangdong Provincial Ordinary University Innovation Project (2021ZDZX4052 and 2018KTSCXO94).

Data Availability Statement

The ATLDSD dataset is available in the Science Data Bank. https://cstr.cn/31253.11.sciencedb.01627. The AppleLeaf9 dataset is available in the corresponding GitHub repository: https://github.com/JasonYangCode/AppleLeaf9.

Conflicts of Interest

The authors declare no conflict of interest.

References

  1. Zhang, F.; Wang, N.H.; Lan, P.; Wang, Y.; Chen, G.; Zhou, Z.; Sun, F. Research on integrated prediction model of apple yield. Jiangsu Agric. Sci. 2022, 50, 181–186. [Google Scholar]
  2. Zhao, D.; Cheng, C.; Qiu, G.; Dong, Y.; Zhang, C.; Li, Z.; Zhang, H.; Hu, G.; Li, E. Technological innovation approaches for high-quality development of apples. China Fruit Tree 2021, 8, 1–5. [Google Scholar] [CrossRef]
  3. Wang, L.Y.; Zhang, L. Principles and Key Technologies of Pest Control in Apple. World Trop. Agric. Inf. 2021, 10, 3940. [Google Scholar]
  4. Hu, Y.L. Discussion on green control technology of apple diseases and insect pests. South. Agric. 2022, 16, 14–16. [Google Scholar]
  5. Yang, T.; Liu, C. Recognition System for Leaf Diseases of Ophiopogon japonicus Based on PCA-SVM. Res. Plant Dis. Insect Pests 2020, 11, 9–13. [Google Scholar]
  6. Prajapati, H.; Shah, J.; Dabhi, V. Detection and classification of rice plant diseases. Intell. Decis. Technol. 2018, 2, 1–18. [Google Scholar] [CrossRef]
  7. Wen, C.L.; Wu, D.X.; Hu, H.S.; Wei, P. Pose estimation-dependent identification method for field moth images using deep learning architecture. Biosyst. Eng. 2015, 136, 117–128. [Google Scholar] [CrossRef]
  8. Zhang, S.; Zhu, Y.; You, Z.; Wu, X. Fusion of superpixel, expectation maximization and PHOG for recognizing cucumber diseases. Comput. Electron. Agric. 2017, 140, 338–347. [Google Scholar] [CrossRef]
  9. Lu, L.; Kuang, Y.; Chen, L.; Li, G. Research on pest image recognition based on cascade AdaBoost classifier. J. Chin. Agric. Mech. 2019, 40, 127–131. [Google Scholar]
  10. Khan, M.A.; Akram, T.; Sharif, M.; Javed, K.; Saba, T. An automated system for cucumber leaf diseased spot detection and classification using improved saliency method and deep features selection. Multimed. Tools Appl. 2020, 79, 18627–18656. [Google Scholar] [CrossRef]
  11. Chen, J.; Chen, J.X.; Zhang, D. Using deep transfer learning for image-based plant disease identification. Comput. Electron. Agric. 2020, 173, 105393–105403. [Google Scholar] [CrossRef]
  12. Ji, C.; Gao, Z.; Qin, J.; Wang, Z. Overview of Image Classification Algorithms Based on Convolutional Neural Networks. Comput. Appl. 2021, 42, 1044–1049. [Google Scholar] [CrossRef]
  13. Li, K.; Chen, Y.; Liu, J.; Mou, X. A review of target detection algorithms based on deep learning. Comput. Eng. 2021, 48, 1–12. [Google Scholar] [CrossRef]
  14. Weng, Y.; Zeng, R.; Wu, C.; Wang, M.; Wang, X.; Liu, Y. A review of agricultural plant phenotypes based on deep learning. Sci. China 2019, 49, 698–716. [Google Scholar] [CrossRef]
  15. Sabanci, K.; Aslan, M.F.; Ropelewska, E.; Unlersen, M.F.; Durdu, A.A. Novel convolutional-recurrent hybrid network for sunn pest–damaged wheat grain detection. Food Anal. Methods 2022, 15, 1748–1760. [Google Scholar] [CrossRef]
  16. Zhang, X.; Toudeshki, A.; Ehsani, R.; Li, H.; Zhang, W.; Ma, R. Yield estimation of citrus fruit using rapid image processing in natural background. Smart Agric. Technol. 2021, 2, 10027. [Google Scholar] [CrossRef]
  17. Madec, S.; Jin, X.; Lu, H.; De Solan, B.; Liu, S.; Duyme, F.; Heritier, E.; Baret, F. Ear density estimation from high resolution RGB imagery using deep learning technique. Agric. For. Meteorol. 2019, 264, 225–234. [Google Scholar] [CrossRef]
  18. Pound, M.P.; Atkinson, J.A.; Wells, D.M.; Pridmore, T.P.; French, A.P. Deep learning for multi-task plant phenotyping. In Proceedings of the 16th IEEE International Conference on Computer Vision (ICCV), Venice, Italy, 22–29 October 2017; pp. 2055–2063. [Google Scholar]
  19. Peng, H.; Xu, H.; Liu, H. Lightweight agricultural crops pest identification model using improved ShuffleNet V2. Trans. Chin. Soc. Agric. Eng. 2022, 38, 161–170, (In Chinese with English abstract). [Google Scholar] [CrossRef]
  20. Wang, P.; Niu, T.; Mao, Y.; Zhang, Z.; Liu, B.; He, D. Identification of apple leaf diseases by improved deep convolutional neural networks with an attention mechanism. Front. Plant Sci. 2021, 12, 723294. [Google Scholar] [CrossRef]
  21. Di, J.; Qu, J.H. A detection method for apple leaf diseases based on Tiny-YOLO. Shandong Norm. Univ. 2020, 35, 78–83. [Google Scholar]
  22. Zhu, X.; Li, J.J.; Jia, R.C.; Liu, B.; Yao, Z.; Yuan, A.; Huo, Y.; Zhang, H. LAD-Net: A Novel Light Weight Model for Early Apple Leaf Pests and Diseases Classification. IEEE/ACM Trans. Comput. Biol. Bioinform. 2022, 20, 1156–1169. [Google Scholar] [CrossRef] [PubMed]
  23. Nagaraju, Y.; Venkatesh, S.S.; Stalin, S. Apple andgrape leaf diseases classification using transfer learning viafine-tuned classifier. In Proceedings of the International Conference on Machine Learning and AppliedNetwork Technologies (ICMLANT), Hyderabad, India, 20–21 December2020; pp. 1–6. [Google Scholar]
  24. Feng, J.Z.; Chao, X.F. Apple Tree Leaf Disease Segmentation Dataset [DS/OL]. Sci. Data Bank 2022. Available online: https://cstr.cn/31253.11.sciencedb.01627 (accessed on 1 July 2023).
  25. He, K.; Zhang, X.; Ren, S.; Sun, J. Deep residual learning for image recognition. In Proceedings of the 2016 IEEE Conference on Computer Vision and Pattern Recognition, Las Vegas, NV, USA, 27–30 June 2016; IEEE: Piscataway, NJ, USA, 2016; pp. 770–778. [Google Scholar]
  26. Hou, Q.; Zhou, D.; Feng, J. Coordinate attention for efficient mobile network design. In Proceedings of the 34th IEEE Conference on Computer Vision and Pattern Recognition, Nashville, TN, USA, 20–25 June 2021; IEEE Computer Society: New York, NY, USA, 2021; pp. 13713–13722. [Google Scholar]
  27. Xie, Y.; Zhang, W.; Ren, J.; Jing, J. Adaptive Feature Fusion Embedding Network for Few Shot Fine-Grained Image Classification. Comput. Eng. Appl. 2023, 59, 184–192. [Google Scholar]
  28. Simonyan, K.; Zisserman, A. Very deep convolutional networks for large-scale image recognition. arXiv 2021, arXiv:1409.1556. [Google Scholar]
  29. Krizhevsky, A.; Sutskever, I.; Hinton, G.E. ImageNet classification with deep convolutional neural networks. Adv. Neural Inf. Process. Syst. 2012, 25, 1097–1105. [Google Scholar] [CrossRef]
  30. Tan, M.; Chen, B.; Pang, R.; Vasudevan, V.; Sandler, M.; Howard, A. Mnasnet: Platform-aware neural architecture search for mobile. In Proceedings of the 32th IEEE Conference on Computer Vision and Pattern Recognition (CVPR), Long Beach, CA, USA, 16–20 June 2019; pp. 2820–2828. [Google Scholar]
  31. Huang, G.; Liu, Z.; Van Der Maaten, L.; Weinberger, K.Q. Densely connected convolutional networks. In Proceedings of the 30th IEEE Conference on Computer Vision and Pattern Recognition (CVPR 2017), Honolulu, HI, USA, 21–26 July 2017; pp. 4700–4708. [Google Scholar]
  32. Szegedy, C.; Liu, W.; Jia, Y.; Sermanet, P.; Reed, S.; Anguelov, D.; Erhan, D.; Vanhoucke, V.; Rabinovich, A. Going deeper with convolutions. In Proceedings of the 28th IEEE Conference on Computer Vision and Pattern Recognition (CVPR 2015), Boston, MA, USA, 7–12 June 2015; pp. 1–9. [Google Scholar]
  33. Fu, R.; Hu, Q.; Dong, X.; Guo, Y.; Li, B. Axiom-based Grad-CAM: Towards Accurate Visualization and Explanation of CNNs. In Proceedings of the 33stBritish Machine Vision Conference (BMVC 2020), Manchester, UK, 7–11 September 2020; pp. 1–18. [Google Scholar]
  34. Yang, Q.; Duan, S.; Wang, L. Efficient Identification of Apple Leaf Diseases in the Wild Using Convolutional Neural Networks. Agronomy 2022, 12, 2784. [Google Scholar] [CrossRef]
Figure 1. Schematic diagram of the types of pests and diseases in the AppleLeaf9 datasets.
Horticulturae 09 01046 g001
Figure 2. Schematic diagram of the ResNet-50 network structure.
Horticulturae 09 01046 g002
Figure 3. CA attention module structure. Note: Nonlinear activation means nonlinear activation function; BN means batch normalization; Concat means concatenation; X/Y AvgPool means average pooling in the X/Y direction; Conv2D means convolution kernel.
Horticulturae 09 01046 g003
Figure 4. Schematic diagram of the CA–ResNet-50–WAMSFF network. Note: α 1 , α 2 , α 3 , α 4 are the same characters as in Equations (2) and (3).
Horticulturae 09 01046 g004
Figure 5. Data augmentation.
Horticulturae 09 01046 g005
Figure 6. Experiment design flow.
Horticulturae 09 01046 g006
Figure 7. Training loss and validation loss curve.
Horticulturae 09 01046 g007
Figure 8. Classification effect heatmaps of apple leaf disease and insect pests.
Horticulturae 09 01046 g008
Table 1. Classification of apple tree leaf disease species in the AppleLeaf9datasets.
Types of Pests and DiseasesNumber of ImagesDataset Partitioning
Number of Training SetsNumber of Validation SetsNumber of Test Sets
Alternaria leaf spot4172508384
Brown spot4112468283
Frogeye leaf31811908636637
Grey spot3391376172172
Health516309103104
Mosaic3712227475
Powdery mildew1184710237237
Rust27531651551551
Scab5410324610821082
Table 2. CA–ResNet-50–WAMSFF model ablation test results.
Model No.ModelTop-1 AccuracyAverage RecallAverage Precision
1ResNet-5095.31%95.62%95.31%
2ResNet-50+CA97.89%97.68%97.21%
3ResNet-50+WAMSFF97.77%97.97%97.78%
4ResNet-50+CA+WAMSFF98.32%98.41%98.23%
Note: CA represents CA attention mechanism module; WAMSFF represents weight-adaptive multi-scale feature fusion.
Table 3. Performance of different network models on the ATLDSD datasets.
No.Model TypeTop-1 AccuracyAverage RecallAverage Precision
1AlexNet91.02%91.23%91.06%
2DenseNet95.01%95.34%95.21%
3VGG1693.34%93.56%93.81%
4MNASNet92.28%92.13%92.45%
5GoogLeNet94.45%94.67%94.71%
Disclaimer/Publisher’s Note: The statements, opinions and data contained in all publications are solely those of the individual author(s) and contributor(s) and not of MDPI and/or the editor(s). MDPI and/or the editor(s) disclaim responsibility for any injury to people or property resulting from any ideas, methods, instructions or products referred to in the content.

