Article

Efficient Cold Tolerance Evaluation of Four Species of Liliaceae Plants through Cell Death Measurement and Lethal Temperature Prediction

1
Department of Arboretum and Garden, Green City Office, Gwangju 61636, Republic of Korea
2
Division of Forest Environment Resource, Institute of Agriculture of Life Science, Gyeongsang National University, Jinju 52828, Republic of Korea
3
Department of Seed and Seedling Management, National Forest Seed Variety Center, Chungju 27495, Republic of Korea
4
Department of Information, Statistics and RINS, Gyeongsang National University, Jinju 52828, Republic of Korea
5
Forest Biomaterials Research Center, National Institute of Forest Science, Jinju 52817, Republic of Korea
*
Author to whom correspondence should be addressed.
These authors contributed equally to this work (Co-first Author).
Horticulturae 2023, 9(7), 751; https://doi.org/10.3390/horticulturae9070751
Submission received: 25 May 2023 / Revised: 23 June 2023 / Accepted: 24 June 2023 / Published: 28 June 2023

Abstract

:
Although Liliaceae are valuable resource plants with medicinal and edible uses, techniques for evaluating their tolerance to various abiotic stresses are very limited. This study evaluated the cold tolerance using visual inspection, electrolyte leakage, and Evan’s blue assay. Visual inspection of the responses to different temperatures, using a temperature range of 4 to −12 °C, showed that Scilla scilloides was receive the least damage. However, electrolyte leakage tests showed slightly different results from visual inspection. The median lethal temperature (LT50) was expected to be between −4 and −8 °C. The LT50 was considered a measure of damage due to electrolyte leakage in plant cold tolerance evaluation. As a result of predicting the lethal temperature using the logistic regression equation, the average LT50 of the four plants was −9.0 °C. The species with the lowest LT50 was measured for Hosta plantagines (−11.14°C), whereas the highest LT50 was measured for Hemerocallis fulva (−7.14°C). As a result of the Evan’s blue assay, it was found that cell necrosis occurred when the plants were exposed to low temperatures. Visual observation showed that more than 50% of the three plants’ cells, except for H. plantaginea, were stained blue even at 8 °C. From this result, H. plantaginea was judged to have strong low-temperature tolerance. At −12 °C, more than 50% of the four Liliaceae plants were colored blue, and the LT50 value was expected to be below −12 °C. The reducing sugar content, an indicator of plant cold tolerance, was the highest in H. plantaginea, followed by S. scilloide and H. longipes. Combining the three methods, H. plantaginea had the highest cold tolerance, followed by H. longipes, S. scilloides, and H. fulva. The results of this study will be widely used in selecting cold-tolerant useful resource plants.

1. Introduction

Plants are continuously exposed to their natural environment. Plants are sometimes damaged by abiotic stresses such as cold, heat, drought, and salinity [1]. As global warming progresses, abnormal climate change occurs worldwide, including in the Korean Peninsula. The Korean peninsula is becoming polarized, where summer is very hot and winter very cold. In addition, due to irregular cold waves such as frost that suddenly appear in the early spring and winter, the plants can become frozen once they reach temperatures below the limits that they can withstand [2]. Freezing injury is one of the most severe problems during germination and early seedling growth.
Stress is any substance or stimulus that restricts plant metabolism, growth, development, or crop productivity, and includes biotic and abiotic stresses [3,4]. Cold stress, including chilling (0–15 °C) and freezing (<0 °C), is an abiotic stress that adversely affects the growth and agricultural productivity of plants [5,6].
Generally, various methods for measuring plant life and death include visual inspection and electrolyte leakage [7]. The electrolyte leakage method, the TTC reduction method (2,3,5-triphenyl tetrazolium chloride reduction), the regrowth test, etc., have been used in the evaluation of the cold tolerance of plants [8]. Electrolyte leakage is generally the first method used in evaluating cold stress among the other stress factors [9]. When plants are exposed to cold stress, they lose membrane permeability, which results in electrolyte leakage. The measured electrolyte leakage values can be applied to a non-linear regression curve to estimate the temperature at which the electrolyte leakage was 50%. The derived LT50 values are also used to compare plant cold tolerance in each species [10,11]. Evan’s blue assay identifies plant cells’ death under heavy metal stress [12]. This method allows for identifying dead cells visually using a microscope and comparing the species by numerical percentage.
The numerical expression of low-temperature tolerance levels is often required in temperature stress studies. The relationship between low-temperature stress and electrolyte leakage has the form of an S-shaped response curve, and the temperature at which 50% of electrolyte leakage begins to be observed is defined as the median lethal temperature, LT50 [10,13,14]. Estimation of the LT50 has been attempted primarily using linear interpolation, the logistic model, and the Gompertz model [15].
The genus Lilium, a member of the family Liliaceae, contains about 110 to 115 taxa and is mainly distributed in cold and temperate regions of the northern hemisphere [16]. It is one of the most important flowering crops as cut flowers, horticultural plants, and potted plants [17]. Liliaceae plants are ornamental, but flowers and bulbs, which are roots, are used for food in China and Korea [18,19]. In oriental medicine and oriental medicine folk remedies, lily is used for the treatment of bronchitis, pain relief, neuralgia, etc., and it is said that it has effects such as moistening the lungs, affecting sleep, coughs, affecting the heart, and softening the nerves. Lily bulbs contain various alkaloids, such as colchicine, ferulic acid, p-coumaric acid, sinapic acid, capsanthin, starch, proteins, and fats [1]. However, Liliaceae plants living in temperate regions struggle to survive due to global warming. Temperature stress induces physiological and molecular-level changes in Lilium, affecting growth and development [20]. For this reason, studies should be conducted to evaluate the degree of damage suffered by such plants after a cold period.
Many studies have been conducted to test the tolerance of plants to abiotic stresses resulting from climate change [21]. However, plant cold tolerance studies have mainly focused on crops and fruits such as wheat, barley, pear, grape, and peach [22,23,24,25]. In particular, these studies focus on cold tolerance tests by measuring electrolyte leakage. Cold tolerance studies of Lilaceae plants are very rare. Xu et al. [26] predicted the thermotolerance and cold tolerance of Chinese wild Lilium based on open plant and related environmental data sets rather than physiological experiments. However, there is no study that approaches the cold tolerance of four Lilaceae plants from a physiological point of view. The evaluation of plant cold tolerance is still low in accuracy and reliability, so it is necessary to improve its reliability.
The hypotheses for conducting this study are as follows. First, will the cold tolerance of Liliaceae plants be measured using a combination of LT50 and visual inspection? Second, can we anatomically observe the cell death of plant tissues in response to ROS stress in Liliaceae plants? Third, is there is a relationship with biochemical defense substances against cold stress, and what kind of compounds are they?
This study used various cold resistance evaluation methods such as visual inspection, electrolyte measurement, reducing sugar, anatomical evaluation of cell death and derivation of nonlinear regression coefficient to confirm the cold tolerance of Liliaceae plants; these were lacking in previous studies to determine cold tolerance.

2. Materials and Methods

2.1. Experimental Plants

The four Liliaceae (Hemerocallis fulva (L.)L., Hosta longipes (Franch. & Sav.) Matsum., Hosta plantagines (Lam.) Asch. and Scilla scilloides (Lindl.) Druce) used in this study were obtained from Gyeongsangnam-do Forest Environment Research Institute (Jinju, Republic of Korea). Seeds and plants of the Liliaceae plants were identified by Professor Hyun-Sik Moon, Department of Forestry and Environmental Resources, Gyeongsang National University, who majored in plant taxonomy. The seedlings were planted in the same sized pots (top diameter: 16 cm, bottom diameter: 11 cm, height: 17 cm) containing soil composed of peat moss, perlite, and vermiculite (1:1:1, v/v/v). Then, the seedlings were acclimated for three months in the growth chamber under a photoperiod of 16 h illumination with a light intensity of 25 µmol m−2s−1 and 8 h dark at 25 ± 1 °C. Similar sized seedlings were collected to avoid experimental errors and used for further experiments. The plants used in the study had an average height of 16.4 ± 2.77 cm, an average diameter at the root collar of 0.8 ± 0.1 cm, and average leaf width of 6.73 ± 0.52 cm2.

2.2. Cold Treatment

For the low-temperature treatment, the experiment was conducted by setting the interval and setting the temperature referring to the method [27]. Low-temperature treatment was initially applied at −6 °C at 12 h intervals. However, it was difficult to determine the difference in damage to the plants. Instead of increasing the low-temperature treatment time to −6 °C, the plants were treated at various temperatures to test the cold tolerance.
Plants at 25 °C were placed at 4° C for 48 h to precool. It was confirmed in a preliminary experiment that the precooling treatment increases the survival rate after the treatment at a temperature below the freezing point. Fully fledged low-temperature treatment was performed at 0 °C for 30 min, −4 °C for 30 min, −8 °C for 30 min, and −12 °C for 30 min each. After low-temperature treatment, the plants were placed again at 4 °C to recover (Figure 1).

2.3. Visual Inspection of Cold-Treated Plants

Cold treatment of Liliaceae plants was performed in a laboratory freezer (SH-75BS, Seyoung Scientific Co., Republic of Korea). After cooling the plants for 48 h at 4 °C, the cold treatment of all plants was carried out by allowing the plants to be cold at −6 °C intervals from 12 h up to 48 h. Specific standards quantified leaf damage rates according to the method in [28]. The following scale recorded the visual damage from freezing: 0 = no damage, 1 = ≤10% damage, 2 = 11~50% damage, 3 = 51~90% damage, 4 = ≥90% damage, 5 = dead.

2.4. Electrolyte Leakage and Prediction of Lethal Temperature

In order to measure the value of electrolyte leakage, 5 g of leaves were placed in a 15 mL tube and treated at a low temperature. The leaves were then placed in 25 mL of distilled water and extracted in a shaker for 6 h. The electrolyte leakage value (Lt) was measured using a conductivity meter (VE 4810, Korea Scientifics, Seoul, Republic of Korea). After the leaves were completely dead following treatment using an autoclave at 121 °C for 15 min, they were cooled down, and then we measured the electrolyte leakage value (Ltm) again. The relative electrolyte leakage (Rt, %) was calculated based on Equation (1) [9].
Rt   ( % ) = 100 × L t L t m
The LT50 means the median lethal temperature (Figure 2). The LT50 represents the temperature at which the electrolyte leakage level reaches the mid-point between the lowest and highest levels. In this study, the temperature at which the electrolyte leakage was over 50% was used, and this was a relatively easy method to compare plants [29,30]. The plant’s response to cold stress appears as a sigmoid curve in the lethal temperature function [31]. Using the following basic formula (Equation (2)), the lethal temperature of the plant was estimated. According to many previous studies, the relationship between cold stress and electrolyte leakage also shows a sigmoid curve [10,32,33]. In this study, a non-linear regression method was used to obtain the LT50.
The lethal temperature prediction has been applied via linear interpolation, using the logistic model and Gompertz model [15]. To predict the LT50 temperature from the basic sigmoid function (Equation (2)), the baseline logistic model (Equation (3)) was used by setting the baseline level of the electrolyte leakage value (z), the slope of the inflection point (k), and the LT50 (Tm) as parameters.
f ( k ) = 1 1 + e k
f ( k ) = 1 + ( 100 z ) 1 + e k ( T T m )

2.5. Measurement of Cell Death of Cold-Treated Plants

After the same temperature treatment, cells were well dyed with 1 mL of 1% (w/v) Evan’s blue and incubated for 6 h. The cells were rinsed with deionized water. Dyed leaf cells were photographed using a microscope at 200x magnification (BH, Olympus, Japan). To figure out the extent of dyeing in the dead cells, they were dissolved in 50 mL (w/v) ethanol which contained 2% (w/v) SDS at 60 °C for 30 min, and we measured the absorbance at 500 nm. The leaves were treated in an autoclave at 121 °C for 15 min. The obtained values were used to estimate the degree of cell death by using Equation (4).
Inhibition   index = A b s C A b s N C A b s P C A b s N C × 100 %
AbsC: absorbance value of the cold-stressed sample; AbsNC: absorbance value of negative control; AbsPC: absorbance value of positive control.

2.6. Determination of Reducing Sugar Contents

To find out how plants produce reducing sugars during the precooling period, we treated plants at 4 °C (precooling temperature) for 48 h. The soluble reducing sugar was assessed by the DNS (3,5-dinitrosalicylic acid) method [34]. After weighing 0.1 g of plant leaves, the leaves were placed in a 15 mL tube containing 5 mL distilled water and extracted for 30 min. The extracted solution, filtered through the filter paper, was added to the DNS solution. Moreover, the output was measured by a UV spectrometer at 565 nm. The obtained values were used to estimate the degree of reducing the sugar using Equation (5).
Reducing   sugar   Index = A b s 25 ° C A b s 4 ° C A b s 25 ° C × 100 %

2.7. Selection of Cold-Tolerant Plants

Cold-tolerant plants were finally selected by estimating the lethal temperature using the above visual inspection, electrolyte leakage, Evan’s blue staining method, and estimating lethal temperature by the logistic regression equation.

2.8. Statistical Analysis

The visual inspection data were analyzed using the non-parametric ANOVA analysis. Duncan’s multiple range tests were used to test the statistical significance at α = 0.05. The baseline logistic regression model predicted the LT50 from the electrolyte leakage data. The statistical analysis was conducted using SAS version 9.3 (SAS Institute Inc., Cary, NC, USA).

3. Results

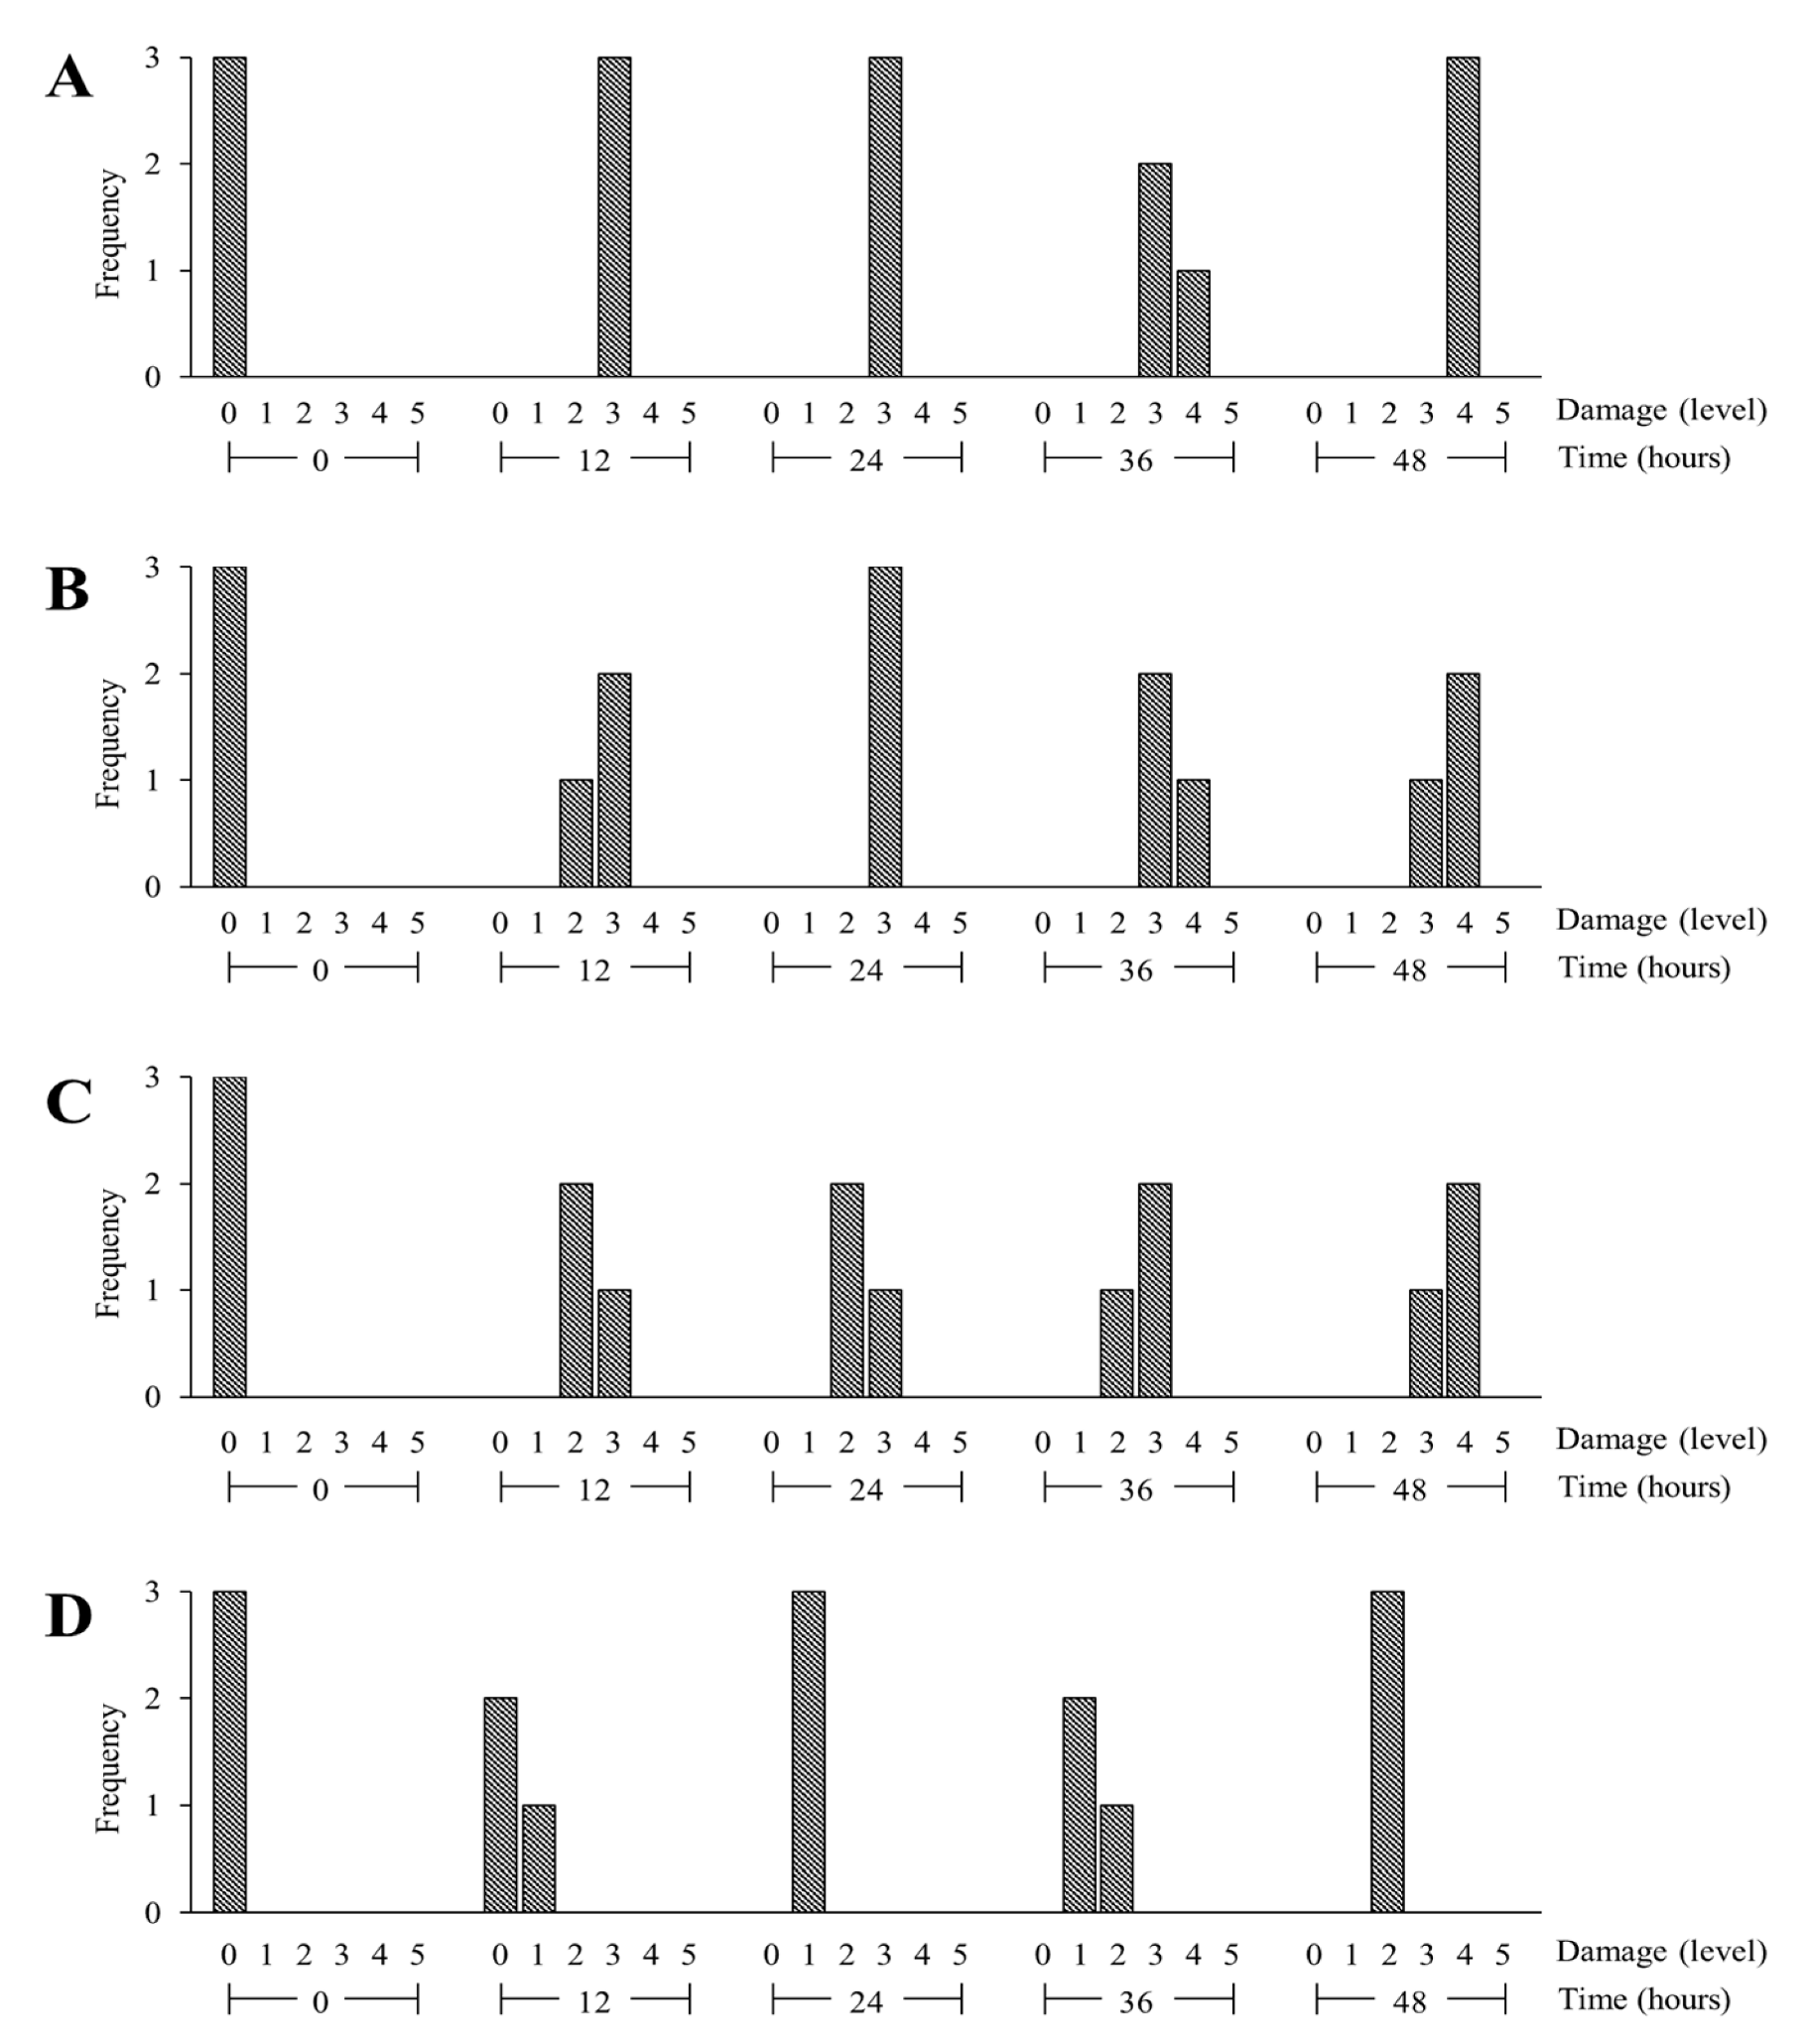
3.1. Visual Inspection of Cold-Treated Plants

The damage levels of Liliaceae plants at low temperatures were visually analyzed (Figure 3 and Figure 4). As the treatment time of all species increased from 0 to 48 h, the low-temperature damage became larger. All the plant species were slightly damaged after 12 h of cold treatment. They suffered some cold damage, and the low-temperature damage ratings of these plants were between 0.3 and 3.0. H. fulva was the most affected species at low temperatures, and S. scilloides was almost unaffected.
For the 24 h treatment, the visual damage of H. fulva and H. longipes were the same as the result for the 12 h treatment. However, H. plantaginea and S. scilloides obtained 3 points and 1 point, respectively, and it was judged that the visual damage increased.
In the case of 36 h of treatment, H. fulva and H. longipes showed the same points of 3.3. However, H. plantaginea and S. scilloides had 3.3 and 1.3 points, respectively.
After 48 h, the cold damage of the plant increased. The most damaged species among the plant species was H. fulva. On the other hand, S. scilloides had the lowest visual damage. In this study, the most tolerant plant to cold was S. scilloides, followed by H. longipes, H. plantaginea, and H. fulva. As the treatment time increased, the visual damage increased, and the degree of damage was different for each species.

3.2. Measurement of Electrolyte Leakage Value

The electrolyte leakage values of all of the species increased as the treatment temperature reduced (Table 1). Thus, the lower the temperature, the greater the leakage of electrolytes and the greater the cell membrane damage.
At 4 °C, plants’ electrolyte leakage values were 3–4 except for S. scilloides. The electrolyte leakage value was not significantly increased at 4 °C compared to 0 °C in all four species, the difference was 1%, and the electrolyte leakage was highest in S. scilloides. The values at −4 °C were not significantly different from the 0 °C treatment except in H. plantaginea. The values at −8 °C increased rapidly except in H. plantaginea. H. fulva showed more than 70% values, and the LT50 is expected to appear between −4 and −8 °C. At −12 °C, since all of the plants had values above 50%, the LT50 is expected to show up between −8 and −12 °C, except for H. fulva which has its LT50 values as already shown. The values of electrolyte leakages at −12 °C were not statistically different. The results show that the LT50 of each plant appeared at temperatures above −12 °C, so the damage after the LT50 is not much different. The LT50 is considered to be important in the ability to measure damage by electrolyte leakage in the cold tolerance evaluation of plants. The tolerance to low temperatures in this study was highest in H. plantaginea, followed by H. longipes, S. scilloides, and H. fulva.

3.3. Prediction of Lethal Temperature

The electrolyte leakage values above were obtained using a logistic regression equation (Figure 5). It was necessary to cut the plant leaves to measure the electrolyte leakage, and it was expected that the standard value (z) would be at least 0. The standard values of electrolyte leakage (z) showed much difference, which was judged to be due to the characteristics of each species. We also tried to obtain the inflection point temperature (Tm) through this study, which was located in the middle of the curve. This temperature is where more than 50% of electrolyte leakage occurs.
Table 2 shows the LT50 values of the four Liliaceae plants obtained from the baseline logistic function and the 95% confidence interval of the LT50. The mean lethal temperature of all four species was −9.0 °C. The value of H. fulva was −7.16 °C, which was the lowest, and those of the other plants were in the order of S. scilloides and H. longipes. On the other hand, the LT50 of H. plantagines was −11.14 °C.

3.4. Determine the Degree of Cell Damage in Cold-Treated Plants

When the plants were exposed to low temperatures, the results showed that the lower the treatment temperature, the darker the Evan’s blue dyeing (Figure 6). The completely dead cells of the plants treated at −12 °C were stained with a deep blue color. All of the species were not stained at 4 °C treatments, so it was judged that there was no damage. Plants were dyed dark blue at 0, −4, −8, and −12 °C. At 0 °C, H. fulva, H. plantaginea, and S. scilloides were stained blue, but H. longipes were almost not stained. However, H. plantaginea and S. scilloides were stained dark at −4 °C, but H. fulva and H. longipes did not change significantly. In visual observation, more than 50% of all three plants except H. plantaginea were stained blue at 8 °C. From this result, it was judged that H. plantaginea has strong tolerance against low temperature. At −12 °C, it was expected that 50% or more of all four plants would be stained blue, and the LT50 value appeared below −12 °C. However, since the degree of dyeing was different for each plant, it is considered that the damage at low temperature was different for each plant.
As a result of staining with Evan’s blue reagent, the degree of staining and LT50 were different for each temperature (Figure 7). The LT50 of H. fulva was highest (23%) at 4 °C, and the LT50 values of H. longipes, H. plantaginea, and S. scilloides were less than 20% at 0 °C, while H. fulva had its highest value of 30% at 4 °C. At −4 °C, the LT50 values were below 10% for all four plants. However, the LT50 values of H. fulva and S. scilloides reached more than 50% at −8 °C. These two species were expected to have an LT50 value at about −8 °C, and the other species’ tolerance at low temperatures were considered to be relatively weaker. However, the LT50 values of the other two species appeared at lower temperatures. At −12 °C, the LT50 values of all four plants were more than 50%. The degree of dyeing was in the order of H. longipes, S. scilloides, H. fulva, and H. plantaginea at −12 °C. From the above results, H. plantaginea was more tolerant of low temperatures, followed by H. longipes, S. scilloides, and H. fulva.
In order to select cold-tolerant Liliaceae plants, cold tolerance evaluation was performed using visual inspection, electrolyte leakage, and Evan’s blue assay. Visual inspection, observed at −6 °C at 12 h intervals, showed that S. scilloides was most tolerant of low temperatures, followed by H. longipes, and H. fulva. However, electrolyte leakage showed slightly different results from visual inspection. In tests measured by the LT50 value, the tolerance to low temperatures was highest in H. plantaginea, followed by H. longipes, S. scilloides, and H. fulva. In the LT50 measurements using the baseline logistic function, the value of H. fulva was the lowest, at −7.16 °C, and the values of the other plants were, in order, S. scilloides and H. longipes.

4. Discussion

The Liliaceae showed different degrees of damage to low temperatures, and the degree of damage increased with increasing treatment time. Plants can be divided into cold-tolerant and -sensitive plants depending on their ability to survive under cold stress conditions. Since stress tolerance mechanisms of plants may differ from species to species at developmental stages, cold tolerance varies greatly depending on the species [35]. Sakai and Weiser [36] reported that Pinus ponderosa, Pinus monticola, and Pinus controta, northern pine trees, can withstand temperatures of −60 to −80 °C. On the other hand, the southern pine trees, such as Pinus palustris and Pinus elliottii, can only survive to below −15 °C. Plants suffer morphological changes, such as chlorosis, germination, necrosis, and wilting leaves when subjected to low temperatures [37]. Based on the above changes, we performed the visual inspection method.
However, since the experiential knowledge of the observer judges the visual measurement method, it is not an objective judgment. Nonetheless, low-temperature plant damage generally leads to changes in color [38], and these changes have been used as a critical indicator of cold tolerance [39]. The visual inspection showed that S. scilloides was more tolerant, followed by H. longipes, H. plantaginea, and H. fulva.
Visual inspection reported more stable results when mixed with other methods [38]. Visual inspection by the SPAD method or measurement of chlorophyll or photosynthesis rate was more reliable than visual inspection alone [40]. This study performed an electrolyte leakage test following the visual inspection.
The electrolyte leakage method is generally the method that most tests the response of plants to low temperatures [41]. The measured electrolyte leakage value was applied to the nonlinear regression curve to estimate the temperature at which the electrolyte leakage was 50%. Furthermore, the induced LT50 values are used to compare the cold tolerance of each plant species [10,11]. This study showed the same S-shaped curve as reported in previous studies [42]. Lethal temperature predictions due to electrolyte leakage have been shown to overestimate cold tolerance by predicting relatively low lethal temperatures at low temperatures rather than actual plant regeneration [10,13,43]. However, since this study aimed to compare and predict the lethal temperature between plants, it was concluded that the cold tolerance comparison between plants was possible because the experiment was carried out under the same conditions. Nevertheless, it is important to find a way to compensate for the overestimation error in the cold tolerance for a more accurate assessment.
The visual measurement results in this study had a high correlation with electrical conductivity. The same results were reported due to measuring the damage from the sea on Satsuma mandarin [44].
The Evan’s blue staining method has been extensively used to indicate cell death [45,46]. Plants exposed to cold stress show various phenotypic symptoms that include reduced leaf expansion, wilting and chlorosis (yellowing of leaves), and may lead to necrosis (death of tissue) [47]. Plants under low-temperature (both chilling and freezing) stress can induce programmed cell death [48]. It was reported that tobacco BY-2 suspension cells exposed to 5–6 °C for 2–5 weeks progressively developed characteristic features of programmed cell death, including DNA condensation and fragmentation (laddering) [49].
Furthermore, studies have been conducted on the way that the cell organelles of cold-stressed plants respond to stress. Recently, cold stress has been shown to induce the death of columella stem daughter cells and, in turn, induce DNA damage of rhizome cells (early progeny), preventing the further division of columella stem cells [50]. It also identifies plant cell death under stress conditions [12]. This method has been quantified using naked microscopy to identify dead cells and to compare species [51]. The four lilies were completely stained at −8 or −12 °C, respectively, and the LT50 values were at −8 or −12 °C when compared with the degree of dyeing. That is, the degree of dyeing with the Evan’s blue reagent was visually observed, and the damage to the cells became larger as the temperature was lowered.
Xu et al. [26] divided the adaptability of Lilium to temperature stress into five groups based on open-access plant and related environmental data sets. In addition, based on multi-source data integrated at the taxon level, the heat and cold tolerance of Lilium was predicted according to environmental conditions. As a result, among 42 taxa, individuals with potential for heat or cold resistance were predicted as 13 taxa. As a result, among 42 taxa, individuals with potential for heat or cold resistance were predicted as 13 taxa. The optimal temperature for Lilium growth is around 18–22 °C [52,53]. The cold-tolerant group could withstand a cold environment below −5 °C [26]. Another previous study showed that cold stress inhibited the growth of lily bulbs at −8 °C [54,55]. In this study, the lowest temperature affecting cold tolerance was −8.44 to −11.71 °C, and the upper limit temperature was −5.86 °C to −10.58 °C. In the case of H. plantaginea, the predicted lethal temperature was −11.14 °C. Some of the plant species in this study, such as H. plantaginea, were not included in the study species [26]. The difference in lethal temperature seems to vary according to the plant species, but it is judged that the difference caused by the analysis method is more significant. Measuring cold tolerance through physiological experiments rather than climate data will enable the degree of tolerance to be judged more accurately.
Furthermore, the experiments in this study were conducted at an experimentally controllable temperature; however, this is different from the temperature of the actual natural environment. The point at which the LT50 appears in Nature may differ. However, it was considered possible to compare the cold tolerance of each plant under the same controlled conditions in the laboratory because the LT50 is the most sensitive and crucial part of the cold tolerance measurement and is the most used measure to compare cold tolerance between plants [56,57,58]. For a more reliable evaluation of cold tolerance, it is imperative to conduct further research, especially in the field.
As a result of measuring the amount of reduced sugars, there was a difference between the two species. Many studies have reported the relationship between sugar content and cold tolerance in plants at low temperatures. Plants make osmotic substances to adapt to cold stress [59]. Based on these studies, we measured how much reducing sugar is produced during the precooling period when plants adapt to low temperatures. Sugar accumulation is known to increase cold tolerance by effectively controlling cell membrane protection or cellular osmotic potential [60,61]. For this reason, H. plantaginea was judged to have a strong cold tolerance because it has a relatively high level of reducing sugars.
In this study, the most cold-tolerant Liliaceae plant was H. plantaginea. H. plantaginea is a cold-tolerant perennial plant of the Liliaceae plants, and about 70 species are distributed worldwide. There are 40 to 50 species in the center of Korea, China, and Japan [62]. The leaf shape of H. plantaginea is good, and some flowers have a scent, so it is widely used as a flower bed and garden both in the East and the West. In recent years, leaves (patterned species) have also been used as materials for potting and flower arrangements that can be appreciated indoors. However, there are no reports of the cold tolerance of these species. A similar study found that in Harbin City, China, we selected a species of the Liliaceae plants that could survive in winter. Among Hosta undulate, H. plantaginea, and H. plantaginea cv. Rosea, H. undulate has been reported to have the highest cold tolerance. This species is a perennial plant and is expected to be used as a botanical plant on slopes as well as having various pharmacological effects, and it is used indoor and outdoor horticultural plant. Figure 8 shows the sequence of an efficient method for selecting Liliaceae cold-tolerant plants and further measuring the cold tolerance of other crops.
On the other hand, the LT50 of H. plantagines showed the highest value, at −11.14 °C. As a result of staining with Evan’s blue reagent, H. longipes, S. scilloides, H. fulva, and H. plantaginea were stained in that order at −12 °C, which was the lowest temperature. In summarizing the above results, H. plantaginea is the most tolerant to low temperatures, followed by H. longipes, S. scilloides, and H. fulva.

5. Conclusions

The results of cold stress in four species of Liliaceae plants satisfied all the hypotheses mentioned above. First, it was confirmed that H. plantaginea had the highest cold resistance by visual inspection and electrolyte leakage measurement. As a result of predicting the lethal temperature using the logistic regression equation, the average lethal temperature of the four plants was −9.0 °C. On the other hand, the LT50 of H. plantagines, which was analyzed to have the highest cold resistance, showed the highest value, at −11.14 °C. Second, the Evan’s blue assay could identify the cold-tolerant plant species more clearly by measuring the cell death of plant tissues in response to ROS stress in Liliaceae plants. Third, in Liliaceae plants, reducing sugars, a biochemical defense substance against cold stress, were measured at higher levels as the temperature went down, consistent with previous cold resistance test results. As a result of this study, instead of measuring the cold resistance of plants, a series of methods of predicting lethal temperatures based on visual inspection, electrolyte leakage, and EC values and, finally, measuring cell death through anatomical analysis can be used to determine cold-resistant plants more accurately. The results of this study will be widely used to select cold-resistant plants other than the species of this study.

Author Contributions

Conceptualization, W.-H.Y. and M.-S.C.; methodology, W.-H.Y. and D.-J.P.; validation, S.-H.Y. and M.-S.C.; formal analysis, S.-J.A.; investigation, W.-H.Y., S.-H.Y., D.-H.K., K.-B.P. and E.-J.J.; data curation, W.-H.Y. and S.-H.Y.; writing—original draft preparation, W.-H.Y.; writing—review and editing, S.-H.Y., M.-S.C. and S.-J.A.; visualization, S.-H.Y. and D.-J.P.; supervision, M.-S.C. All authors have read and agreed to the published version of the manuscript.

Funding

This research was funded by ’R&D Program for Forest Science Technology’ grant number 1405005940 ‘Project No. 2023478A00-2325-BC03’. And the APC was funded by ’R&D Program for Forest Science Technology’ (Project No. 2023478A00-2325-BC03).

Data Availability Statement

Data are contained within the article.

Acknowledgments

We would like to thank the Gyeongsangnam-do Forest Environment Research Institute for cooperating with the collection of seeds. This study was carried out with the support of ’R&D Program for Forest Science Technology (Project No. 2023478A00-2325-BC03)’ provided by Korea Forest Service (Mass supply and distribution of promising wild vegetables specialized in the southern region revitalization project in 2023).

Conflicts of Interest

The authors declare no conflict of interest.

References

  1. Wang, M.; Liao, W. Carbon monoxide as a signaling molecule in plants. Front. Plant Sci. 2016, 7, 572. [Google Scholar] [CrossRef] [PubMed] [Green Version]
  2. Zohner, C.M.; Renner, L.M.S.; Crowthe, T.W. Late-spring frost risk between 1959 and 2017 decreased in North America but increased in Europe and Asia. Proc. Natl. Acad. Sci. USA 2020, 117, 12192–12200. [Google Scholar] [CrossRef] [PubMed]
  3. Lichtenthaler, H.K. The stress concept in plants: An introduction. In Stress of Life: From Molecules to Man; Csermely, P., Ed.; New York Academy of Sciences: New York, NY, USA, 1998; Volume 851, pp. 187–198. [Google Scholar]
  4. Lee, S.Y.; Jung, J.A.; Sung, J.K.; Ha, S.K.; Lee, D.B.; Kim, T.W.; Song, B.H. Responses of nutrient uptake, carbohydrates and antioxidants against low temperature in plants. Korean J. Agric. Sci. 2014, 41, 75–83. [Google Scholar]
  5. Guo, X.; Liu, D.; Chong, K. Cold signaling in plants: Insights into mechanisms and regulation. J. Integr. Plant Biol. 2018, 60, 745–756. [Google Scholar] [CrossRef] [Green Version]
  6. Liu, J.; Shi, Y.; Yang, S. Insights into the regulation of C-repeat binding factors in plant cold signaling. J. Integr. Plant Biol. 2018, 60, 780–795. [Google Scholar] [CrossRef] [Green Version]
  7. Murray, M.B.; Cape, J.N.; Fowler, D. Quantification of frost damage in plant tissues by rates of electrolyte leakage. New Phytol. 1989, 113, 307–311. [Google Scholar] [CrossRef]
  8. Kim, I.H. Development of Shallow-Extensive Green Roof System for Urban Greening. Ph.D. Thesis, Gyeongsang National University, Jinju, Republic of Korea, 2006. [Google Scholar]
  9. Dexter, S.T.; Tottingham, W.E.; Graber, L.F. Preliminary results in measuring the hardiness of plants. Plant Physiol. 1930, 5, 215–223. [Google Scholar] [CrossRef] [PubMed] [Green Version]
  10. Kim, I.H.; Huh, K.Y.; Jung, H.J.; Choi, S.M.; Park, J.H. Modeling methodology for cold tolerance assessment of Pittosporum tobira. Korean J. Hortic. Sci. Technol. 2014, 32, 241–251. [Google Scholar] [CrossRef] [Green Version]
  11. Xie, H.; Sun, Y.; Cheng, B.; Xue, S.; Cheng, D.; Liu, L.; Meng, L.; Qiang, S. Variation in ICE1 methylation primarily determines phenotypic variation in freezing tolerance in Arabidopsis thaliana. Plant Cell Physiol. 2019, 60, 152–165. [Google Scholar] [CrossRef]
  12. Gonzalez-Mendoza, D.; Quiroz-Moreno, A.; Medrano, R.E.; Grimaldo-Juareza, O.; Zapata-Perezd, O. Cell viability and leakage of electrolytes in Avicennia germinans exposed to heavy metals. Z. Für Nat. C J. 2009, 64, 391–394. [Google Scholar] [CrossRef]
  13. Szalay, L.; Gyökös, I.G.; Békefi, Z. Cold hardiness of peach flowers at different phenological stages. Hortic. Sci. 2018, 45, 119–124. [Google Scholar] [CrossRef]
  14. Su, L.; Dai, Z.; Li, S.; Xin, H. A novel system for evaluating drought–cold tolerance of grapevines using chlorophyll fluorescence. BMC Plant Biol. 2015, 15, 82. [Google Scholar] [CrossRef] [PubMed] [Green Version]
  15. Lindén, L. Measuring Cold Hardiness in Woody Plants. Ph.D. Thesis, Applied Biology, Horticulture, University of Helsinki, Helsinki, Finland, 2002. [Google Scholar]
  16. Du, Y.P.; He, H.B.; Wang, Z.X.; Wei, C.; Li, S.; Jia, G.X. Investigation and evaluation of the genus Lilium resources native to China. Genet. Resour. Crop Evol. 2013, 61, 395–412. [Google Scholar] [CrossRef]
  17. Suh, J.K.; Wu, X.W.; Lee, A.K.; Roh, M.S. Growth and flowering physiology, and developing new technologies to increase the flower numbers in the Genus Lilium. Hortic. Environ. Biotechnol. 2013, 54, 373–387. [Google Scholar] [CrossRef]
  18. Asano, Y. Study on crosses between distantly related species of Lilies. V. Characteristics of newly obtained hybrids through embryo culture. J. Jpn. Soc. Hortic. Sci. 1980, 49, 392–396. [Google Scholar] [CrossRef] [Green Version]
  19. Seo, C.B. Ilustrated Flora of Korea; Hyangmoonsa: Seoul, Republic of Korea, 1979; pp. 206–209. [Google Scholar]
  20. Jia, W.J.; Ma, L.L.; Ding, K.; Cui, G.F.; Wu, L.F.; Wang, X.N.; Wang, J.H. Characters of sap flow of Lilium and its relations with environment factors. Xibei Zhiwu Xuebao 2012, 32, 2498–2505. [Google Scholar]
  21. Pereira, A. Plant Abiotic Stress Challenges from the Changing Environment. Front. Plant Sci. 2016, 7, 1123. [Google Scholar] [CrossRef] [Green Version]
  22. Hong, Y.K.; Jang, Y.J.; Seong, M.H.; Moon, M.S.; Choi, D.C. Viability of barley, wheat and oat by low temperature treatment. Korean J. Med. Crop Sci. 2003, 48, 172–173. [Google Scholar]
  23. Seo, Y.H.; Park, Y.S.; Jo, B.W.; Kang, A.S.; Jung, B.C.; Jung, Y.S. Regional distribution of peach freezing damage and chilling days in 2010 in Gangwon province. Korean J. Agric. For. Meteorol. 2010, 12, 225–231. [Google Scholar] [CrossRef] [Green Version]
  24. Lim, B.S.; Jung, D.S.; Yun, H.K.; Hwang, Y.S.; Chun, J.P. Symptoms of freezing injury and mechanical injury-induced fruit rot in ‘Niitaka’ pear fruit (Pyrus pyrifolia Nakai) during low temperature storage. Korean J. Hortic. Sci. Technol. 2005, 23, 282–286. [Google Scholar]
  25. Kwon, E.Y.; Jung, J.E.; Chung, U.R.; Lee, S.J.; Song, G.C.; Choi, D.G.; Yun, J.I. A thermal time-driven dormancy index as a complementary criterion for grape vine freeze risk evaluation. Korean J. Agric. For. Meteorol. 2006, 8, 1–9. [Google Scholar]
  26. Xu, J.; Chai, N.; Zhang, T.; Zhu, T.; Cheng, Y.; Sui, S.; Li, M.; Liu, D. Prediction of temperature tolerance in Lilium based on distribution and climate data. iScience 2021, 24, 102794. [Google Scholar] [CrossRef] [PubMed]
  27. Lindén, L.; Palonen, P.; Lindén, M. Relating Freeze-induced Electrolyte Leakage Measurements to Lethal Temperature in Red Raspberry. J. Am. Soc. Hortic. Sci. 2000, 125, 429–435. [Google Scholar] [CrossRef]
  28. Walker, D.J.; Romero, P.; Hoyos, A.; Correal, E. Seasonal change in cold tolerance, water relations and accumulation of cations and compatible so-lutes in Atriplex halimus L. Environ. Exp. Bot. 2008, 64, 217–224. [Google Scholar] [CrossRef]
  29. Von Fircks, H.A.; Verwijst, T. Plant viability as a function of temperature stress. Plant Physiol. 1993, 103, 125–130. [Google Scholar] [CrossRef]
  30. Burr, K.E.; Tinus, R.W.; Wallner, S.J.; King, R.M. Comparison of three cold hardness tests for conifer seedlings. Tree Physiol. 1990, 6, 351–369. [Google Scholar] [CrossRef]
  31. Janacek, J.; Prasil, I. Quantification of plant frost injury by nonlinear fitting of an S-shaped function. CryoLetters 1991, 12, 47–52. [Google Scholar]
  32. Iles, J.K.; Agnew, N.H. Seasonal cold-acclimation patterns of Sedum spectabile × telephium L. ‘Autumn Joy’ and Sedum spectabile Boreau. ‘Brilliant’. HortScience 1995, 30, 1221–1224. [Google Scholar] [CrossRef] [Green Version]
  33. Ingram, D.L.; Buchanan, D.W. Measurement of direct heat injury of roots of three woody plants. HortScience 1981, 16, 769–771. [Google Scholar] [CrossRef]
  34. Miller, G.L. Use of Dinitrosalicylic acid reagent for determination of reducing sugar. Anal. Chem. 1959, 31, 426–428. [Google Scholar] [CrossRef]
  35. Foolad, M.; Lin, G.Y. Relationship between cold tolerance during seed germination and vegetative growth in tomato: Analysis of response and correlated response to selection. J. Am. Soc. Hortic. Sci. 2001, 126, 216–220. [Google Scholar] [CrossRef] [Green Version]
  36. Sakai, A.; Weiser, C.J. Freezing resistance of trees in North America with reference to tree regions. Ecology 1973, 54, 118–126. [Google Scholar] [CrossRef]
  37. Sanghera, G.S.; Wani, S.H.; Hussain, W.; Singh, N.B. Engineering cold stress tolerance in crop plants. Curr. Genom. 2011, 12, 30–43. [Google Scholar] [CrossRef] [Green Version]
  38. Hyun, U.J.; Yeo, S.M.; Lee, S.B.; Lee, J.H.; Jeong, J.M.; Seong, Y.K.; Seo, D.H.; Won, Y.J.; Ahn, E.K.; Lee, J.H.; et al. Optimization of temperature regime to screen cold tolerant rice seedlings. Plant Breed. Biotechnol. 2016, 4, 176–187. [Google Scholar] [CrossRef] [Green Version]
  39. Lee, M.H.; Beak, J.K.; Kim, K.M.; Kim, K.H.; Kang, C.S.; Lee, G.E.; Choi, J.Y.; Son, J.Y.; Ko, J.M.; Choi, C.H. Assessment of cold tolerance traits of Wheat cultivars using RGB images. Korean J. Breed. Sci. 2022, 54, 171–176. [Google Scholar] [CrossRef]
  40. Kim, G.S.; Sa, J.G.; Huh, B.L. Response to low temperature of rice culti-vars for mid-northern area at rooting stage after transplanting. Korean J. Crop Sci. 1989, 34, 170–176. [Google Scholar]
  41. Kreyling, J.; Schmid, S.; Aas, G. Cold tolerance of tree species is related to the climate of their native ranges. J. Biogeogr. 2015, 42, 156–166. [Google Scholar] [CrossRef]
  42. Zhu, G.; Liu, Z.; Zhu, P. A study on determination of lethal temperature with logistic function. J. Nanjing Agric. Univ. 1986, 9, 11–16. [Google Scholar]
  43. Repo, T.; Lehto, T.; Finér, L. Delayed soil thawing affects root and shoot functioning and growth in Scots pine. Tree Physiol. 2003, 10, 1583–1591. [Google Scholar] [CrossRef] [Green Version]
  44. Nesbitt, M.L.; Ebel, R.C.; Findley, D.; Wilkins, B.; Woods, F.; Himelrick, D. Assays to assess freeze injury of Satsuma mandarin. HortScience 2002, 37, 871–877. [Google Scholar] [CrossRef] [Green Version]
  45. Smith, B.A.; Reider, M.L.; Fletcher, J.S. Relationship between vital staining and subculture growth during the senescence of plant tissue cultures. Plant Physiol. 1982, 70, 1228–1230. [Google Scholar] [CrossRef] [PubMed] [Green Version]
  46. Oprisko, M.J.; Green, R.L.; Beard, J.B.; Gates, C.E. Vital staining of root hairs in 12 warm-season perennial grasses. Crop Sci. 1990, 30, 947–950. [Google Scholar] [CrossRef]
  47. Yadav, S.K. Cold stress tolerance mechanisms in plants. Agron. Sustain. Dev. 2010, 30, 515–527. [Google Scholar] [CrossRef] [Green Version]
  48. Lyubushkina, I.V.; Grabelnych, O.I.; Pobezhimova, T.P.; Stepanov, A.V.; Fedyaeva, A.V.; Fedoseeva, I.V.; Voilikov, V.K. Winter wheat cells subjected to freezing temperature undergo death process with features of programmed cell death. Protoplasma 2014, 251, 615–623. [Google Scholar] [CrossRef]
  49. Koukalova, B.; Kovarik, A.; Fajkus, J.; Siroky, J. Chromatin fragmentation associated with apoptotic changes in tobacco cells exposed to cold stress. FEBS Lett. 1997, 414, 289–292. [Google Scholar]
  50. Jing, H.H.; Savina, M.; Jing, D.; Devendran, A.; Ramakanth, K.K.; Xin, T.; Wei, S.S.; Mironova, V.V.; Jian, X. A sacrifice-for-survival mechanism protects root stem cell niche from chilling stress. Cell 2017, 170, 102. [Google Scholar]
  51. Truernit, E.; Haseloff, J. A simple way to identify non-viable cells within living plant tissue using confocal microscopy. Plant Methods 2008, 4, 15. [Google Scholar] [CrossRef] [Green Version]
  52. Yin, H.; Chen, Q.; Yi, M. Effects of short-term heat stress on oxidative damage and responses of antioxidant system in Lilium longiflorum. Plant Growth Regul. 2007, 54, 45–54. [Google Scholar] [CrossRef]
  53. Xin, H.; Zhang, H.; Chen, L.; Li, X.; Lian, Q.; Yuan, X.; Hu, X.; Cao, L.; He, X.; Yi, M. Cloning and characterization of HsfA2 from lily (Lilium longiflorum). Plant Cell Rep. 2010, 29, 875–885. [Google Scholar] [CrossRef]
  54. Du, F.; Anderson, N. Bulb tissue cold-tolerance sensitivity differences in non-hardy and winter hardy Lilium. HortScience 2009, 44, 1013. [Google Scholar]
  55. Tian, X.; Xie, J.; Yu, J. Physiological and transcriptomic responses of Lanzhou Lily (Lilium davidii, var. unicolor) to cold stress. PLoS ONE 2020, 15, e0227921. [Google Scholar] [CrossRef] [PubMed]
  56. Anderson, J.A.; Kenna, M.P.; Taliaferro, C.M. Cold hardiness of ‘Midiron’ and ‘Tifgreen’ bermudagrass. HortScience 1988, 23, 748–750. [Google Scholar] [CrossRef]
  57. Cardona, C.A.; Duncan, R.R.; Lindstrom, O. Low temperature tolerance assessment in Paspalum. Crop Sci. 1997, 37, 1283–1291. [Google Scholar] [CrossRef]
  58. Kim, I.H.; Huh, K.Y.; Huh, M.R. Cold tolerance assessment of Sedum species for shallow-extensive green roof system. Korean J. Hortic. Sci. Technol. 2010, 28, 22–30. [Google Scholar]
  59. Ruelland, E.; Vaultier, M.N.; Zachowski, A.; Hurry, V. Cold signalling and cold acclimation in plants. Adv. Bot. Res. 2009, 49, 35–150. [Google Scholar]
  60. Tarkowski, L.P.; Ende, W.V. Cold tolerance triggered by soluble sugars: A multifaceted countermeasure. Front. Plant Sci. 2015, 6, 203. [Google Scholar] [CrossRef] [Green Version]
  61. Kooiker, M.; Drenth, J.; Glassop, D.; McIntyre, C.L.; Xue, G.P. TaMYB13-1, a R2R3 MYB transcription factor, regulates the fructan synthetic pathway and contributes to enhanced fructan accumulation in bread wheat. J. Exp. Bot. 2013, 64, 3681–3696. [Google Scholar] [CrossRef] [Green Version]
  62. Lee, C.B. Korea Illustrated Plant Book; Hyangmunsa: Seoul, Republic of Korea, 1982; pp. 1–791. [Google Scholar]
Figure 1. The low temperature treatment model of test plants used in this study.
Horticulturae 09 00751 g001
Figure 2. The value of LT50 at low temperatures.
Horticulturae 09 00751 g002
Figure 3. The visual observations of different species, according to cold treatments. ((A): H. fulva, (B): H. longipes, (C): H. plantaginea, and (D): S. scilloide.)
Horticulturae 09 00751 g003
Figure 4. The visual damage changes of different species, according to cold treatments. After cooling the plants at 4 °C for 48 h, the plants were cooled again at −6 °C intervals from 12 h up to 48 h. Visual damage of freezing was recorded as 0 = no damage, 1 = ≤10% damage, 2 = 11 to 50% damage, 3 = 51 to 90% damage, 4 = ≥90% damage, 5 = death. ((A): H. fulva, (B): H. longipes, (C): H. plantaginea, and (D): S. scilloide.)
Horticulturae 09 00751 g004
Figure 5. Scatter plot and fitted electrolyte leakage curve under low temperatures. ((A): H. fulva, (B): H. longipes, (C): H. plantaginea, and (D): S. scilloide).
Horticulturae 09 00751 g005
Figure 6. Determination of the cell death rate of Liliaceae plants using Evan’s blue staining method. ((A): H. fulva, (B): H. longipes, (C): H. plantaginea, and (D): S. scilloide.)
Horticulturae 09 00751 g006
Figure 7. Changes in Evan’s blue staining appearance under low temperatures. ((A): H. fulva, (B): H. longipes, (C): H. plantaginea, and (D): S. scilloide.)
Horticulturae 09 00751 g007
Figure 8. Experimental method schematic for the selection of cold-tolerant plant species.
Horticulturae 09 00751 g008
Table 1. Electrolyte leakage values of Liliaceae plants at different low-temperature treatments.
Scientific NameElectrolyte Leakage (Mean ± SE, %)
4 °C0 °C−4 °C−8 °C−12 °C
H. fulva3.9 ± 0.74 b*4.3 ± 0.59 b5.7 ± 0.83 a70.7 ± 9.33 a76.1 ± 13.46 a
H. longipes7 ± 1.16 a8.5 ± 0.89 a9.4 ± 5.89 a42.2 ± 24.16 b89.9 ± 3.75 a
H. plantaginea2.4 ± 0.37 b3.6 ± 0.39 b3.9 ± 1.04 a45.4 ± 8.25 ab76.1 ± 10.9 a
S. scilloides2.7 ± 0.55 b3.7 ± 0.85 b7.4 ± 1.53 a10 ± 2.4 c69.5 ± 14.35 a
* The means with the same superscripts within a column are not significantly different at p < 0.05.
Table 2. The LT50 values obtained by electrolyte leakage under low temperatures.
Scientific NameEstimated
Lethal Temperature (°C)
Confidence Limits (95%)
Lowest Temp. (°C)Highest Temp. (°C)
Hemerocallis fulva−7.15−8.44−5.86
Hosta longipes−8.87−9.71−8.03
Hosta plantaginea−11.14−11.71−10.58
Scilla scilloides−8.77−9.68−7.86
Disclaimer/Publisher’s Note: The statements, opinions and data contained in all publications are solely those of the individual author(s) and contributor(s) and not of MDPI and/or the editor(s). MDPI and/or the editor(s) disclaim responsibility for any injury to people or property resulting from any ideas, methods, instructions or products referred to in the content.

