Article

Physiological and Molecular Screening of High Temperature Tolerance in Okra [Abelmoschus esculentus (L.) Moench]

1
Centre for Carbon, Water and Food, School of Life and Environmental Sciences, Sydney Institute of Agriculture, University of Sydney, Brownlow Hill, NSW 2570, Australia
2
Plant Breeding Institute, School of Life and Environmental Sciences, Sydney Institute of Agriculture, University of Sydney, Cobbitty, NSW 2570, Australia
*
Author to whom correspondence should be addressed.
Horticulturae 2023, 9(6), 722; https://doi.org/10.3390/horticulturae9060722
Submission received: 24 May 2023 / Revised: 14 June 2023 / Accepted: 15 June 2023 / Published: 19 June 2023
(This article belongs to the Section Biotic and Abiotic Stress)

Abstract

:
Okra is a vegetable crop adapted to summer temperatures, but heat stress has been shown to reduce its growth and productivity. We measured physiological traits of 104 okra genotypes in response to high temperature, augmented by the molecular characterization of selected genotypes to identify parents for crossing. Genotypes were exposed to a short heat shock (45 °C, 4 h) in a controlled environment, followed by the assessment of chlorophyll fluorescence (Fv/Fm, Fv′/Fm′) and stomatal conductance (gs). DNA was isolated from all genotypes using a modified CTAB method with additional PVP and RNase, and the amplification of 8 polymorphic SSR markers was used to generate a dendrogram. This preliminary screening identified 33 polymorphic genotypes with less than 50% genetic similarity and contrasting Fv′/Fm′ and gs responses. More detailed physiological measurements (Fv/Fm Fv′/Fm′, gs, photosynthesis (A), efficiency of the open reaction centre (ΦPSII), and electrolyte leakage (EL)) were conducted after exposure to 45 °C for 6 h and compared to the control (30 °C). EL did not significantly increase in the heat treatment; in contrast, there were significant genotype and treatment effects observed for fluorescence (Fv/Fm, Fv′/Fm′) and photosynthetic parameters (A, ΦPSII, gs). In conclusion, cell membranes in okra remained unaffected after short periods of heat stress, whereas the ranking of differences of measured physiological traits (∆) between control and heat-treated plants (∆Fv′/Fm′, ∆Fv′/Fm′, ∆A, ∆ΦPSII, ∆gs) was indicative of genotype sensitivity to heat.

1. Introduction

Heat stress can significantly impact plant growth and development and result in a subsequent reduction in crop yield [1]. Different plant species or cultivars need various temperatures to optimize their productivity [2,3]; however, exposure to temperatures above the optimum (either short- or long-term) can result in the inhibition of growth. Okra (Abelmoschus esculentus), an important and nutritional vegetable in Africa and Asia [4], is a summer crop well adapted to elevated temperatures and has been classified as heat tolerant with optimal growth and productivity at 34 °C [5]. Nevertheless, high temperature can impair okra development and productivity [5,6,7,8,9,10]. Even a few minutes exposure to temperatures above optimal growth temperatures (i.e., heat shock) can disrupt physiological processes [1,11,12,13], and photosynthesis is among the first processes to be inhibited under high temperatures [14,15]. Photosynthetic reduction can result from increases in photo- and mitochondrial respiration and the inactivation of photosystem II (PSII) or Rubisco activase [16]. Heat shock between 2 min and 2 h has been shown to reduce photosynthesis, chlorophyll fluorescence, and stomatal conductance [17,18,19,20]. Chlorophyll fluorescence is especially useful for assessing the activity of PSII and the electron transport chain in intact leaves in response to stresses [15,21,22,23,24] and can be measured as the ratio of variable to maximum fluorescence in the dark (Fv/Fm) or the light (Fv′/Fm′) [21]. Fv/Fm has been used extensively to measure plant responses to stress because it is easily assessed [25]. For example, Fv/Fm was reduced as a result of increased Fo and decreased Fm under high temperatures [18,26,27]. Similarly, Fv/Fm in okra was reduced by 10.5% under water stress [28]. However, this ratio requires dark acclimation for at least 30 min to be effective [25]. Fluorescence parameters in light-adapted leaves, including Fv′/Fm′ and the efficiency of open reaction centres (ΦPSII), might be better suited for field measurements, as they do not need extended dark acclimation or equilibration time required for gas exchanges. ΦPSII denotes the proportion of PSII reaction centres that are photochemically active, and this proportion reduces under stress [29,30]. The reductions in Fv′/Fm′ and ΦPSII under high temperatures indicate both structural and functional damages to PSII [14,26], which can lead to reduction in photosynthetic rate (A) and subsequent plant growth.
Photosynthesis is further reduced when plants close their stomata to prevent water loss under high temperatures, resulting in limited CO2 availability to the Calvin cycle [18,26,31,32]. Furthermore, heat can have a detrimental effect on cell membranes, specifically the thylakoid membranes, where the photosynthetic apparatus is located. Under high temperatures, the phospholipid bilayer of a cell membrane becomes unstable and disrupts the lipid–protein interaction, leading to an increase in membrane permeability, the loss of electrolytes, and disturbance to PSII activity and ATP generation [33,34]. However, if water availability is high, plants may increase their stomatal conductance (gs) to increase evaporative cooling and lower leaf temperature to alleviate stress, reducing the limitation to internal CO2 concentration [14,18].
To ensure that the best varieties adapted to environmental stresses can be developed through breeding, genetic diversity is crucial. Okra is characterized by large variations in morphology [35], but little is known of its genetic diversity. Diversity has been assessed using morphological markers [36,37,38,39]; however, molecular markers provide better estimates of genetic diversity, as they are not influenced by the environment [39,40]. Although studies of okra genetic diversity are limited, some evidence has been published using Simple Sequence Repeats (SSR) [41,42,43], Random Amplification of Polymorphic DNA (RAPD) [39,44,45,46], and Amplified Fragment Length Polymorphisms (AFLP) [47].
This study aimed to identify heat-tolerant okra genotypes characterized by high genetic diversity. Physiological measurements such as fluorescence, gas exchange, and electrolyte leakage were used to screen a large pool of genotypes in a controlled environment after exposure to a heat shock in comparison to an untreated control. Thirty-five previously published SSR markers from A. esculentus and Medicago truncatula (Table A1) were used to amplify genomic DNA to identify genetic variation among the 104 okra genotypes and to identify the best SSR markers for okra screening.

2. Materials and Methods

2.1. Plant Material

One-hundred-and-four okra genotypes from different countries of origin were obtained from the Vegetable Research Institute (VRI) and the World Vegetable Centre, previously known as the Asian Vegetable Research and Development Centre (AVRDC) (Table S1). Seeds were sown in pots filled with a potting mix consisting of nine parts composted pine bark and one part washed river sand and supplemented with all trace elements at 0.4 kg m−3, 1 kg m−3 gypsum, 1 kg m−3 superphosphate, 0.25 kg m−3 KNO3 (13% N), 0.25 kg m−3 nitroform (38% N), and 1.5 kg m−3 magrilime. Plants were kept in a glasshouse with natural light for 4 weeks at the Plant Breeding Institute (PBI), the University of Sydney, New South Wales (NSW), Australia, with day/night temperatures of 30 °C/25 °C. As the different lists contained different information—the AVRDC lists contained vegetable introduction (VI) numbers specific to this organization, and not all genotypes had a variety name—genotypes were labelled by their list number and genotype number (e.g., the first genotype in Table S1 was labelled L2-1).

2.2. DNA Isolation, Quantification and Qualification

Young and tender fresh leaves (approximately 100 mg) were collected for DNA isolation 3 weeks after sowing. Samples were collected in Eppendorf tubes, frozen immediately in liquid nitrogen, and stored at −80 °C. The samples were then freeze-dried using a Kinetics Thermal System (Model: FD-1-54D, UK) for 24 h and then ground immediately with a ball mill (Retsch Mixer Mill MM 400, Retsch GmbH, Haan, Germany). A cetyl trimethylammonium bromide (CTAB) extraction method [48] was modified to extract okra DNA. The ground leaf samples were transferred to Eppendorf tubes and 1 mL of 2× CTAB extraction buffer containing 2% w/v polyvinylpyrrolidone (PVP), and 2-mercaptoethanol (2%) was added. The solution was mixed well and incubated in a 65 °C water bath for 30 min before the addition of 250 µL of cold phenol and 250 µL of cold chloroform/isoamyl alcohol to each tube. Tubes were mixed by inversion until a thick emulsion formed, centrifuged at 13,000 rpm for 30 min, and supernatants transferred to a new sterile Eppendorf tube. One volume (equivalent to supernatants volume) of cold chloroform/isoamyl alcohol was added to each tube, mixed by inversion, centrifuged at 13,000 rpm for 15 min, and the top phase was subsequently transferred to new sterile Eppendorf tubes. To precipitate DNA, 0.1 volume (equivalent to top phase volume) of 3M sodium acetate (pH 5.2) and 1 volume (equivalent to top phase volume) of cold isopropanol were added, and the tubes were stored at −20 °C overnight. The next day, tubes were centrifuged at 13,000 rpm for 30 min, the supernatant decanted, and 1 mL of cold ethanol (70%) added, mixed, and centrifuged at 13,000 rpm for 20 min. Again, the supernatant was decanted and pellets air dried before re-suspension in 200 µL of double deionised water and stored at 4 °C overnight. The next day, 1 µL of RNase (100 mg mL−1) was added to each tube before incubation at 37 °C overnight.
DNA quantification was performed using 1 µL of material on a Nanodrop, ND-1000 spectrophotometer (NanoDrop Technologies, Inc., Wilmington, DE, USA). The purity of DNA was assessed using the absorbance ratios of A260/A280 for protein contaminants and A260/A230 for organic contaminants, as nucleic acids absorb at 260 nm, proteins at 280 nm, and organic compounds at 230 nm. Ideally, purified DNA should have a A260/A280 ratio between 1.65 and 1.8 and a A260/A230 ratio between 1.5 and 1.8 [49]. DNA quality was assessed using a 2% agarose gel (3 g agarose in 150 mL of Tris/Borate/EDTA (1× TBE) buffer, stained with 3 µL of gel red and run in an electrophoresis system at 120 volts for 30 min. The DNA bands were analysed against the standard lambda DNA and bands were visualized under UV light (ChemiDoc™ MP Imaging System, Image Lab™ Software, Version 5.1). The stock DNA was then diluted with double deionised water (ddH2O) to a final working concentration of 25 ng µL−1 in 200 µL.

2.3. SSR Primers and Polymerase-Chain Reaction (PCR)

Nineteen SSR primers from A. esculentus [42] (Table A1, Nos. 1–19) and sixteen SSR primers from Medicago truncatula [41] (Table A1, Nos. 20–35) were ordered from Sigma-Aldrich and used to amplify okra genomic DNA (total of 35 primers). The stock primers were diluted to a final working solution of 10 ng µL−1 in 200 µL ddH2O.
PCR amplifications were conducted in a final volume of 15 µL, containing 5 µL of 25 ng µL−1 DNA, 4.05 µL of ddH2O, and 5.95 µL of master mix (10× Buffer, Bioline Cat No. BIO-21040). PCR was performed using two different programs for Medicago and okra SSR markers. For Medicago SSR markers, an initial incubation of 1 min at 94 °C was followed by 35 cycles of denaturation at 94 °C for 1 min, annealing at 45 °C for 1 min, and elongation at 72 °C for 2 min. A final extension of 72 °C for 10 min was followed by an incubation at 4 °C [41]. For okra SSR markers, the program described by Schafleitner et al. [42] was modified to an initial incubation at 95 °C for 10 min, followed by 35 cycles of denaturation at 95 °C for 30 s, annealing at 53 °C for 45 s, and elongation at 72 °C for 45 s. A final extension of 7 min at 72 °C was followed by incubation at 4 °C.
PCR products were separated using 3.5% agarose gel (7 g of agarose, 200 mL of 1× TBE buffer and 4 µL of gel red) electrophoresis. An aliquot of 1.5 µL of loading dye was added to 4 µL of PCR products and loaded on the gel against 2 µL of HyperLadder™ IV (BIOLINE) and run at 100 volts for 3 h. Bands were visualized under UV light (ChemiDoc™ MP Imaging System, Image Lab™ Software, v5.1).

2.4. Photosynthetic Parameters

Fv/Fm, Fv′/Fm′, ΦPSII, A, and gs were measured on the most recent, top mature leaf in both the control and heat treatments using a Licor 6400XT fitted with a fluorescence light source (LI-COR, Lincoln, NE, USA). Reference CO2 was set to 400 µmol mol−1, photosynthetically active radiation (PAR) to 1300 µmol m−2 s−1, and flow rate to 300 mL min−1. Fluorescence parameters were assessed in the light (Fv′/Fm′) and again in the dark (Fv/Fm) after dark adaptation of all plants for 1 h at 30 °C. Due to the large number of genotypes (104) in the initial screening (4 h heat shock), stomatal conductance was measured using a porometer (SC-1, Decagon Devices, Pullman, WA, USA), which was calibrated in Auto Mode, following the manufacturer’s calibration procedure.

2.5. Electrolyte Leakage

Electrolyte leakage was measured on the same leaf, on which photosynthetic measurements were taken using the conductivity method described by Sullivan [50], Lafuente et al. [51], and Camejo et al. [14]. Eight 7 mm diameter leaf disks were cut using a cork borer and were placed in 50 mL Greiner centrifuge tubes (Sigma Aldrich, Castle Hill, Australia) with 20 mL of double deionized water and maintained on a shaker at 80 rpm for 20 h at room temperature. The conductivity of the solution was read with a conductivity meter (Edge, Hanna Instruments Inc. HI11310 single ceramic, double junction, and refillable pH electrode with temperature sensor, UK) before the samples were autoclaved and after autoclaving for 15 min at 121 °C to burst the cells. Electrolyte leakage was expressed as the ratio of the conductivities in percentage:
% electrolyte = (T1/T2) × 100,
where T1 and T2 are the conductivities before and after autoclaving the tissues, respectively.

2.6. Initial Screening of 104 Genotypes: Four-Hour Heat Shock (45 °C)

Due to the large number of genotypes (104), one plant per genotype was considered for the initial screen. After 4 weeks growth in the glass house, plants were moved into a controlled environment facility (CEF) with a 12 h day–night cycle set at 30 °C during the day and 22 °C at night, and 70% RH for a week (high-pressure sodium lamps, 300 mmol m−2 s−1), and plants were watered regularly to avoid moisture stress. The physiological parameters Fv/Fm, Fv′/Fm′ (using a LI-COR 6400) and gs (using a porometer) were measured on the plants prior to the heat shock being applied (control). The day after the control measurements, plants were subjected to a heat shock of 45 °C for 4 h, and the chamber was cooled to 30 °C for 1 h before measuring the same physiological responses, as in the control and at a similar time of the day.

2.7. Advanced Screening of 33 Genotypes: Six-Hour Heat Shock (45 °C)

A selection of thirty-three okra genotypes from the initial screening were sown and grown in the glass house. In total, 4 weeks after sowing, the plants were moved to the CEF and arranged in a completely randomized design under the same conditions as the initial screen (3 replicates per genotype). As the fluorescence measurement did not show clear differences between control and heat treatments in the initial screening, the duration of the heat shock was extended to 6 h at 45 °C. Fv/Fm, Fv′/Fm′, A, ΦPSII, and gs using a LI-COR 6400, and EL using a conductivity meter, were measured before the heat shock (at 30 °C, control) and after heat shock (at 30 °C, one hour after termination of the heat shock).

2.8. Statistical Data Analysis

Allele frequencies for each microsatellite locus were used to calculate the polymorphic information content (PIC) manually, using the following equation, where Pi is the frequency for the ith allele, and l is the total number of alleles [52]. Markers with a PIC value greater than 0.5 were highly informative [53].
PIC   =   1 i = 1 l P i 2
The images obtained from agarose gels were scored manually by indicating presence (1) or absence (0) of a specific allele. The “1” or “0” data were used to generate a dendrogram using unweighted pair-group method with arithmetic means (UPGMA) [54] clustering in NTSYS-pc v2 [55]. Then, “1” and “0” data were converted to “A” and “T”, respectively, to generate a dendrogram in MEGA v6 (Molecular Evolutionary Genetics Analysis) to compare with the results from NTSYS-pc v2 [56]. The percentage of replicate trees, in which the associated taxa clustered together in the bootstrap test (1000 rep), were shown above the branches on the generated dendrogram [57]. The evolutionary distances were computed using the Maximum Composite Likelihood [58].
Physiological data (photosynthetic parameters, EL) were subjected to a one- and two-sample t-test with the level of significance set at p < 0.05 and a general analysis of variance (ANOVA) with the level of significance set at p < 0.05, and a comparison of means was performed using Fisher’s unprotected LSD, using GenStat 17th Edition software (VSN International Ltd., London, UK).

3. Results

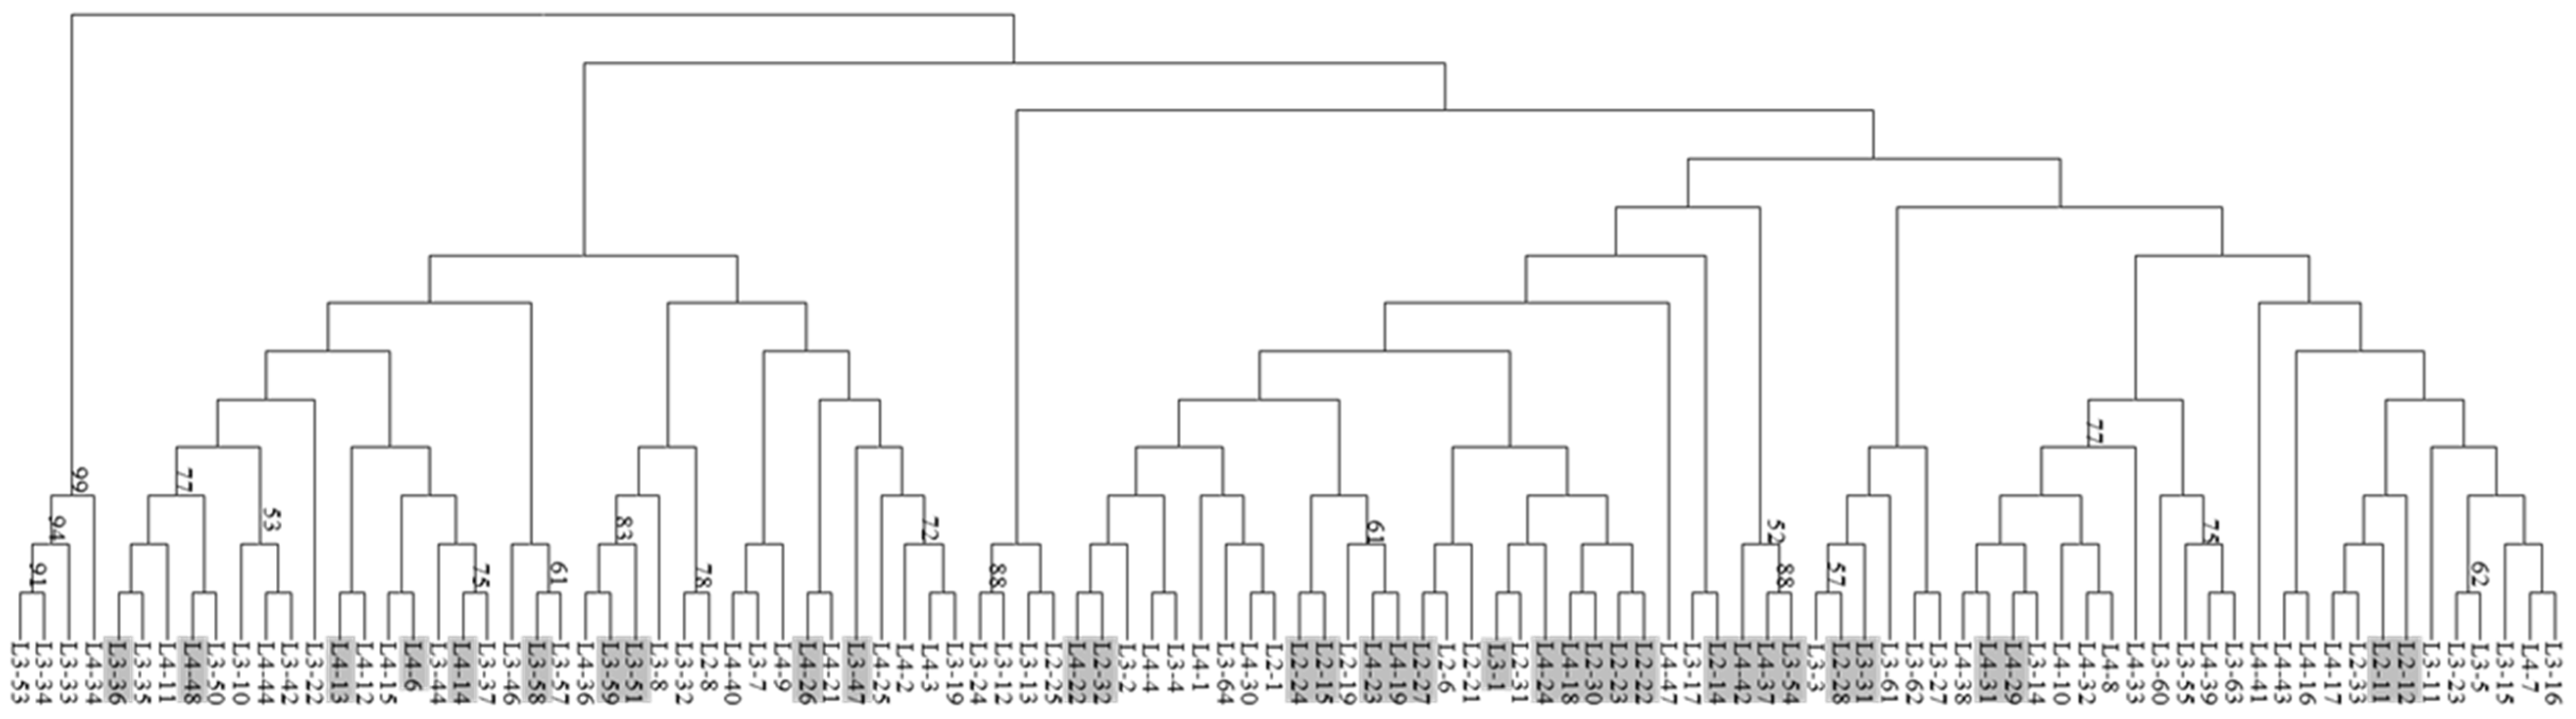
3.1. DNA Extraction and Dendrogram Generation Using SSR Primers

The average observed A260/A280 among the 104 genotypes was 1.75, of which 63.46% of the isolates produced values between 1.8 and 1.9, 23.08% had values between 1.6 and 1.7, and only 13.46% were between 1.2 and 1.5 (Table S2). The average A260/A230 was 1.2, where 38.5% of the isolates produced values between 1.5 and 2, and the remainder was less than 1.5.
Of the thirty-five SSR markers (Table A1) used to amplify genomic DNA of the 104 okra genotypes, only eight markers from A. esculentus (Table 1) amplified all genomic DNA under PCR at the annealing temperature of 53 °C. The eight primers amplified a total of 29 alleles among 104 isolates at an average of 3.6 alleles per primer, ranging from 7 alleles (primer 13) to 2 alleles (primers 9 and 12). The scored band size ranged from 109 to 308 base pairs. The data were used to generate a UPGMA-based phylogenetic dendrogram for clustering and similarity analysis across the isolates using both MEGA v6 and NTSYS-pc v2 software, and similar results were obtained. The dendrogram generated from the bootstrap analysis using the MEGA v6 software (Figure 1) was chosen to assess genetic diversity among genotypes with favourable physiological traits.

3.2. Initial Physiological Screening of 104 Genotypes after Four-Hour Heat Shock (45 °C)

The rapid physiological measures of Fv/Fm, Fv′/Fm′, and gs by porometry were used due to the large number of genotypes assessed (Table S3). Significant differences were observed between control and heat treatments for both Fv′/Fm′ and gs (p < 0.001) but not Fv/Fm. Under high temperatures, Fv′/Fm′ increased relative to the control in 18.3% of genotypes, decreased in 52.9%, and remained similar in 28.8%. gs varied strongly among genotypes in each treatment, and 71.2% of genotypes had lower gs in heat treatment compared to the control, whereas the remainder had higher gs.
Thirty-three genotypes were selected based on low genetic similarity (less than 50%), as well as contrasting responses in chlorophyll fluorescence and stomatal conductance (highlighted in Figure 1). These genotypes fell within five groups based on different responses to heat stress:
  • 45.5% with low Fv′/Fm′, low gs;
  • 12.1% with low Fv′/Fm′, high gs;
  • 6.1% with high Fv′/Fm′, high gs;
  • 21.2% with similar Fv′/Fm′, low gs;
  • 15.1% with similar Fv′/Fm′, high gs.
Of the selected genotypes, L3-54 and L4-37 from Cambodia showed 88% genetic similarities; however, their responses to high temperatures differed, as gs and Fv′/Fm′ were lower in genotype L3-54 compared to genotype L4-37. These two genotypes had 52% similarities with the genotype L4-42 (from the USA); L4-42 showed a low gs, such as genotype L3-54, and an Fv′/Fm′ equivalent to genotype L4-37. Genotypes L3-59 from Australia and L3-51 from the Philippines were 83% similar, and, despite both having lower gs values under high temperatures, their Fv′/Fm′ responses differed.

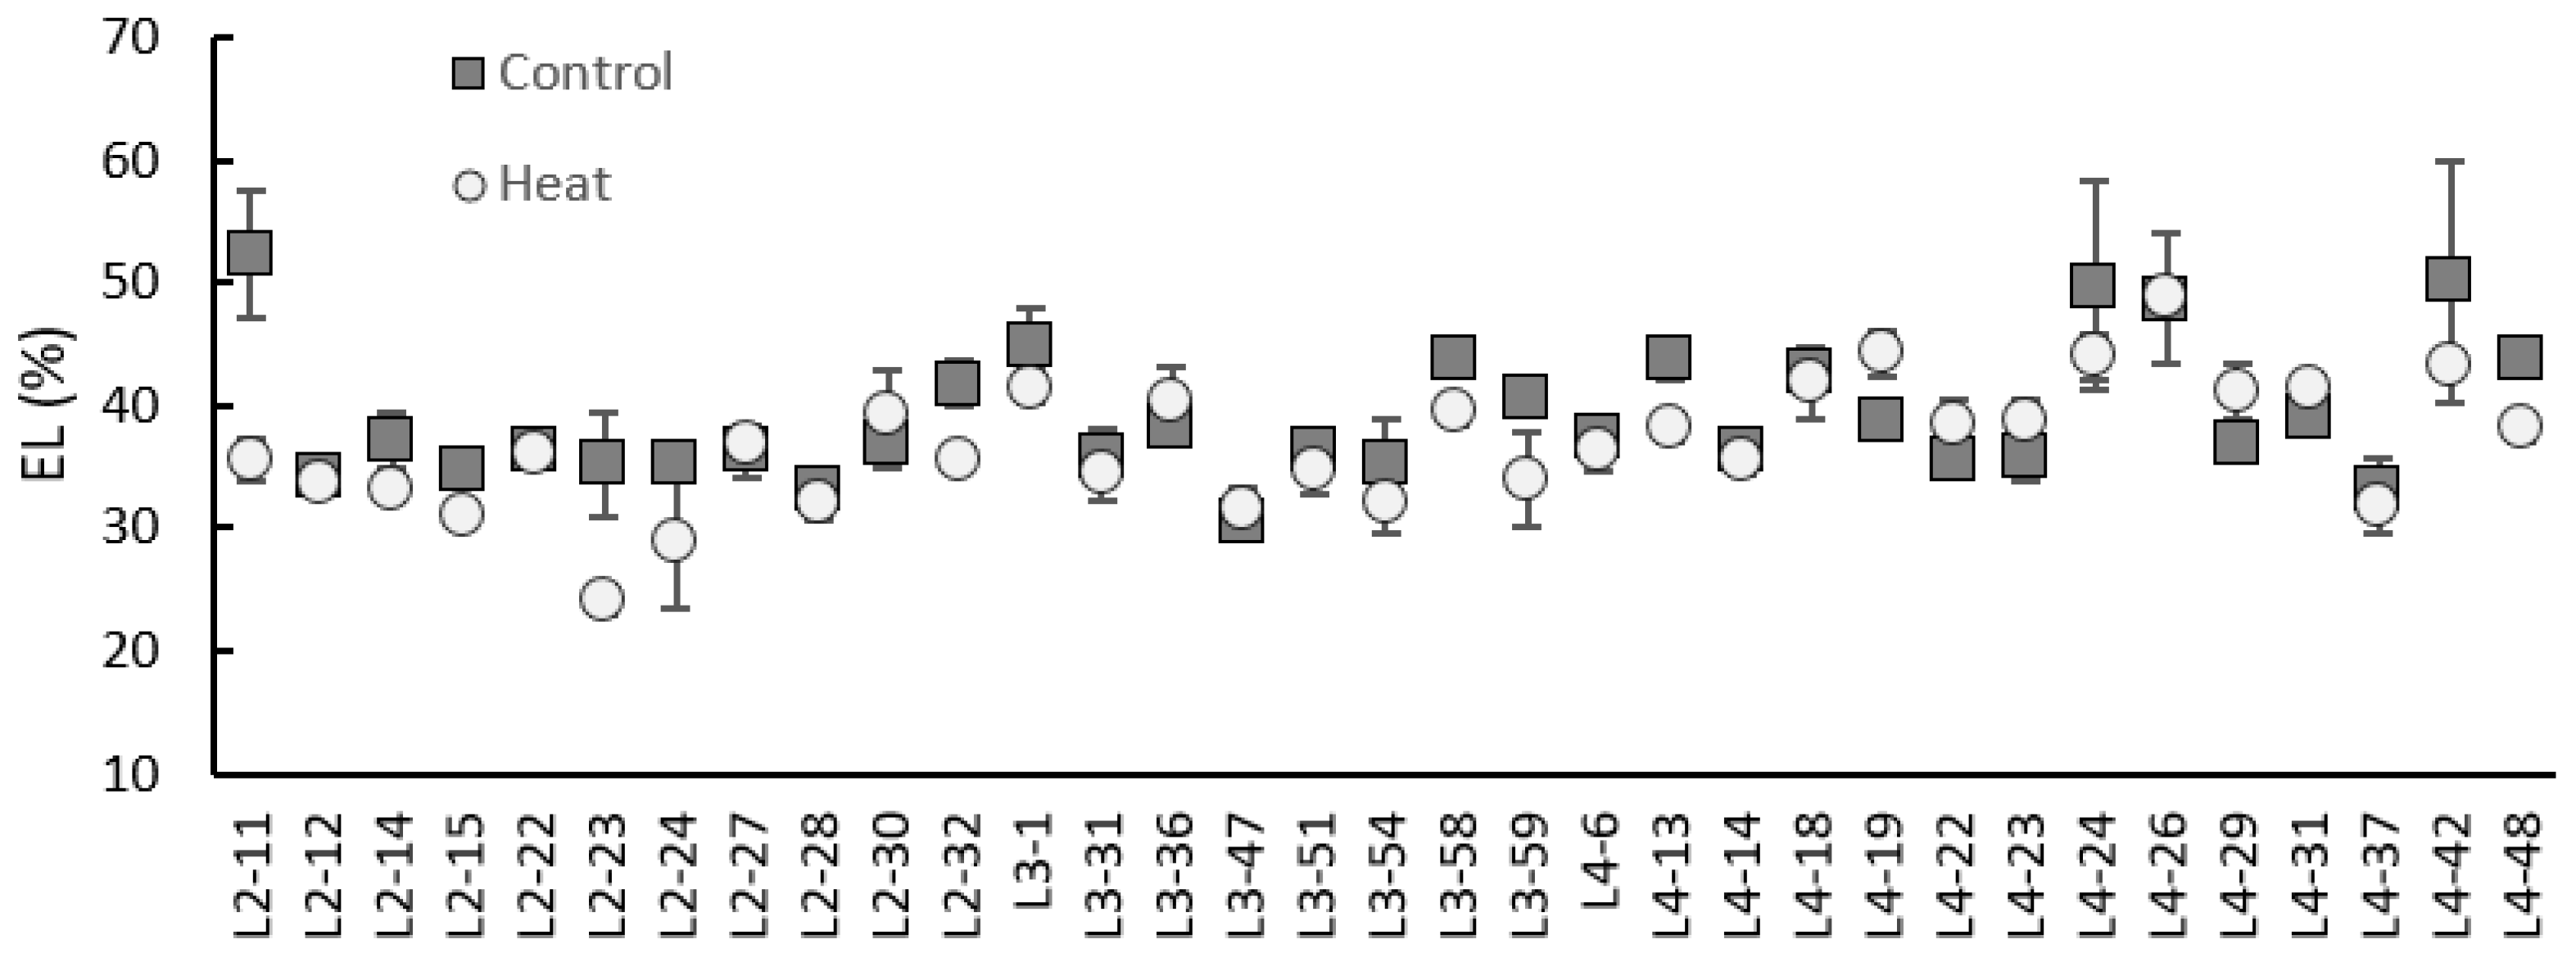
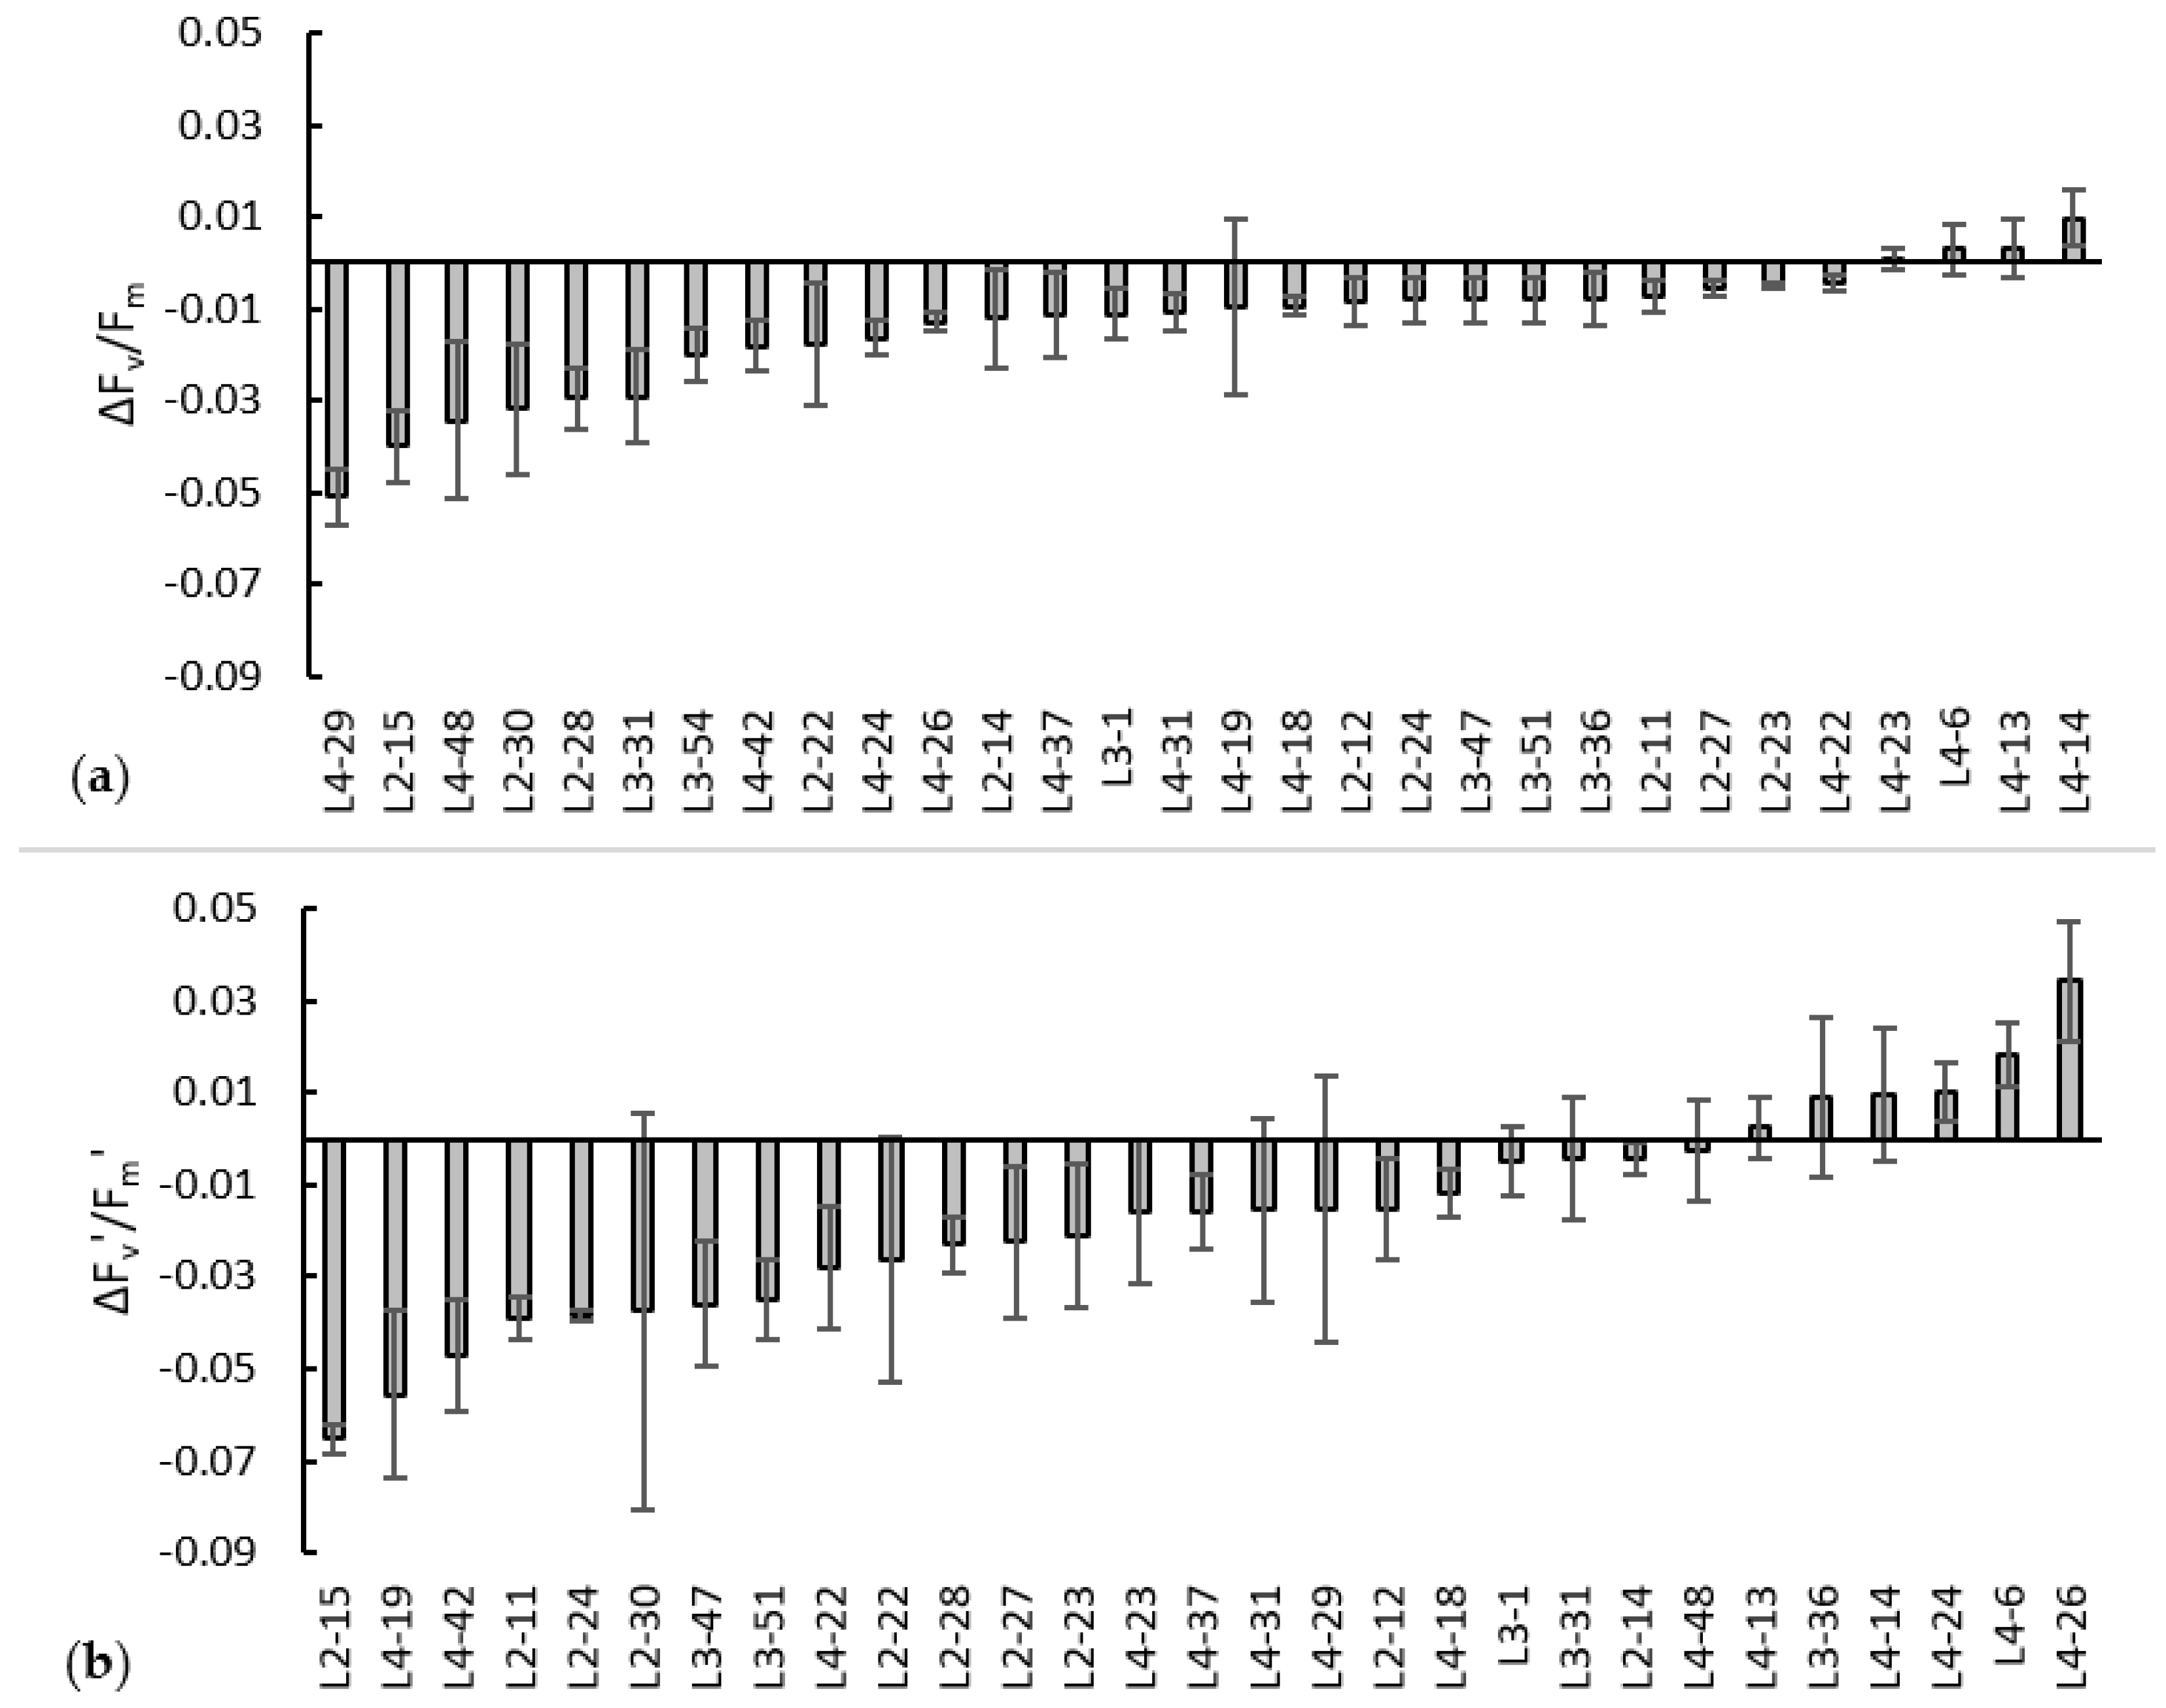
3.3. In-Depth Physiological Screening of 33 Genotypes after Six-Hour Heat Shock (45 °C)

In this more comprehensive experiment, heat shock was extended to 6 h to elicit stronger responses in gas exchange (A, gs), fluorescence (Fv/Fm, Fv′/Fm′, ΦPSII), and EL. EL was measured for all 33 genotypes, but no photosynthetic and fluorescence data were recorded on L2-32, L3-1, L3-58, and L3-59.
The Genotype × Treatment interaction was significant for all traits (Table 2), and genotype and treatment effects were significant for all measured parameters, except for the treatment effect on EL (p = 0.585, Figure 2). Most genotypes showed lower Fv/Fm and Fv′/Fm′ values after high temperature exposure, with larger differences for Fv′/Fm′ (Figure 3). Some genotypes displayed higher Fv′/Fm′ values after heat treatment (e.g., L4-6, L4-24, and L4-26). Generally, the ranking between the difference in fluorescence parameters in the dark and in the light (∆Fv/Fm and ∆Fv′/Fm′) was maintained, with some exceptions (e.g., L4-26).
Twelve genotypes maintained or increased gs values in response to heat, which generally resulted in increased A values (Figure 4). Six genotypes (L2-14, L2-27, L2-28, L3-31, L4-14, and L4-48) maintained gs values after heat exposure but decreased A values (p = 0.02).
The ranking of differences (∆) in A, gs, and ΦPSII values was overall similar, but differences were more gradual in the A values compared to the gs and ΦPSII values. For example, genotype L4-47 showed strongest reduction in the gs but had a similar A to L-23 and L4-29. Poorly performing genotypes reduced, whereas best-performing genotypes increased over all parameters (A, gs, and ΦPSII). Genotype L4-26 showed moderate increases in gs, but additional increases in ΦPSII resulted in overall increased ranking for A in the heat.
Poorly performing genotypes in the fluorescence measurements (both ∆Fv/Fm and ∆Fv′/Fm′) also ranked low for A, gs, and ΦPSII (e.g., L2-15). However, there were some exceptions, such as genotype L4-48, which performed poorly for ∆Fv/Fm but mostly maintained ∆Fv′/Fm′, A, gs, and ΦPSII.

4. Discussion

High temperature stress is a major limitation to agricultural production and food security and is expected to become more frequent with climate change [59,60,61]. Yield is heavily dependent on photosynthesis, but the photosynthetic pathway is sensitive to high temperature and can be affected by alteration of the PSII function and closure of stomata, resulting in CO2 limitation and disruption of cellular function from damaged thylakoid membranes [26,33,34]. In this study, we identified heat-tolerant accessions, which can be used to breed more heat-tolerant okra by screening progeny from crosses among diverse parents for the physiological traits outlined in this paper.

4.1. Modified DNA Extraction Protocol, SSR Markers and Polymorphism in Okra

We extracted good quality DNA (confirmed by the absorbance ratio at A260/A280 nm) from okra using a modified CTAB method with the addition of PVP and RNase. Okra leaves contain polysaccharides and secondary metabolites such as polyphenols that interfere with the DNA isolation process. The glue-like texture of polysaccharides initially resulted in poor DNA quality and had a negative effect on PCR amplification through the inhibition of Taq polymerase activity [62]. To prevent polysaccharide contamination during DNA isolation, some studies used yellow and etiolated fresh leaves of 10–14 day old okra plants grown under dark conditions [43,63] or an additional wash with 1 M NaCl [39]. In contrast, we were able to extract high quality genomic DNA of a sufficient quantity from young, fresh, green leaf tissue without the need for additional washing, which increased the effectiveness of molecular genetic analyses using PCR-based markers.
The 16 Medicago SSR markers successfully used for okra by Sawadogo et al. [41] did not amplify the genomic DNA in the current study. In contrast, the 19 SSR markers specific to okra provided by Schafleitner et al. [42] amplified all genotypes, although only eight showed polymorphisms. In a previous study on Turkish okra [64], nine of the SSR markers from Schafleitner et al. [42] were used, five of which were common to the current study. Among the five common markers, the highest PIC value was observed for marker 13 (AVRDC-Okra64) in both the current study and that of Yildiz et al. [64], and had the third highest PIC in the study by Schafleitner et al. [42]. Thus, this SSR marker can be considered informative and suitable for okra genotyping. However, marker 12 (AVRDC-Okra63) had the lowest PIC value in the current study (0.27) but was greater than 0.6 in other studies, suggesting that this marker was polymorphic in only a few genotypes.
The dendrogram of 104 okra genotypes indicated that considerable genetic diversity existed among okra accessions. Interestingly, genotypes did not group by geographical origin, indicating that materials have been introduced to different regions overtime, thus blurring geographical differences. There were variations in physiological responses to high temperatures observed among some genotypes in the same grouping that were more than 50% similar. These varied responses highlighted the necessity of combining phenotyping with an understanding of genetic diversity. Clearly, crossing among heat-tolerant materials in different diversity groups would provide a higher probability of identifying higher levels of heat tolerance.

4.2. Physiological Response of Okra to Heat Shock

Heat shock has been effective in initiating physiological responses in plants, even if only imposed for short periods of time. For example, a two-hour heat shock at 45 °C decreased chlorophyll fluorescence in tomato and cucumber, indicating damage to PSII, despite an increase in gs and the associated cooling [14,20]. PSII in okra was not strongly affected by a 4 h heat shock at 45 °C, as Fv/Fm showed no significant reduction. In contrast, crops such as cotton and tomato were characterised by lower Fv/Fm values when exposed to high temperatures, despite being warm-season crops [14,65,66]. Although fluorescence in light-adapted okra plants (i.e., Fv′/Fm′) was significantly reduced in most genotypes, it was reduced only by a small amount and even increased in some genotypes compared to the control, which suggested that okra is overall tolerant to elevated temperatures. However, increasing the length of the heat shock to six hours did reduce Fv/Fm and Fv′/Fm′ values more effectively in the 33 selected okra genotypes, indicating a reduction in the functionality of the PSII reaction centre [12].
Some okra genotypes showed higher Fv′/Fm′ values under high temperatures compared to the control, which coincided with higher stomatal conductance and photosynthesis under stress. The opening of the stomata increased latent heat loss, which was particularly important for plants with large leaves experiencing greater thermal stresses compared to plants with narrow leaves [67]. Alternatively, these results may have been the result of the poor performance of the control rather than the tolerance of these genotypes to heat: Fv′/Fm′ values in their control measurements were lower than the average of all genotypes (0.51), and their gs and A values were nearly half the value of the average of all genotypes (0.11 mol m−2 s−1 and 12.84 µmol m−2 s−1, respectively). Although plants were regularly irrigated, the closure of the stomata and the reduction in A accompanied by a decrease in the Fv′/Fm′ in the control may have been a result of transient water stress [68]. Hence, the provision of ample water to both control and heat-stressed plants (during the application of the stress) is of central importance if physiological parameters such as fluorescence and gas exchange are used for screening of heat tolerance.
Three different gs responses to heat were observed among the okra genotypes (higher, lower, and similar to the control). As measurements were completed 1 h after the end of the heat shock, these likely reflected the gs responses during the application of the shock. Nevertheless, this response may have been influenced by a quick (and often overlooked) recovery response [69]. For example, cotton showed a 67% increase in stomatal conductance after heat shock but returned to the control level after a 24 h recovery [70]. As noted above, genotypes with open stomata (i.e., higher gs) were able to reduce leaf temperature when exposed to high temperature [17,71,72] and may have been able to survive even extreme heat waves [73]. Several okra genotypes had higher A values in the heat treatments, indicating that photosynthesis was mostly limited by gs values rather than damage to PSII (i.e., reduced Fv′/Fm′) under heat, corroborated by an increase in ΦPSII in the heat. Although electron transport through PSII was interrupted by high temperature, and photon energy could not be used for photochemistry if the PSII was damaged [29,74], electrons can be contributed to photosystem I (PSI) by cyclic electron transportation so that a reduction in A was prevented [75]. Genotypes that displayed lower gs values under high temperatures restricted CO2 assimilations, resulting in lower A values, a trait characteristic of heat-sensitive genotypes [26,34]. Notably, genotypes that exhibited similar gs in the control and heat treatments may have possessed heat tolerance, as was found in tomato [14].
Although maximum quantum yield and damage to PSII were best measured in dark-adapted leaves (Fv/Fm) [21], the ranking of the change in the physiological responses (∆) was similar across several traits for many genotypes. Some of these traits could be measured quickly (e.g., gs by porometry or Fv/Fm, Fv′/Fm′ and ΦPSII by chlorophyll fluorescence), and the instruments are highly portable, which may be an advantage in field-based screening of heat tolerance, particularly if large numbers of accessions have to be assessed. To increase confidence in these measurements, replication as well as ample water supply are recommended. Moreover, the comparison of several traits may allow a window into different physiological adaptations to heat. For example, some genotypes displayed similar or increased gs values but reduced A values with constant Fv′/Fm′ values, suggesting a different mechanism of inhibition to PSII, possibly a reduction in Rubisco activase activity [76]. It may also allow the identification of genotypes with traits suited for specific environments. For example, high stomatal conductance may be beneficial in environments without water limitation to enable reduction in heat load on leaves [73]. In contrast, open stomata may be a disadvantage in drier environments, and genotypes maintaining constant gs and A values may be better adapted.
The use of EL to evaluate heat damage to cell membranes has successfully been applied to crops such as cowpeas, wheat, holly, turf grass, and cotton [65]. In cotton, EL increased by 19–52% following a 3 h heat shock (45 °C) [77], 9.72–24.58% after 4 h, and 10.52–28.91% after an 8 h heat shock (40 °C) [78]. Despite heat effects on fluorescence, stomatal conductance, and photosynthesis, a six-hour heat shock only had a significant effect on electrolyte leakage of eight okra genotypes, of which only one genotype showed increased leakage, confirming the general heat tolerance of okra [79]. Hence, EL may not be an efficient screening technique for assessing short-term heat damage in okra. However, longer exposure times to high temperatures may influence EL, and this should be determined either in controlled environment or under field conditions.

5. Conclusions

DNA isolated from young, fresh, and green okra leaf tissue using the modified CTAB method with additional PVP and RNase was effective in producing high quality genomic DNA of sufficient quantity for molecular analysis. SSR markers showed that significant genetic variations exist among okra genotypes. These markers could be used in conjunction with phenotypic screening to identify okra genotypes for genetic improvement and production. One previously published SSR marker was particularly effective in discriminating materials and is recommended for okra screening.
Photosynthetic traits (Fv′/Fm′, ΦPSII, A, and gs) were good indicators of the physiological response of okra genotypes to heat shock (6 h or more at 45 °C), and the ranking of differences of measured traits (∆) between control and heat-treated plants could be used to assess genotype sensitivity to heat. In contrast, electrolyte leakage was unable to detect damage from short-term heat exposure and may not be an effective screening tool in okra. Further studies of the physiological responses of the selected genotypes will be needed to confirm if observations under short-term heat stress equally apply to extended heat stress, particularly under field conditions.

Supplementary Materials

The following supporting information can be downloaded at: https://www.mdpi.com/article/10.3390/horticulturae9060722/s1, Table S1: List of 104 okra genotypes (names and origin); Table S2: Purity of DNA extracted from 104 okra genotypes using modified CTAB method; Table S3: Stomatal conductance and fluorescence of 104 okra genotypes after 4 h heat shock.

Author Contributions

Conceptualization, S.H., R.T., T.M., N.A. and C.K.; methodology, S.H., N.A. and C.K.; validation, S.H., R.T., N.A. and C.K.; formal analysis, S.H. and C.K.; investigation, S.H. and C.K.; data curation, S.H. and C.K.; writing—original draft preparation, S.H. and C.K.; writing—review and editing, S.H., R.T., T.M., N.A. and C.K.; visualization, S.H., N.A. and C.K.; supervision, R.T., T.M., N.A. and C.K.; project administration, R.T., T.M., N.A. and C.K.; funding acquisition, R.T. and T.M. All authors have read and agreed to the published version of the manuscript.

Funding

This research was funded by the Australian Centre for International Agricultural Research (ACIAR), grant number HORT/2012/002.

Data Availability Statement

The data presented in this study are available in the supplementary material document or available from the corresponding author upon request.

Acknowledgments

The authors sincerely thank Haydar Karaoglu PhD for his contribution to the development of the DNA extraction protocol.

Conflicts of Interest

The authors declare no conflict of interest.

Appendix A

Table A1. Thirty-five SSR primers used to amplify DNA of 104 okra genotypes, including forward (F) and reverse (R) with their repeated motif and primer sequences from A. esculentus (No. 1–19) and Medicago truncatula (No. 20–35).
NoName (Marker)IDRepeated MotifForward Primer Sequences (5′-3′)Reverse Primer Sequences (5′-3′)
1AVRDC-Okra15200(AAG)13F:ATGGAGTGATTTTTGTGGAGR:GACCCGAACTCACGTTACTA
2AVRDC-Okra8128713(AAG)8F:TGCTGTGGAAGGTTTTTACTR:ATGACGAAAGTGGTGAAAAG
3AVRDC-Okra989235(AAT)12F:ACCTTGAACACCAGGTACAGR:TTGCTCTTATGAAGCAGTGA
4AVRDC-Okra178461(AGA)7F:ACGAGAGTGAAGTGGAACTGR:CTCCTCTTTCCTTTTTCCAT
5AVRDC-Okra2143380(AGA)9F:TCATGTCTTTCCACTCAACAR:CCAAACAAAATATGCCTCTC
6AVRDC-Okra28151529(ATT)8F:CCTCTTCATCCATCTTTTCAR:GGAAGATGCTGTGAAGGTAG
7AVRDC-Okra3951708(AG)16F:TGAGGTGATGATGTGAGAGAR:TTGTAGATGAGGTTTGAACG
8AVRDC-Okra52126731(CAT)8-(TCA)9F:AACACATCCTCATCCTCATCR:ACCGGAAGCTATTTACATGA
9AVRDC-Okra5487311(GAA)10F:CGAAAAGGAAACTCAACAACR:TGAACCTTATTTTCCTCGTG
10AVRDC-Okra5621030(GAA)44F:GGCAACTTCGTAATTTCCTAR:TGAGTAAAAGTGGGGTCTGT
11AVRDC-Okra57151995(GAA)9-(GAG)7F:CGAGGAGACCATGGAAGAAG R:ATGAGGAGGACGAGCAAGAA
12AVRDC-Okra6334632(TCT)12F:GTGTTTGAAAGGGACTGTGTR:CTTCATCAAAACCATGCAG
13AVRDC-Okra645886(TCT)22F:AAGGAGGAGAAAGAGAAGGAR:ATTTACTTGAGCAGCAGCAG
14AVRDC-Okra6620291(TTC)12-(TTC)13F:CACCAGAATTTCCCTTTTGR:ACTGTTGTTTGGCTTATGCT
15AVRDC-Okra7089044(TC)11F:GTAGCTGAACCCTTTGCTTAR:CTATCATGGCGGATTCTTTA
16AVRDC-Okra77152270(GAAATA)4-(GAAACA)7F:CTGTTTGTTCGTCGTAATCA R:AAAGTTTCTTCCTTTCCACC
17AVRDC-Okra78122488(TAT)11-(TATTGT)4-(TATCGT)4F:CTCCGACAATTCAAGAAAAGR:CACCCAATCAAGCTATGTTA
18AVRDC-Okra86461(AGC)8F:ATGCAAACAAGCTAGTGGATR:ATTCTCTTCAGGGTTTCCTC
19AVRDC-Okra89129459(AGC)8F:TTTGAGTTCTTTCGTCCACTR:GTATTTGGACATGGCGTTAT
203 (AAC)5F:TGGTGACGACATACAAGAAAAGAR:CCCGGTGGTTTAGGAAGTTT
217 (AAC)6F:ACCACTTCTCCATCCATCCAR:AGCTTGCTGCATGAGTGCT
228 (AAC)5-(AAC)6F:CAAAGGCACTTCATCAGCAAR:GTGAGCGTCAATGTTGGATG
2320 (AAG)5F:TGAAGGTCAAATTGCCAAGA R:TCCTTGTTTTTGAAGGTCACG
2427 (AAG)6F:CGATCGGAACGAGGACTTTAR:CCCCGTTTTTCTTCTCTCCT
2535 (AAG)8F:GAAGAAGAAAAAGAGATAGATCTGTGGR:GGCAGGAACAGATCCTTGAA
2655 (AAG)6F:CAGTTCGGGAAGAGGACAAAR:ATCCCAAACCAGGTTCTTCA
2762 (AT)10F:TTCCGCCCATAGTCTTTGACR:TGAAAGGGCTTAGAGGGTTTT
2874 (AT)16F:GGTGGAAGGAACAACTCTGGR:CCGGCATGATTAAGACACAC
2982 (TC)11F:CACTTTCCACACTCAAACCAR:GAGAGGATTTCGGTGATGT
3095 (TCC)6F:AAAGGTGTTGGGTTTTGTGGR:AGGAAGGAGAGGGACGAAAG
3196 (TCC)6F:CCAGTGGCAGCTACGGTACTAR:GAGACGGAGGAGAAGTTGCTT
32103 (TG)5F:TGGGTTGTCCTTCTTTTTGGR:GGGTGCAGAAGTTTGACCA
33107 (AC)5F:CAAACCATTTCCTCCATTGTGR:TACGTAGCCCCTTGCTCATT
34135 (AG)10F:GCTGACTGGACGGATCTGAGR:CCAAAGCATAAGCATTCATTCA
35136 (AT)5F:TTTGTGTCGAGAGATGCACAR:CTTGAAACTTCAACGGCATT

References

  1. Wahid, A.; Gelani, S.; Ashraf, M.; Foolad, M. Heat tolerance in plants: An overview. Environ. Exp. Bot. 2007, 61, 199–223. [Google Scholar] [CrossRef]
  2. Kakani, V.G.; Reddy, K.R.; Koti, S.; Wallace, T.P.; Prasad, P.V.; Reddy, V.R.; Zhao, D. Differences in in vitro pollen germination and pollen tube growth of cotton cultivars in response to high temperature. Ann. Bot. 2005, 96, 59–67. [Google Scholar] [CrossRef] [PubMed] [Green Version]
  3. El-Shaieny, A.; Bashandy, T. Effect of Planting Dates on Growth, Yield and Physiological Traits of Okra (Abelmoschus esculentus L. Moench.), and Field Evaluation for Heat Tolerance. J. Plant Prod. 2022, 13, 141–150. [Google Scholar] [CrossRef]
  4. Adeboye, O.; Oputa, C. Effects of galex on growth and fruit nutrient composition of okra (Abelnurschus esculentus). Ife J. Agric. 1996, 18, 1–9. [Google Scholar]
  5. Gunawardhana, M.; De Silva, C. Impact of temperature and water stress on growth yield and related biochemical parameters of okra. Trop. Agric. Res. 2012, 23, 77–83. [Google Scholar] [CrossRef] [Green Version]
  6. Arulrajah, T.; Ormrod, D. Responses of okra (Hibiscus esculentus L.) to photoperiod and temperature. Ann. Bot. 1973, 37, 331–340. [Google Scholar] [CrossRef]
  7. Jamala, G.; Boni, P.; Abraham, P.; Musa, A. Soil status and yield response of different varieties of okra (Abelmoschus esculentus (L.) Moench) grown at Mubi floodplain, North Eastern, Nigeria. J. Agric. Biotechnol. Sustain. Dev. 2011, 3, 120–125. [Google Scholar]
  8. Diizyaman, E. Okra: Botany and Horticulture. In Horticultural Reviews; Janick, J., Ed.; John Wiley & Sons: Hoboken, NJ, USA, 1997; Volume 21, pp. 41–72. [Google Scholar]
  9. Dhankhar, S.; Singh, S. Thermal requirements for flowering and fruit yield attainment in advance lines of okra. J. Agrometeorol. 2013, 15, 39–42. [Google Scholar] [CrossRef]
  10. Dhankhar, B.S.; Singh, R. Okra Handbook: Global Production, Processing, and Crop Improvement; HNB Publishing: New York, NY, USA, 2009. [Google Scholar]
  11. Hasanuzzaman, M.; Nahar, K.; Alam, M.M.; Roychowdhury, R.; Fujita, M. Physiological, biochemical, and molecular mechanisms of heat stress tolerance in plants. Int. J. Mol. Sci. 2013, 14, 9643–9684. [Google Scholar] [CrossRef]
  12. Van der Westhuizen, M.; Oosterhuis, D.; Berner, J.; Boogaers, N. Chlorophyll a fluorescence as an indicator of heat stress in cotton (Gossypium hirsutum L.). S. Afr. J. Plant Soil 2020, 37, 116–119. [Google Scholar] [CrossRef]
  13. Mercado Álvarez, K.; Bertero, H.D.; Paytas, M.J.; Ploschuk, E.L. Mesophyll conductance modulates photosynthetic rate in cotton crops exposed to heat stress under field conditions. J. Agron. Crop Sci. 2022, 208, 53–64. [Google Scholar] [CrossRef]
  14. Camejo, D.; Rodríguez, P.; Morales, M.A.; Dell’Amico, J.M.; Torrecillas, A.; Alarcón, J.J. High temperature effects on photosynthetic activity of two tomato cultivars with different heat susceptibility. J. Plant Physiol. 2005, 162, 281–289. [Google Scholar] [CrossRef] [PubMed]
  15. Chen, L.-S.; Cheng, L. Photosystem 2 is more tolerant to high temperature in apple (Malus domestica Borkh.) leaves than in fruit peel. Photosynthetica 2009, 47, 112–120. [Google Scholar] [CrossRef]
  16. Teskey, R.; Wertin, T.; Bauweraerts, I.; Ameye, M.; McGuire, M.A.; Steppe, K. Responses of tree species to heat waves and extreme heat events. Plant Cell Environ. 2015, 38, 1699–1712. [Google Scholar] [CrossRef] [PubMed]
  17. Zhang, R.; Sharkey, T.D. Photosynthetic electron transport and proton flux under moderate heat stress. Photosynth. Res. 2009, 100, 29–43. [Google Scholar] [CrossRef] [PubMed]
  18. Martinazzo, E.G.; Ramm, A.; Bacarin, M.A. The chlorophyll a fluorescence as an indicator of the temperature stress in the leaves of Prunus persica. Braz. J. Plant Physiol. 2012, 24, 237–246. [Google Scholar] [CrossRef] [Green Version]
  19. Sinsawat, V.; Leipner, J.; Stamp, P.; Fracheboud, Y. Effect of heat stress on the photosynthetic apparatus in maize (Zea mays L.) grown at control or high temperature. Environ. Exp. Bot. 2004, 52, 123–129. [Google Scholar] [CrossRef]
  20. Ding, X.; Jiang, Y.; Hao, T.; Jin, H.; Zhang, H.; He, L.; Zhou, Q.; Huang, D.; Hui, D.; Yu, J. Effects of heat shock on photosynthetic properties, antioxidant enzyme activity, and downy mildew of cucumber (Cucumis sativus L.). PLoS ONE 2016, 11, e0152429. [Google Scholar] [CrossRef] [Green Version]
  21. Murchie, E.H.; Lawson, T. Chlorophyll fluorescence analysis: A guide to good practice and understanding some new applications. J. Exp. Bot. 2013, 64, 3983–3998. [Google Scholar] [CrossRef] [Green Version]
  22. Misra, A.N.; Misra, M.; Singh, R. Chlorophyll Fluorescence in Plant Biology; INTECH: London, UK, 2012. [Google Scholar]
  23. Strasser, R.J.; Tsimilli-Michael, M.; Srivastava, A. Analysis of the chlorophyll a fluorescence transient. Chlorophyll Fluoresc. 2004, 19, 321–362. [Google Scholar]
  24. Yamane, Y.; Shikanai, T.; Kashino, Y.; Koike, H.; Satoh, K. Reduction of QA in the dark: Another cause of fluorescence Fo increases by high temperatures in higher plants. Photosynth. Res. 2000, 63, 23–34. [Google Scholar] [CrossRef]
  25. Baker, N.R. Chlorophyll Fluorescence: A Probe of Photosynthesis In Vivo. Annu. Rev. Plant Biol. 2008, 59, 89–113. [Google Scholar] [CrossRef] [PubMed] [Green Version]
  26. Cui, L.; Li, J.; Fan, Y.; Xu, S.; Zhang, Z. High temperature effects on photosynthesis, PSII functionality and antioxidant activity of two Festuca arundinacea cultivars with different heat susceptibility. Bot. Stud. 2006, 47, 61–69. [Google Scholar]
  27. Yamane, Y.; Kashino, Y.; Koike, H.; Satoh, K. Increases in the fluorescence Fo level and reversible inhibition of photosystem II reaction center by high-temperature treatments in higher plants. Photosynth. Res. 1997, 52, 57–64. [Google Scholar] [CrossRef]
  28. dos Santos Farias, D.B.; da Silva, P.S.O.; Tadeu Lucas, A.A.; de Freitas, M.I.; de Jesus Santos, T.; Nascimento Fontes, P.T.; de Oliveira Júnior, L.F.G. Physiological and productive parameters of the okra under irrigation levels. Sci. Hortic. 2019, 252, 1–6. [Google Scholar] [CrossRef]
  29. Maxwell, K.; Johnson, G.N. Chlorophyll fluorescence—A practical guide. J. Exp. Bot. 2000, 51, 659–668. [Google Scholar] [CrossRef] [PubMed]
  30. Roháček, K.; Soukupová, J.; Barták, M. Chlorophyll fluorescence: A wonderful tool to study plant physiology and plant stress. Plant Cell Compart.-Sel. Top. Res. Signpost Kerala India 2008, 41, 104. [Google Scholar]
  31. Reece, J.B.; Urry, L.A.; Cain, M.L.; Wasserman, S.A.; Minorsky, P.V.; Jackson, R.B. Campbell Biology; Pearson: Boston, MA, USA, 2011. [Google Scholar]
  32. Lu, Z.; Radin, J.W.; Turcotte, E.L.; Percy, R.; Zeiger, E. High yields in advanced lines of Pima cotton are associated with higher stomatal conductance, reduced leaf area and lower leaf temperature. Physiol. Plant. 1994, 92, 266–272. [Google Scholar] [CrossRef]
  33. Mc Daniel, R. The physiology of temperature effects on plants. In Breeding Plants for Less Favorable Environments; John Wiley and Sons: New York, NY, USA, 1982; pp. 13–45. [Google Scholar]
  34. Pilon, C.; Snider, J.L.; Oosterhuis, D.M.; Loka, D. The effects of genotype and irrigation regime on PSII heat tolerance in cotton. Sci. Int. 2016, 6, 1–11. [Google Scholar] [CrossRef]
  35. Lamont, W.J. Okra—A versatile vegetable crop. HortTechnology 1999, 9, 179–184. [Google Scholar] [CrossRef] [Green Version]
  36. Ariyo, O. Genetic diversity in West African okra (Abelmoschus caillei) (A. Chev.) Stevels—Multivariate analysis of morphological and agronomic characteristics. Genet. Resour. Crop Evol. 1993, 40, 25–32. [Google Scholar] [CrossRef]
  37. Aladele, S.E. Morphological distinctiveness and metroglyph analysis of fifty accessions of West African okra (Abelmoschus caillei) (A. Chev.) Stevels. J. Plant Breed. Crop Sci. 2009, 1, 273–280. [Google Scholar]
  38. Osawaru, M.; Ogwu, M.; Dania-Ogbe, F. Morphological assessment of the genetic variability among 53 Accessions of West African okra (Abelmoschus caillei (A. Chev.) Stevels) from South Western Nigeria. Niger. J. Basic Appl. Sci. 2013, 21, 227–238. [Google Scholar] [CrossRef] [Green Version]
  39. Carvalho, F.J.; de Mendonca, T.F.N.; Siquieroli, A.C.S.; Maciel, G.; Clemente, A.A. Genetic and morphological descriptors to access Brazilian Okra genotypes diversity. Rev. Caatinga 2022, 35, 254–264. [Google Scholar] [CrossRef]
  40. Gulsen, O.; Karagul, S.; Abak, K. Diversity and relationships among Turkish okra germplasm by SRAP and phenotypic marker polymorphism. Biologia 2007, 62, 41–45. [Google Scholar] [CrossRef]
  41. Sawadogo, M.; Ouedraogo, J.T.; Balma, D.; Ouedraogo, M.; Gowda, B.S.; Botanga, C.; Timko, M.P. The use of cross species SSR primers to study genetic diversity of okra from Burkina Faso. Afr. J. Biotechnol. 2009, 8, 2476–2482. [Google Scholar]
  42. Schafleitner, R.; Kumar, S.; Lin, C.Y.; Hegde, S.G.; Ebert, A. The okra (Abelmoschus esculentus) transcriptome as a source for gene sequence information and molecular markers for diversity analysis. Gene 2013, 517, 27–36. [Google Scholar] [CrossRef]
  43. Kumar, S.; Parekh, M.J.; Fougat, R.S.; Patel, S.K.; Patel, C.B.; Kumar, M.; Patel, B.R. Assessment of genetic diversity among okra genotypes using SSR markers. J. Plant Biochem. Biotechnol. 2017, 26, 172–178. [Google Scholar] [CrossRef]
  44. Aladele, S.E.; Ariyo, O.; de Lapena, R. Genetic relationships among West African okra (Abelmoschus caillei) and Asian genotypes (Abelmoschus esculentus) using RAPD. Afr. J. Biotechnol. 2008, 7, 1426. [Google Scholar]
  45. Khan, A.A.; Azmat, M.A. Assessment of genetic diversity in okra (Abelmoschus esculentus L.) using RAPD markers. Pak. J. Agric. Sci. 2013, 50, 655–662. [Google Scholar]
  46. Martinello, G.; Leal, N.; Amaral, A., Jr.; Pereira, M.; Daher, R. Comparison of morphological characteristics and RAPD for estimating genetic diversity in Abelmoschus spp. Acta Hortic. (ISHS) 2000, 546, 101–104. [Google Scholar] [CrossRef]
  47. Akash, M.W.; Shiyab, S.M.; Saleh, M.I. Yield and AFLP analyses of inter-landrace variability in okra (Abelmoschus esculentus L.). Life Sci. J. 2013, 10, 771–779. [Google Scholar]
  48. Brake, V.; Irwin, J.; Park, R. Genetic variability in Australian isolates of Puccinia coronata f. sp. avenae assessed with molecular and pathogenicity markers. Australas. Plant Pathol. 2001, 30, 259–266. [Google Scholar] [CrossRef]
  49. Maréchal-Drouard, L.; Guillemaut, P. A powerful but simple technique to prepare polysaccharide-free DNA quickly and without phenol extraction. Plant Mol. Biol. Rep. 1995, 13, 26–30. [Google Scholar] [CrossRef]
  50. Sullivan, C.Y. Mechanisms of heat and drought resistance in grain sorghum and methods of measurement. In Sorghum in Seventies; Oxford & IBH Pub. Co.: New Delhi, India, 1972; p. 247. [Google Scholar]
  51. Lafuente, M.T.; Belver, A.; Guye, M.G.; Saltveit, M.E. Effect of temperature conditioning on chilling injury of cucumber cotyledons possible role of abscisic acid and heat shock proteins. Plant Physiol. 1991, 95, 443–449. [Google Scholar] [CrossRef]
  52. Nagy, S.; Poczai, P.; Cernák, I.; Gorji, A.M.; Hegedűs, G.; Taller, J. PICcalc: An online program to calculate polymorphic information content for molecular genetic studies. Biochem. Genet. 2012, 50, 670–672. [Google Scholar] [CrossRef] [PubMed] [Green Version]
  53. Botstein, D.; White, R.L.; Skolnick, M.; Davis, R.W. Construction of a genetic linkage map in man using restriction fragment length polymorphisms. Am. J. Hum. Genet. 1980, 32, 314. [Google Scholar]
  54. Sneath, P.H.; Sokal, R.R. Numerical Taxonomy. The Principles and Practice of Numerical Classification; W H Freeman & Co.: New York, NY, USA, 1973. [Google Scholar]
  55. Rohlf, F. NTSYS-pc Numerical Taxonomy and Multivariate Analysis System, Version 2.02 e; EXETER Software Setauket: New York, NY, USA, 1998. [Google Scholar]
  56. Kankwatsa, P. Genetic Studies of Rust Resistance in the Triticum spp., and Puccinia graminis f. sp. Tritici Pathosystem; University of Sydeney, Faculty of Agriculture and Environment: Camperdown, Australia, 2016. [Google Scholar]
  57. Felsenstein, J. Confidence limits on phylogenies: An approach using the bootstrap. Evolution 1985, 39, 783–791. [Google Scholar] [CrossRef] [PubMed]
  58. Tamura, K.; Nei, M.; Kumar, S. Prospects for inferring very large phylogenies by using the neighbor-joining method. Proc. Natl. Acad. Sci. USA 2004, 101, 11030–11035. [Google Scholar] [CrossRef] [Green Version]
  59. Fedoroff, N.; Battisti, D.; Beachy, R.; Cooper, P.; Fischhoff, D.; Hodges, C.; Knauf, V.; Lobell, D.; Mazur, B.; Molden, D. Radically rethinking agriculture for the 21st century. Science 2010, 327, 833–834. [Google Scholar] [CrossRef] [Green Version]
  60. Lobell, D.B.; Gourdji, S.M. The influence of climate change on global crop productivity. Plant Physiol. 2012, 160, 1686–1697. [Google Scholar] [CrossRef] [PubMed] [Green Version]
  61. IPCC. Climate Change 2007—The Physical Science Basis: Working Group I Contribution to the Fourth Assessment Report of the Intergovernmental Panel on Climate Change; Cambridge University Press: Cambridge, UK, 2007; Volume 4. [Google Scholar]
  62. Fang, G.; Hammar, S.; Grumet, R. A quick and inexpensive method for removing polysaccharides from plant genomic DNA. Biotechniques 1992, 13, 52–54, 56. [Google Scholar]
  63. Fougat, R.S.; Purohit, A.R.; Kumar, S.; Parekh, M.J.; Kumar, M. SSR based genetic diversity in Abelmoschus species. Indian J. Agric. Sci. 2015, 85, 1223–1228. [Google Scholar]
  64. Yildiz, M.; Koçak, M.; Baloch, F. Genetic bottlenecks in Turkish okra germplasm and utility of iPBS retrotransposon markers for genetic diversity assessment. Genet. Mol. Res. 2015, 14, 10588–10602. [Google Scholar] [CrossRef] [PubMed]
  65. Bibi, A.; Oosterhuis, D.; Gonias, E. Photosynthesis, quantum yield of photosystem II and membrane leakage as affected by high temperatures in cotton genotypes. J. Cotton Sci. 2008, 12, 150–159. [Google Scholar]
  66. Cottee, N.S.; Bange, M.P.; Wilson, I.W.; Tan, D.K. Developing controlled environment screening for high-temperature tolerance in cotton that accurately reflects performance in the field. Funct. Plant Biol. 2012, 39, 670–678. [Google Scholar] [CrossRef]
  67. Leigh, A.; Sevanto, S.; Close, J.D.; Nicotra, A.B. The influence of leaf size and shape on leaf thermal dynamics: Does theory hold up under natural conditions? Plant Cell Environ. 2017, 40, 237–248. [Google Scholar] [CrossRef]
  68. Zlatev, Z.S.; Yordanov, I.T. Effects of soil drought on photosynthesis and chlorophyll fluorescence in bean plants. Bulg. J. Plant Physiol. 2004, 30, 3–18. [Google Scholar]
  69. Jagadish, S.V.K.; Way, D.A.; Sharkey, T.D. Plant heat stress: Concepts directing future research. Plant Cell Environ. 2021, 44, 1992–2005. [Google Scholar] [CrossRef] [PubMed]
  70. Loka, D.A.; Oosterhuis, D.M.; Baxevanos, D.; Noulas, C.; Hu, W. Single and combined effects of heat and water stress and recovery on cotton (Gossypium hirsutum L.) leaf physiology and sucrose metabolism. Plant Physiol. Biochem. 2020, 148, 166–179. [Google Scholar] [CrossRef] [PubMed]
  71. Mittler, R. Abiotic stress, the field environment and stress combination. Trends Plant Sci. 2006, 11, 15–19. [Google Scholar] [CrossRef]
  72. Rizhsky, L.; Liang, H.; Shuman, J.; Shulaev, V.; Davletova, S.; Mittler, R. When defense pathways collide. The response of Arabidopsis to a combination of drought and heat stress. Plant Physiol. 2004, 134, 1683–1696. [Google Scholar] [CrossRef] [Green Version]
  73. Drake, J.E.; Tjoelker, M.G.; Vårhammar, A.; Medlyn, B.E.; Reich, P.B.; Leigh, A.; Pfautsch, S.; Blackman, C.J.; López, R.; Aspinwall, M.J.; et al. Trees tolerate an extreme heatwave via sustained transpirational cooling and increased leaf thermal tolerance. Glob. Chang. Biol. 2018, 24, 2390–2402. [Google Scholar] [CrossRef]
  74. Osmond, C.; Grace, S. Perspectives on photoinhibition and photorespiration in the field: Quintessential inefficiencies of the light and dark reactions of photosynthesis? J. Exp. Bot. 1995, 46, 1351–1362. [Google Scholar] [CrossRef]
  75. Bukhov, N.G.; Wiese, C.; Neimanis, S.; Heber, U. Heat sensitivity of chloroplasts and leaves: Leakage of protons from thylakoids and reversible activation of cyclic electron transport. Photosynth. Res. 1999, 59, 81–93. [Google Scholar] [CrossRef]
  76. Feller, U.; Crafts-Brandner, S.J.; Salvucci, M.E. Moderately high temperatures inhibit ribulose-1, 5-bisphosphate carboxylase/oxygenase (Rubisco) activase-mediated activation of Rubisco. Plant Physiol. 1998, 116, 539–546. [Google Scholar] [CrossRef] [PubMed] [Green Version]
  77. Batcho, A.A.; Sarwar, M.B.; Rashid, B.; Hassan, S.; Husnain, T. Heat shock protein gene identified from Agave sisalana (AsHSP70) confers heat stress tolerance in transgenic cotton (Gossypium hirsutum). Theor. Exp. Plant Physiol. 2021, 33, 141–156. [Google Scholar] [CrossRef]
  78. Guo, Y.; Fan, R.; Sun, F.; Qu, Y.; Zheng, K.; Chen, Q.; Chen, Q. Identification of exogenous ABA and heat stress tolerance in various cotton genotypes. Plant Genet. Resour. 2020, 18, 404–416. [Google Scholar] [CrossRef]
  79. Kuo, C.; Chen, H.; Sun, H. Membrane thermostability and heat tolerance of vegetable leaves. In Adaptation of Food Crops to Temperature and Water Stress; Kuo, C.G., Ed.; AVRDC: Tainan City, Taiwan, 1992; pp. 160–168. [Google Scholar]
Figure 1. A phylogenetic analysis of 104 okra isolates based on 29 alleles produced by eight SSR markers. The percentage of replicate trees in which the associated taxa clustered together in the bootstrap test (1000 iterations) are shown above the branches, and values below 50 were omitted. Highlighted genotypes were selected for the in-depth physiological screening after 6 h heat shock.
Horticulturae 09 00722 g001
Figure 2. Electrolyte leakage (%) of 33 genotypes sorted by list number in control (grey square) and heat treatments (6 h, 45 °C, light circle). Error bars depict standard error (n = 3).
Horticulturae 09 00722 g002
Figure 3. Average difference in chlorophyll fluorescence (∆) of 29 genotypes (n = 3) calculated by subtracting measurements in control conditions from measurements after heat shock (6 h, 45 °C) (a) difference in chlorophyll fluorescence in the dark (∆Fv/Fm), (b) difference in chlorophyll fluorescence in the light (∆Fv′/Fm′). Negative values represent lower measurements in the heat treatment compared to the control. Error bars depict standard error. Photosynthesis measurement in the heat was missing for L3-54, hence not depicted in panel (b).
Horticulturae 09 00722 g003
Figure 4. Average difference of physiological traits (∆) in 29 genotypes (n = 3), calculated by subtracting measurements under control conditions from measurements after heat treatments (6 h, 45 °C (n = 3). (a) difference in photosynthesis rate (∆A), (b) difference in stomatal conductance (∆gs), and (c) difference in efficiency of the open reaction centre (∆ΦPSII). Negative values represent lower measurements in the heat treatment compared to the control. Error bars depict standard error. Photosynthesis measurement in the heat was missing for L2-15, hence not depicted in panel (a).
Horticulturae 09 00722 g004
Table 1. Eight polymorphic SSR markers used to amplify 104 genomic DNA at an annealing temperature of 53 °C, including information on repeated motifs, forward (F) and reverse (R) primer sequences, allele sizes (bp), number of alleles per locus, and polymorphic information content (PIC).
Primer
No.
NameRepeat
Motif
Primer Sequence (5′-3′)Allele Size Range (bp)No. of AllelesPIC
3AVRDC-Okra9(AAT)12F: ACCTTGAACACCAGGTACAG
R: TTGCTCTTATGAAGCAGTGA
150–25040.56
6AVRDC-Okra28(ATT)8F: CCTCTTCATCCATCTTTTCA
R: GGAAGATGCTGTGAAGGTAG
200–30030.53
9AVRDC-Okra54(GAA)10F: CGAAAAGGAAACTCAACAAC
R: TGAACCTTATTTTCCTCGTG
100–17020.49
11AVRDC-Okra57(GAA)9-
(GAG)7
F: CGAGGAGACCATGGAAGAAG
R: ATGAGGAGGACGAGCAAGAA
170–31040.43
12AVRDC-Okra63(TCT)12F: GTGTTTGAAAGGGACTGTGT
R: CTTCATCAAAACCATGCAG
200–30020.27
13AVRDC-Okra64(TCT)22F: AAGGAGGAGAAAGAGAAGGA
R: ATTTACTTGAGCAGCAGCAG
100–30070.71
18AVRDC-Okra86(AGC)8F: ATGCAAACAAGCTAGTGGAT
R: ATTCTCTTCAGGGTTTCCTC
250–40040.65
19AVRDC-Okra89(AGC)8F: TTTGAGTTCTTTCGTCCACT
R: GTATTTGGACATGGCGTTAT
140–20030.59
Table 2. ANOVA results (F and p-values) for chlorophyll fluorescence (in the dark Fv/Fm and in the light Fv′/Fm′), photosynthesis rate (A), efficiency of the open reaction centre (ΦPSII), stomatal conductance (gs), and electrolyte leakage (EL) of 29 genotypes (except for EL, which were 33 genotypes) in the control and heat (6 h, 45 °C).
Fv/FmFv′/FmAΦPSIIgsEL
GenotypeF2.146.236.413.099.944.34
p-value0.003<0.001<0.001<0.001<0.001<0.001
TreatmentF61.2727.6811.2816.429.610.3
p-value<0.001<0.0010.001<0.001<0.0010.585
Genotype ×
Treatment
F2.271.84.882.995.291.62
p-value0.0010.017<0.001<0.001<0.0010.031
Disclaimer/Publisher’s Note: The statements, opinions and data contained in all publications are solely those of the individual author(s) and contributor(s) and not of MDPI and/or the editor(s). MDPI and/or the editor(s) disclaim responsibility for any injury to people or property resulting from any ideas, methods, instructions or products referred to in the content.

