Article

Effect of Low-Light Stress on Sugar and Acid Accumulation during Fruit Development and Ripening of Sweet Cherry

1
College of Horticulture, Sichuan Agricultural University, Chengdu 611130, China
2
Horticulture Research Institute, Sichuan Academy of Agricultural Sciences, Chengdu 611134, China
*
Author to whom correspondence should be addressed.
These authors contributed equally to this work.
Horticulturae 2023, 9(6), 654; https://doi.org/10.3390/horticulturae9060654
Submission received: 8 April 2023 / Revised: 28 May 2023 / Accepted: 29 May 2023 / Published: 1 June 2023
(This article belongs to the Special Issue The Effects of Shade on Crops: From Greenhouse to Agrivoltaic)

Abstract

:
In the production process of sweet cherry, there are unreasonable planting densities and tree shape selections. With increasing tree age, the crown of the tree continues to expand and the tree body is prone to canopy closure, which leads to the inability to efficiently use space and light energy. Low-light has become a major limiting factor in the quality of sweet cherry. Therefore, we analyzed the changes of various physiological indicators and the transcriptome of ‘Hongdeng’ sweet cherry under shading treatment in this study to investigate the effects of low-light stress on the photosynthetic characteristics of sweet cherry leaves and fruit physiology and biochemistry. The results showed that shading significantly reduces the light capture capacity of leaves, damages the photosystem, reduces carbon assimilation capacity, and consumes the majority of the captured light energy as photochemical energy, thereby restricting the growth and development of leaves and reducing the accumulation of nutrients in fruits. Shading significantly reduced fruit weight, sugar content, and vitamin C content at maturity and significantly increased acid content. Transcriptomic data demonstrated that low-light stress produces a large number of differential genes related to carbon metabolism, organic acid metabolism, and stress resistance, thereby suggesting that low-light stress may affect the expression of these related genes and inclusions in the fruit. The results of this study will provide theoretical and technical support for the physiological response mechanism of low-light tolerance in sweet cherry, the selection and breeding of low-light tolerant sweet cherry varieties, and the cultivation of sweet cherry in facilities.

1. Introduction

Sweet cherry (Prunus avium L.) is a plant of the family Rosaceae and genus Prunus [1]. Sweet cherry is a significant economic fruit tree, indigenous to Europe and commonly grown in China, that presents a double S-shaped growth curve. Its development process based on developmental characteristics is divided into three main stages. When the fruit is mostly green, the first stage is dependent on cell division and elongation. The endocarp hardening stage, which results in the formation of the kernel and fruit color, is the second step. Finally, the third stage is the exponential growth period caused by cell expansion, during which drastic physiological and biochemical changes in sugar, organic acids, and color occur [2]. Sweet cherries are favored by consumers because of their early ripening, delicious taste, and strong antioxidant properties [3].
Fruit quality, which is primarily divided into internal and external qualities, plays a significant role in deciding the fruit’s nutritional and commercial worth. Sweet cherries are light-loving plants [4] that suffer from severe fruit drop and cracking because of their susceptibility to rainfall [1]. An increasing number of production sites of fruits, such as apples [5], typically use colorless shelters for rainfall avoidance to significantly increase fruit yield [6]. However, the cover inevitably alters the microclimate of the canopy, leading to the reduction of photosynthetic effective radiation [7], low-light stress to plants, and constraints on fruit nutritional growth and development [8]. The effects of low-light stress on rubber trees [9], cotton [10], and sweet cherry [11] have been investigated.
Changes in plant physiological adaptations to unfavorable conditions can ultimately be attributed to alterations at the molecular level. Research on the physiological response to plant adversity has evolved in recent years from the phenological level of plant physiological adaptation phenomena to the intrinsic mechanisms of plant physiological adaptation from a microscopic perspective [9,10,11]. Note that transcriptomic studies are an important research direction in biological sciences. To date, transcriptomic strategies have been used in many crops to analyze the mechanisms of adaptive regulation in plants under variable light and temperature conditions. In maize, differentially expressed genes (DEGs) are typically involved in assimilation processes (photosynthesis and carbon fixation pathways), i.e., photosynthetic capture through the modification of chlorophyll (Chl) biosynthesis, indicating complex regulatory mechanisms and interactions between cold and light signaling processes [12]. In low-light-tolerant rice varieties, the expression of photosystem I and II complexes and genes linked to electron transport increase. Therefore, the upregulation of photosynthesis-related gene expression under low light conditions helps maintain rice yield [13]. In addition, leaves need to maintain effective antioxidant capacity under low light conditions to sustain their carbohydrate production levels [14]. Hence, leaf regulation or adaptation to low light (hours or days) is achieved by integrating multiple signals, but transcriptomic studies on sweet cherry under the influence of low-light stress are limited.
Sweet cherry is widely planted in the southwest and is the pillar industry of Hanyuan County. Hanyuan is a subtropical monsoon area with frequent spring rain and hail, so tree cover is used to protect from rain and achieve high yield [15], but it may affect sweet cherry fruit quality and photosynthetic characteristics. Therefore, the present study focused on the adaptation and regulatory mechanisms of sweet cherry under low-light stress. The purpose of this study was to understand the effects of low-light stress on the changes of photosynthetic characteristics of leaves, fruit internal quality, sugar-acid accumulation, and the sugar-acid metabolism-related enzyme activities of ‘Hong deng’ sweet cherry. In addition, physiological quality and transcriptome research screened out genes related to low-light stress, providing a theoretical basis for further understanding the low-light tolerance mechanism of sweet cherry and establishing a reasonable light management and cultivation methodology.

2. Materials and Methods

2.1. Plant Materials and Sampling

‘Hong deng’ sweet cherry, used as the test material in this study, was obtained from the sweet cherry test site in Hanyuan County, Ya’an City, Sichuan Province. Six sweet cherry trees aged 10 years with the same growth conditions and growth period were randomly divided into two groups with three trees in each group. After flowering, the top of the whole tree was covered with a sunshade net. Treatment group A was shaded with a white insulated shade net (shading rate 30% ± 5%) (Meiryo, Hyogo, Japan) and the other group was left untreated and was regarded as the control (CK). Sampling started on 7 April 2021 (5 days after flowering) and was performed every 3 days after harvest by picking 20 fruits from each treatment group (60 fruits total per treatment). Fruits were divided into three stages (expansion, color change, and ripening) according to their development and color change (Figure 1). The fruits were brought back to the laboratory immediately after sample collection for imaging and measurement of individual fruit weight and hardness. In order to prepare samples for later tests, they were quickly and uniformly cut into slices, frozen in liquid nitrogen, and kept in a refrigerator at 80 °C.

2.2. Determination of Relevant Indicators

2.2.1. Determination of Photosynthetic Parameters

The relative chlorophyll content was determined using a CCM-200 chlorophyll meter (OPTI-sciences, Boston, MA, USA). Gas exchange parameters, light response curves, and chlorophyll fluorescence parameters were determined using a Li-6800 portable photosynthesizer (LI-COR, Lincoln, NE, USA). The photosynthesis–light response curve [16] was fitted with the corrected right-angle hyperbola model and the apparent quantum efficiency (AQY), light compensation point (LCP), light saturation point (LSP), maximum net photosynthetic rate (Pn(max)), and dark respiration rate (Rd) were obtained.
The four bearing branch leaves of each tree’s outer crown and inner circumference were randomly selected from east, south, west, and north directions. The Li-6800 portable photosynthometer was used to determine the net photosynthetic rate (Pn), transpiration rate (Tr), stomatal conductance (Gs), and intercellular carbon dioxide concentration (Ci) during mornings of fine weather in the S9 (37 days after flowering) period. Two treatments (A and CK) were set up in this experiment, and three trees were selected for each treatment.
Chlorophyll fluorescence parameters were set for each parameter and leaf selection as above, and four leaves were measured per treatment. The leaves to be tested were wrapped with tin foil before measurement and were dark-adapted overnight. The initial and maximum fluorescence values were measured on the second day. The activation light was set according to the ambient light intensity of the shade treatment and light activation was performed for more than 50 min. The steady-state fluorescence, minimum fluorescence under light, and maximum fluorescence under light of the leaves were measured. The measured data were used to determine the electron transfer rate (ETR), photochemical quenching coefficient (qP), non-photochemical quenching coefficient (NPQ), maximum photochemical quantum yield Fv/Fm of PSII (Fv/Fm), and actual photochemical quantum yield of PSII (ΦPSII). The distribution ratio of light energy absorbed by PSII was obtained according to the method proposed by Demmig-Adams et al. [17] for photochemical energy dissipation, antenna thermal energy dissipation, and non-photochemical energy.

2.2.2. Determination of Fruit Weight and Shape Index

Ten fruits were selected from each sampling period to measure the fruit weight and calculate the shape index.

2.2.3. Determination of Hardness, Soluble Solid Content, Vitamin C, Color, Total Anthocyanin Concentration, Trehalose, and Cellulose Content

Fruit hardness was measured using a GY-1 hardness meter. A MASTER-M handheld sugar meter was used to calculate the soluble solid concentration (TSS). The Vc content was determined using the 2, 6-dichloroindophenol titrimetric method (AOAC Official Method 967.21). A method involving 1% hydrochloric acid and methanol was used to measure the anthocyanin content [18]. Three replicates were determined for each data sample. Fruit color was determined using a CM-2600d spectrophotometer (Konica Minolta, Tokyo, Japan). At each sampling step, ten fruits were chosen at random and measurements were taken at four locations around the equator. A micro-method kit (Solarbio, Beijing, China) was used to analyze the amount of cellulose and trehalose in accordance with the manufacturer’s directions.

2.2.4. Determination of Glycolic Acid Fractions and Content

High-performance liquid chromatography (HPLC) was used with an Agilent 1260 II high-performance liquid chromatography system to measure the contents of soluble sugars and titratable acid fractions (Agilent Technologies, Santa Clara, CA, USA). Refer to Chen et al.’s [18] paper for specific methods.

2.2.5. Determination of Enzymes Related to Glycolic Acid Metabolism

The activities of sucrose acid invertase (AI), sucrose neutral or alkalineinvertase (NI), sucrose phosphate synthase (SPS), decomposition direction of sucrose synthase (SS-I), synthetic direction of sucrose synthase (SS), phosphoenolpyruvate carboxylase (PEPC), malate synthase (NADP-ME), and malate dehydrogenase (NAD-MDH) were determined using ELISA kits (Enzyme immunoassay, Yancheng, China).

2.3. Transcriptome Sequencing

2.3.1. RNA Extraction and Transcriptome Sequencing

Transcriptome data of sweet cherry fruit treated by A and CK during S9 were studied using the RNA-seq technique.
The total RNA kit was used to recover total RNA (Tiangen Biotechnology Co., Ltd., Beijing, China). In order to check the integrity of the RNA samples, RNA was extracted using an Agilent 2100 Bioanalyzer and a 2100 RNA Nano 6000 assay kit (Agilent Technologies, Inc., Santa Clara, CA, USA). The concentration and purity of the RNA samples were verified with a NanoDrop 2000 spectrophotometer (Thermo Fisher Scientific, Waltham, MA, USA). Transcriptome sequencing was performed by San ni Biosciences (Nantong, China). Genes or transcripts with computed expression fold changes fulfilling |log2 (fold change)| > 1 analysis and a sum of mapping reads 10 in the two samples were selected. A hierarchical clustering heat map between the two treatments was generated using the FPKM (Fragments Per Kilobase of exon model per Million mapped fragments) values as expression levels.

2.3.2. Data Processing and Analysis

The raw data were filtered using fastp software and the clean data were mapped against the reference genome using hisat2 to obtain information on the position of the reads on the reference genome (https://www.ncbi.nlm.nih.gov/bioproject/PRJNA395588 accessed on 20 October 2022), as well as information on the characteristics of the sequenced samples. Differential expression at the transcript and gene levels was analyzed using DEseq2 or edgeR. Gene ontology (GO) enrichment analysis was performed using the topGO R package, and the categories of biological process (BP), cellular component (CC), and molecular function (MF) analyses made up the functional classification annotations. The graphic only displays the top 10 GO keywords’ names. The Kyoto Encyclopedia of Genes and Genomes (KEGG) using the clusterProfiler package was used to elucidate the signaling pathways involved in differential genes.

2.3.3. Quantitative Real-Time PCR Analysis

We performed real-time quantitative PCR on nine important differential genes that have been screened for data accuracy. qRT PCR analysis was performed using the Bio-Rad CFX96TM Real-Time PCR System (Bio-Rad, Hercules, CA, USA) and 2× TSINGKE®Master qRT PCR Mix (SYBR Green I) (TSINGKE, Beijing, China). The amplification procedure was: pre-denaturation at 95 °C for 30 s, denaturation at 95 °C for 5 s, annealing at 59 °C for 30 s. The number of amplification cycles was 39 and each sample was repeated three times. Each 20 L PCR reaction solution contained 2.0 µL diluted cDNA, 0.8 µL of each primer (10 mM), 10 µL SYBR Green I mix, and 6.4 µL dd H2O. Finally, gene specific primers were designed using Primer Premier 6 and gene expression was calculated using the 2−ΔΔCt method [19].
See specific primer information Table S2.

2.4. Data Processing and Analysis

The average value was taken after three repetitions for the determination of all indicators. The data were sorted, checked, and plotted using Excel, SPSS 20.0, and Graphpad Prism 8.

3. Results

3.1. Fruit Phenotypic Changes under Low-Light Stress

Figure 1a depicts the leaf phenotype during photosynthesis measurements. Figure 1b depicts several fruit phenotypes that occurred during the growth and ripening of the sweet cherry fruit. The fruit underwent a gradual change from small to large throughout the developmental stage, and the fruit color changed gradually from green to light yellow and finally to dark red. As clearly shown in Figure 1, sweet cherry fruit coloration was affected by the use of shade net treatment. Compared with the control group, shading of the treatment group reduced the fruit coloration.

3.2. Leaf Photosynthetic Properties

The parameters governing the gas exchange in sweet cherry leaves were significantly influenced by low-light stress. The net photosynthetic rate of ‘Hong deng’ sweet cherry leaves under shading decreased by 8.44%, transpiration rate and stomatal conductance were significantly lower than those of the control, and differences in intercellular CO2 were insignificant (Table 1). These results indicated that the decreased photosynthesis of leaves after shading results in low dry matter accumulation and a reduced proportion of distribution to the fruit.
As can be seen in Table 2, the shade group’s Fv/Fm, NPQ, and ERT values were significantly lower than those of the control group, although the shade group’s PSII and qP values were significantly greater. Low NPQ of the shade group indicated that the proportion of absorbed light energy for non-photochemical dissipation is reduced and additional absorbed light energy is used for photochemical reactions, increasing PSII’s ability to use the light energy it has absorbed.
As shown in Table 3, the energy consumption of photochemical reactions in the shade group was significantly higher than that in the control group and the antenna heat and non-photochemical energy consumption values were significantly lower than those in the control group.
The significant decrease in leaf chlorophyll SPAD values under low-light stress could be attributed to the reduced content of light-catching pigments, such as chlorophyll, located in the cystoid membrane; hence, the light-catching capacity of leaves was reduced (Figure 2a). Pn is favorably connected with Tr (p < 0.05) and Gs is positively correlated with Tr (p < 0.01), according to an additional correlation study of Pn, Tr, Gs, and Ci (Figure 2b).

3.3. Changes in General Fruit Characteristics and Quality

The single-fruit weight of sweet cherry increased continuously during development, with the fastest increase from 2.06 g to 7.09 g in S6–S11 in treatment A and from 2.79 g to 8.21 g in CK (Figure 3a). Shading significantly reduced fruit weight, especially during ripening, by 1.03 g (Figure 3a). The longitudinal (Figure 3b) and transverse (Figure 3c) diameters of sweet cherries gradually increased during fruit development. The shape of fruit in treatment A was within 0.86–0.89 and the fruit shape index of CK at the ripening stage was within 0.78–0.86 (Figure 3d). This finding indicated that shading can effectively improve the fruit shape index of the sweet cherry fruit.

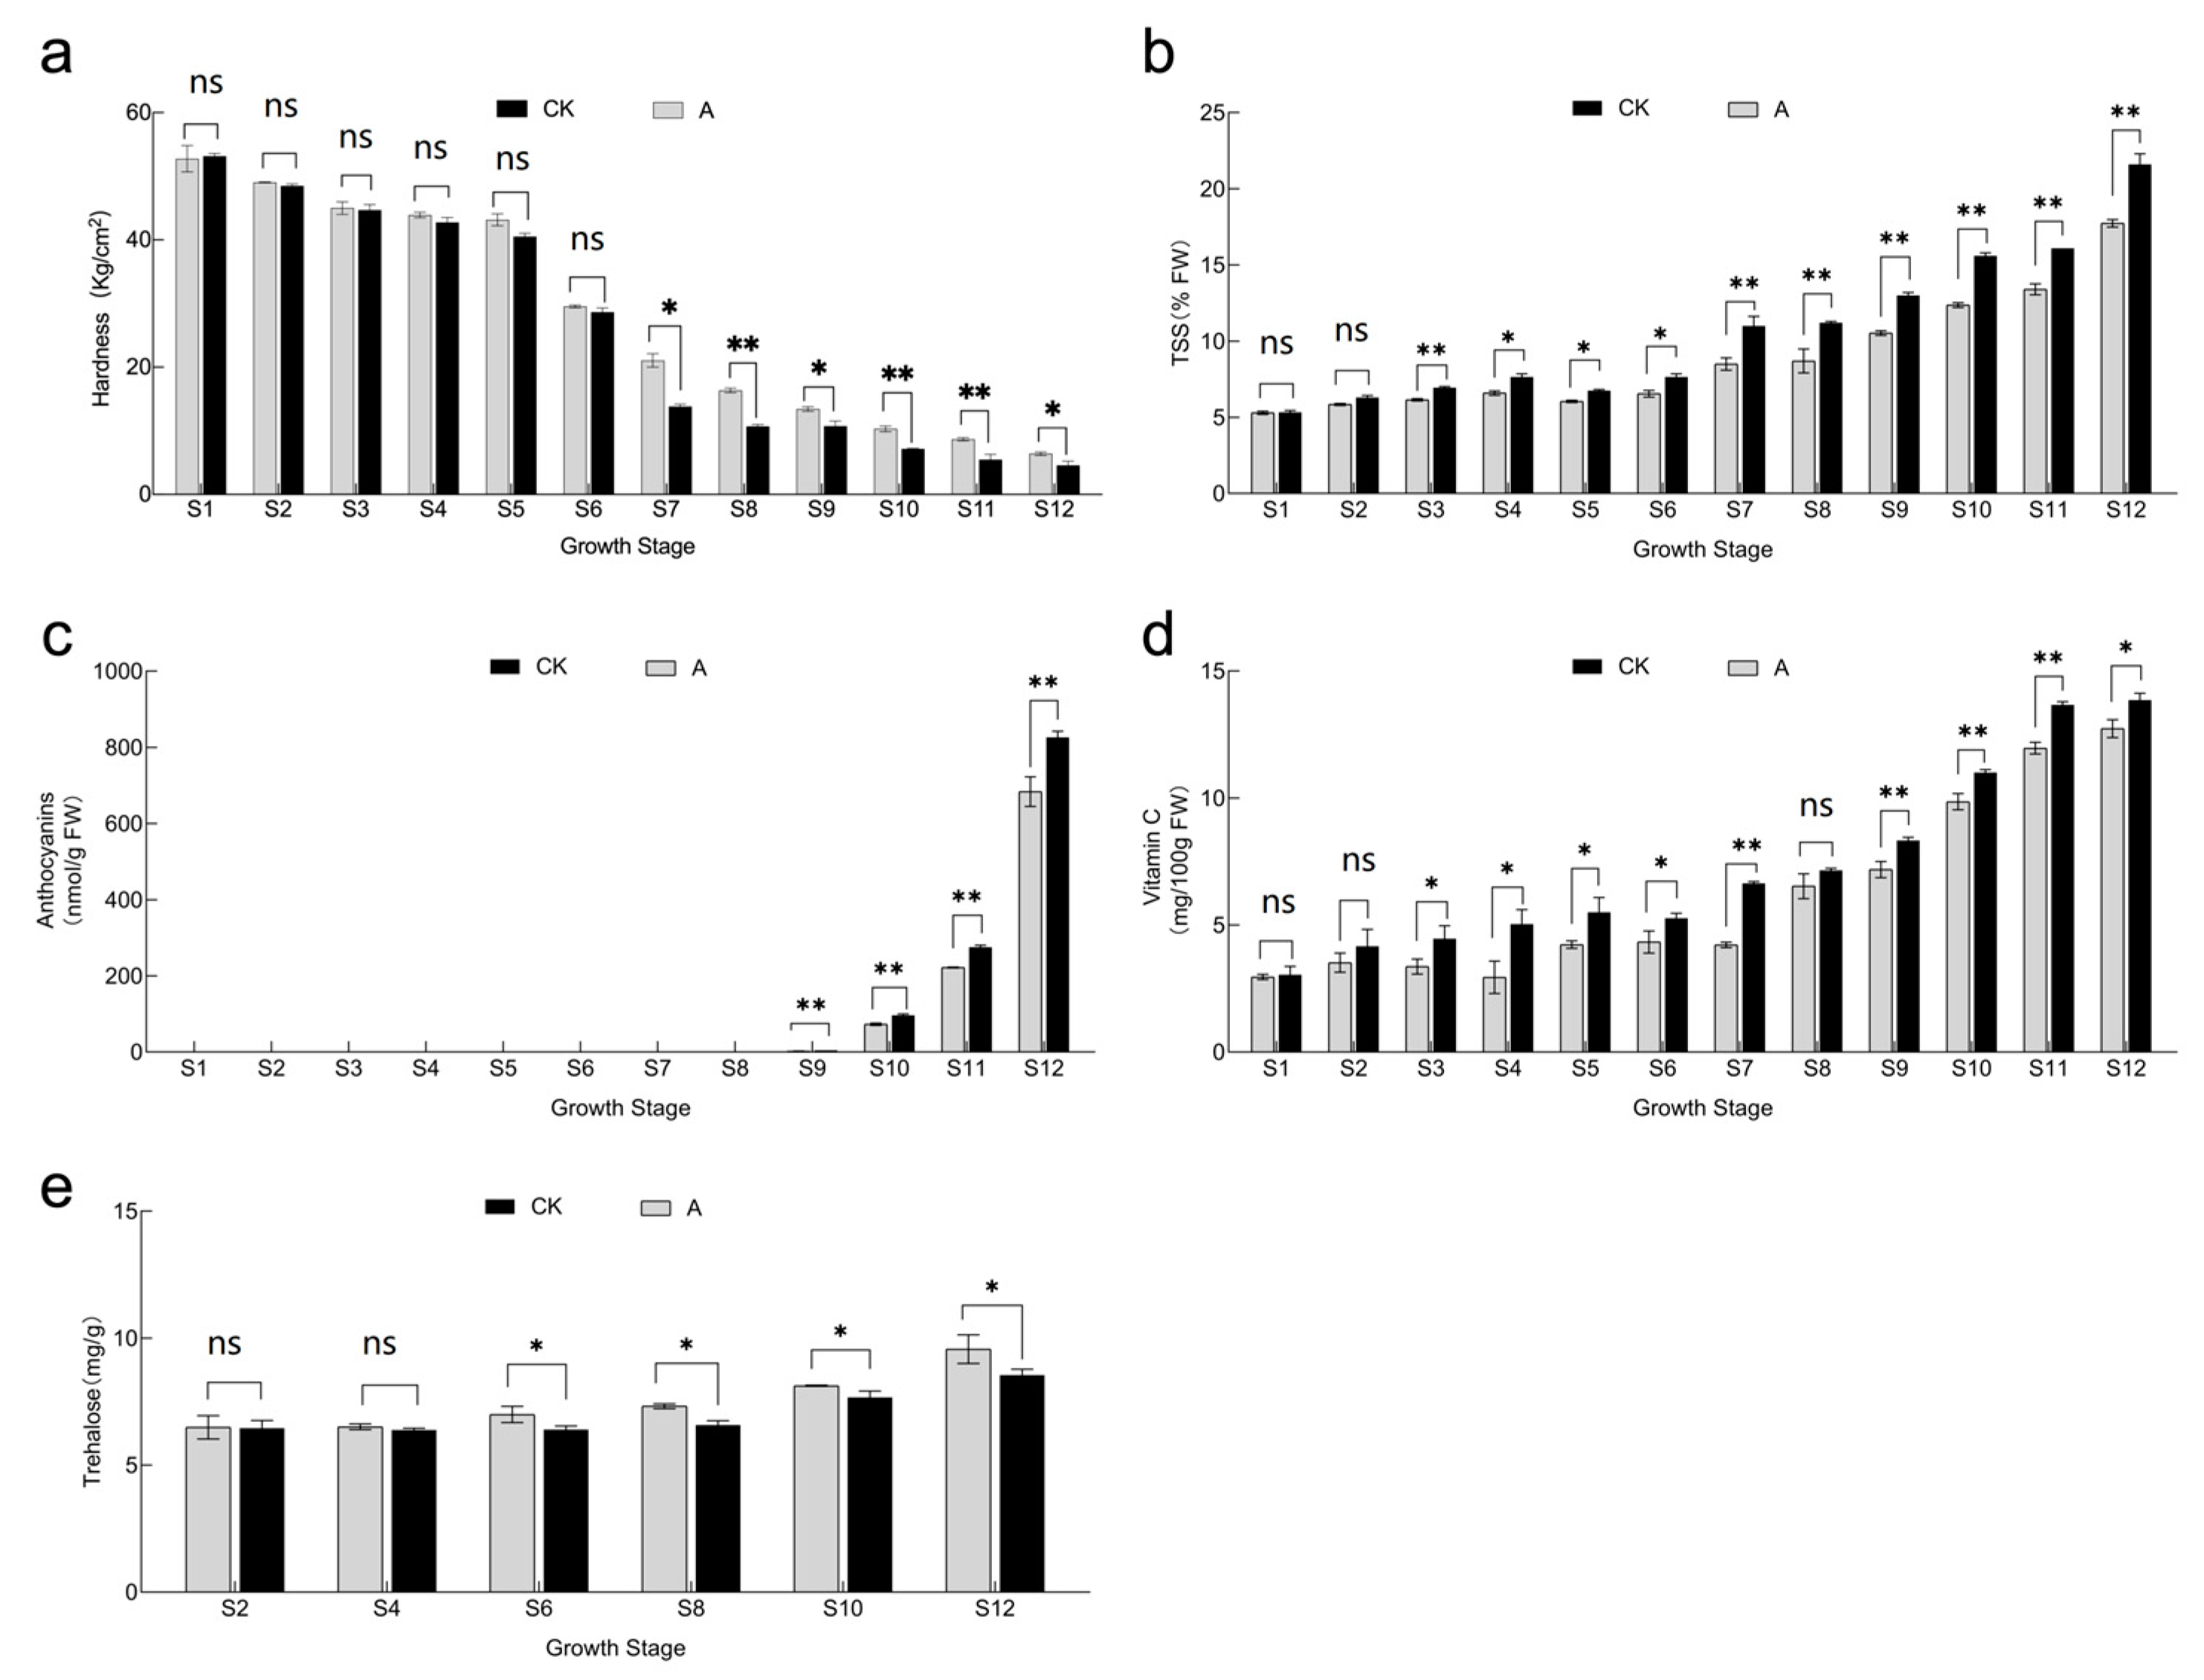
3.4. Effect of Shading Treatment on Fruit Hardness, TSS, Anthocyanin, Vitamin C and Trehalose

The analysis of hardness, TSS, anthocyanin, Vc, and trehalose is shown in Figure 4. The shading treatments affected fruit hardness, with differences starting from the S7 period and CK presenting significantly lower hardness than treatment group A. The hardness of treatment A at maturity was 6.40 Kg/cm2, which was significantly higher than that of CK (4.57 Kg/cm2) (Figure 4a). The TSS increased slowly and then rapidly from S6 to S10 in the growth and development period, with significant differences between the two treatments (Figure 4b). The TSS of treatment group A at maturity decreased by 8.87% compared with the control.
The anthocyanin concentration was minimal from S1 to S8 but increased rapidly from S9 until harvest and was significantly higher in CK than that in treatment A (Figure 4c). The Vc concentration gradually increased and peaked at S12 at 12.7 and 13.9 mg/100 g in treatments A and CK, respectively. Significant differences were observed in the Vc concentration between treatments throughout the maturation period (Figure 4d). The trehalose concentration of the shade group was significantly higher than that of the control group in all periods (Figure 4e).

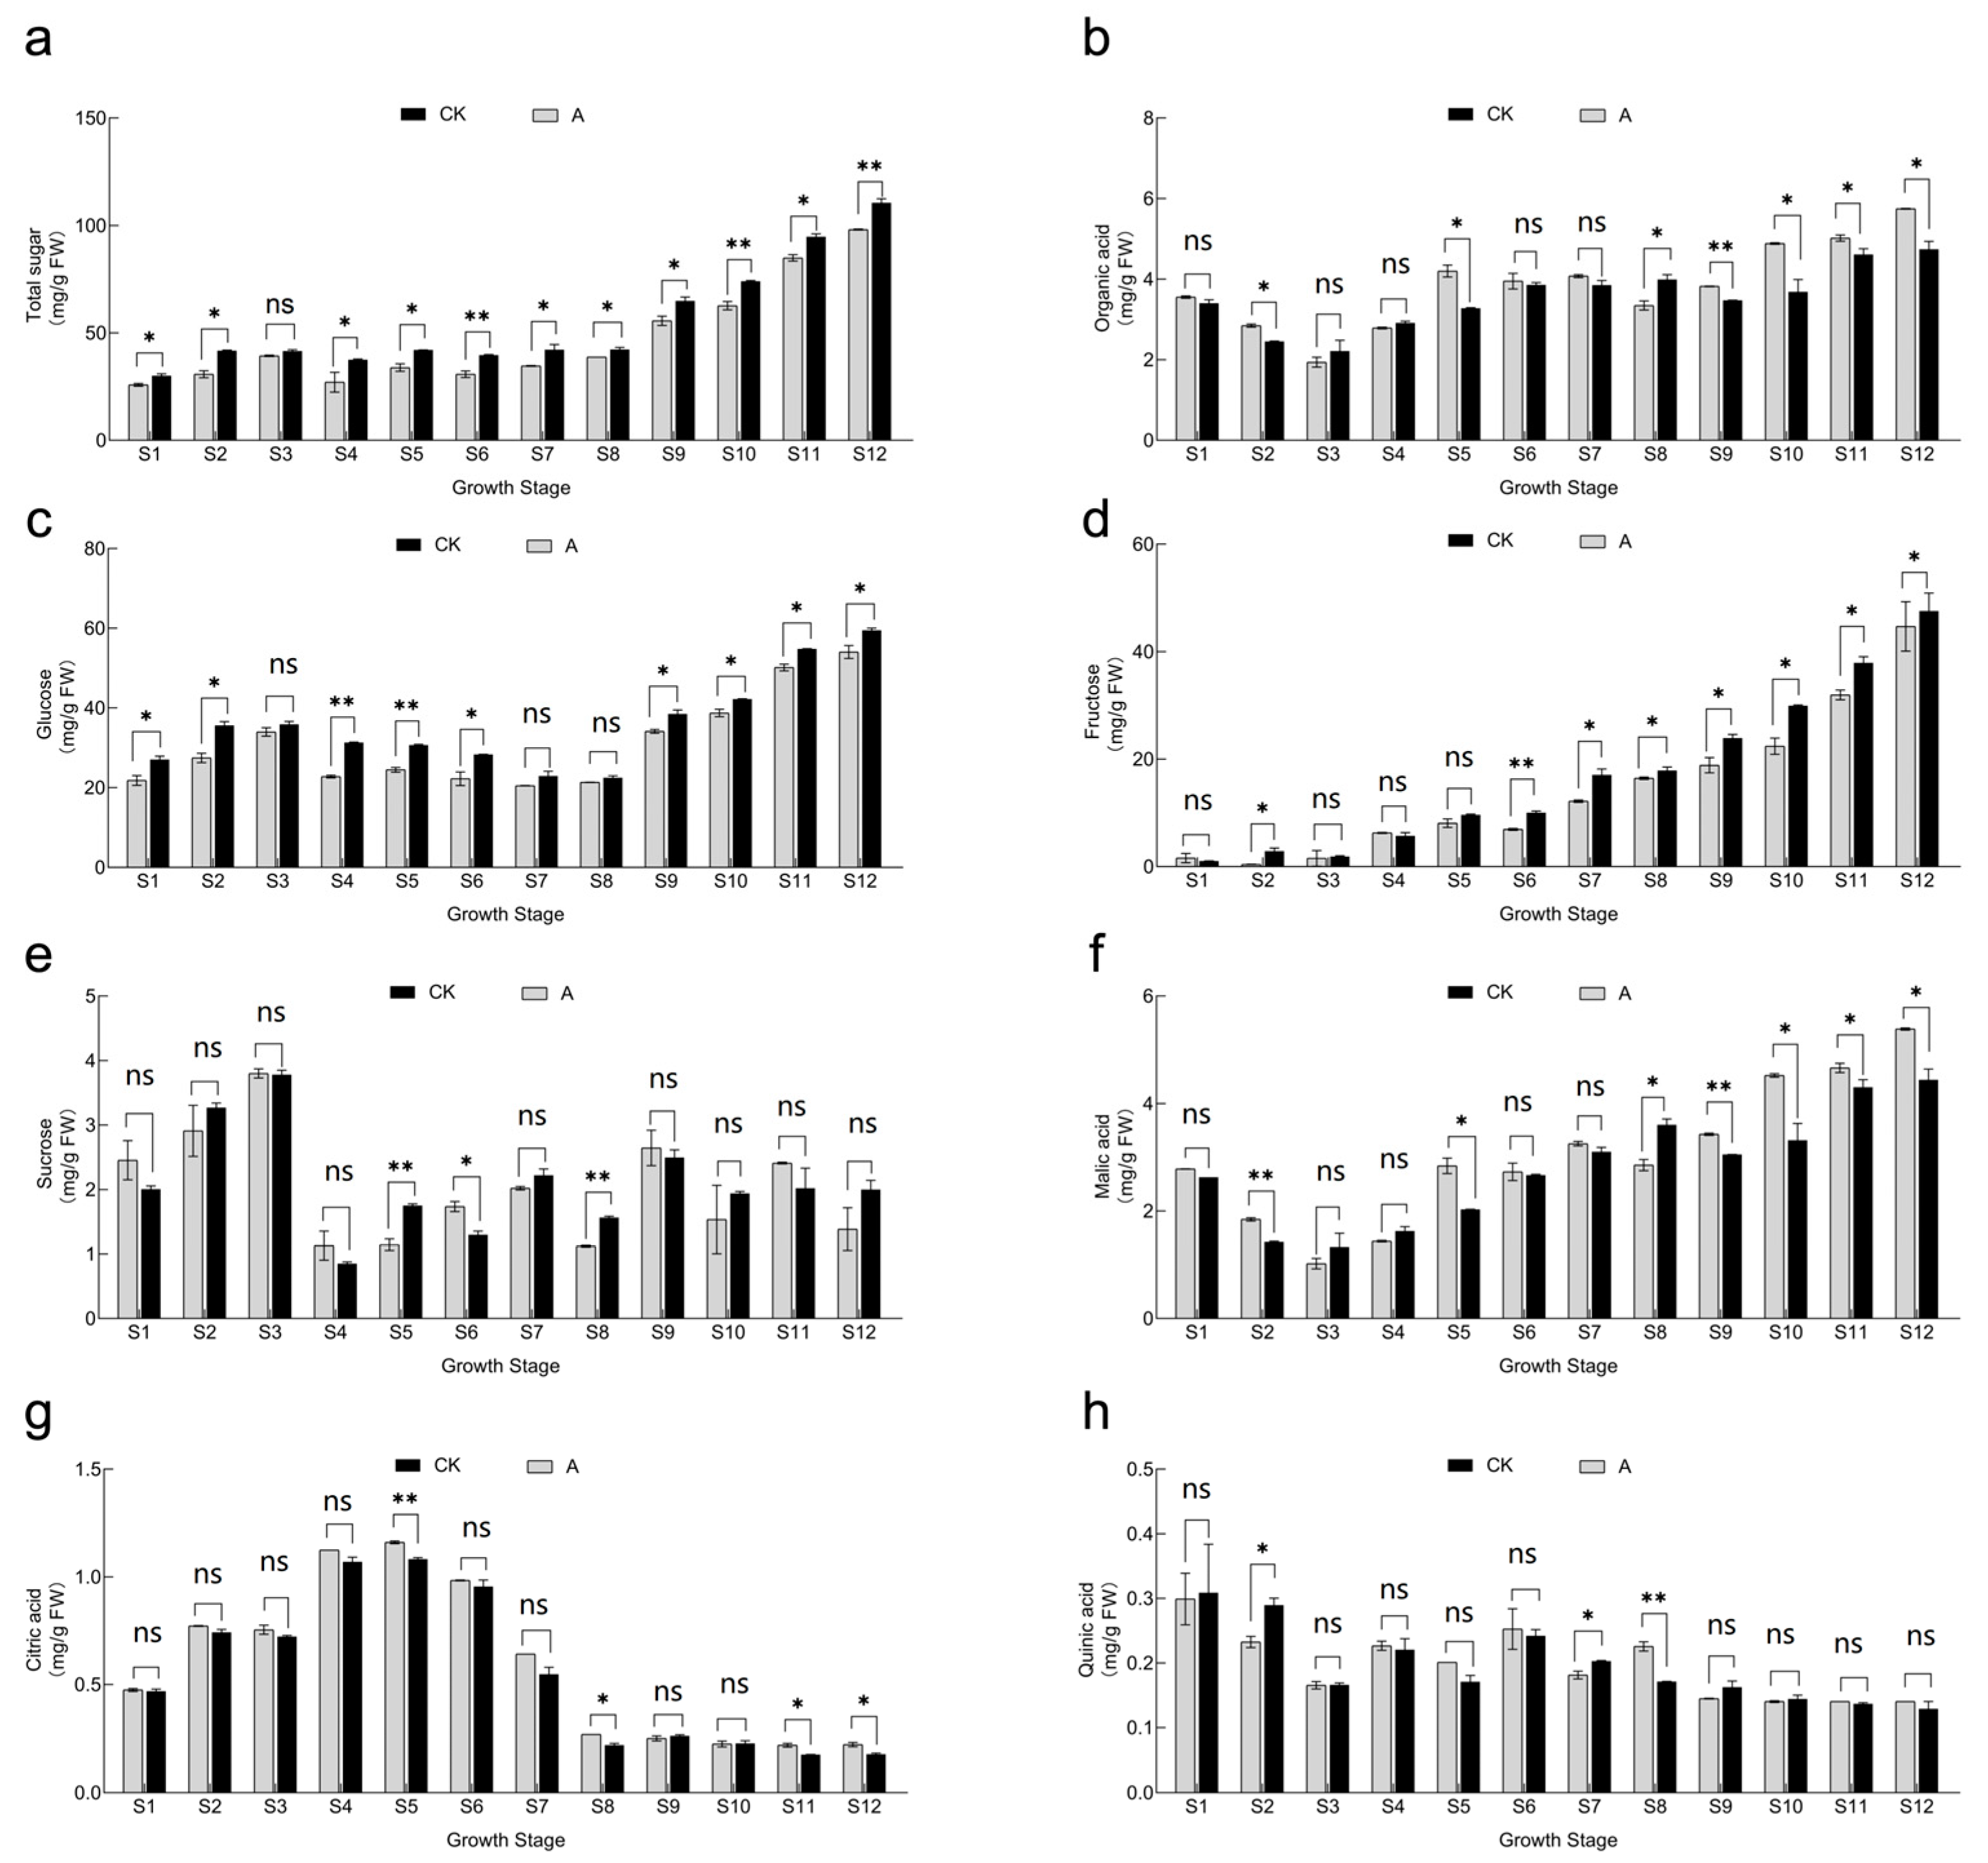
3.5. Effect of Shading Treatment on Fruit Soluble Sugar and Titratable Acid Fractions and Concentrations

The overall trend of soluble sugar concentration increased slowly from S1 to S5 and then rapidly after S6 until harvest. The sugar concentration was significantly lower than the control for most periods of shading (Figure 5a). Glucose and fructose were the most abundant components of soluble sugars in the sweet cherry fruit (Figure 5c,d). The titratable acid concentration showed an overall trend of gradual increase (Figure 5b). Malic acid was the most abundant component of titratable acid (Figure 5f).
The glucose concentration of the control group was significantly higher than that of the shade group during the ripening period (Figure 5c). The fructose concentration gradually increased and the glucose concentration of the control group was significantly higher than that of the shade group after period S6 (Figure 5d). The trend of sucrose concentration was insignificant during the growth and development period, and no significant difference was observed in the trend of the two treatments (Figure 5e).
The malic acid concentration of sweet cheery decreased and then gradually increased to maturity; meanwhile, the malic acid concentration of the shade group was significantly higher than that of the control group during the maturity period (Figure 5f). The citric acid concentration increased and then decreased to a stable level, and the change between the two treatments demonstrated no significant difference (Figure 5g). The quinic acid concentration presented an overall decrease and no difference between the two treatments was observed during the maturity period (Figure 5h).

3.6. Effect of Shading Treatment on the Activity of Enzymes Related to Sugar and Acid Metabolism in Fruits

The activities of sucrose acid invertase (AI), sucrose neutral or alkalineinvertase (NI), sucrose phosphate synthase (SPS), decomposition direction of sucrose synthase (SS-I), synthetic direction of sucrose synthase (SS), phosphoenolpyruvate carboxylase (PEPC), malate synthase (NADP-ME), and malate dehydrogenase (NAD-MDH) during the development and ripening of sweet cherry fruit were studied. The enzyme activities of SPS and SS showed an increasing trend during the growth and development period and then decreased to a stable level; meanwhile, the difference between the control and shade groups in the middle and late development periods was insignificant (Figure 6c,d). The enzyme activities of SS-I showed a decreasing trend during the growth and development period and then increased. Notably, the enzyme activities of the control group were significantly higher than those of the shade group in the period after S5 (Figure 6e).
The enzyme activity of PEPC presented a decreasing trend during the growth and development period (Figure 6f). The enzyme activity of the control group was significantly higher than that of the shade group in the early stage of fruit development. The enzyme activities of NADP-ME and NAD-MDH demonstrated a decreasing trend and then increased in the overall development period. The enzyme activity of NADP-ME in the control group was lower than that of the shade group in the early stage of growth and development (Figure 6g). Note that the enzyme activities of the control group were significantly lower than those of the shade group in S3, S4, and S6. The differences in NAD-MDH enzyme activities between the two treatments were insignificant (Figure 6h).

3.7. Correlations between Sugar–Acid Content and Enzyme Activities

Figure 7 displays the relationships between enzyme activities and sugar-acid concentration. The total sugar content was highly significantly positively correlated with AI, NI, and SS-I and significantly negatively correlated with SPS, whereas the organic acid content of both treatments was highly significantly negatively correlated with the PEPC.

3.8. Transcriptome Analysis

3.8.1. Sequencing Quality Analysis

Significant physiological and biochemical changes in sugars, organic acids, soluble solids, vitamin C, and color began to occur in the S9 period. RNA-seq technology was applied to examine the transcriptome data between sweet cherry fruit treatments during this period. For details of transcription sequencing, see Table S5. After removing the splice sequences, uncertain reads, and low-quality reads, a total of 279,674,870 high-quality clean reads were recovered from these two treatments, with an average of 93.24% of clean reads localizing to the sweet cherry genome (see Table S2 for detailed results).
Gene expression correlations among samples are shown in Figure 8b. High correlations were observed among the same treatment and low correlations were revealed among different treatments. This finding indicated that the shade treatment affects the expression of sweet cherry genes. Samples were subjected to PCA analysis and the findings are shown in Figure 8a. On the score map, the duplicates were concentrated and the samples from the two treatments were easily distinguishable. Hence, sweet cherry demonstrated differing gene expression levels between treatments. PC 1 and PC 2 respectively explained 87.3% and 10.4% of the features in the original dataset. A distinction between the shade therapy and no treatment could be seen in PC 1 and PC 2. There was a strong correlation between the samples within the group and a large difference between the groups, which further indicated that the samples changed at the transcription level after treatment (Figure 8b).

3.8.2. Identification of Differentially Expressed Genes

Between the treatment and control groups, 1910 differentially expressed genes were observed. A total of 1258 genes presented significantly higher expression levels and 652 genes demonstrated significantly lower expression levels in the treatment group relative to the control group (Figure 8c,d).
The results of the hierarchical clustering heat map are shown in Figure 8e. The satisfactory intra-group reproducibility and large inter-group differences further indicated that the shading treatment exerts an effect on the sweet cherry gene expression and most genes were downregulated.

3.8.3. GO and KEGG Enrichment Analyses

The majority of DEGs had high CC and BP enrichments and the BP category had much greater enrichments in both treatments, indicating that these pathways may be crucial in low-light stress (Figure 9a, the significantly enriched GO path information in the figure is shown in Table S3). Focusing on the biological process analysis, the results showed that differential genes in treatment groups are enriched mainly in terms of carbon metabolism, organic matter metabolism, and other pathways after shading, relative to the control group.
We subjected the differential genes to KEGG enrichment analysis to understand the metabolic pathways and functions where DEGs were located between treatment groups (Figure 9b, the significantly enriched KEGG path information in the figure is shown in Table S4). The KEGG enrichment bubble plots illustrated that the differential genes are mainly enriched in some photosynthetic and organic acid metabolic pathways.
The results of GO and KEGG enrichment analyses demonstrated that the organic acid metabolism of sweet cherry fruits is produced differently depending on the shading treatment. In addition, the enrichment of carbon metabolism and photosynthetic metabolism pathways also indicated that shading might further influence the distribution of material metabolism by affecting plant photosynthesis and finally lead to changes in fruit quality.

3.8.4. Differential Gene Screening and Validation

Previous studies revealed that the content of glycolic acid in sweet cherry fruits changes significantly after the use of shade treatment (Figure 10a, The information of all genes in the figure is shown in Table S1.). Therefore, we focused on the changes of glycolic acid-related pathways and observed 25 differential genes in four pathways, namely, fructose and mannose metabolism, starch and sucrose metabolism, pyruvate metabolism, and glycolysis/gluconeogenesis. The results showed that the expression of most genes is suppressed, especially genes directly related to sugar synthesis conversion such as SORD and INV, after the shading treatment. These results are consistent with the accumulation of fruit sugars.
Real-time quantitative PCR showed that the trends of the transcriptome and RT-qPCR data are basically the same, thereby indicating that the transcriptome data are accurate and reliable (Figure 10b).

4. Discussion

The energy needed for photosynthesis is provided by light that facilitates assimilation, promotes stomatal opening, activates RuBisCo, and influences the development of the photosynthetic system. Studies have shown that leaves are organs that perceive environmental changes and can change the structure and function of photosynthetic organs with changes in light intensity; the photosynthetic performance of sweet cherry leaves with reduced light intensity will be greatly inhibited [20,21,22,23]. In the results of this experiment, Pn, Tr, and Gs were significantly lower in the shade group than in the control group, which was similar to previous results.
The chlorophyll fluorescence technique explores photosynthesis in plants. Compared with gas exchange parameters, chlorophyll fluorescence parameters can reflect the absorption, transfer, dissipation, and distribution of light energy by the photosystem [24]; moreover, the chlorophyll fluorescence technique can truly and accurately reveal the mechanism of the effect of shading on Pn in plant leaves [25]. The three destinations of light energy absorbed by plant leaves are (1) energy dissipated by antenna pigments in the form of heat energy (D), (2) energy involved in photochemical reactions (P), and (3) nonchemical reaction dissipation (Ex) is neither dissipated as thermal energy nor involved in photochemical reactions but can only be achieved with non-photochemical reactions such as photorespiration, the Mehler reaction, or electron transfer to oxygen to form singlet oxygen [26,27]. It was shown that Fv/Fm reflected the intrinsic light energy conversion efficiency of the PSII reaction center, and the variation of this parameter was minimal under non-stress conditions and was not affected by species and growth conditions, while it decreased significantly under stress conditions [28,29]. Fv/Fm reflects the inherent light energy conversion efficiency of PSII reaction centers and was significantly lower in the shaded group than that in the control group in this experiment. Therefore, the photoinhibition phenomenon may exceed the reversible deactivation range of the PSII reaction center and cause substantial damage to leaves, thereby weakening the normal photosynthesis of plants. Meanwhile, the shade treatment changed the distribution of absorbed light energy in sweet cherry leaves. The portion of absorbed light energy allocated to photochemical reactions in the shade group increased significantly, while that of antenna heat dissipation decreased significantly. This finding indicated that the shade treatment of sweet cherry leaves mainly allows additional light energy to be used for photochemical reactions by reducing the level of antenna heat dissipation and improves light energy utilization efficiency under low light to enhance the adaption to low light environment. In addition, antenna thermal dissipation, the second energy dissipation mechanism in sweet cherry leaves, is a regulatory energy dissipation mechanism compared with energy dissipation through non-photochemical reactions. This mechanism can mitigate the excessive reduction of PSII and electron transport chain as well as the damage of photosynthetic structure by non-chemical dissipation. Thus, the excess excitation energy in the reaction center is weakened and the degree of photoinhibition is reduced. The extent of photoinhibition is reduced by weakening the excess excitation energy in the reaction center. Note that shading significantly affects photosynthesis, and it serves as the building block for the production of carbohydrates in fruit trees. Carbohydrates also have an immediate impact on the growth, development, and flowering of fruit trees.
The process of fruit development and ripening involves a series of physiological and biochemical changes, including pigment accumulation, fruit softening, aroma and flavor substance formation, etc., which is also the process of fruit quality formation [30]. The ripening process is one of the important stages in the formation of commercial value, and changes in this stage include changes in fruit size, color, and intrinsic quality. The development of drupe fruits such as dates, plums, and sweet cherries follows a double S-shaped growth pattern [2]. Light is an indispensable environmental factor for plant growth and development; however, inadequate light conditions of plants during growth present a number of severe effects on plant physiology, metabolism, and development. Light affects the accumulation of pigments and consumers prefer fruits with attractive colors, with red being the most attractive color [31]. The results of the study showed that the single fruit weight, longitudinal and longitudinal warp, TSS, anthocyanin, and Vc of sweet cherry fruit increased continuously with fruit development, and their changing stages occurred mainly after the color transition period [18], while the results of the present study were consistent with the previous research results.
The type, concentration, and dynamics of sugars and acids in fruits are the important basis of fruit quality formation [32,33]. The results of this study showed that the low light environment may affect the microenvironment of fruit growth, resulting in changes in sugar and organic acid concentration. The results of the shading of grape fruit showed that an appropriate reduction in light intensity (80% light transmission) did not significantly affect soluble solids (TSS) and titratable acids (TA) in the fruit [34], while the study on the fruit of sweet cherry plants that had been grown in the environment of rain-sheltered cultivation facilities found that TSS could increase or decrease depending on the plant variety or the type of rain-sheltered facility [35,36]. In the present study, TSS, anthocyanin, and Vc decreased significantly during the ripening period, which was consistent with previous results. Throughout sweet cherry fruit development, glucose concentration was highest and sucrose concentration was minimal and relatively insignificantly varied. The total sugar, glucose, and fructose concentrations of the control fruit were higher than those of the shade group during the ripening period. The organic acid concentration of sweet cherry fruit was mainly malic acid, which accounted for 93.65% of the total acid concentration at maturity, while the concentration of other organic acids was very low, which showed that the main organic acid determining the flavor of sweet cherry fruit was malic acid; during the fruit development period, malic acid concentration was the highest and showed an overall increasing trend, while the concentration of other acids was very little and the changes were relatively insignificant. The malic and total acid concentrations of the control fruit were lower than those of the shade group during the ripening period, and the higher sugar concentration and lower organic acid concentration determined the flavor advantage of the control group compared with the shade group.
Sugar is a very important carbohydrate in plants and is typically synthesized in the form of sucrose in source leaves, transported to depot tissues, and converted into sucrose, glucose, and fructose through the action of sucrose-metabolizing enzymes for the regulation of material and energy metabolism in cells and continued metabolism and growth [37]. Although the sucrose concentration in sweet cherry is very low, sucrose metabolism plays an important role in sugar metabolism and sucrose metabolism-related enzymes regulate the accumulation of sucrose. Sucrose metabolism-related enzymes are divided into two major groups: sucrose synthases (including SS and SPS), which regulate sucrose synthesis, and sucrose catabolic enzymes (including SS-I, AI, and NI), which regulate reducing sugar synthesis [38]. Changes in reducing sugar concentration were unclear in the early stage of sweet cherry fruit development (S1–S4) when the activities of sucrose synthesis enzymes (SS and SPS) gradually increased, during which reducing sugar may be synthesized into sucrose to participate in the vital metabolic process. Activities of sweet cherry sucrose catabolic enzymes (SS-I, AI, and NI) began to increase from the S5 period, and reducing sugar accumulated rapidly in the fruit while the activity of SS and SPS gradually decreased. The flesh tissue grew rapidly, the fruit expanded, and metabolism accelerated after the fruit entered the color-change stage. The fruit needed other carbon sources for growth and development, and the highly active acidic translocase could provide additional hexose as energy to promote fruit development in this stage. The results showed that the activity of sps enzymes in shaded apple fruit was only half of that in light conditions and shading also had significant effects on other enzymes [39]. In this study, the activities of sucrose catabolic enzymes (SS-I, AI and NI) were significantly higher in the control group than in the shade group during the ripening period, and the activities of sucrose synthase enzymes (SS and SPS) did not differ significantly between the two treatments during the ripening period, which is inconsistent with the above findings, probably due to the different concentrations of sugar components in the fruits of different varieties, resulting in inconsistent changes in enzyme activities during sugar accumulation. The activities of sucrose catabolic enzymes were higher in the control group than in the shade group in this study, so they promoted the accumulation of fructose and glucose in the control group, which is consistent with the significantly higher glucose and fructose concentration in the control group than in the shade group.
The accumulation of sugar and acid concentration during fruit development determines the flavor of the fruit. The organic acid concentration is significantly correlated with fruit acidity and is important not only in balancing fruit flavor but also for fruit photosynthesis, respiration, and other vital metabolic processes [40]. Although high organic acid concentration results in poor fruit flavor, it is crucial for the growth and development of fruits. Moreover, enzymes involved in the metabolism of organic acids control the buildup of organic acids. Generally speaking, malate dehydrogenase (NAD-MDH), malic enzyme (NADP-ME), and phosphoenolpyruvate carboxylase are the enzymes that control malic acid metabolism (PEPC). All three together regulate the synthesis of malic acid. In this study, the variation trend of NAD-MDH, NADP-ME, and malic acid concentration is approximately the same, and the difference in malic acid accumulation in sweet cherry is mainly related to the level of the two enzyme activities. The gradual decrease in PEPC activity may be the reason for the slow accumulation of malic acid in the later stage. The increase in malic acid concentration of sweet cherry fruit after entering the color transition period is related to the rapid increase in NAD-MDH activity. The increase in NADP-ME activity causes malic acid to begin to decompose, resulting in a slow increase in malic acid concentration. The enzyme activities of malic acid synthesis in the control group, NADP-ME, and PEPC, are lower than those in the shading group, while the enzyme activities of decomposition, NADP-ME, are higher than those in the shading group, which may lead to a lower accumulation of malic acid in the control group than in the shading group. The results are consistent with the results of NAD-MDH and PEPC regulating malic acid synthesis and NADP-ME regulating malic acid decomposition in peach fruit [41]. During the different stages of sweet cherry fruit development, the accumulation of organic acids may be the result of the interaction of various acid metabolism enzymes and, by affecting the accumulation of organic acids in the fruit, thereby affect the flavor of the fruit and determining the quality of the fruit.
The regulation of sugar and acid accumulation in sweet cherry is associated not only with the aforementioned enzymes but also related enzyme genes. The regulation of enzyme activity by key enzyme genes affects the flavor of the fruit. Among them, the SORD gene of the fructose and mannose metabolism pathway mainly acts on the interconversion of D-fructose and sorbitol and is inhibited by shading, thereby reducing the interconversion of sugars and negatively affecting the fruit sugar content. The ostB2 gene of the starch and sucrose metabolism pathway promoted the conversion of alglucose-6p to alglucan, thereby advancing the synthesis of glucose; meanwhile, the promotion of the expression of this gene by shading promoted the synthesis of alglucan and increased fruit stress tolerance. The E3.2.1.21 gene acts as the last key step in glucose synthesis, and shading reduced the expression of this gene and inhibited glucose synthesis. In addition, the expression of four INV genes inhibited by shade treatment suppressed sucrose-to-glucose and fructose conversion pathways and reduced the glucose and fructose content.

5. Conclusions

Shading significantly reduced the quality of sweet cherry fruit and reduced the accumulation of nutrients in the fruit by directly affecting the growth and development of leaves. Shading significantly reduced the fruit weight, sugar content, and vitamin C content at maturity and significantly increased the acid content. Low light stress produces a large number of differential genes related to carbon metabolism, organic acid metabolism, and stress resistance, thereby suggesting that low light stress may affect the expression of these related genes and inclusions in the fruit. This study illustrated that fruit physiological quality is damaged to different degrees under 30% shade stress; therefore, moderate shade treatment (shade rate less than 30%) is recommended in sweet cherry cultivation and management practices to produce excellent fruit. Transcriptome data provide theoretical and technical support for the mechanism of the low-light-tolerant physiological response of sweet cherry and the selection and breeding of low-light-tolerant sweet cherry varieties.

Supplementary Materials

The following supporting information can be downloaded at: https://www.mdpi.com/article/10.3390/horticulturae9060654/s1, Table S1: Genetic information; Table S2: qPCR sequence of differential genes in sweet cherry fruit; Table S3: Significantly enriched GO pathway information; Table S4: Summary of significantly enriched KEGG pathway information; Table S5: Summary of transcriptome sequencing.

Author Contributions

Project and experiment design, R.G., C.C. and W.T.; experiment execution, C.C. and W.T.; data analysis, W.T.; writing, W.T. and C.C.; review, Y.Z., Y.C. (Yiling Cui) and Y.C. (Yuanqi Chu); project management, Y.Z., G.K., W.Y., H.S. and H.C.; funding acquisition, R.G. All authors have read and agreed to the published version of the manuscript.

Funding

This research was funded by the Sichuan Science and Technology Plan Project (Key R&D Project) (2021YFN0081, 2021YFN0082).

Institutional Review Board Statement

Not applicable.

Informed Consent Statement

Not applicable.

Data Availability Statement

Data on the results of this study are available from the corresponding author.

Conflicts of Interest

The authors declare no conflict of interest.

References

  1. Acero, N.; Gradillas, A.; Beltran, M.; García, A.; Mingarro, D.M. Comparison of phenolic compounds profile and antioxidant properties of different sweet cherry (Prunus avium L.) varieties. Food Chem. 2019, 279, 260–271. [Google Scholar] [CrossRef] [PubMed]
  2. Valero, D.; Serrano, M. Growth and ripening stage at harvest modulates postharvest quality and bioactive compounds with antioxidant activity. Stewart Postharvest Rev. 2013, 3, 5. [Google Scholar]
  3. Di, M.; Russo, R.; Graziani, G.; Ritieni, A.; Di, V.C. Characterization of autochthonous sweet cherry cultivars (Prunus avium L.) of southern Italy for fruit quality, bioactive compounds and antioxidant activity. J. Sci. Food Agric. 2017, 97, 2782–2794. [Google Scholar]
  4. Muccillo, L.; Colantuoni, V.; Sciarrillo, R.; Baiamonte, G.; Salerno, G.; Marziano, M.; Sabatino, L.; Guarino, C. Molecular and environmental analysis of campania (Italy) sweet cherry (Prunus avium L.) Cultivars for biocultural refugia identification and conservation. Sci. Rep. 2019, 9, 6796. [Google Scholar] [CrossRef] [PubMed]
  5. Ozkan, Y.; Yıldız, K.; KüçÜker, E.; Çekic, C.; Özgen, M.; Akça, Y. Early performance of cv. Jonagold apple on m.9 in five tree training systems. Hortic. Sci. 2012, 39, 158–163. [Google Scholar] [CrossRef]
  6. Yan, W.; Long, L.E. Physiological and biochemical changes relating to postharvest splitting of sweet cherries affected by calcium application in hydrocooling water. Food Chem. 2015, 181, 241–247. [Google Scholar]
  7. Aikio, S.; Taulavuori, K.; Hurskainen, S.; Taulavuori, E.; Tuomi, J. Contributions of day length, temperature and individual variability on the rate and timing of leaf senescence in the common lilac syringa vulgaris. Tree Physiol. 2019, 39, 961–970. [Google Scholar] [CrossRef]
  8. Overbeck, V.; Schmitz, M.; Tartachnyk, I.; Blanke, M. Identification of light availability in different sweet cherry orchards under cover by using non-destructive measurements with a dualex™. Eur. J. Agron. 2017, 93, 50–56. [Google Scholar] [CrossRef]
  9. Wang, L.F. Physiological and molecular responses to variation of light intensity in rubber tree (Hevea brasiliensis Muell. Arg.). PLoS ONE 2014, 9, e89514. [Google Scholar] [CrossRef]
  10. Echer, F.R.; Rosolem, C.A. Cotton yield and fiber quality affected by row spacing and shading at different growth stages. Eur. J. Agron. 2015, 65, 18–26. [Google Scholar] [CrossRef]
  11. Overbeck, V.; Schmitz, M.; Blanke, M. Targeted forcing improves quality, nutritional and health value of sweet cherry fruit. J. Sci. Food Agric. 2017, 97, 3649–3655. [Google Scholar] [CrossRef] [PubMed]
  12. Szalai, G.; Majláth, I.; Pál, M.; Gondor, O.K.; Rudnóy, S.; Oláh, C.; Vanková, R.; Kalapos, B.; Janda, T. Janus-faced nature of light in the cold acclimation processes of maize. Front. Plant Sci. 2018, 9, 850. [Google Scholar] [CrossRef] [PubMed]
  13. Sekhar, S.; Panda, D.; Kumar, J.; Mohanty, N.; Biswal, M.; Baig, M.J.; Kumar, A.; Umakanta, N.; Samantaray, S.; Pradhan, S.K.; et al. Comparative transcriptome profiling of low light tolerant and sensitive rice varieties induced by low light stress at active tillering stage. Sci. Rep. 2019, 9, 5753. [Google Scholar] [CrossRef]
  14. Liu, Q.H.; Wu, X.; Chen, B.; Ma, J.; Gao, J. Effects of low light on agronomic and physiological characteristics of rice including grain yield and quality. Rice Sci. 2014, 21, 243–251. [Google Scholar] [CrossRef]
  15. Tian, T.; Qiao, G.; Deng, B.; Wen, Z.; Hong, Y.; Wen, X. The effects of rain shelter coverings on the vegetative growth and fruit characteristics of chinese cherry (Prunus pseudocerasus L.). Sci. Hortic. 2019, 254, 228–235. [Google Scholar] [CrossRef]
  16. Harrison, W.G.; Platt, T. Photosynthesis-irradiance relationships in polar and temperate phytoplankton populations. Polar Biol. 1986, 5, 153–164. [Google Scholar] [CrossRef]
  17. Demmig-Adams, B.; Adams, W.W., III; Barker, D.H.; Logan, B.A.; Bowling, D.R.; Verhoeven, A.S. Using chlorophyll fluorescence to assess the fraction of absorbed light allocated to thermal energy dissipation of excess excitation. Physiol. Plant. 1996, 98, 253–264. [Google Scholar] [CrossRef]
  18. Chen, C.; Chen, H.; Yang, W.; Li, J.; Tang, W.; Gong, R. Transcriptomic and Metabolomic Analysis of Quality Changes during Sweet Cherry Fruit Development and Mining of Related Genes. Int. J. Mol. Sci. 2022, 23, 7402. [Google Scholar] [CrossRef]
  19. Li, M.; Li, J.; Zhang, R.; Lin, Y.; Xiong, A.; Tan, G.; Luo, Y.; Zhang, Y.; Chen, Q.; Wang, Y.; et al. Combined analysis of the metabolome and transcriptome to explore heat stress responses and adaptation mechanisms in celery (Apium graveolens L.). Int. J. Mol. Sci. 2022, 23, 3367. [Google Scholar] [CrossRef]
  20. Matsubara, S.; Krause, G.H.; Seltmann, M.; Virgo, A.; Kursar, T.A.; Jahns, P.; Winter, K. Lutein epoxide cycle, light harvesting and photoprotection in species of the tropical tree genus Inga. Plant Cell Environ. 2008, 31, 548–561. [Google Scholar] [CrossRef]
  21. Lü, J.H.; Wang, X.; Feng, Y.M.; Li, Y.F.; Zhao, H.X.; Wang, Y. Effects of shading on the photosynthetic characteristics and anatomical structure of Trolliu schinensis Bunge. Acta Ecol. Sin. 2012, 32, 6033–6043. [Google Scholar]
  22. Hu, Y.; Chu, H.J.; Li, J.Q. Response of leaf anatomy characteristics and its plasticity to different soil-water conditions of Medicago ruthenica in four populations. Plant Sci. J. 2011, 29, 218–225. [Google Scholar]
  23. Chen, X.; Zhang, Q.; Zeng, S.M.; Chen, Y.; Guo, Y.Y.; Huang, X.Z. Rain-shelter cultivation affects fruit quality of pear, and the chemical properties and microbial diversity of rhizosphere soil. Can. J. Plant Sci. 2020, 100. [Google Scholar] [CrossRef]
  24. Genty, B.; Briantais, J.M.; Baker, N.R. The relationship between the quantum yield of photosynthetic electron transport and quenching of chlorophyll fluorescence. BBA-Gen. Subj. 1989, 990, 87–92. [Google Scholar] [CrossRef]
  25. Jiao, L.L.; Lu, B.S.; Zhou, R.J.; Bai, Z.Y.; Liang, H.Y.; Zhen, H.W. Effects of shading on net photosynthetic rate and chlorophyII fluorescence parameters of leaf in david maple (Acer davidii Franch). Acta Hortic. Sin. 2007, 34, 173–178. [Google Scholar]
  26. Busch, F.; Hüner Norman, P.A.; Ensminger, I. Biochemical constrains limit the potential of the photochemical reflectance index as a predictor of effective quantum efficiency of photosynthesis during the winter spring transition in Jack pine seedlings. Funct. Plant Biol. 2009, 36, 115–119. [Google Scholar] [CrossRef]
  27. Osório, M.L.; Osório, J.; Vieira, A.C.; Gonçalves, S.; Romano, A. Influence of enhanced temperature on photosynthesis, photooxidative damage, and antioxidant strategies in Ceratonia siliqua L. seedlings subjected to water deficit and rewatering. Photosynthetica 2011, 49, 3–12. [Google Scholar] [CrossRef]
  28. Zhang, S.R. A discussion on chlorophyll fluorescence kinetics parameters and their significance. Chin. Bull. Bot. 1999, 16, 444–448. [Google Scholar]
  29. Zhou, Y.H.; Hang, L.F.; Yu, J.Q. Effects of sustained chilling and low light on gas exchange, chlorophyll fluorescence quenching and absorbed light allocation in cucumber leaves. J. Plant Physiol. Mol. Biol. 2004, 30, 153–160. [Google Scholar]
  30. Chen, Z.; Deng, H.; Xiong, B.; Li, S.; Yang, L.; Yang, Y.; Huang, S.; Tan, L.; Sun, G.; Wang, Z. Rootstock Effects on Anthocyanin Accumulation and Associated Biosynthetic Gene Expression and Enzyme Activity during Fruit Development and Ripening of Blood Oranges. Agriculture 2022, 12, 342. [Google Scholar] [CrossRef]
  31. Morales, J.; Tárrega, A.; Salvador, A.; Navarro, P.; Besada, C. Impact of ethylene degreening treatment on sensory properties and consumer response to citrus fruits. Food Res. Int. 2020, 127, 108641. [Google Scholar] [CrossRef]
  32. Pangborn, R.M. Relative taste intensities of selected sugars and organic acids. J. Food Sci. 2006, 28, 726–733. [Google Scholar] [CrossRef]
  33. Lamikanra, O.; Inyang, I.D.; Leong, S. Distribution and effect of grape maturity on organic acid content of red muscadine grapes. J. Agric. Food Chem. 1995, 43, 3026–3028. [Google Scholar] [CrossRef]
  34. Qian, Z.; Xi, X.J.; Yani, H.E.; Jiang, A.L. Bagging affecting sugar and anthocyanin metabolism in the ripening period of grape berries. Not. Bot. Horti Agrobot. 2019, 47, 1194–1205. [Google Scholar]
  35. Suran, P.; Vavra, R.; Jonas, M.; Zeleny, L.; Skrivanova, A. Effect of rain protective covering of sweet cherry orchard on fruit quality and cracking. Acta Hortic. 2019, 1235, 189–195. [Google Scholar] [CrossRef]
  36. Børve, J.; Skaar, E.; Sekse, L.; Meland, M.; Vangdal, E. Rain protective covering of sweet cherry trees-effects of different covering methods on fruit quality and microclimate. Horttechnology 2003, 13, 143–148. [Google Scholar] [CrossRef]
  37. Menon, S.V.; Rao TV, R. Health—Promoting components and related enzyme activities of muskmelon fruit during its development and ripening. J. Food Biochem. 2014, 38, 415–423. [Google Scholar] [CrossRef]
  38. Xie, Z.S.; Li, B.; Forney, C.F.; Xu, W.; Wang, S. Changes in sugar content and relative enzyme activity in grape berry in response to root restriction. Sci. Hortic. 2009, 123, 39–45. [Google Scholar] [CrossRef]
  39. Klages, K. Diurnal changes in non-structural carbohydrates in leaves, phloem exudates and fruit in ‘Braeburn’ apple. Funct. Plant Biol. 2001, 28, 131–139. [Google Scholar] [CrossRef]
  40. Ali, K.; Maltese, F.; Choi, Y.H.; Verpoorte, R. Metabolic constituents of grapevine and grape-derived products. Phytochem. Rev. 2010, 9, 357–378. [Google Scholar] [CrossRef]
  41. Okamoto, G.; Fujii, Y.; Shimamura, K. Effect of levels of fertilizer application on tree growth and fruit quality of peach trees on Prunus tomentasa. Environ. Control. Biol. 2010, 27, 83–87. [Google Scholar] [CrossRef]
Figure 1. (a) Leaf phenotype map. (b) Phenotypic diagram of sweet cherry fruits during development. (CK indicates no shading (Control) and A indicates 30% Shading, as below). S1 means 5 days after flowering, S2 means 9 days after flowering, S3 means 13 days after flowering, S4 means 17 days after flowering, S5 means 21 days after flowering, S6 means 25 days after flowering, S7 means 29 days after flowering, S8 means 33 days after flowering, S9 means 37 days after flowering, S10 means 41 days after flowers, S11 means 45 days after flowers, S12 means 49 days after flowers.
Horticulturae 09 00654 g001
Figure 2. (a) Leaf SPAD values. (b) Correlation coefficients between gas exchange parameters. * indicates significant correlation at the 0.05 level and ** indicates highly significant correlation at the 0.01 level. Vertical bars indicate the standard deviation of the mean.
Horticulturae 09 00654 g002
Figure 3. Dynamics of physical properties during fruit development and ripening under low-light stress. (a) Fruit weight. (b) Longitudinal diameter. (c) Transverse diameter. (d) Fruit shape index. * indicates significant correlation at the 0.05 level and ** indicates highly significant correlation at the 0.01 level. Vertical bars indicate the standard deviation of the mean. ns indicates that the difference is not significant.
Horticulturae 09 00654 g003
Figure 4. Changes in intrinsic quality dynamics during fruit development under low-light stress. (a) Changes in fruit hardness. (b) Changes in fruit soluble solids. (c) Changes in fruit anthocyanins. (d) Changes in fruit vitamins. (e) Changes in trehalose. * indicates significant correlation at the 0.05 level and ** indicates highly significant correlation at the 0.01 level. Vertical bars indicate the standard deviation of the mean. ns indicates that the difference is not significant.
Horticulturae 09 00654 g004
Figure 5. Dynamics of total sugars and acids and their components during the development and ripening of sweet cherry fruits under low-light stress. (a) Dynamics of total sugar content. (b) Dynamics of total acids. (c) Dynamics of glucose. (d) Dynamics of fructose. (e) Dynamics of sucrose. (f) Dynamics of malic acid. (g) Dynamics of citric acid. (h) Dynamics of quinic acid. * indicates significant correlation at the 0.05 level and ** indicates highly significant correlation at the 0.01 level. Vertical bars indicate the standard deviation of the mean. ns indicates that the difference is not significant.
Horticulturae 09 00654 g005
Figure 6. Dynamics of enzyme activities related to sugar and acid metabolism in sweet cherry fruit during development and ripening under low-light stress. (a) AI. (b) NI. (c) SPS. (d) SS. (e) SS-I. (f) PEPC. (g) NADP-ME. (h) NAD-MDH. * indicates significant correlation at the 0.05 level and ** indicates highly significant correlation at the 0.01 level. Vertical bars indicate the standard deviation of the mean. ns indicates that the difference is not significant.
Horticulturae 09 00654 g006
Figure 7. Correlation between sugar-acid content and enzyme activities related to sugar-acid metabolism: (a) Correlation between total sugar content and enzyme activities related to sugar metabolism in A treatment. (b) Correlation between total sugar content and enzyme activities related to sugar metabolism in CK treatment. (c) Correlation between organic acid content and enzyme activities related to acid metabolism in A treatment. (d) Correlation between organic acid content and enzyme activities related to acid metabolism in CK treatment. * indicates significant correlation at the 0.05 level and ** indicates highly significant correlation at the 0.01 level. ns indicates that the difference is not significant.
Horticulturae 09 00654 g007
Figure 8. Transcriptome analysis. (a) Principal component analysis of gene expression under low-light stress. (b) Sample correlation analysis. (c) Number of DEGs compared under low-light stress; the number of up- and down-regulated genes are represented by bars. (d) Volcano plot of differential genes. (e) DEG hierarchical clustering of samples.
Horticulturae 09 00654 g008
Figure 9. GO and KEGG enrichment analyses. (a) Comparison of GO enrichment analysis of DEGs between groups. The graph shows the p-values of the top 10 enrichment items (≤0.05) with extreme significance and the values of p-values are shown in the bar graph. (BP): biological processes; (MF): molecular functions; (CC): cellular components. (b) Comparison of KEGG enrichment analysis of DEGs between groups.
Horticulturae 09 00654 g009
Figure 10. Gene expression and qRT-PCR verification analysis. (a) Analysis of gene expression patterns. (b) qRT-PCR analysis of 9 differential genes. Among them, asterisks indicate genes that are more associated with sugar and acid content in sweet cherries.
Horticulturae 09 00654 g010
Table 1. Effect of low-light stress on gas exchange parameters of ‘Hong deng’ sweet cherry leaves.
Treatment(Pn)/(µmol·m−2·s−1)(Tr)/(mol·m−2·s−1) (Gs)/(mol·m−2·s−1)(Ci)/(µmol·mol−1)
CK11.1 ± 0.062 a0.001 ± 0.001 a0.140 ± 0.002 a244 ± 2.31 a
A10.2 ± 0.171 b0.001 ± 0.001 b0.126 ± 0.002 b247 ± 3.88 a
Note: Lowercase letters indicate significant difference (p < 0.05).
Table 2. Effect of low-light stress on chlorophyll fluorescence parameters of ‘Hong deng’ sweet cherry leaves.
TreatmentFv/FmΦPSIIETRNPQqP
CK0.808 ± 0.003 a0.466 ± 0.000 a134± 0.115 a1.19 ± 0.001 a0.740 ± 0.003 a
A0.795 ± 0.005 b0.495 ± 0.001 b117 ± 0.253 b0.909 ± 0.010 b0.792 ± 0.002 b
Note: Lowercase letters indicate significant difference (p < 0.05).
Table 3. Effect of low-light stress on light energy allocation in ‘Hong deng’ sweet cherry leaves.
TreatmentAntenna Thermal
Dissipation (D)
Photochemical Reaction
Dissipation(P)
Non-Photochemical Reaction
Dissipation (Ex)
CK42.9 ± 0.291 a42.3 ± 0.098 a14.9 ± 0.263 a
A34.3 ± 0.115 b52.1 ± 0.103 b13.6 ± 0.107 b
Note: Lowercase letters indicate significant difference (p < 0.05).
Disclaimer/Publisher’s Note: The statements, opinions and data contained in all publications are solely those of the individual author(s) and contributor(s) and not of MDPI and/or the editor(s). MDPI and/or the editor(s) disclaim responsibility for any injury to people or property resulting from any ideas, methods, instructions or products referred to in the content.

