Article

Medium/Long-Term Efficiency of Struvite for Lettuce (Lactuca sativa L.) Production: Effect on Soil Quality

IMIDRA (Madrid Institute for Rural, Agricultural and Food Research), Finca “El Encín”, A-2, km 38, 5, 28805 Alcalá de Henares, Spain
*
Author to whom correspondence should be addressed.
Horticulturae 2023, 9(6), 645; https://doi.org/10.3390/horticulturae9060645
Submission received: 14 April 2023 / Revised: 25 May 2023 / Accepted: 27 May 2023 / Published: 30 May 2023
(This article belongs to the Special Issue The State of The Art of Horticulture Science in Spain)

Abstract

:
The global rise in population highlights the need for a greater production of quality food. In this regard, intensification of the agricultural sector and an increased use of fertilizers are key. Phosphorus (P), together with nitrogen (N) and potassium (K), is one of the essential elements for plant growth. Modern agriculture is dependent on P derived from phosphate rock, which is a non-renewable resource whose high-quality reserves are becoming increasingly scarce and expensive. In this context, alternative sources of P and the development of new recovery technologies are required. Such technologies are increasingly focused on struvite (MgNH4PO4·6H2O) (STR) from urban or livestock wastewater, whose accessibility is guaranteed. In this study, the medium–long term efficiency of STR from urban wastewater as a fertilizer was evaluated in three successive lettuce crops using a 25 kg pot trial. To this end, STR application was compared with the use of other conventional P fertilizers (NPK, monoammonium phosphate (MAP), and single superphosphate (SSP)) at a dose of 100 kg P ha−1. Crop biomass yield, P uptake, and the nutritional quality of the plants were determined. Moreover, the effect of STR on soil quality was examined using several soil biological indicators. In general, the STR treatment yielded similar biomass results to those obtained with NPK in the three successive lettuce crops. MAP and SSP treatments produced higher biomass in the first crop, but these values diminished in the next two. In relation to the effect on soil, STR treatment maintained the concentration of available P during the three growing cycles and enhanced microbial activity and functional diversity. On the basis of our findings, STR emerges as a sustainable P-fertilization strategy for lettuce production.

1. Introduction

The global increase in population highlights the need for a greater production of quality food. In this regard, intensification of the agricultural sector is key. The United Nations (UN) forecasts that the world population will reach 9.8 billion people by 2050 [1]. This figure will undoubtedly bring about increased pressure on the agricultural sector and, consequently, greater demand for fertilizers. Thus, world crop production could increase by 50% to 69% over the 2010–2050 period [2]. Other authors even predict a 100–110% increase in global crop demand in the same period [3]. Fertilizers are essential to guarantee agricultural production. In this regard, phosphorus (P), together with nitrogen (N) and potassium (K), is one of the essential elements for plant growth. P is a structural component of phospholipids, nucleic acids, nucleotides, coenzymes, and phosphoproteins. It participates in protein synthesis and facilitates cell division and the development of new tissues, thereby contributing to the transport, storage, and transfer of energy [4]. Mineral fertilization contributes significantly to crop production. However, its indiscriminate use has led to groundwater eutrophication issues as a result of the release of soluble P and nitrogen salts [5,6]. Moreover, the potential presence of heavy metals in mineral fertilizers may pose a risk of transfer to the food chain [7]. While the demand for fertilizer is expected to increase in the long term, the world’s main source of P (phosphate rock) is a non-renewable resource, and high-quality reserves are becoming increasingly scarce and costly [8]. In this regard, there is increasing global concern about the acquisition of P fertilizers and threats to future food security, especially in countries that do not have this type of reserve [9,10].
The European Union (EU) includes P and phosphates in the list of 27 critical raw materials that are essential for the production of a wide range of products and services for daily use. This list incentivizes the European production of critical raw materials through enhancing recovery, reuse, and recycling activities [11]. Regarding P and phosphate rock, this document points to China as the main producer (74% and 48%, respectively). However, in relation to the EU, Kazakhstan is the largest supplier of P (71%), while Morocco provides the most phosphate rock (24%). P extraction has significantly decreased the natural rock resources of this mineral [12,13]. At the current rate of extraction, global reserves may be depleted within 50 to 100 years [14,15]. Ninety percent of global demand for P is for food production, and 79% of this is used to make agricultural fertilizers [16]. While other sources of P, such as bone meal, crop residues, and manure, can be used for agricultural purposes, they are insufficient. This scenario, therefore, calls for the development of new technologies for the sustainable recovery of P from other organic products. There are currently several technologies that could cover the need for P fertilizers for global food production. In addition, it must be taken into account that the European Commission has set a goal of a 30% reduction in non-renewable resources for fertilizer production [17]. P recovery is increasingly focused on the recovery of struvite (MgNH4PO4·6H2O) (STR) from urban or livestock wastewater. In this regard, several authors have addressed the role of urban wastewater as a potential alternative source of P to imported mineral fertilizers [18,19].
Access to wastewater is already guaranteed, and efforts to reduce P in effluents lowers the risk of eutrophication while simultaneously allowing P recovery and reuse [18,20,21]. For example, the EU Water Framework Directive [22] and the previous Directive 91/271/EEC [23], concerning urban wastewater treatment, require that potential pollutants be removed from wastewater before it is disposed of in surface water, thereby reducing the potential eutrophication of sensitive waters by limiting N and P inputs. In addition, the recovery of P during wastewater treatment, such as by precipitating STR under controlled conditions, enhances the maintenance of wastewater treatment plants by preventing unintentional crystalline formation, which can otherwise clog and damage the facilities [24]. Thus, the integration of such a recovery process as part of a wastewater management system would allow the cost-efficient removal of excess nutrients by closing the P loop in the soil–crop–animal–human–soil cycle [19]. These recovery techniques are within the framework of the New Circular Economy Action Plan of the EU, which provides for the development of an Integrated Nutrient Management Plan with a focus on ensuring a more sustainable application of nutrients and stimulating markets for recovered nutrients. The European Commission also considers reviewing directives on wastewater treatment and sewage sludge and enhancing methods for nutrient recovery [25].
Currently, European legislation [26] includes the salts of precipitated phosphate and derivatives of this compound as a category of component materials authorized in EU fertilizers with sewage sludge from municipal wastewater treatment plants being accepted as raw material for the production of these fertilizers.
Most studies indicate that the agronomic efficiency of STR is similar to that of phosphoric rock-derived and processed P fertilizers [27]. It has been proposed that STR has fertilizer properties [28,29,30,31]. Its most advantageous feature as a fertilizer is its low nutrient-releasing rate, which favors the slow assimilation of these nutrients in the soil solution [32]. The ammoniacal fraction of STR releases nitrate forms, which guarantees a prolonged supply of nutrients. This feature allows a direct and higher application dose of STR, exceeding that of conventional fertilizers without harming plant health [33,34,35]. However, the low N/P ratio of STR renders N insufficient for optimal plant growth. In the context of agriculture, given that the amount of N required is far higher than that of P, it is convenient to supplement soil with other N sources. In this regard, STR is applied mainly as a P fertilizer [28,36,37]. Studies carried out by Robles-Aguilar et al. (2019) [38] showed an increase in P use efficiency when STR was applied in combination with ammonium. This effect was not observed in the STR + nitrate mixture. STR recovered from a variety of organic waste products was shown to enhance the growth of ryegrass [39], lupin [40], lettuce [41,42,43], maize [44,45,46], Chinese cabbage [47], barley [48], and wheat [49,50]. A review by Li et al. (2019) [51] showed similar results for vegetable production when STR was applied. Recently, studies carried out in a hydroponic system demonstrated the potential of STR to supply P for urban agricultural practices [52].
In recent years, several studies have addressed the impact of STR application on soil microbial communities [48,53,54]. In this context, soil microorganisms play key roles in the turnover of organic matter, nutrient recycling, mineralization, and the enhancement of soil structure [55]. Biological indicators of soil health, especially those related to the activity, size, and diversity of soil microbial communities, are becoming increasingly used due to their sensitivity and capacity to provide information that integrates many environmental factors [56,57]. Soil microbial communities support 80–90% of biochemical reactions in soil, mostly through reactions catalyzed by enzymes related to the carbon (C), N, P, and sulfur (S) cycles [58], and are reported to be useful indicators of soil functional diversity [59,60]. Furthermore, analysis of the functional diversity of heterotrophic bacterial communities in soil through community-level physiological profiling (CLPP) with Biolog EcoPlatesTM has proved to be a robust and discriminative approach for land management purposes [61,62]. In this regard, to the best of our knowledge, there is no available literature on microbial function based on CLPP profiling in response to STR fertilization, and few studies have evaluated the impact of this phosphate mineral on soil enzyme activity [48].
The objective of this study was to evaluate the P slow-release properties of STR and its medium/long-term fertilizing capacity in three successive lettuce crops in comparison with other conventional P fertilizers. Moreover, soil biological indicators were examined to determine the effect of STR amendments on soil quality.

2. Materials and Methods

2.1. Experimental Design

A pot trial was carried out using Lactuca sativa L. (var. Maravilla de Verano, Batlle S.A., Lugano, Switzerland). The pots were filled with 25 kg of an agricultural clay–loam soil, the characteristics of which are shown in Table 1. Granular struvite (STR, Canal de Isabel II South Wastewater Treatment Plant in Madrid) application was compared with that of three commercial P fertilizers, granular NPK (Antonio Tarazona SL, Silla, Spain), powdered monoammonium phosphate (MAP, Yara Iberian SA, Madrid, Spain), and granular single superphosphate (SSP, Antonio Tarazona SL, Valencia, Spain), at a rate equivalent to 100 kg P ha−1 (equivalent to 229 kg P2O5 ha−1). The main physico-chemical characteristics of STR and the commercial P fertilizers are shown in Table 2. All treatments were mixed with soil five days before planting four commercial lettuce seedlings per pot. Four pots were used per treatment.
The pots were watered with tap water during each growing cycle (6 weeks). Three consecutive lettuce crops were grown (June–July 2018, September–October 2018, and June–July 2019). After each cycle, the crop yield, the nutritive composition of the plants, and the physico-chemical properties of the soil were evaluated.
Before harvest, a fresh leaf was used for chlorophyll determination; then, the lettuce plants were collected and dried (65 °C for 3–5 days until constant weight) to measure the dry matter yield (DMY). Moreover, the cumulative DMY was calculated as the total DMY across all three crops. Some lettuce leaves (30–50 g per pot) were frozen at −80 °C and, two days after, were lyophilized at −52 °C for 72 h in a freeze-dryer (VirTis BenchTop Pro with Omnitronics™—8L, Miami, FL, USA) and subsequently ground in an electric refrigerated mill (IKA Labortechnik A10, Staufen, Germany). The powder was stored in paper bags at −40 °C until analyses.

2.2. Plant Analysis

N content was determined with the Kjeldahl digestion method (FOSS Tecator—Kjeltec 8400). For Calcium (Ca), Magnesium (Mg), sodium (Na), Potassium (K), and P determination, dry material was digested following the method proposed by Zhao et al. (1994) [63]. Briefly, dried plant material was digested in a 4 mL glass vial with a mixture of HNO3 and HClO4 overnight at room temperature and then at 130 °C in a Techne Dri-Block DB-3D (Camlab, Cambridge, UK) for 2.5 h. After that, the vials were cooled, and the solutions were filtered (Whatman 541) and diluted to 25 mL with Milli-Q water. The concentrations of Ca, Mg, Na, and K were measured with flame atomic absorption spectrometry (FAAS) (AA240FS, Varian, Palo Alto, CA, USA), and P was measured with ICP–OES (Agilent 7500CE, Santa Clara, CA, USA).
Chlorophyll was extracted from fresh plant material with dimethylformamide (DMF) following Inskeep and Bloom (1985) [64]. Briefly, from each lettuce sample, 5 circles of 1 cm in diameter were cut, placed in glass tubes with 5 mL of DMF, and shaken for 24 h in darkness. Absorbance at 647 and 664.5 nm was then measured in a UV–vis spectrophotometer (Thermo Spectronic HEλIOS α, Waltham, MA, USA). Using these data, we calculated the concentration of chlorophyll, expressed in mg of total chlorophyll per m2 of leaf surface, using the formula
T o t a l   c h l o r o p h y l l   ( mg   L 1 ) = 17.90   A 647 + 8.08   A 664.5
Total phenolic compound content was determined with the Folin–Ciocalteu colorimetric method using gallic acid as the standard [65]. Briefly, 2 mL of 95% methanol was added to 10 mg of lyophilized lettuce, and the mix was incubated for 24 h at room temperature and in darkness. The extracts were then passed through 0.45 μm Teflon filters to remove solid residues. Next, 150 μL of the extract was added to 2 mL tubes and mixed with 375 μL of 10% Folin reagent. The tubes were then vortexed, and 1.2 mL of 0.7 M Na2CO3 was added. The mix was incubated in the dark for 90 min and centrifuged at 8960× g for 5 min in a microcentrifuge (Beckman Coulter Microfuge 22R, Brea, CA, USA). Subsequently, the absorbance of the supernatant was measured at 765 nm (Thermo Spectronic HEλIOS α). The concentration of total phenolic compounds was calculated from a calibration curve with different concentrations of gallic acid and expressed as mg of gallic acid equivalents per gram of lyophilized sample.

2.3. Phosphorus Uptake (PU) and Relative Agronomic Efficiency (RAE)

To compare plant responses to STR and common mineral P fertilizers, PU and RAE were determined.
PU (mg P kg−1 soil) by the lettuce shoots in each pot was calculated as
P U = D M Y × P c o n
where DMY is the lettuce DMY (g kg−1 soil), and Pcon is the corresponding shoot P concentration (mg g−1). Moreover, cumulative PU was calculated as the total PU in the three crops.
The RAE was expressed considering DMY and PU for each fertilizer following the method described by Huygens et al. (2019) [27]:
R A E D M Y = D M Y S T R / D M Y P   f e r t i l i z e r
R A E P U = P U S T R / P U P   f e r t i l i z e r
A RAE below 1 indicates that STR is a less effective fertilizer (DMY) or plant P source (PU) than the other P fertilizers, and vice versa.

2.4. Soil Physico-Chemical Analysis

After each of the three crop cycles, the main physico-chemical properties of the treated soils were studied. Soil from the pots was air dried and sieved (<2 mm) prior to analysis. Four samples per treatment were examined. The physico-chemical properties of the soil were determined according to official Spanish methodology [66]. In brief, organic matter was analyzed using the Walkley–Black method [67]; pH and electrical conductivity (EC) were measured in a 1:2.5 soil:water ratio; total N was quantified using the Kjeldahl method; available nutrients (Ca, K, Mg, Na) were extracted with 0.1 N ammonium acetate and quantified with FAAS (AA240FS, Varian). Available P was determined using the Olsen method [68]. The total metal concentrations (Cd, Cr, Cu, Ni, Pb, and Zn) in the soil samples (0.5 g) were quantified with FAAS after acid digestion with a mixture of 6 mL nitric acid (69% purity) and 2 mL of hydrochloric acid (37% purity) in a microwave reaction system (Multiwave Go., Walnut, CA, USA, Anton Paar GmbH, Graz, Austria).

2.5. Soil Biological Analysis

To determine the effect of STR application on biological soil quality indicators, at the end of the third crop, soil samples were taken from each pot at a depth of 10 cm. Samples from the same soil treatment were homogenized into composite samples. Samples were sieved (2 mm) and stored at 4 °C (within 1 week) until analysis of biological parameters (enzyme activity, substrate-induced respiration, and community-level physiological profiling (CLPP) analysis).

2.5.1. Enzyme Activity

We analyzed the potential activity of soil enzymes involved in the C, N, P, and S cycles. To this end, we determined the following: β-glucosidase (EC 3.2.1.21) activity and β-galactosidase (EC 3.2.1.23) activity for the C cycle; urease activity (EC 3.5.1.5) for the N cycle; and alkaline activity and acid phosphatase activity (EC 3.1.3.1 and EC 3.1.3.2) for the P cycle. For the S cycle, arylsulfatase activity (EC 3.1.6.1) was assessed. The activity of these enzymes was measured using colorimetric substrates in 96-well plates following the ISO 20130:2018 methodology. In brief, each composite sample was divided into three subsamples, and three replicates of each subsample were analyzed for the six enzymes. Moreover, substrate-free controls were added for each sample. Absorbance was measured on a Multiskan FC Microplate Photometer. Soil enzyme activity was expressed as nmol of p-nitrophenol or ammonium chloride released per minute and gram of dry soil.

2.5.2. Substrate-Induced Respiration (SIR)

Glucose-induced soil respiration was determined on triplicates of 15 g composite soil samples. Dried samples were rewetted to 60% of water holding capacity and then pre-incubated at 22 °C for 72 h to guarantee a sufficient and standardized water supply for microorganisms (ISO-17155, 2001). Glucose was added to each replicate, and SIR was recorded by monitoring the CO2 production for 24 h at 28 °C using the µ-Trac 4200 system (SY-LAB, Neupurkersdorf, Austria) based on the variation of conductivity of a KOH 0.2% water solution.

2.5.3. Community-Level Physiological Profiling (CLPP) Analysis

The community-level physiological profiles were determined with the Biolog EcoPlatesTM method (Biolog Inc., Hayward, CA, USA) that contain three replications of 31 distinct C sources and control wells. The plates were inoculated with a diluted soil suspension at a cell density of approximately 1 × 10⁴ cells mL−1. They were then incubated at 28 °C in the dark, and subsequent color development was measured every 12 h for 5 d (595 nm) using a Multiskan FC Microplate Photometer. Average well color development (AWCD) was determined by calculating the mean absorbance of each well at each reading time. The measures corresponding to a 96 h incubation were chosen for further calculations. The Shannon diversity index (H′) was calculated as a means of evaluating microbial community diversity using the equation
H =   p i ( l n p i )
where p i is the ratio of the corrected absorbance value of each well to the sum of the absorbance of all wells.

2.6. Statistical Analysis

One-way ANOVA tests followed by a post hoc Duncan test at p < 0.05 were assessed using IBM SPSS Statistics for Windows, version 19.0 (Chicago, IL, USA). Pairwise comparisons were used to detect significant differences among P-based treatments in soil physico-chemical properties, plant measurements, and soil biological indicators. Correlation analysis using Pearson’s method was performed with PAST-3.17 software.

3. Results

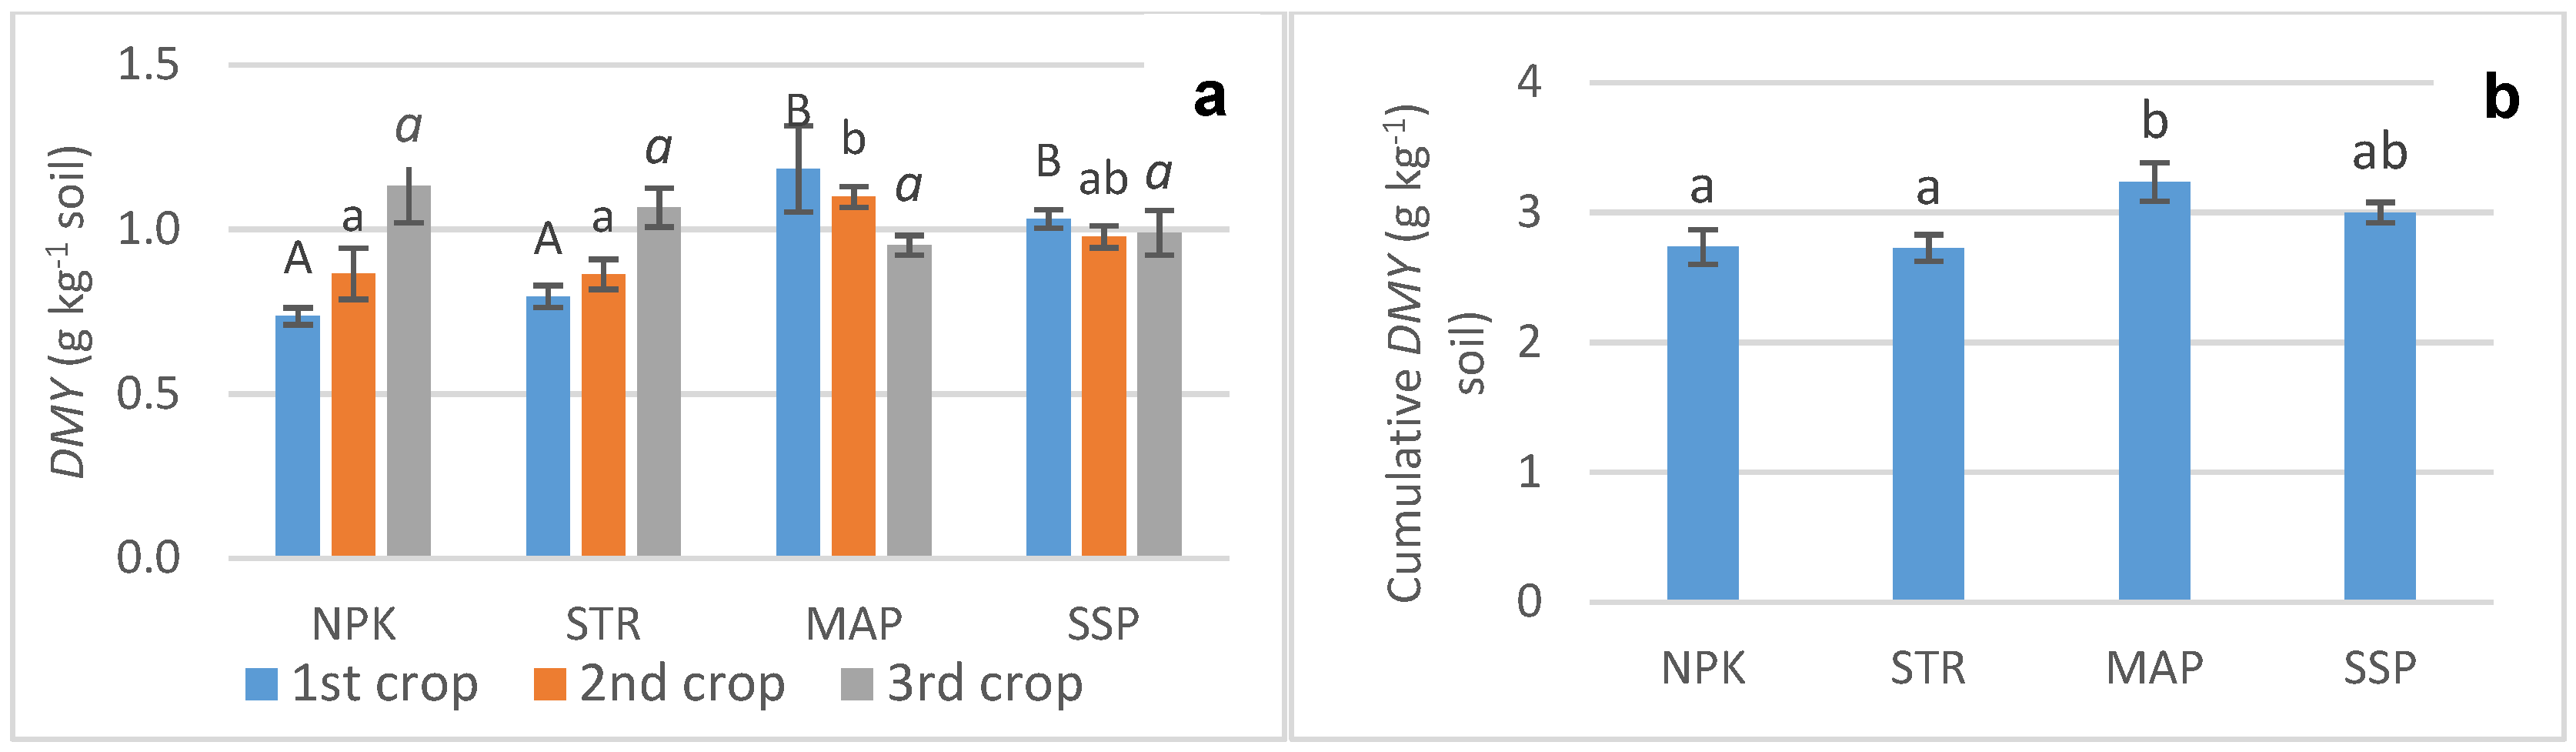
3.1. Biomass Production (DMY)
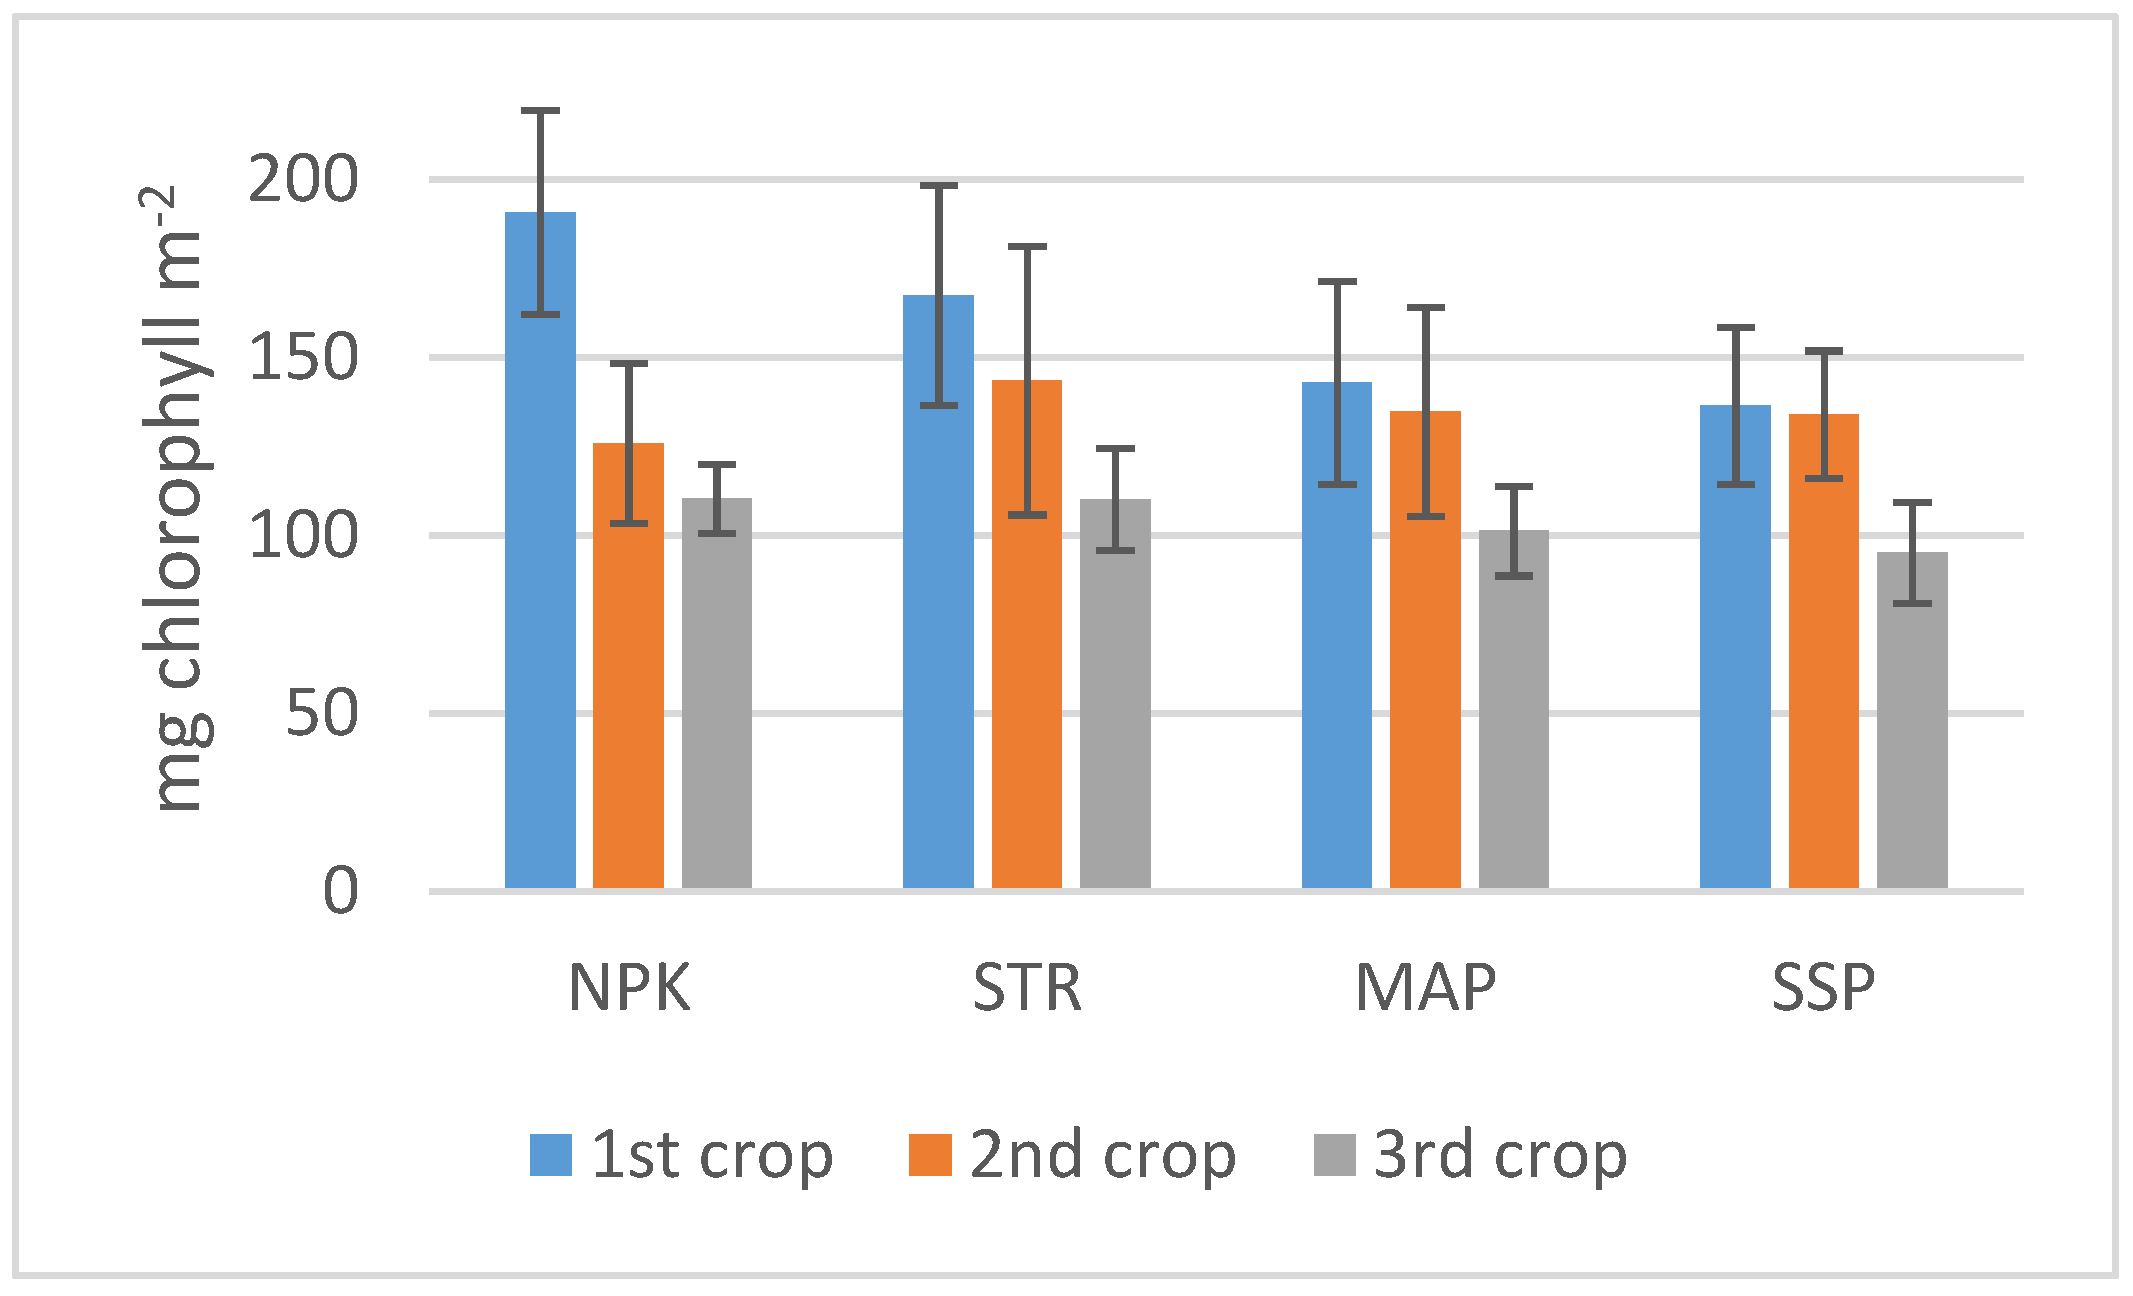
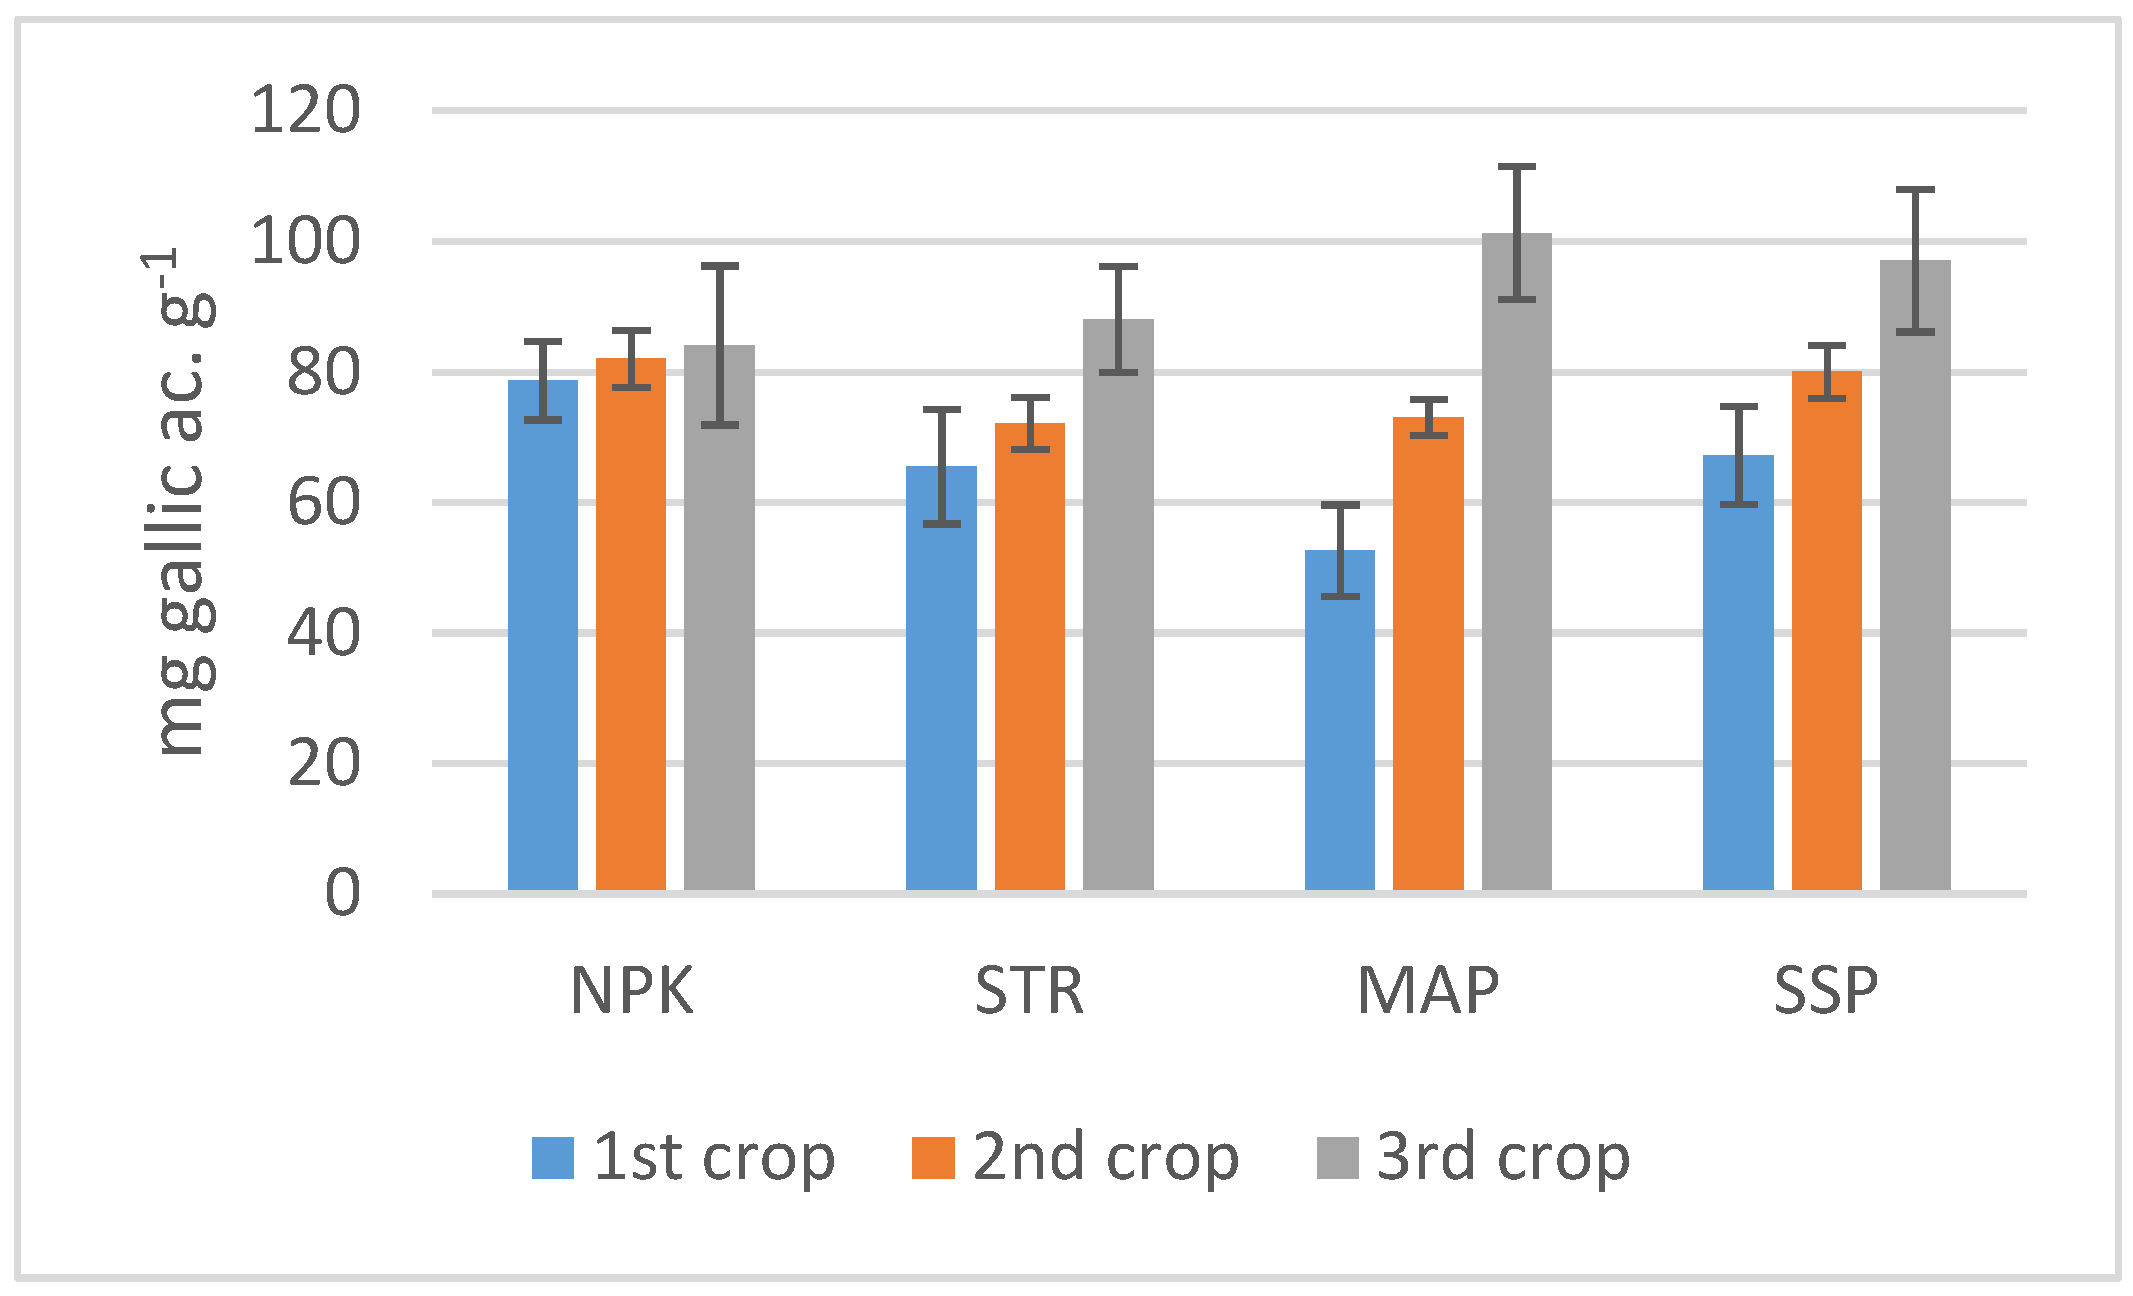
In the STR-treated soil, the DMY of the lettuce increased progressively throughout the three crop cycles (Figure 1a). The values in each crop were similar to those observed using the complex fertilizer NPK. In the case of the SSP and mainly for the MAP treatments, the DMY was significantly higher than for the STR treatment in the first crop, and it decreased in subsequent crops to similar values. In the third crop, the DMY for the SSP- and MAP-treated soils was even slightly lower than that achieved with STR. Considering all three crops together, the cumulative DMY obtained with STR was similar to that obtained with NPK and SSP and was only significantly surpassed by MAP (Figure 1b).

3.2. Plant Analysis

Chlorophyll data measured with SPAD are shown in Figure 2. All values were between approximately 100 and 200 mg m−2. Despite the high variability of the measurements, the highest values were observed in the first crop and the lowest ones in the third. No significant differences were observed between the different treatments.
No significant differences in phenolic compound content between the crops were observed in the NPK treatment. In the STR treatment, the highest values were observed in the third crop, whereas for MAP and SSP, this parameter increased in consecutive crops (Figure 3). However, given the high variability of the measurements, no significant differences were observed between the treatments in the third crop. In general, no significant differences were observed in the concentration of Ca, Mg, Na, or K in the lettuce between the treatments except in Mg content in the first crop (Table 3).
Regarding the N content, no significant differences in each crop were observed between the treatments. The higher values in the lettuce leaves were observed in the second crop (Table 3). P values showed a similar trend to that observed for DMY. The highest P concentration in the plants was observed in the MAP treatment, mainly in the first crop; the differences were not significant in relation to the values achieved in the SSP treatment. In the second crop, no differences between the treatments were observed. However, the plants presented a higher P concentration in all treatments. Data from the third crop indicated a significant decrease in the P concentration in all treatments. The lowest concentrations were observed in the NPK treatment (Table 3).

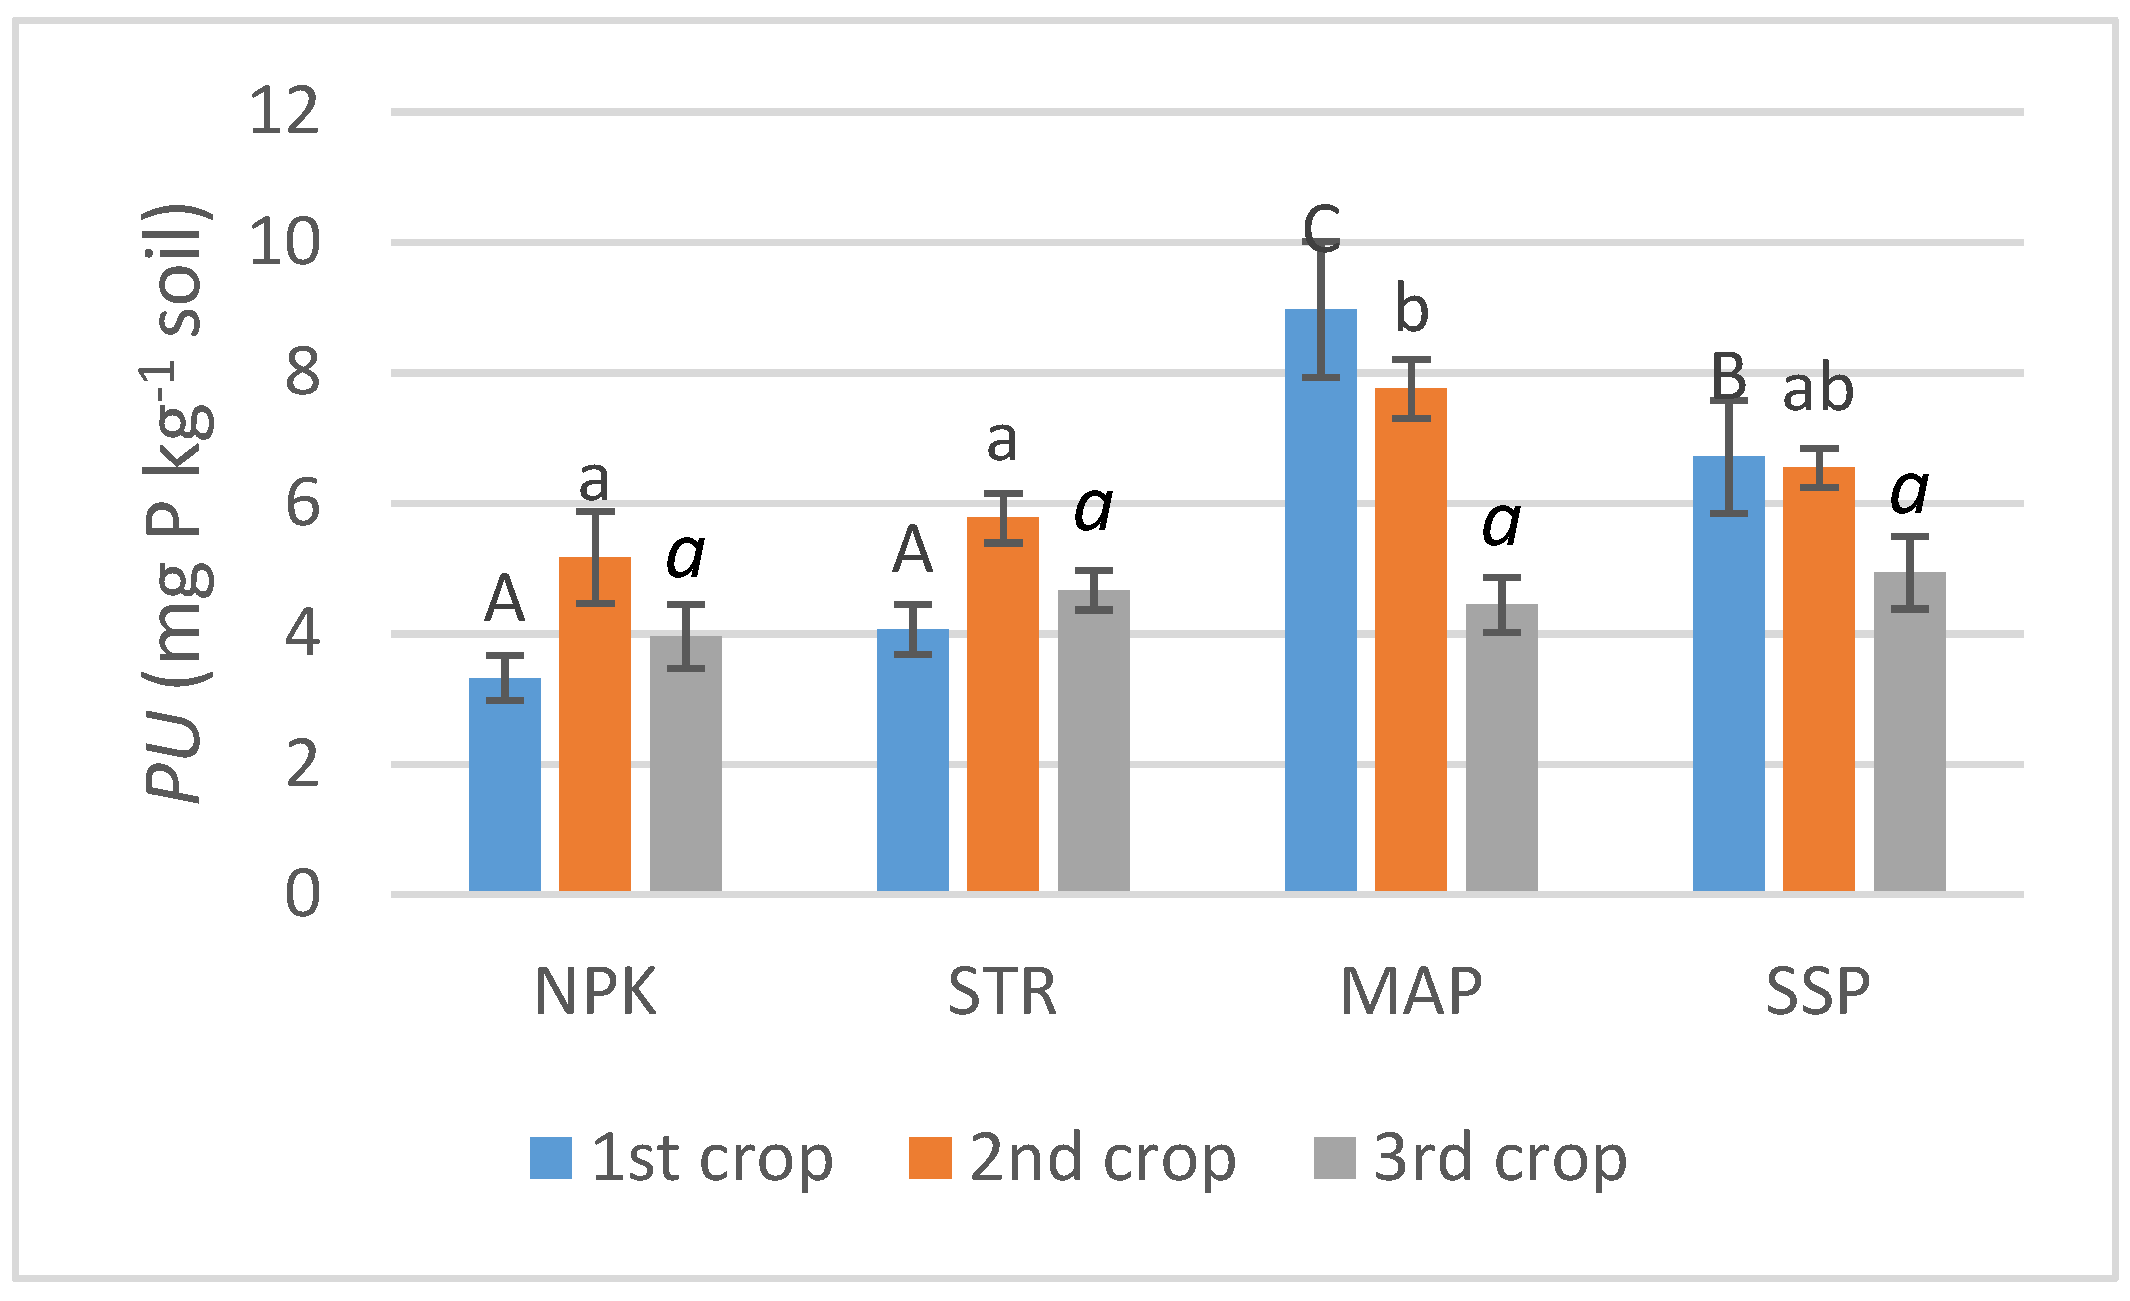
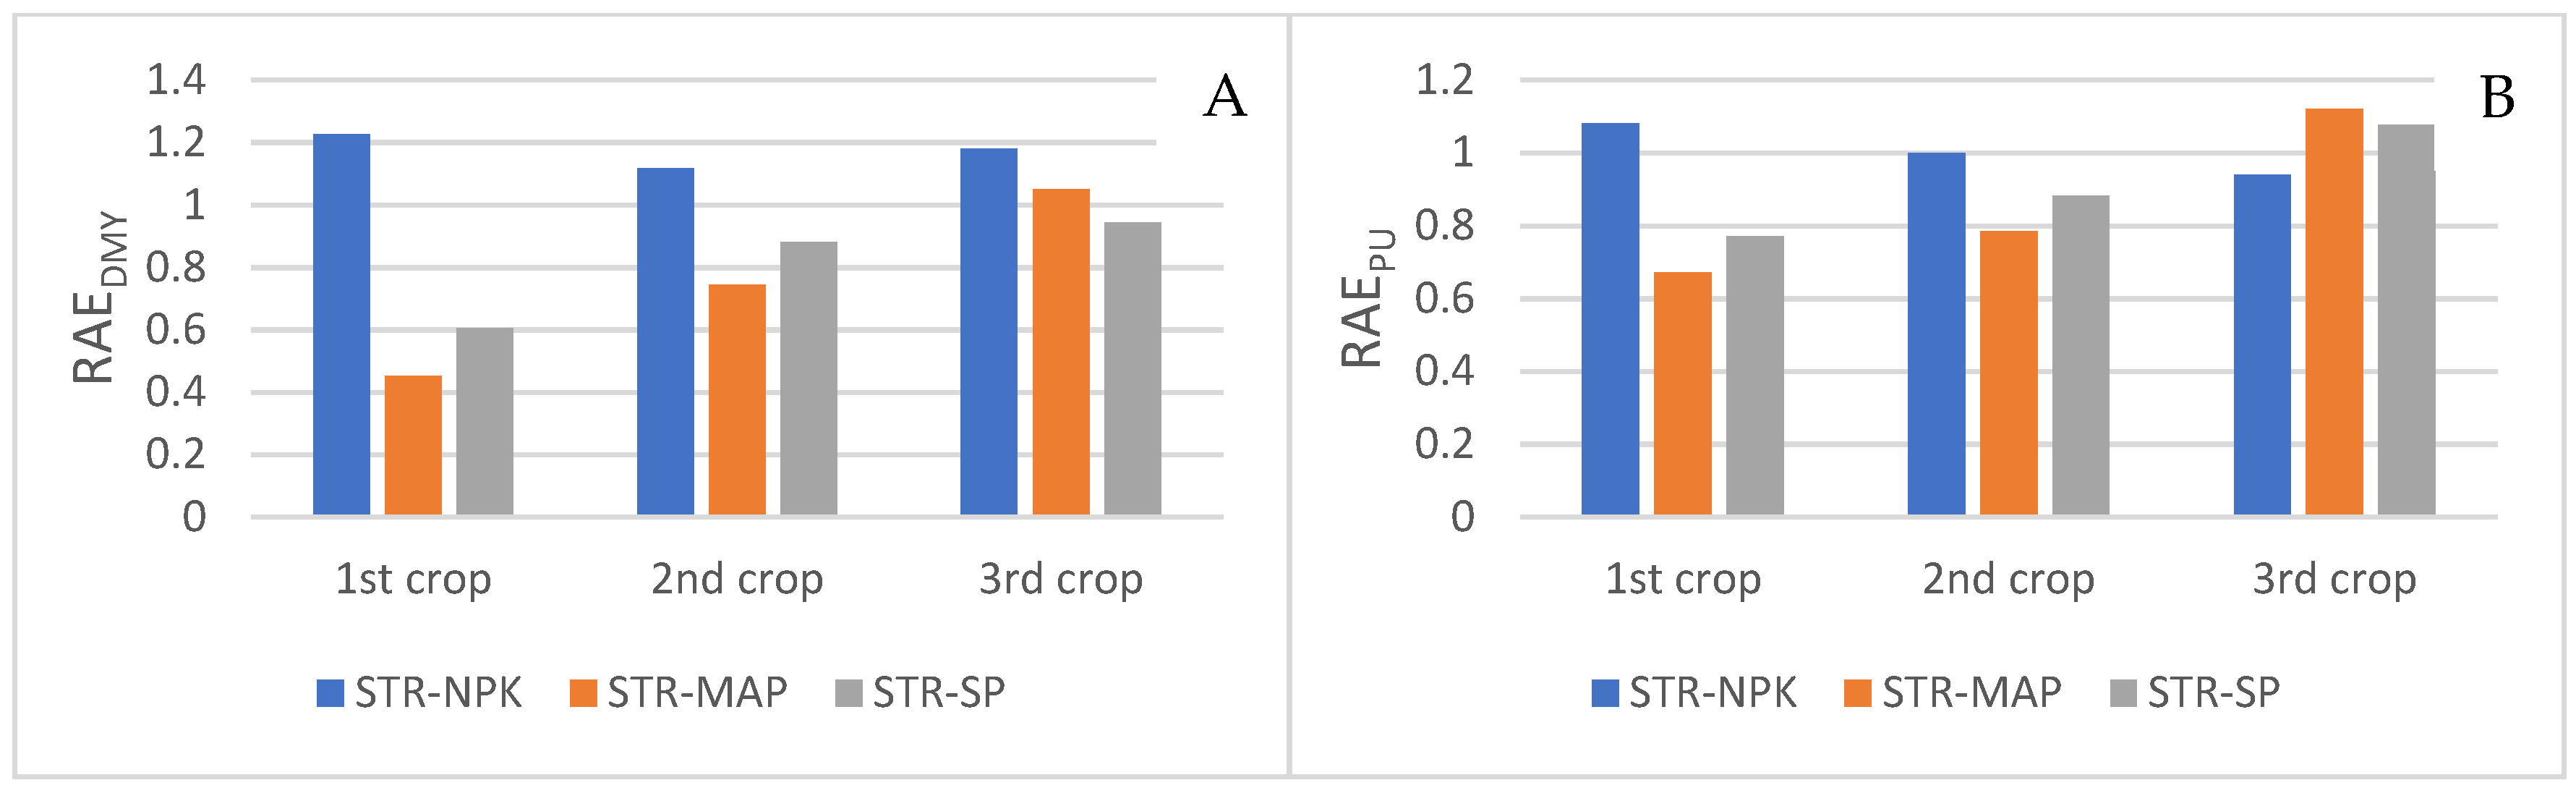
3.3. Phosphorus Uptake (PU) and Relative Agronomic Efficiency (RAE)

The evolution of PU in the three lettuce crops was similar to that of plant P concentration but with more marked differences. The evolution of this parameter in the STR and NPK treatments was very similar without significant differences between them in any of the three crops. In the first crop, the highest PU was obtained in the MAP treatment followed by SSP, both being significantly higher than in the plants treated with STR. In the second crop, only the PU in the MAP treatment was significantly higher than the STR treatment, reaching similar values in the third crop for all the P sources tested (Figure 4). In relation to RAE, the data are shown in Figure 5. In this regard, the RAE of the STR treatment with respect to NPK remained approximately 1 for DMY in the three crops, while the PU was slightly above 1 in these crops. Relative to MAP and SSP, the agronomic efficiency of STR was less than 1 in the first and second crops, while in the third, it reached a value close to 1, thereby showing an increasing trend for DMY and PU.

3.4. Effect on Soil Properties

The data on soil properties after each crop are shown in Table 4. No significant differences were observed between the treatments or between the harvests for the parameters analyzed except for P. In the first crop, the highest P content was observed for the MAP treatment and the lowest for NPK. However, in the second crop, the highest values were observed in the soil treated with STR, and the differences were statistically significant in relation to the other treatments. After the third crop, the P content in the soil decreased, observing similar values in the STR, MAP, and SPP treatments, which were greater than those observed in the NPK treatment (Table 4). Despite the high concentration of metals in SSP, no differences were observed in the soil. All values were below the legislative limits for agricultural use.

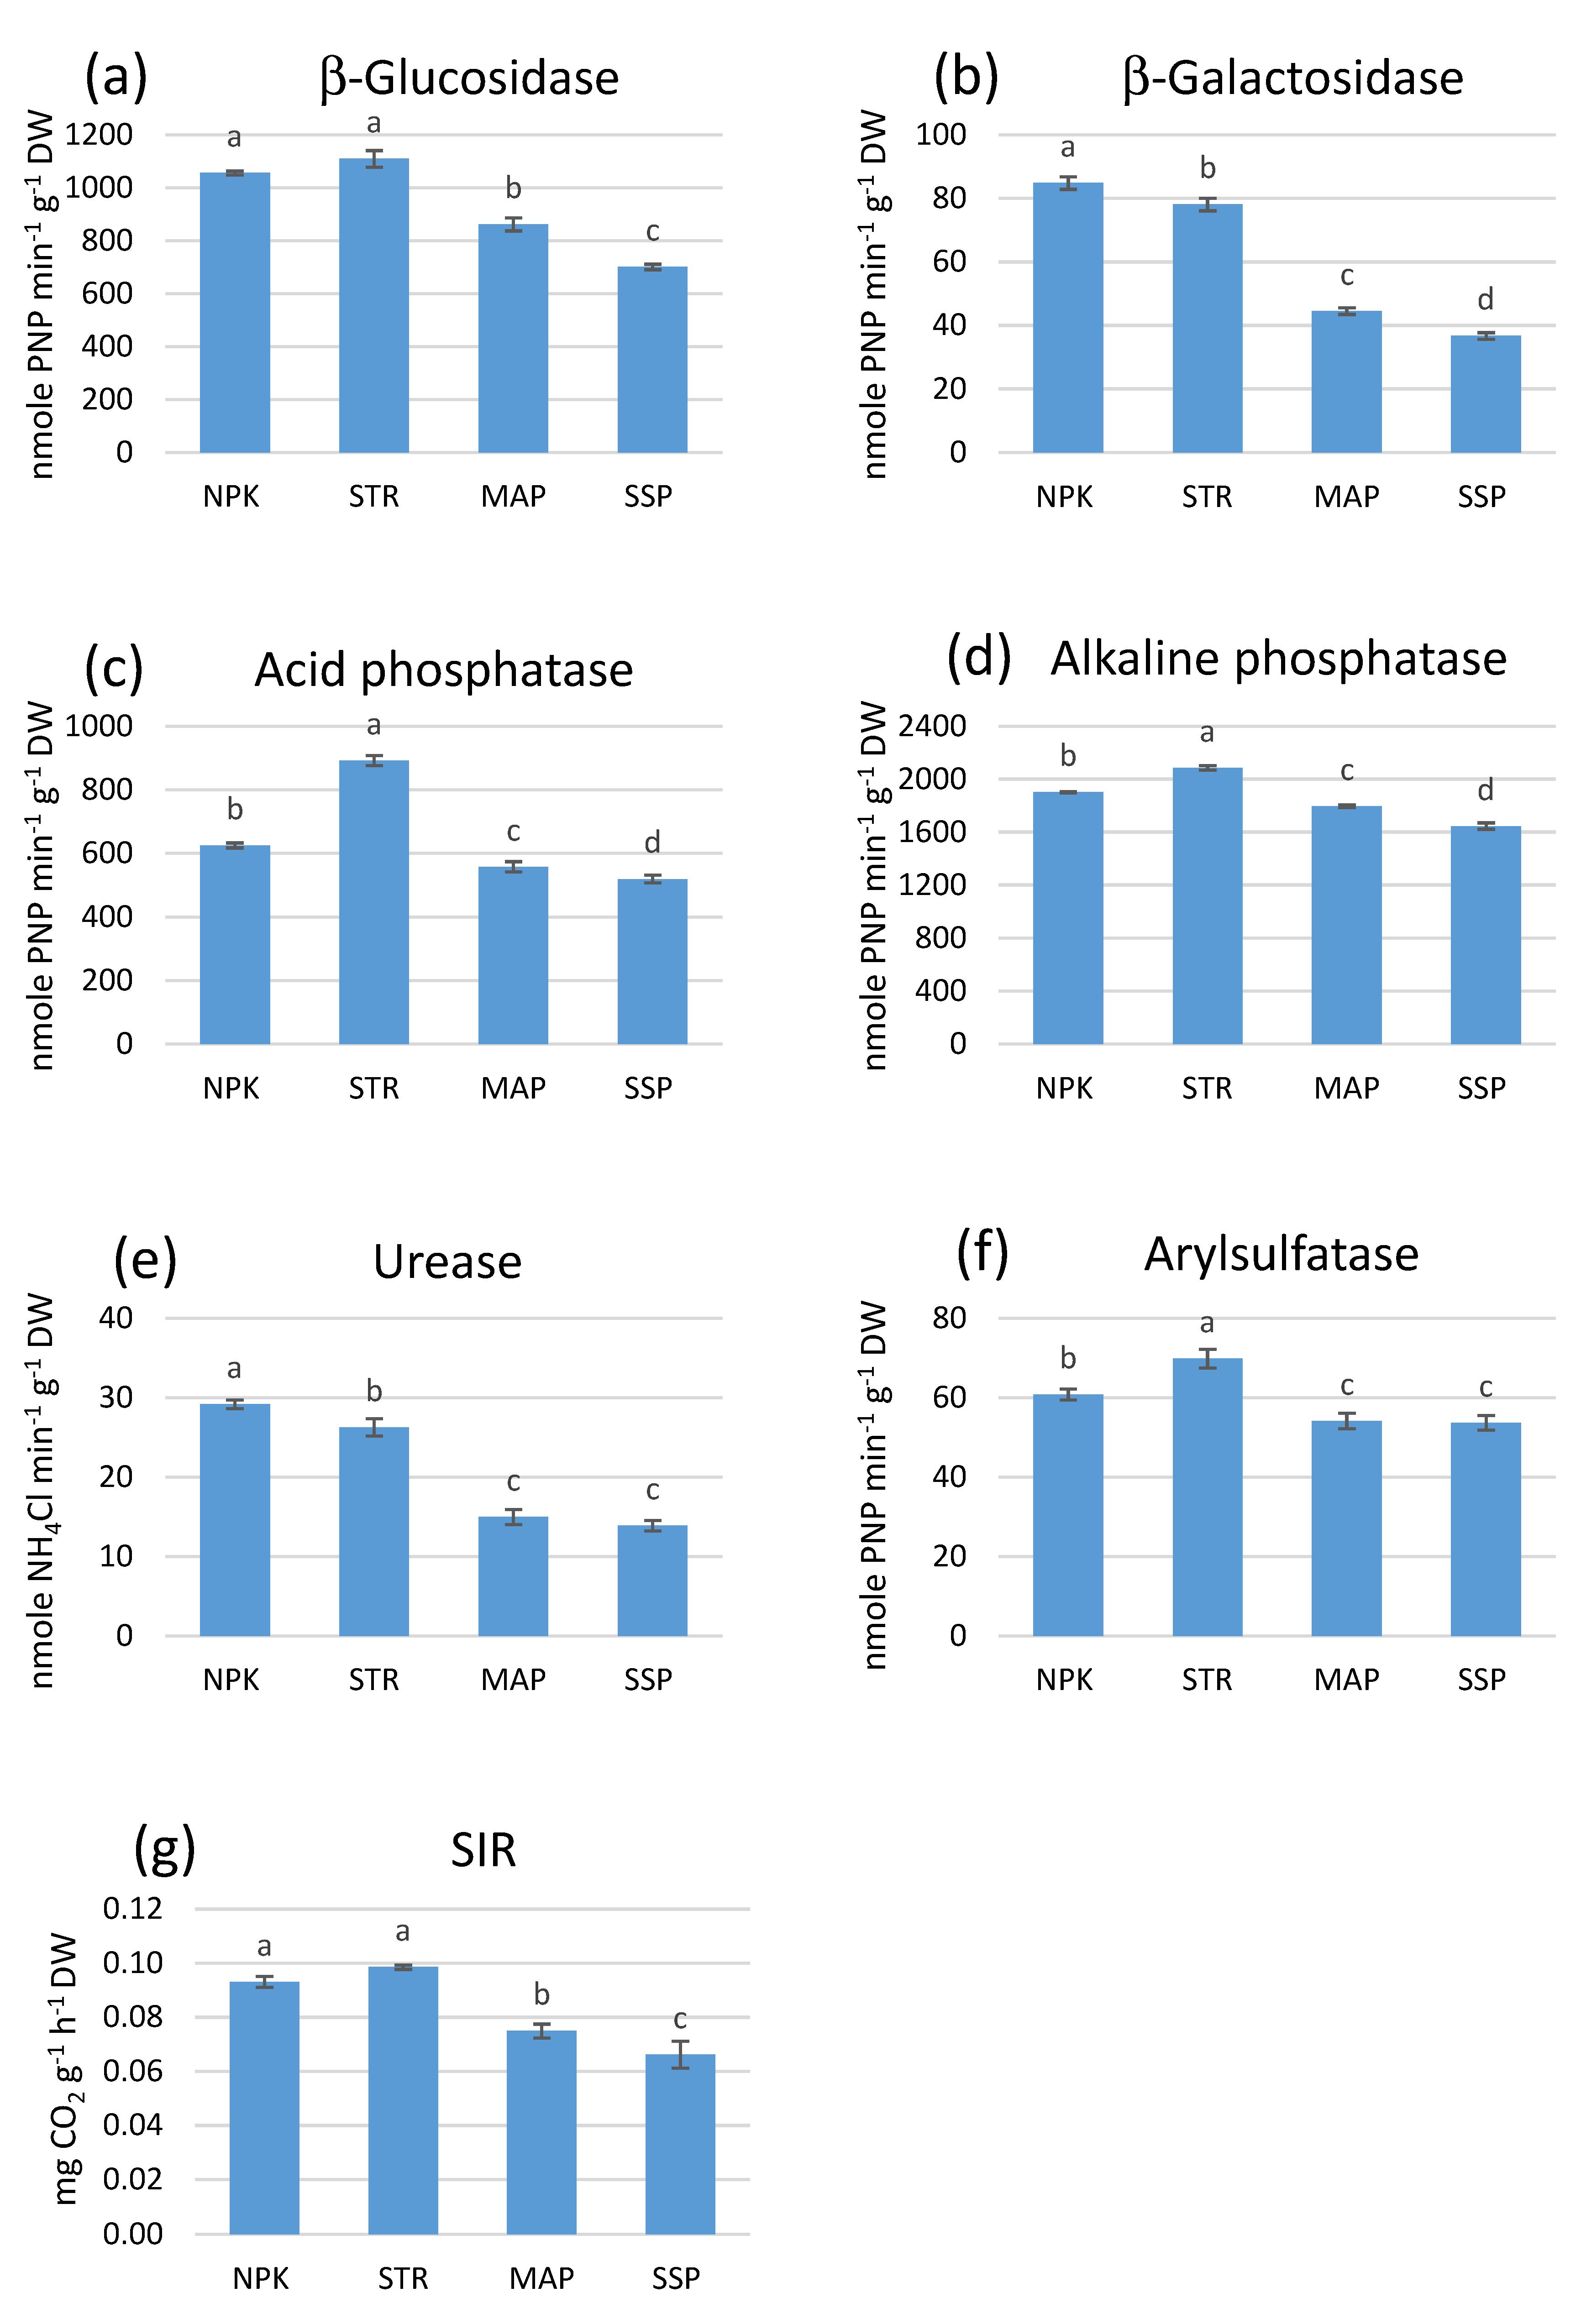
3.5. Effect of Phosphorus Fertilizers on Soil Enzyme Activities and Substrate-Induced Respiration (SIR)

As shown in Figure 6a, the STR treatment showed the highest β-glucosidase activity (1109.35 ± 31.78 nmol PNP min−1 g−1), which was significantly greater than that in the MAP (861.67 ± 24.52 nmol PNP min−1 g−1) and SSP (701.39 ± 10.18 nmol PNP min−1 g−1) (p < 0.05) treatments. There were no significant differences between the STR and commercial NPK treatments (1055.87 ± 7.60 nmol PNP min−1 g−1).
With regard to β-galactosidase activity, significant differences were observed between the P fertilizers (p < 0.05) (Figure 6b). The NPK experiment showed the highest β-galactosidase activity (84.84 ± 1.95 nmol PNP min−1 g−1), while the MAP (44.54 ± 1.02 nmol PNP min−1 g−1) and SSP (36.71 ± 1.04 nmol PNP min−1 g−1) treatments showed the lowest.
Acid phosphatase activity (Figure 6c) showed significant differences between the treatments (p < 0.05). The STR treatment showed the highest activity for this enzyme (892.23 ± 15.49 nmol PNP min−1 g−1), while the lowest value was observed in the MAP (557.90 ± 16.37 nmol PNP min−1 g−1) and SSP (519.37 ± 12.09 nmol PNP min−1 g−1) treatments.
In congruence with acid phosphatase, the same trend was observed for alkaline phosphatase activity with the STR treatment showing the greatest activity (2085.82 ± 17.63 nmol PNP min−1 g−1) (Figure 6d). Similarly, the MAP and SSP treatments showed the lowest activity values (1796.04 ± 19.86, and 1645.94 ± 24.15 nmol PNP min−1 g−1, respectively).
The NPK treatment showed the highest urease activity (29.17 ± 0.53 nmol NH4Cl min−1 g−1), which was significantly higher (p < 0.05) than the rest of the P-based fertilizers (Figure 6e). The activity of this enzyme in the NPK treatment was 20% higher than that in the STR experiment. Similar to the other enzyme activities, the MAP and SSP treatments showed significantly decreased urease activity (14.97 ± 0.93 and 13.90 ± 0.66 nmol NH4Cl min−1 g−1, respectively).
Consistent with soil acid and alkaline phosphatase and β-glucosidase activities, the highest and significantly different (p < 0.05) arylsulfatase activity was observed in the STR treatment (69.81 ± 2.33 nmol PNP min−1 g−1) (Figure 6f), which was 25% higher than that in the MAP and SSP treatments.
SIR values showed no significant differences between the STR and commercial NPK treatments (0.098 ± 0.002 and 0.93 ± 0.02 mg CO2 g−1 h−1, respectively) (Figure 6g). Conversely, CO2 production for the MAP and SSP treatments was lower and in line with the results observed for enzyme activities.

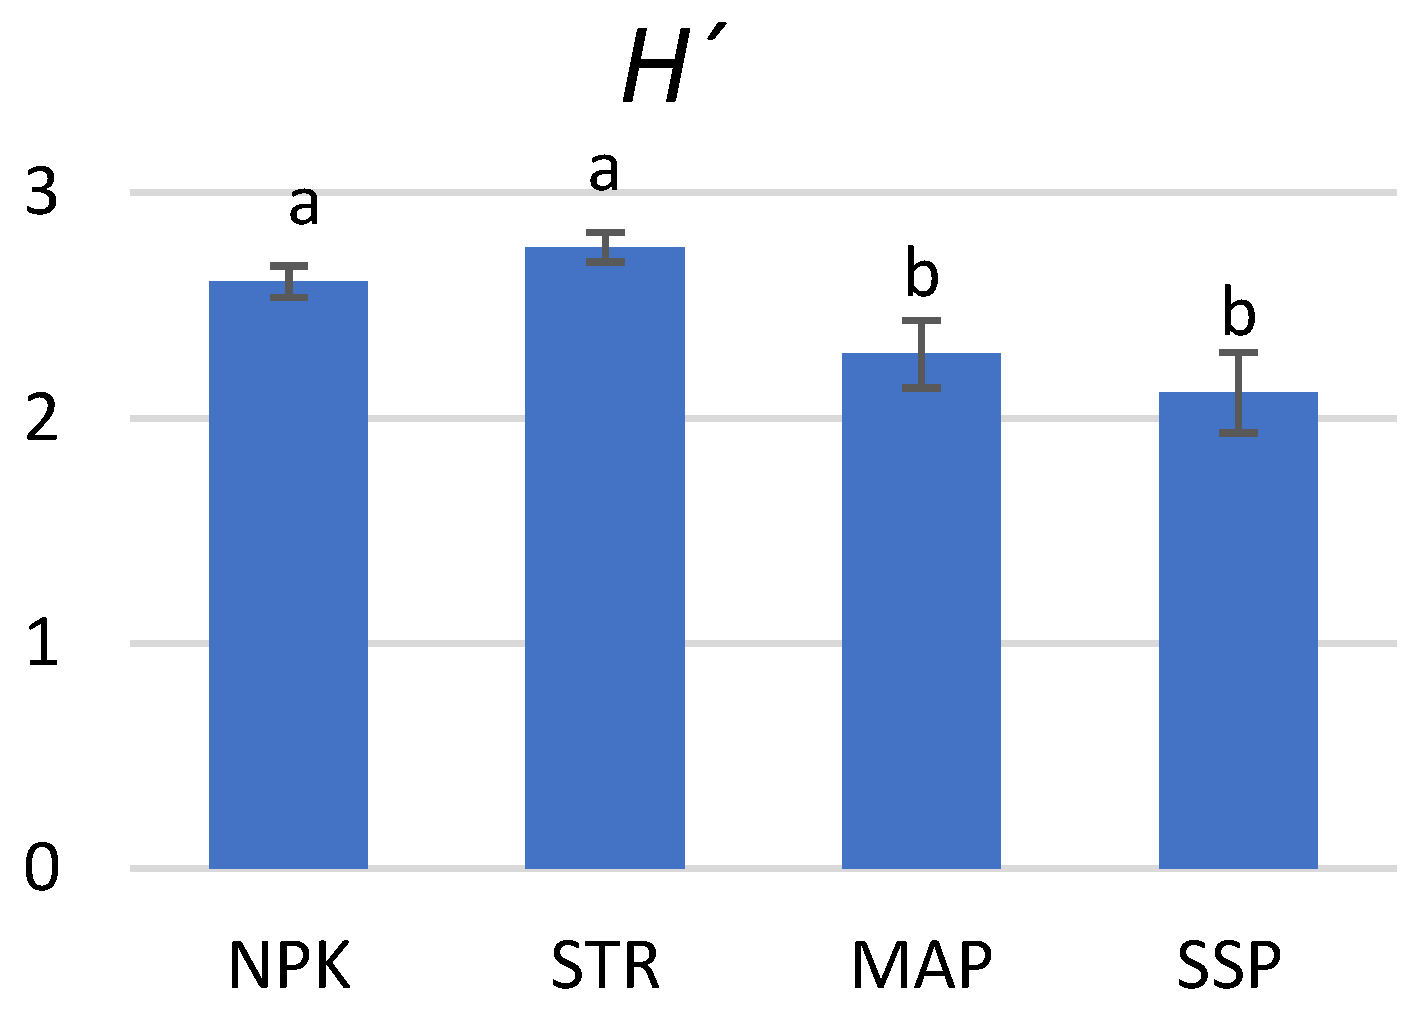
3.6. Effect on Community-Level Physiological Profiles

To study the effect of different P fertilizers on substrate utilization diversity, CLPP analysis was performed. Biolog-ECO plates consist of 31 different carbon sources: 4 polymers, 10 carbohydrates, 7 carboxylic acids, 6 amino acids, 2 amines, and 2 phenolic compounds. Table 5 shows the metabolic fingerprint of the CLPP of the four treatments. The analyses of the response patterns revealed metabolic activity in 19 of the 31 substrates analyzed. Regarding the pattern of individual substrate utilization, the culturable portion of the soil microbial community in the STR-treated soil samples showed greater use of amino acid substrates (L-arginine and L-asparagine), phenolic compounds (4-hydroxy benzoic acid), carbohydrates (D-mannitol and D-galactonic acid Ɣ-lactone), and carboxylic acids (Ɣ-hydroxybutyric acid and pyruvic acid methyl ester). Conversely, the microbial community in the MAP- and SSP-treated soils did not show substrate utilization of amino acids (L-threonine), amines (phenylethyl-amine), carbohydrates (β-methyl-D-glucoside and glucose-1-phosphate), or carboxylic acid (Ɣ-hydroxybutyric acid).
To evaluate the microbial community functional diversity, the Shannon diversity (H′) was determined based on four days of incubation in Biolog EcoPlatesTM (Figure 7). The highest diversity index was found for the STR treatment, although no significant differences were detected between the STR and NPK fertilizers.

4. Discussion

Few studies have addressed the effect of STR obtained from wastewater treatment plants as fertilizer in long-term assays. Katanda et al. (2016) [69] tested the fertilizing capacity of STR recovered from hog manure and compared it with that of MAP in three cycles of a rotational crop of canola and wheat. Although neither source of phosphate provided a DMY response for wheat in any of the crop cycles, wheat uptake of P from MAP was greater than from STR in the first crop phase, and no significant differences were observed in the second and third crop cycles. These results are consistent with those reported herein. Cabeza et al. (2011) [70] tested STR in pot trials on maize and concluded that it showed similar results to triple super phosphate, and P uptake was almost equal in the first year. Those authors concluded by drawing attention to the relevance of evaluating long-term fertilization.
In a buckwheat pot assay, Talboys et al. (2016) [50] reported slower P uptake from granulated STR in initial plant development compared with diammonium phosphate and triple super phosphate without detriment to the final yield. Other authors [71,72] did not observe this lower rate of P uptake from STR in early crop growth and observed no reduction in P uptake compared with soluble P fertilizers. The difference between our results and those reported in these studies could be related to the physical form of STR tested. In this regard, in those studies, STR was finely ground, while in our assay, it was granulated. Furthermore, the pH of the soils differed between these studies since those two authors used slightly acidic soils, which favored the dissolution of STR. The effect of particle size on P availability from STR was reported by Degryse et al. (2017) [49], who observed that P availability for granular treatments was much lower for STR than for MAP. However, when STR was ground, it performed similarly to MAP. Thompson (2013) [73] confirmed the sustained long-term efficiency of granulated STR obtained from livestock and bioenergy byproducts or waste as a P fertilizer in a multi-year trial (corn–soybean–corn). The results in yield and PU reported in that study were similar or higher to those obtained using triple superphosphate in the first year. The differences in the behavior of STR could also be due to differences in the characteristics of the soil used. In the aforementioned study, the soil had a very low P content in comparison with that used in our assay. In addition, the response would also probably be influenced by the crop used. In our study, the evolution observed in the STR-fertilized crop could have been caused by the low water solubility of this compound (1.3%) [32] and, consequently, the slow release of available nutrients to the soil, leading to a lower yield and PU in the first crop and an increase in these parameters in the following crops. MAP and SSP presented a higher water solubility (46.5% and 17.5%, respectively), and their application to the soil brought about a rapid increase in available P and significantly higher yields and PU in the first crop. However, these parameters declined in the subsequent crops.
In contrast to other mineral fertilizers, especially MAP and SSP, STR is not rapidly soluble in water, and therefore, the P availability and efficiency in the early crop stages would be insufficient. In this context, it would be advantageous to combine STR with another source of easily available P during the initial growth stages to achieve optimal results, as recommended by other authors [50,74,75,76,77]. However, although STR shows low water solubility, many previous laboratory-based reports suggested that it equals or exceeds the efficiency of soluble fertilizers, such as MAP and SSP, as a source of P for plants [39,41,42,44,70,72,76,78,79,80].
The agronomic efficiency of STR was expressed relative to other mineral P fertilizers (RAE). The determination of this parameter allows the optimization of its use as a fertilizer, thereby avoiding the underfertilization of crops or eutrophication of surface waters due to overfertilization [81]. In this study, the treatment with STR showed similar lettuce yields to that with NPK. In this regard, the RAE of the STR treatment with respect to NPK remained approximately 1 for DMY in the three crops, while the PU was slightly above 1 in these crops. These observations reveal that STR is more efficient in terms of P assimilation by plants. Relative to MAP and SSP, the agronomic efficiency of STR was less than 1 in the first and second crops, while in the third, it reached a value close to 1, thereby showing an increasing trend for DMY and PU. These results might again be due to the slow release of P by STR and its long-term effect. However, in a review evaluating P fertilizers derived from secondary raw materials, Huygens and Saveyn (2018) [82] found that the relative agronomic efficiency of STR with respect to DMY and PU was not significantly different from 1, and they concluded that the agronomic efficiency of this P source is equal to other synthetic fertilizers, thereby supporting the interest of its use in the European agricultural sector. The difference with our results might be explained by the following characteristics of this assay: high pH of the soil used (which reduces the solubility of the fertilizers), moderate concentrations of P in the soil, granular form of the STR, and type of plant species cultivated.
Most studies evaluate fertilizer performance in terms of crop yield and PU, while a few report the levels of P available in the soil after the crop. We consider the latter significant to evaluate the long-term fertilizing capacity of products.
The concentration of available P in the STR-treated soil after the first crop was similar to that of the soil treated with NPK and significantly lower than the MAP- and SSP-treated soils. After the second crop, the STR-treated soil showed the highest content of available P, exceeding that of the NPK treatment and with no significant differences with the MAP- and SSP-treated soils. After the third crop, the STR-, MAP-, and SSP-treated soils showed a similar available P content, all three being significantly higher than the concentration observed in the NPK-treated soil. It should be noted that struvite also provides N and Mg to the crop.
Working with a crop of Brasica oleracea, Prater (2014) [83] found significantly higher P concentrations in soil treated with STR after the crop than in soil treated with a slow-release complex fertilizer similar to the NPK used in this assay. In addition, other authors reported similar concentrations of available P in soils treated with STR and triple superphosphate after the crop [36,84], as described in this work.
We observed higher activity of soil enzymes that have a key function in the cycling of P and S in the STR-treated soil when compared to the activity of the same enzymes in all other P fertilizers. Conversely, the MAP and SPP treatments showed lower activity in all the microbiological parameters analyzed.
It is well established that enzyme activities depend on organic matter and the relative availability of nutrients as well as other factors, such as soil type and its unique characteristics, pH, and texture [58,85,86]. However, some of these factors, termed stressors, such as salinity, may have adverse effects on microbial biomass and, therefore, on microbial activity. Rietz and Haynes (2003) [87] observed a decline in the activity of β-glucosidase, alkaline phosphatase, and arylsulphatase with increasing salinity and Na content. Indeed, at the third lettuce crop, the highest EC and Na concentrations were recorded in the MAP and SSP treatments, although the differences were not statistically significant. These results point to an inhibitor effect of salinity on the microbial activity in these P fertilizers.
The activity of alkaline phosphatase was much higher than that of acid phosphatase due to the alkaline pH of the soil tested [88]. At the end of the third crop, the highest phosphatase activity was recorded in the STR treatments. Nevertheless, the results of Bastida et al. (2019) [48] reported the inhibition of alkaline phosphatase activity in an STR assay after one month of incubation. In addition, no correlation was observed between P availability and the activity of P-cycling enzymes. These results are in contrast with previous studies that demonstrated a negative relationship between phosphatase activity and P availability [48,89]. However, in agreement with our findings, Bowles et al. (2014) [57] suggested that microbial biomass plays a greater role in regulating phosphatase activities than P availability. In fact, the positive correlation found between soil respiration and acid phosphatase (r = 0.81; p < 0.001) and alkaline phosphatase (r = 0.92; p < 0.001) may reflect enhanced phosphatase activity related to microbial activity. Indeed, the latter parameter indicates the oxidative capacity of soil microorganisms, and it is affected by the number of microorganisms and energy sources.
Soil β-glucosidase and β-galatosidase are involved in the soil carbon cycle, which is closely related to the composition, transformation, and circulation of soil organic matter [90,91]. The similar activity of β-glucosidase in the NPK and STR treatments with no significant differences between them indicates the effectiveness of the latter with regard to this enzyme. In fact, C supply from roots is rich in sugar compounds [92], and it has been shown that β-glucosidase activity is positively influenced by the presence of glucose-rich exudates [93]. Conversely, β-galactosidase may be negatively affected by STR. Previous research showed that β-galactosidase activity decreased in response to inorganic salts [88]. The presence of some specific inorganic salts in STR could partly explain the distinct behavior of these C-transformation enzymes.
Urease is directly involved in N mineralization, and reduced activity of this enzyme has been reported in soils with high inorganic N availability [94]. Compared to the treatment with NPK, that involving STR showed reduced urease activity, suggesting nitrification from STR. Several studies showed that nitrate content inhibits nitrification, thereby affecting the activity of urease [57,95]. In addition, Robles-Aguilar et al. (2020) [53] proposed that STR delivers ammonium directly to the root medium, and they demonstrated the oxidation of ammonium to nitrate from STR in the rhizosphere of Lupine. In this context, our results suggest that STR would have a beneficial effect as a N source.
Arylsulfatase is involved in the desulfation of aromatic sulfate–ester bonds, and it is produced by microorganisms under sulfate-limiting conditions [96,97]. To the best of our knowledge, the present study is the first to determine the effect of STR on arylsulfatase activity. The arylsulfatase activity in the STR treatments was significantly higher than that in the NPK treatment. This observation could be associated with changes in certain bacterial populations. In fact, studies on bacterial community response to STR found that actinobacterial populations were stimulated by STR from a wastewater treatment plant [48] and from municipal waste [98]. More specifically, Bastida et al. (2019) [48] found that the application of STR increased the abundance of Streptomycetales. Furthermore, previous studies highlighted that Actinobacteria show arylsulfatase activity [99] and emphasized the strong adaptability of Streptomyces to sulfate-limiting conditions [100]. In this context, our results suggest that STR has a potential impact on the S cycle.
Regarding soil functional diversity, similar results were observed with EcoPlatesTM that compared soil enzyme activities. Higher values of H′ and S were observed in the NPK and STR treatments, which had a similar positive effect on soil microbial diversity. Conversely, a loss of functional diversity was observed in the MAP and SSP treatments, coinciding with lower values of soil respiration and enzyme activities. CLPP-based parameters are reported to correlate well with substrate-induced respiration and with the results of multiple enzyme assays [101,102]. Accordingly, our results are consistent. In this regard, EcoPlatesTM show the capacity of the culturable fraction of the microbial community to react to substrates, whereas SIR and enzyme activities reflect the situation of the overall microbial community. Therefore, the relatively lower index of diversity found in the MAP- and SSP-treated soils demonstrated poorer microbial populations.
Regarding substrate utilization by the microbial communities, larger values were observed for some easily degradable substrates, such as L-asparagine, D-galacturonic acid, and pyruvic acid methyl ester. According to Rutgers et al. (2016) [62], these findings indicate the abundance of bacteria utilizing these substrates or that these bacteria are able to react and grow rapidly. The different ability of the bacterial communities to respond to the substrates among P-based treatments suggests that soil microorganisms have various preferences for C-source utilization depending on the fertilizers. Specifically, N-containing substrates (L-threonine, phenylethyl-amine) and P-containing substrates (glucose-1-phosphate), which were used only by the microbial populations in the STR and NPK treatments, support different N and P dynamics in these soils.

5. Conclusions

Our results show that STR presents a lower water solubility of P than the rest of the P fertilizers tested in this assay. Thus, the use of STR as a P fertilizer would reduce the risk of eutrophication derived from high solubility. The DMY and PU values for the STR treatment were similar to those obtained with NPK in the three crops, while they were lower than those in the MAP and SSP treatments in the first crop and tended to be similar in the following crops. The capacity of a single application of STR to maintain the concentration of available P in the soil for successive crops confirms its fertilizing effect in the medium/long term. To obtain the appropriate formulations for each crop and to provide a quick supply of P in the phases of greatest demand for the crop, we propose that it would be advantageous to use STR in combination with other fertilizers.
All the soil biological parameters demonstrate that STR application has an impact on soil microbial populations related to C, N, P, and S cycling and a positive effect on microbial activity and functional diversity. Soil enzyme activity analysis and CLPP emerge as sensitive indicators of soil microbial activity in STR treatments. The use of STR as a fertilizer implies the recovery of a valuable resource (P) from wastewater treatment and, thus, a sustainable strategy in line with the circular economy.

Author Contributions

Conceptualization, C.M., P.G.-G. and M.C.L.; Methodology, J.A. and P.G.-G.; Validation, J.A.; Formal Analysis, S.D.-P. and J.A.; Investigation, C.M. and M.G.-D.; Resources, M.C.L.; Data Curation, J.A., C.M. and P.G.-G.; Writing—Original Draft Preparation, C.M.; Writing—Review and Editing, C.M., M.G.-D., P.G.-G. and M.C.L.; Project Administration and Funding Acquisition, M.C.L. Project Administration and Funding Acquisition: M.C.L. All authors have read and agreed to the published version of the manuscript.

Funding

This research was funded by Canal de Isabel II, research project STRUVITE (2020-2022).

Data Availability Statement

Not applicable.

Conflicts of Interest

The authors declare no conflict of interest.

References

  1. United Nations. World Population Prospects: The 2017 Revision, Key Findings and Advance Tables; Working Paper No. ESA/P/WP/248; United Nations: New York, NY, USA, 2017.
  2. Le Mouël, C.; Forslund, A. How Can We Feed the World in 2050? A Review of the Responses from Global Scenario Studies. Eur. Rev. Agric. Econ. 2017, 44, 541–591. [Google Scholar] [CrossRef]
  3. Tilman, D.; Balzer, C.; Hill, J.; Befort, B.L. Global Food Demand and the Sustainable Intensification of Agriculture. Proc. Natl. Acad. Sci. USA 2011, 108, 20260–20264. [Google Scholar] [CrossRef] [PubMed]
  4. Barker, A.V.; Pilbeam, D.J. Handbook of Plant Nutrition, 2nd ed.; Press, C., Ed.; CRC Press: Boca Raton, FL, USA, 2015. [Google Scholar]
  5. Dodds, W.K.; Bouska, W.W.; Eitzmann, J.L.; Pilger, T.J.; Pitts, K.L.; Riley, A.J.; Schloesser, J.T.; Thornbrugh, D.J. Eutrophication of U. S. Freshwaters: Analysis of Potential Economic Damages. Environ. Sci. Technol. 2009, 43, 12–19. [Google Scholar] [CrossRef]
  6. Withers, P.J.A.; Neal, C.; Jarvie, H.P.; Doody, D.G. Agriculture and Eutrophication: Where Do We Go from Here? Sustainability. 2014, 6, 5853–5875. [Google Scholar] [CrossRef]
  7. Savci, S. An Agricultural Pollutant: Chemical Fertilizer. Int. J. Environ. Sci. Dev. 2012, 3, 73–80. [Google Scholar] [CrossRef]
  8. Reijnders, L. Phosphorus Resources, Their Depletion and Conservation, a Review. Resour. Conserv. Recycl. 2014, 93, 32–49. [Google Scholar] [CrossRef]
  9. Cordell, D.; Neset, T.S.S. Phosphorus Vulnerability: A Qualitative Framework for Assessing the Vulnerability of National and Regional Food Systems to the Multi-Dimensional Stressors of Phosphorus Scarcity. Glob. Environ. Chang. 2014, 24, 108–122. [Google Scholar] [CrossRef]
  10. Elser, J.J. Phosphorus: A Limiting Nutrient for Humanity? Curr. Opin. Biotechnol. 2012, 23, 833–838. [Google Scholar] [CrossRef]
  11. European Commission. Critical Raw Materials Resilience: Charting a Path towards Greater Security and Sustainability. In Communication from the Commission to the European Parliament, the Council, the European Economic and Social Committee and the Committee of the Regions; European Commission: Brussels, Belgium, 2020. [Google Scholar]
  12. Cordell, D.; White, S. Peak Phosphorus: Clarifying the Key Issues of a Vigorous Debate about Long-Term Phosphorus Security. Sustainability 2011, 3, 2027–2049. [Google Scholar] [CrossRef]
  13. Heckenmüller, M.; Narita, D.; Klepper, G. Global Availability of Phosphorus and Its Implications for Global Food Supply: An Economic Overview; Kiel Working Paper, No. 1897; Kiel Institute for the World Economy (IfW): Kiel, Germany, 2014. [Google Scholar]
  14. Cordell, D.; Drangert, J.O.; White, S. The Story of Phosphorus: Global Food Security and Food for Thought. Glob. Environ. Chang. 2009, 19, 292–305. [Google Scholar] [CrossRef]
  15. Smil, V. Phosphorus in the Environment: Natural Flows and Human Interferences. Annu. Rev. Energy Environ. 2000, 25, 53–88. [Google Scholar] [CrossRef]
  16. European Fertilizer Manufacturers Association. Phosphorus: Essential Element for Food Production; European Fertilizer Manufacturers Association (EFMA): Brussels, Belgium, 2000; pp. 1–38. [Google Scholar]
  17. Chojnacka, K.; Moustakas, K.; Witek-Krowiak, A. Bio-Based Fertilizers: A Practical Approach towards Circular Economy. Bioresour. Technol. 2020, 295, 122223. [Google Scholar] [CrossRef]
  18. De-Bashan, L.E.; Bashan, Y. Recent Advances in Removing Phosphorus from Wastewater and Its Future Use as Fertilizer (1997–2003). Water Res. 2004, 38, 4222–4246. [Google Scholar] [CrossRef] [PubMed]
  19. Shu, L.; Schneider, P.; Jegatheesan, V.; Johnson, J. An Economic Evaluation of Phosphorus Recovery as Struvite from Digester Supernatant. Bioresour. Technol. 2006, 97, 2211–2216. [Google Scholar] [CrossRef] [PubMed]
  20. Barnard, J.L. Elimination of Eutrophication through Resource Recovery. In International Conference on Nutrient Recovery from Wastewater Streams; IWA Publishing: Vancouver, BC, Canada, 2009; ISBN 9781843392323. [Google Scholar]
  21. Qiao, J.; Li, X.; Li, F.; Liu, T.; Young, L.Y.; Huang, W.; Sun, K.; Tong, H.; Hu, M. Humic Substances Facilitate Arsenic Reduction and Release in Flooded Paddy Soil. Environ. Sci. Technol. 2019, 53, 5034–5042. [Google Scholar] [CrossRef]
  22. European Commission. Directive 2000/60/EC of the European Parliament and of the Council of 23 October 2000 Establishing a Framework for the Community Action in the Field of Water Policy; European Commission: Brussels, Belgium, 2000.
  23. European Commission. Directive 91/271/EEC of the European Council of 21 May 1991 Concerning Urban Waste Water Treatment; European Commission: Brussels, Belgium, 1991; pp. 40–52.
  24. Gilbert, N. The Disappearing Nutrient. Nature 2009, 461, 716–718. [Google Scholar] [CrossRef] [PubMed]
  25. European Commission. A New Circular Economy Action Plan for a Cleaner and More Competitive Europe. In Communication from the Commission to the European Parliament, the Council, the European Economic and Social Committee and the Committee of the Regions; European Commission: Brussels, Belgium, 2020. [Google Scholar]
  26. European Commission. Commission Delegated Regulation (EU) 2021/2086 of 5 July 2021 Amending Annexes II and IV to Regulation (EU) 2019/1009 of the European Parliament and of the Council for the Purpose of Adding Precipitated Phosphate Salts and Derivates as a Component Materia; European Commission: Brussels, Belgium, 2021.
  27. Huygens, D.; Saveyn, H.G.M.; Tonini, D.; Eder, P.; Delgado Sancho, L. Technical Proposals for Selected New Fertilising Materials under the Fertilising Products Regulation (Regulation (EU) 2019/1009); European Commission: Brussels, Belgium, 2019; ISBN 9789276098881.
  28. Kataki, S.; West, H.; Clarke, M.; Baruah, D.C. Phosphorus Recovery as Struvite: Recent Concerns for Use of Seed, Alternative Mg Source, Nitrogen Conservation and Fertilizer Potential. Resour. Conserv. Recycl. 2016, 107, 142–156. [Google Scholar] [CrossRef]
  29. Maaß, O.; Grundmann, P.; Von Bock Und Polach, C. Added-Value from Innovative Value Chains by Establishing Nutrient Cycles via Struvite. Resour. Conserv. Recycl. 2014, 87, 126–136. [Google Scholar] [CrossRef]
  30. Munir, M.T.; Li, B.; Boiarkina, I.; Baroutian, S.; Yu, W.; Young, B.R. Phosphate Recovery from Hydrothermally Treated Sewage Sludge Using Struvite Precipitation. Bioresour. Technol. 2017, 239, 171–179. [Google Scholar] [CrossRef]
  31. Rahman, M.M.; Salleh, M.A.M.; Rashid, U.; Ahsan, A.; Hossain, M.M.; Ra, C.S. Production of Slow Release Crystal Fertilizer from Wastewaters through Struvite Crystallization—A Review. Arab. J. Chem. 2014, 7, 139–155. [Google Scholar] [CrossRef]
  32. Mancho, C.; Diez-Pascual, S.; Alonso, J.; Gil-Díaz, M.; Lobo, M.C. Assessment of Recovered Struvite as a Safe and Sustainable Phosphorous Fertilizer. Environments 2023, 10, 22. [Google Scholar] [CrossRef]
  33. Li, X.Z.; Zhao, Q.L. Recovery of Ammonium-Nitrogen from Landfill Leachate as a Multi-Nutrient Fertilizer. Ecol. Eng. 2003, 20, 171–181. [Google Scholar] [CrossRef]
  34. Negrea, A.; Lupa, L.; Negrea, P.; Ciopec, M.; Muntean, C. Simultaneous Removal of Ammonium and Phosphate Ions from Wastewaters and Characterization of the Resulting Product. Chem. Bull. “POLITEHNICA” Univ. 2010, 55, 136–142. [Google Scholar]
  35. El Rafie, S.; Hawash, S.; Shalaby, M.S. Evaluation of Struvite Precipitated from Chemical Fertilizer Industrial Effluents. Adv. Appl. Sci. Res. 2013, 4, 113–123. [Google Scholar]
  36. Gell, K.; van Groenigen, J.W.; Cayuela, M.L. Residues of Bioenergy Production Chains as Soil Amendments: Immediate and Temporal Phytotoxicity. J. Hazard. Mater. 2011, 186, 2017–2025. [Google Scholar] [CrossRef] [PubMed]
  37. Hertzberger, A.J.; Cusick, R.D.; Margenot, A.J. A Review and Meta-Analysis of the Agricultural Potential of Struvite as a Phosphorus Fertilizer. Soil Sci. Soc. Am. J. 2020, 84, 653–671. [Google Scholar] [CrossRef]
  38. Robles-Aguilar, A.A.; Schrey, S.D.; Postma, J.A.; Temperton, V.M.; Jablonowski, N.D. Phosphorus Uptake from Struvite Is Modulated by the Nitrogen Form Applied. J. Plant Nutr. Soil Sci. 2020, 183, 80–90. [Google Scholar] [CrossRef]
  39. Plaza, C.; Sanz, R.; Clemente, C.; Fernández, J.M.; González, R.; Polo, A.; Colmenarejo, M.F. Greenhouse Evaluation of Struvite and Sludges from Municipal Wastewater Treatment Works as Phosphorus Sources for Plants. J. Agric. Food Chem. 2007, 55, 8206–8212. [Google Scholar] [CrossRef]
  40. Ponce, R.; Sa, M.E. Efficacy of Magnesium Ammonium Phosphate Recovered from Wastewater on White Lupin Plant. A Greenhouse Experiment. Agrochimica 2008, 52, 352–359. [Google Scholar]
  41. Ricardo, G.P.; López-de-Sá, E.G.; Plaza, C. Lettuce Response to Phosphorus Fertilization with Struvite Recovered from Municipal Wastewater. HortScience 2009, 44, 426–430. [Google Scholar] [CrossRef]
  42. Ryu, H.D.; Lim, C.S.; Kim, Y.K.; Kim, K.Y.; Lee, S.I. Recovery of Struvite Obtained from Semiconductor Wastewater and Reuse as a Slow-Release Fertilizer. Environ. Eng. Sci. 2012, 29, 540–548. [Google Scholar] [CrossRef]
  43. Wen, G.; Huang, L.; Zhang, X.; Hu, Z. Uptake of Nutrients and Heavy Metals in Struvite Recovered from a Mixed Wastewater of Human Urine and Municipal Sewage by Two Vegetables in Calcareous Soil. Environ. Technol. Innov. 2019, 15, 100384. [Google Scholar] [CrossRef]
  44. Antonini, S.; Arias, M.A.; Eichert, T.; Clemens, J. Greenhouse Evaluation and Environmental Impact Assessment of Different Urine-Derived Struvite Fertilizers as Phosphorus Sources for Plants. Chemosphere 2012, 89, 1202–1210. [Google Scholar] [CrossRef] [PubMed]
  45. Gell, K.; de Ruijter, F.J.; Kuntke, P.; de Graaff, M.; Smit, A.L. Safety and Effectiveness of Struvite from Black Water and Urine as a Phosphorus Fertilizer. J. Agric. Sci. 2011, 3, 67. [Google Scholar] [CrossRef]
  46. Nongqwenga, N.; Muchaonyerwa, P.; Hughes, J.; Odindo, A.; Bame, I. Possible Use of Struvite as an Alternative Phosphate Fertilizer. J. Soil Sci. Plant Nutr. 2017, 17, 581–593. [Google Scholar] [CrossRef]
  47. Ryu, H.D.; Lim, C.S.; Kang, M.K.; Lee, S.I. Evaluation of Struvite Obtained from Semiconductor Wastewater as a Fertilizer in Cultivating Chinese Cabbage. J. Hazard. Mater. 2012, 221–222, 248–255. [Google Scholar] [CrossRef]
  48. Bastida, F.; Jehmlich, N.; Martínez-Navarro, J.; Bayona, V.; García, C.; Moreno, J.L. The Effects of Struvite and Sewage Sludge on Plant Yield and the Microbial Community of a Semiarid Mediterranean Soil. Geoderma 2019, 337, 1051–1057. [Google Scholar] [CrossRef]
  49. Degryse, F.; Baird, R.; da Silva, R.C.; McLaughlin, M.J. Dissolution Rate and Agronomic Effectiveness of Struvite Fertilizers—Effect of Soil PH, Granulation and Base Excess. Plant Soil 2017, 410, 139–152. [Google Scholar] [CrossRef]
  50. Talboys, P.J.; Heppell, J.; Roose, T.; Healey, J.R.; Jones, D.L.; Withers, P.J.A. Struvite: A Slow-Release Fertiliser for Sustainable Phosphorus Management? Plant Soil 2016, 401, 109–123. [Google Scholar] [CrossRef]
  51. Li, B.; Boiarkina, I.; Yu, W.; Huang, H.M.; Munir, T.; Wang, G.Q.; Young, B.R. Phosphorous Recovery through Struvite Crystallization: Challenges for Future Design. Sci. Total Environ. 2019, 648, 1244–1256. [Google Scholar] [CrossRef]
  52. Arcas-Pilz, V.; Rufí-Salís, M.; Parada, F.; Petit-Boix, A.; Gabarrell, X.; Villalba, G. Recovered Phosphorus for a More Resilient Urban Agriculture: Assessment of the Fertilizer Potential of Struvite in Hydroponics. Sci. Total Environ. 2021, 799, 149424. [Google Scholar] [CrossRef] [PubMed]
  53. Robles-Aguilar, A.A.; Grunert, O.; Hernandez-Sanabria, E.; Mysara, M.; Meers, E.; Boon, N.; Jablonowski, N.D. Effect of Applying Struvite and Organic N as Recovered Fertilizers on the Rhizosphere Dynamics and Cultivation of Lupine (Lupinus angustifolius). Front. Plant Sci. 2020, 11, 572741. [Google Scholar] [CrossRef]
  54. Karpinska, A.; Ryan, D.; Germaine, K.; Dowling, D.; Forrestal, P.; Kakouli-Duarte, T. Soil Microbial and Nematode Community Response to the Field Application of Recycled Bio-Based Fertilisers in Irish Grassland. Sustainability 2021, 13, 12342. [Google Scholar] [CrossRef]
  55. Verstraete, W.; Mertens, B. Chapter 5. The Key Role of Soil Microbes. In Vital Soil; Doelman, P., Eijsackers, H.J.P., Eds.; Developments in Soil Science; Elsevier: Amsterdam, The Netherlands, 2004; Volume 29, pp. 127–157. [Google Scholar]
  56. Alkorta, I.; Aizpurua, A.; Riga, P.; Albizu, I.; Amézaga, I.; Garbisu, C. Soil Enzyme Activities as Biological Indicators of Soil Health. Rev. Environ. Health 2003, 18, 65–73. [Google Scholar] [CrossRef] [PubMed]
  57. Bowles, T.M.; Acosta-Martínez, V.; Calderón, F.; Jackson, L.E. Soil Enzyme Activities, Microbial Communities, and Carbon and Nitrogen Availability in Organic Agroecosystems across an Intensively-Managed Agricultural Landscape. Soil Biol. Biochem. 2014, 68, 252–262. [Google Scholar] [CrossRef]
  58. Nannipieri, P.; Kandeler, E.; Ruggiero, P. Enzyme Activities and Microbiological and Biochemical Processes in Soil. In Enzymes in the Environment; CRC Press: Boca Raton, FL, USA, 2002; pp. 1–34. [Google Scholar]
  59. Bending, G.D.; Turner, M.K.; Rayns, F.; Marx, M.C.; Wood, M. Microbial and Biochemical Soil Quality Indicators and Their Potential for Differentiating Areas under Contrasting Agricultural Management Regimes. Soil Biol. Biochem. 2004, 36, 1785–1792. [Google Scholar] [CrossRef]
  60. Sowerby, A.; Emmett, B.; Beier, C.; Tietema, A.; Peñuelas, J.; Estiarte, M.; Van Meeteren, M.J.M.; Hughes, S.; Freeman, C. Microbial Community Changes in Heathland Soil Communities along a Geographical Gradient: Interaction with Climate Change Manipulations. Soil Biol. Biochem. 2005, 37, 1805–1813. [Google Scholar] [CrossRef]
  61. Rutgers, M.; Schouten, A.J.; Bloem, J.; Van Eekeren, N.; De Goede, R.G.M.; Jagers Op Akkerhuis, G.A.J.M.; Van Der Wal, A.; Mulder, C.; Brussaard, L.; Breure, A.M. Biological Measurements in a Nationwide Soil Monitoring Network. Eur. J. Soil Sci. 2009, 60, 820–832. [Google Scholar] [CrossRef]
  62. Rutgers, M.; Wouterse, M.; Drost, S.M.; Breure, A.M.; Mulder, C.; Stone, D.; Creamer, R.E.; Winding, A.; Bloem, J. Monitoring Soil Bacteria with Community-Level Physiological Profiles Using BiologTM ECO-Plates in The Netherlands and Europe. Appl. Soil Ecol. 2016, 97, 23–35. [Google Scholar] [CrossRef]
  63. Zhao, F.; McGrath, S.P.; Crosland, A.R. Comparison of Three Wet Digestion Methods for the Determination of Plant Sulphur by Inductively Coupled Plasma Atomic Emission Spectroscopy (ICP-AES). Commun. Soil Sci. Plant Anal. 1994, 25, 407–418. [Google Scholar] [CrossRef]
  64. Inskeep, W.P.; Bloom, P.R. Extinction Coefficients of Chlorophyll a and b in N,N-Dimethylformamide and 80% Acetone. Plant Physiol. 1985, 77, 483–485. [Google Scholar] [CrossRef] [PubMed]
  65. Ainsworth, E.A.; Gillespie, K.M. Estimation of Total Phenolic Content and Other Oxidation Substrates in Plant Tissues Using Folin-Ciocalteu Reagent. Nat. Protoc. 2007, 2, 875–877. [Google Scholar] [CrossRef] [PubMed]
  66. MAPA. Métodos Oficiales de Análisis; Secretaria General Técnica, Ministerio de Agricultura, Pesca y Alimentación: Madrid, Spain, 1994; Volume III, pp. 219–324. [Google Scholar]
  67. Walkley, A.; Black, I.A. An examination of Degtjareff method for determining soil organic matter and a proposed modification of the chromic acid titration method. Soil Sci. 1934, 37, 29–38. [Google Scholar] [CrossRef]
  68. Olsen, S.R.; Cole, C.V.; Watanabe, F.S.; Dean, L.A. Estimation of Available Phosphorus in Soils by Extraction with Sodium Bicarbonate; USDA-Circular, 939; US Department of Agriculture: Washington, DC, USA, 1954.
  69. Katanda, Y.; Zvomuya, F.; Flaten, D.; Cicek, N. Hog-Manure-Recovered Struvite: Effects on Canola and Wheat Biomass Yield and Phosphorus Use Efficiencies. Soil Sci. Soc. Am. J. 2016, 80, 135–146. [Google Scholar] [CrossRef]
  70. Cabeza, R.; Steingrobe, B.; Römer, W.; Claassen, N. Effectiveness of Recycled P Products as P Fertilizers, as Evaluated in Pot Experiments. Nutr. Cycl. Agroecosystems 2011, 91, 173–184. [Google Scholar] [CrossRef]
  71. Achat, D.L.; Sperandio, M.; Daumer, M.L.; Santellani, A.C.; Prud’Homme, L.; Akhtar, M.; Morel, C. Plant-Availability of Phosphorus Recycled from Pig Manures and Dairy Effluents as Assessed by Isotopic Labeling Techniques. Geoderma 2014, 232–234, 24–33. [Google Scholar] [CrossRef]
  72. Bonvin, C.; Etter, B.; Udert, K.M.; Frossard, E.; Nanzer, S.; Tamburini, F.; Oberson, A. Plant Uptake of Phosphorus and Nitrogen Recycled from Synthetic Source-Separated Urine. Ambio 2015, 44, 217–227. [Google Scholar] [CrossRef]
  73. Thompson, L. Field Evaluation of the Availability for Corn and Soybean of Phosphorus Recovered as Struvite from Corn Fiber Processing for Bioenergy. Master’s Thesis, Iowa State University, Ames, IA, USA, 2013. [Google Scholar]
  74. Ackerman, J.N.; Zvomuya, F.; Cicek, N.; Flaten, D. Evaluation of Manure-Derived Struvite as a Phosphorus Source for Canola. Can. J. Plant Sci. 2013, 93, 419–424. [Google Scholar] [CrossRef]
  75. Vogel, T.; Nelles, M.; Eichler-Löbermann, B. Phosphorus Effects of Recycled Products from Municipal Wastewater on Crops in a Field Experiment. Plant Soil Environ. 2017, 63, 475–482. [Google Scholar] [CrossRef]
  76. Vogel, T.; Nelles, M.; Eichler-Löbermann, B. Phosphorus Application with Recycled Products from Municipal Waste Water to Different Crop Species. Ecol. Eng. 2015, 83, 466–475. [Google Scholar] [CrossRef]
  77. Benjannet, R.; Nyiraneza, J.; Khiari, L.; Cambouris, A.; Fuller, K.; Hann, S.; Ziadi, N. Potato Response to Struvite Compared with Conventional Phosphorus Fertilizer in Eastern Canada. Agron. J. 2020, 112, 1360–1376. [Google Scholar] [CrossRef]
  78. Achat, D.L.; Daumer, M.L.; Sperandio, M.; Santellani, A.C.; Morel, C. Solubility and Mobility of Phosphorus Recycled from Dairy Effluents and Pig Manures in Incubated Soils with Different Characteristics. Nutr. Cycl. Agroecosystems 2014, 99, 1–15. [Google Scholar] [CrossRef]
  79. Johnston, A.E.; Richards, I.R. Effectiveness of Different Precipitated Phosphates as Phosphorus Sources for Plants. Soil Use Manag. 2003, 19, 45–49. [Google Scholar] [CrossRef]
  80. Massey, M.S.; Davis, J.G.; Ippolito, J.A.; Sheffield, R.E. Effectiveness of Recovered Magnesium Phosphates as Fertilizers in Neutral and Slightly Alkaline Soils. Agron. J. 2009, 101, 323–329. [Google Scholar] [CrossRef]
  81. Ylivainio, K.; Lehti, A.; Jermakka, J.; Wikberg, H.; Turtola, E. Predicting Relative Agronomic Efficiency of Phosphorus-Rich Organic Residues. Sci. Total Environ. 2021, 773, 145618. [Google Scholar] [CrossRef] [PubMed]
  82. Huygens, D.; Saveyn, H.G.M. Agronomic Efficiency of Selected Phosphorus Fertilisers Derived from Secondary Raw Materials for European Agriculture. A Meta-Analysis. Agron. Sustain. Dev. 2018, 38, 52. [Google Scholar] [CrossRef]
  83. Prater, J. Improved Production of Magnesium Ammonium Phosphate (Struvite) from Landfill Leachate 2014 Final Report; University of Wisconsin: Madison, WI, USA, 2015. [Google Scholar]
  84. Perez, R.C.; Steingrobe, B.; Römer, W.; Claassen, N. Plant Availability of P Fertilizers Recycled from Sewage Sludge and Meat-and-Bone Meal in Field and Pot Experiments. In International Conference on Nutrient Recovery from Wastewater Streams; IWA Publishing: Vancouver, BC, Canada, 2009. [Google Scholar]
  85. Acosta-Martínez, V.; Cruz, L.; Sotomayor-Ramírez, D.; Pérez-Alegría, L. Enzyme Activities as Affected by Soil Properties and Land Use in a Tropical Watershed. Appl. Soil Ecol. 2007, 35, 35–45. [Google Scholar] [CrossRef]
  86. Sinsabaugh, R.L.; Lauber, C.L.; Weintraub, M.N.; Ahmed, B.; Allison, S.D.; Crenshaw, C.; Contosta, A.R.; Cusack, D.; Frey, S.; Gallo, M.E.; et al. Stoichiometry of Soil Enzyme Activity at Global Scale. Ecol. Lett. 2008, 11, 1252–1264. [Google Scholar] [CrossRef] [PubMed]
  87. Rietz, D.N.; Haynes, R.J. Effects of Irrigation-Induced Salinity and Sodicity on Soil Microbial Activity. Soil Biol. Biochem. 2003, 35, 845–854. [Google Scholar] [CrossRef]
  88. Nannipieri, P.; Giagnoni, L.; Landi, L.; Renella, G. Phosphorus in Action; Springer: Berlin/Heidelberg, Germany, 2011; Volume 26, pp. 215–243. [Google Scholar] [CrossRef]
  89. Allison, V.J.; Condron, L.M.; Peltzer, D.A.; Richardson, S.J.; Turner, B.L. Changes in Enzyme Activities and Soil Microbial Community Composition along Carbon and Nutrient Gradients at the Franz Josef Chronosequence, New Zealand. Soil Biol. Biochem. 2007, 39, 1770–1781. [Google Scholar] [CrossRef]
  90. Eivazi, F.; Tabatabai, M.A. Factors Affecting Glucosidase and Galactosidase Activities in Soils. Soil Biol. Biochem. 1990, 22, 891–897. [Google Scholar] [CrossRef]
  91. Melero, S.; López-Garrido, R.; Murillo, J.M.; Moreno, F. Conservation Tillage: Short- and Long-Term Effects on Soil Carbon Fractions and Enzymatic Activities under Mediterranean Conditions. Soil Tillage Res. 2009, 104, 292–298. [Google Scholar] [CrossRef]
  92. Derrien, D.; Marol, C.; Balesdent, J. The Dynamics of Neutral Sugars in the Rhizosphere of Wheat. An Approach By13C Pulse-Labelling and GC/C/IRMS. Plant Soil 2004, 267, 243–253. [Google Scholar] [CrossRef]
  93. Zhang, X.; Dippold, M.A.; Kuzyakov, Y.; Razavi, B.S. Spatial Pattern of Enzyme Activities Depends on Root Exudate Composition. Soil Biol. Biochem. 2019, 133, 83–93. [Google Scholar] [CrossRef]
  94. Bandick, A.K.; Dick, R.P. Field Management Effects on Soil Enzyme Activities. Soil Biol. Biochem. 1999, 31, 1471–1479. [Google Scholar] [CrossRef]
  95. Li, J.; Tong, X.; Awasthi, M.K.; Wu, F.; Ha, S.; Ma, J.; Sun, X.; He, C. Dynamics of Soil Microbial Biomass and Enzyme Activities along a Chronosequence of Desertified Land Revegetation. Ecol. Eng. 2018, 111, 22–30. [Google Scholar] [CrossRef]
  96. Dodgson, K.S.; White, G.F.; Fitzgerald, J. Sulfatases of Microbial Origin; CRC Press: Boca Raton, FL, USA, 1982. [Google Scholar]
  97. Deng, S.P.; Tabatabai, M.A. Effect of Tillage and Residue Management on Enzyme Activities in Soils: III. Phosphatases and Arylsulfatase. Biol. Fertil. Soils 1997, 24, 141–146. [Google Scholar] [CrossRef]
  98. Ryan, D.; Karpinska, A.; Forrestal, P.J.; Ashekuzzaman, S.M.; Kakouli-Duarte, T.; Dowling, D.N.; Germaine, K.J. The Impact of Bio-Based Fertilizer Integration Into Conventional Grassland Fertilization Programmes on Soil Bacterial, Fungal, and Nematode Communities. Front. Sustain. Food Syst. 2022, 6, 1–17. [Google Scholar] [CrossRef]
  99. Cregut, M.; Piutti, S.; Vong, P.C.; Slezack-Deschaumes, S.; Crovisier, I.; Benizri, E. Density, Structure, and Diversity of the Cultivable Arylsulfatase-Producing Bacterial Community in the Rhizosphere of Field-Grown Rape and Barley. Soil Biol. Biochem. 2009, 41, 704–710. [Google Scholar] [CrossRef]
  100. Cregut, M.; Piutti, S.; Slezack-Deschaumes, S.; Benizri, E. Compartmentalization and Regulation of Arylsulfatase Activities in Streptomyces Sp., Microbacterium Sp. and Rhodococcus Sp. Soil Isolates in Response to Inorganic Sulfate Limitation. Microbiol. Res. 2013, 168, 12–21. [Google Scholar] [CrossRef]
  101. Degens, B.P.; Harris, J.A. Development of a Physiological Approach to Measuring the Catabolic Diversity of Soil Microbial Communities. Soil Biol. Biochem. 1997, 29, 1309–1320. [Google Scholar] [CrossRef]
  102. Winding, A.; Hendriksen, N.B. Comparison of CLPP and Enzyme Activity Assay for Functional Characterization of Bacterial Soil Communities. J. Soils Sediments 2007, 7, 411–417. [Google Scholar] [CrossRef]
Figure 1. Crop yields with different fertilizer treatments. (a) Dry Matter Yield (g kg−1 soil) in the three crops. Bars (standard deviation) with the same letter are not significantly different (p < 0.05, Duncan’s test); uppercase for the first crop, lowercase for the second crop, and italic for the third crop. (b) Cumulative Dry Matter Yield (g kg−1 soil) for the fertilizers. Bars with the same letters are not significantly different between the treatments (p < 0.05, Duncan’s test).
Horticulturae 09 00645 g001
Figure 2. Chlorophyll content in the lettuce leaves. Bars indicate standard deviation.
Horticulturae 09 00645 g002
Figure 3. Phenolic compounds in the lettuce leaves. Bars indicate standard deviation.
Horticulturae 09 00645 g003
Figure 4. Phosphorus uptake (mg P kg−1 soil) by the lettuce shoots (above-ground biomass). Bars with the same letter are not significantly different (p < 0.05, Duncan’s test); uppercase for the first crop, lowercase for the second crop, and italic for the third crop.
Horticulturae 09 00645 g004
Figure 5. Relative agronomic efficiency (RAE) of struvite for DMY (A) and for PU (B).
Horticulturae 09 00645 g005
Figure 6. Soil enzyme activities ((a) β-Glucosidase, (b) β-Galactosidase, (c) Acid phosphatase, (d) Alkaline phosphatase, (e) Urease, (f) Arylsulfatase) and substrate-induced respiration (SIR) (g) at the end of the third harvest leaf lettuce. Values are means (n = 3). Different letters represent significant differences between the treatments at p < 0.05.
Horticulturae 09 00645 g006
Figure 7. Shannon diversity index (H´) calculated from the average color development data obtained with EcoPlates TM at 96 h incubation time. Values are means (n = 3). Different letters represent significant differences between the treatments at p < 0.05.
Horticulturae 09 00645 g007
Table 1. Soil physico-chemical characteristics, nutrient, and heavy metal content.
pHECNOMPCaMgNaKPbCdCuNiZnCr
dS/m%%mg/kg
Soil8.57 ± 0.050.22 ± 0.070.15 ± 0.0041.49 ± 0.03 29 ± 2 2877 ± 46310 ± 2317 ± 9379 ± 4319 ± 1<DL16 ± 113 ± 152 ± 557 ± 2
Note: EC: Electrical conductivity; OM: Organic matter; DL: Detection level.
Table 2. Main physico-chemical characteristics of fertilizers.
STRNPKMAPSSP
Water soluble P2O5 (%)1.314.146.517.5
Citrate-soluble P2O5 (%)22.315.261.618.0
Soluble in mineral acids P2O5 (%)28.815.161.519.2
Total N (%)5.714.412.20.5
Ammonium N (%)5.514.111.90.3
Nitrate N (%)0.10.20.20.1
Ureic N (%)<1.0<1.0<1.0<1.0
K water soluble (in K2O) (%)<1.015.3<1<1
Cd (mg/kg DM)<0.5<0.5<0.518.5
Cu (mg/kg DM)<20.0<20.0<20.021.5
Cr (mg/kg DM)<10.0<10.0<10.038.0
Hg (mg/kg DM)<0.4<0.4<0.4<0.4
Ni (mg/kg DM)<5.0<5.0<5.031.6
Pb (mg/kg DM)<5.0<5.0<5.0<5.0
Zn (mg/kg DM)<25.0<25.0<25.0286
As (mg/kg DM)<2.0<2.0<2.05
B (mg/kg DM)<4.0<4.0<4.019.2
Mo (mg/kg DM)<0.5<0.5<0.517.9
Mn (mg/kg DM)36.2142.0<10.020.5
Table 3. Nutrient content in the lettuce in the different crops. Different letters indicate significant differences (p < 0.05, Duncan’s test).
N (%)Ca (mg/kg)Mg (mg/kg)Na (mg/kg)K (mg/kg)P (mg/g)
1st cropNPK3.29 ± 0.1812,946 ± 5513140 ± 567 a1335 ± 601114,122 ± 14,8494.48 ± 0.31 a
STR3.51 ± 0.2212,750 ± 4713273 ± 26 ab891 ± 317104,835 ± 28455.09 ± 0.32 a
MAP3.08 ± 0.4112,936 ± 13244390 ± 444 b1338 ± 461100,234 ± 11,8277.57 ± 0.88 b
SSP3.36 ± 0.0813,854 ± 18884263 ± 351 b1213 ± 369119,833 ± 44346.46 ± 0.69 ab
2nd cropNPK3.78 ± 0.169793 ± 23593339 ± 190898 ± 352106,764 ± 60276.11 ± 0.85 a
STR3.63 ± 0.3210,010 ± 26143355 ± 5141135 ± 20999,485 ± 46566.68 ± 0.20 a
MAP3.70 ± 0.2811,705 ± 27363973 ± 5281657 ± 102296,080 ± 11,3806.72 ± 0.38 a
SSP3.69 ± 0.4613,487 ± 9653896 ± 791161 ± 21696,646 ± 80487.06 ± 0.33 a
3rd cropNPK3.35 ± 0.2514,843 ± 29463727 ± 5921795 ± 52184,791 ± 68943.47 ± 0.14 a
STR3.35 ± 0.1611,619 ± 7043311 ± 1961769 ± 38783,875 ± 57064.40 ± 0.28 b
MAP3.15 ± 0.2512,084 ± 25463424 ± 1391904 ± 62271,374 ± 12,6264.64 ± 0.33 b
SSP3.14 ± 0.2911,952 ± 9683299 ± 1982016 ± 39178,564 ± 57684.95 ± 0.28 b
Table 4. Physico-chemical soil parameters after the crops. Different letters indicate significant differences between the treatments in the same crop (p < 0.05, Duncan’s test).
pHC.E.NPCaMgNaKPbCdCuNiZnCr
dS/m%mg/kg
1st cropNPK8.02 ± 0.230.544 ± 0.162 ab0.16 ± 0.0268 ± 8 a3065 ± 258383 ± 28 a37 ± 9549 ± 8815 ± 3.86<DL16 ± 0.5012 ± 0.5847 ± 2.3837 ± 4.51
STR8.32 ± 0.110.212 ± 0.031 a0.16 ± 0.0183 ± 21 a2787 ± 59456 ± 10 c25 ± 3407 ± 714 ± 3.50<DL15 ± 0.5012 ± 0.5046 ± 2.2234 ± 1.50
MAP8.26 ± 0.160.397 ± 0.246 ab0.17 ± 0.04136 ± 52 a2666 ± 95402 ± 6 b36 ± 13453 ± 10114 ± 1.29<DL14 ± 0.5014 ± 1.2947 ± 0.8236 ± 1.29
SSP8.09 ± 0.180.571 ± 0.101 b0.15 ± 0.01103 ± 39 a2882 ± 266413 ± 26 b41 ± 15442 ± 6013 ± 0.50<DL15 ± 0.5012 ± 0.5048 ± 1.6334 ± 1.26
2nd cropNPK8.17 ± 0.070.503 ± 0.1690.14 ± 0.0140 ± 5 a2859 ± 250358 ± 1232 ± 7363 ± 4216 ± 0.50<DL16 ± 0.5013 ± 0.5056 ± 1.7135 ± 0.82
STR8.23 ± 0.080.375 ± 0.0910.15 ± 0.0182 ± 9 c3081 ± 125404 ± 3032 ± 6354 ± 3916 ± 0.58<DL16 ± 0.5812 ± 0.5851 ± 4.0834 ± 9.11
MAP8.38 ± 0.230.324 ± 0.0920.14 ± 0.0169 ± 13 bc3130 ± 172390 ± 2345 ± 3301 ± 4516 ± 0.50<DL17 ± 1.7113 ± 2.0651 ± 3.5033 ± 4.51
SSP8.15 ± 0.280.544 ± 0.2790.14 ± 0.0268 ± 12 b3220 ± 271401 ± 5347 ± 26322 ± 6517 ± 0.00<DL17 ± 0.5811 ± 0.5855 ± 2.0035 ± 0.58
3rd cropNPK8.03 ± 0.160.493 ± 0.2910.15 ± 0.0146 ± 8 a3097 ± 166411 ± 3944 ± 21316 ± 5219 ± 0.58<DL16 ± 0.5015 ± 2.2256 ± 0.9636 ± 4.04
STR8.16 ± 0.140.379 ± 0.0840.15 ± 0.0161 ± 10 b2830 ± 170452 ± 5649 ± 11271 ± 1819 ± 0.50<DL16 ± 0.5014 ± 0.5055 ± 0.9639 ± 3.10
MAP8.04 ± 0.260.694 ± 0.3100.15 ± 0.0266 ± 4 b3083 ± 165456 ± 968 ± 24247 ± 3619 ± 1.26<DL18 ± 2.0618 ± 8.6857 ± 2.1637 ± 5.29
SSP8.08 ± 0.150.594 ± 0.1980.14 ± 0.0161 ± 5 b2847 ± 244433 ± 1761 ± 16256 ± 35 19 ± 1.83<DL16 ± 0.5814 ± 1.0057 ± 1.8939 ± 5.19
Table 5. Metabolic fingerprints of carbon substrate utilization patterns in Biolog EcoPlatesTM at an incubation time of 96 h. Different letters indicate significant differences between the treatments in the same crop (p < 0.05, Duncan’s test).
NPKSTRMAPSSP
Amino acidsL-Threonine0.413 a0.297 b00
L-Serine0.730 b0.751 b0.997 a0.243 c
L-Asparagine1.157 b1.412 a1.152 b0.543 b
L-Arginine0.498 b0.920 a0.457 b0.464 b
AminesPutrescine0.458 a0.553 a0.326 b0.229 b
Phenylethyl-amine0.611 a0.470 b00
Phenolic compounds4-Hydroxy Benzoic Acid0.401 b0.822 a0.358 b0.488 b
CarbohydratesD-Galactonic Acid γ-Lactone0.414 c0.710 a0.502 b0.563 b
Glucose-1-Phosphate0.483 a0.521 a00
N-Acetyl-D-Glucosamine0.308 c0.540 ab0.589 a0.475 b
D-Mannitol0.783 b0.919 a0.815 ab0.747 b
β-Methyl-D-Glucoside0.326 a0.319 a00
Carboxylic acidsD-Glucosaminic Acid0.486 c0.759 a0.534 b0.453 c
Pyruvic Acid Methyl Ester0.689 b0.888 a0.682 b0.637 b
D-Malic Acid0.340 a0.338 a0.211 b0
γ-Hydroxybutyric Acid0.430 b0.876 a00
D-Galacturonic Acid1.726 a1.480 b1.650 a0.865 c
PolymersTween 801.049 a1.083 a0.904 b0.521 c
Tween 400.689 b0.888 a0.882 a0.637 b
Disclaimer/Publisher’s Note: The statements, opinions and data contained in all publications are solely those of the individual author(s) and contributor(s) and not of MDPI and/or the editor(s). MDPI and/or the editor(s) disclaim responsibility for any injury to people or property resulting from any ideas, methods, instructions or products referred to in the content.

