Article

Effects of LED Red and Blue Spectra Irradiance Levels and Nutrient Solution EC on the Growth, Yield, and Phenolic Content of Lemon Basil (Ocimum citriodurum Vis.)

by
Zurafni Mat Daud
1,
Mohd Firdaus Ismail
1 and
Mansor Hakiman
1,2,*
1
Department of Crop Science, Faculty of Agriculture, Universiti Putra Malaysia, Serdang 43400 UPM, Selangor, Malaysia
2
Laboratory of Sustainable Resources Management, Institute of Tropical Forestry and Forest Products, Universiti Putra Malaysia, Serdang 43400 UPM, Selangor, Malaysia
*
Author to whom correspondence should be addressed.
Horticulturae 2023, 9(4), 416; https://doi.org/10.3390/horticulturae9040416
Submission received: 6 January 2023 / Revised: 6 February 2023 / Accepted: 9 February 2023 / Published: 23 March 2023
(This article belongs to the Special Issue Effects of Light Quantity and Quality on Horticultural Crops)

Abstract

:
This research was conducted to study the effects of LED red and blue spectra irradiance levels and nutrient solution (electrical conductivity) and their interaction on the plant growth, yield, and phytochemical contents of lemon basil (Ocimum citriodorum Vis.) in a controlled environment. The controlled environment was equipped with red and blue spectra at a 4:1 ratio with irradiance levels of 80 and 160 µmol m−2 s−1 and irrigated with four different nutrient solution ECs at 1.0, 1.8, 2.6, and 3.4 mS cm−1, cultivated on a vertical structure. The temperature and relative humidity of the controlled environment and the pH of the nutrient solution were maintained at 26 and 18 °C day and night, 65 ± 5%, and pH 6, respectively. It was observed that plant height, canopy diameter, and the number of leaves of lemon basil had significantly increased under the irradiance levels of 160 µmol m−2 s−1 in combination with a nutrient solution EC of 2.6 mS cm−1. In addition, there was an interaction observed between the LED irradiance levels and the nutrient solution EC on the fresh weight of the stem and the dry weight of all the plant parts (leaves, stem, and roots). Lemon basil cultivated at 160 µmol m−2 s−1 and irrigated with 2.6 mS cm−1 was significantly higher in fresh stem weight and dry leaf, stem, and root weight at 17.36, 1.79, 1.82, and 0.22 g, respectively. The ascorbic acid of lemon basil was significantly higher under a treatment of 160 µmol m−2 s−1 irradiance level and an EC of 2.6 mS cm−1, and no interaction was observed. At the same time, there was an interaction observed between the LED irradiance level and the nutrient solution EC on the total phenolic content (TPC), total flavonoid content (TFC), and caftaric acid concentration of lemon basil. Lemon basil cultivated at 160 µmol m−2 s−1 and irrigated with 2.6 mS cm−1 was significantly higher in TPC, TFC, and caftaric acid concentration, with 1440.62 mg gallic acid equivalent to 100 g−1 DW, 1148.79 mg quercetin equivalent to 100 g−1 DW, and 2812.50 mg 100 g−1 DW, respectively. This result indicates that the irradiance levels of red and blue LED spectra at 160 µmol m−2 s−1 and irrigated with a nutrient solution EC of 2.6 mS cm−1 enhances the growth, yield production, and phenolic content of lemon basil in a controlled environment facility.

1. Introduction

Lemon basil (Ocimum citriodorum Vis.) is an ornamental, culinary, and medicinal herb that is planted widely and has flourished under a variety of planting conditions [1]. The species belong to the family Lamiaceae and contains an abundant source of phenolic compounds. Phenolic compounds, such as rosmarinic, chicoric, caffeic, and caftaric acids, have been reported to be obtained (in vast concentrations) from various basil cultivars [2,3,4], which have been documented to be a rich source of antioxidants [2]. The leaves have been used, either fresh or dried, as spices. Meanwhile, the essential oil extracted from basil can be used as an aromatic additive in food, pharmaceuticals, and cosmetics [4]. Usually, basil is cultivated in open fields, and the United States is known to be the largest producer and importer of basil in the world [5]. However, the yield and quality in terms of phytochemical contents are hard to control, and it varies with season, cultivar, and cultivation location [6,7,8].
Indoor vertical farming, known as “plant factory”, is a highly controlled environmental system for plant production that uses multiple-layer culture shelves with artificial lighting [9,10]. Light is one of the most important environmental factors that affect plant development and regulate plant behavior, depending on the light quality, quantity, direction, and duration [11,12,13,14]. Light quantity is known as the irradiance level of light. The irradiance levels of red and blue LEDs significantly affect lemon basil growth and development. Red light seems to be more effective in improving photosynthesis compared to blue or green light [12]. In contrast, blue light has been shown to lead to an increase in ascorbic acid, phenolic contents, and chlorophyll in various species [15]. Darko et al. [16] stated that a combination of red and blue light is more efficient than monochromatic light. In indoor-grown basil and lettuce, a range of optimal intensities is used, ranging from 50–150 [17]. In addition, lettuce can be grown under light intensities ranging from 40–200, leading to increases in ascorbic acid, phenolic, carotenoid, tocopherol, flavonoids, glucosinolate, and anthocyanin content and reduced postharvest decay [18,19,20,21,22].
In addition, irrigation systems are one of the most important parts of controlled environment systems that use hydroponic systems. The nutrient solution (electrical conductivity) supplied to the plants plays a crucial role as it significantly affects plant growth performance, such as stem height and dry weight, and can also influence plant appearance, nutritional values, and the shelf life of plants [23,24]. Supplementing with a high level of electrical conductivity in the nutrient solution has been said to stimulate ion toxicity, osmotic stress, and nutrient disparity, while insufficient electrical conductivity, in general, leads to nutrient scarcity [25]. According to Vendrame et al. [26] and Poorter and Nagel [27], nutrient uptake is generally affected by irradiance levels (photosynthetic photon-flux density). A previous study by Lu et al. [28] showed that the growth parameters and anthocyanin concentration of red and blue perilla were higher under high light intensity (PPFD) and EC. However, the rosmarinic acid concentration was higher under the lowest EC with high light intensity. Samarakoon et al. [29] stated that plants supplemented with nutrient solution at an electrical conductivity of 2.0 to 3.0 mS cm−1 provide the optimum rate for better plant growth performance. However, farmers tended to over or undersupply the nutrient solution, which impacted plant growth performance, yield production, and quality.
The red and blue spectra irradiance levels of LEDs significantly affected lemon basil growth and development. However, there is scarce information on the interaction between the irradiance levels of LEDs with red and blue spectra and the EC of the nutrient solution in regulating herb production and the accumulation of phytochemical contents. Therefore, the current study was implemented to ascertain the changes in growth, yield production, and quality in terms of the phytochemical contents of lemon basil plants in response to different combinations of irradiance levels of LEDs of red and blue spectra and the EC of the nutrient solution. The study envisages the possibility of providing valuable insights into the regulation of the irradiance levels of LEDs with red and blue spectra and the EC of the nutrient solution in attempts to improve the growth performance, yield production, and phytochemical contents of lemon basil grown under vertical structures in a hydroponic system in a controlled environment facility.

2. Materials and Methods

2.1. Plant Materials and Treatments

The research was conducted in a controlled environment growth room at the Faculty of Agriculture, Universiti Putra Malaysia. Seeds of lemon basil (Ocimum citriodorum Vis.) were germinated and raised in peat moss. On day 14, the seedlings were transplanted into a pot (3.5 × 5.0 × 5.7 cm) and placed on the vertical structure in a growth room. The seedlings were grown in a closed-circulating water culture under two different irradiance levels of LEDs (brand Philips) and supplied by Elite Scientific Instruments Sdn. Bhd. (80 and 160 µmol m−2 s−1) with red and blue spectra in a ratio of 4:1. The essential nutrient solution in each tank was set at different electrical conductivity (EC) values: 1.0, 1.8, 2.6, and 3.4 mS cm−1, which were regularly checked using an EC meter (DIST 4 EC Meter by Hanna Instruments) (Table 1) (FERTITRADE, Petaling Jaya, Malaysia). The growth chamber’s relative humidity and day/night temperature during the study were 65 ± 5% and 26/18 °C, respectively. The photoperiod was set up for 14 h (06.00 a.m. to 08.00 p.m.). The pH value of the nutrient solution was amended to 6.0 and maintained throughout the experiment.

2.2. Plant Growth Measurement

Data on lemon basil height, canopy diameter, and the number of leaves were collected at three-day intervals for 30 days after transplanting (DAT). Lemon basil height was evaluated using a ruler from the sponge surface to the shoot tip. Each plant was viewed from all sides for the plant canopy to determine the side where the canopy was broadest. The distance between the two opposite sites was recorded as the canopy width (cm) and was measured with a ruler, and the number of leaves was counted manually.

2.3. Yield Parameters

Three plants from each experimental unit were harvested and separated into three different parts: leaf, stem, and root, and the fresh weight was taken. The leaf area of detached leaves was measured (before dry mass measurement) using a leaf area meter (LI-300 LI-COR, USA) and expressed as cm2 plant−1. Leaf, stem, and root were oven-dried at 65 °C for three days, and the dry mass of leaves, stem, and roots was recorded.

2.4. Phytochemical Contents

2.4.1. Ascorbic Acid

Approximately 0.2 g of a fresh lemon basil leaf was weighed and put in mortar. Then, 2 mL of 10% (v/v) trichloroacetic acid was added and homogenized under dull light and on ice for cold conditions using a pestle. The prepared sample was then centrifuged for 10 min at 4 °C at 5000 rpm. Subsequently, 0.3 mL of supernatant was added with 0.2 mL of 10% (v/v) Folin-Ciocalteu reagent and 1.7 mL distilled water. The absorbance was measured at 760 nm using a UV-Vis spectrophotometer. A standard curve was arranged using several concentrations of ascorbic acid from 0 to 60 µg ml−1 [30]. The determination of ascorbic acid was carried out in triplicate.

2.4.2. Sample Extraction for Total Phenolic Content and Total Flavonoid Content

About 0.5 g of dried lemon basil leaves was extracted in 10 mL of 80% (v/v) methanol by shaking for 4 h at room temperature. Then the samples were centrifuged for 30 min at 13,200 rpm. The methanolic extract was stored at −20 °C for further analysis of total phenolic contents and total flavonoid contents [31].

2.4.3. Total Phenolic Content

Total phenolic contents of lemon basil were established using a modified Folin–Ciocalteu colorimetric assay [32]. A combination of 1 mL of methanolic extract, 0.525 mL Folin–Ciocalteu reagent, 0.945 mL of distilled water, and 2.625 mL of 2.1% (w/v) aqueous sodium carbonate were prepared and incubated for 20 min in the dark at room temperature. The absorbance of the samples was measured using a UV-Vis spectrophotometer at 735 nm against a blank solution containing 0.21 mL of 80% (v/v) methanol, 1.89 mL of distilled water, and 0.525 mL of 2.1% (w/v) aqueous sodium carbonate. Total phenolic content was computed by comparing the sample absorbance to a calibration curve of gallic acid. The value of total phenolic content was expressed as gallic acid equivalents (GAE) mg 100 g−1 dry weight. The equation of calibration curve was expressed as y = 1.8185x + 0.1359 (R2 = 0.9958).

2.4.4. Total Flavonoid Content

For total flavonoid content analysis, about 1 mL of methanolic extract was added to 0.3 mL of 5% (w/v) sodium nitrite and incubated at room temperature for 5 min. Afterward, 0.3 mL of 10% (w/v) aluminum chloride and 2 mL of 1 N sodium hydroxide were added, and the total volume was made up to 5 mL with distilled water. The samples were measured using a UV-Vis spectrophotometer at an absorbance of 510 nm. The calibration curve was prepared using quercetin, and the total flavonoid contents were then calculated using this calibration curve. Then the total flavonoid content was expressed as mg quercetin equivalents 100 g−1 dry weight [33]. The equation of calibration curve was expressed as y = 0.0783x + 0.0676 (R2 = 0.9845).

2.5. Individual Phenolic Compounds

Methanolic lemon basil extracts were sieved using a 0.22 µm Whatman nylon filter and then analyzed for rosmarinic, chicoric, caftaric, and gentisic acids using a prescribed method by Flanigan and Niemeyer [34] on a Waters dual-pump high-performance liquid chromatography (HPLC) using a Waters C-18 Symmetry column (Milford, MA). The detection wavelength was 330 nm. Eluent A was 3% (v/v) methanol and 1% (v/v) formic acid in waters, and eluent B was 0.1% (v/v) formic acid in acetonitrile. The linear gradient was used with a mobile phase flow rate of 0.1 mL/minute: hold at 95% A, 0–2 min; 95–75% A, 2–12 min; hold at 75% A, 12–17 min; 75–10% A, 17–18 min; hold at 10% A, 18–23 min; 10–95% A, 23–24 min; equilibrate at 95% A, 24–34 min. The phenolic compound was identified in the aqueous methanolic lemon basil extracts by comparison of chromatographic retention times against analytical standards. The phenolic compound was quantified by comparing integrated peak areas to standard calibration curves: chicoric and caftaric acids = 0.26–50.0 mg/L, rosmarinic acid = 0.11–75.0 mg/L, and gentisic acid= 0.87–65.0 mg/L.

2.6. Experimental Design and Statistical Analysis

The treatments were arranged as a randomized complete block design (RCBD) with four replications with 2 factorials (irradiance levels of the LEDs and the EC of the nutrient solution). All data collected were analyzed using a statistical analysis system [35]. Analysis of variance (ANOVA) was conducted, and significant differences among the treatments were determined using Duncan multiple range test (DMRT) at p ≤ 0.05.

3. Results

3.1. Growth Parameters

3.1.1. Plant Height

The performance of the lemon basil cultivated under different red and blue spectra irradiance levels of LEDs and different electrical conductivities of the nutrient solution are shown in Figure 1, which indicates that the growth pattern is well-fitted to the growth function of y = A/(1 + be−cx). Plants grown under all treatments had no significant differences in plant height at Day 3 until Day 18 after transplantation.
Meanwhile, on Day 21, the plant height of the lemon basil was affected by the red and blue spectra irradiance levels of the LEDs and the EC of the nutrient solution, but no interaction effect was observed between both. The interaction effects between the irradiance levels and EC of nutrient solution were observed on Days 24 and 27 after transplant. The plants raised on irradiance levels of 160 µmol m−2 s−1 and irrigated at an EC of 1.8 mS cm−1 and 2.6 mS cm−1 were higher in height compared to other treatments.

3.1.2. Canopy Diameter

The interactions on the effects of the red and blue spectra irradiance levels of the LEDs and the nutrient solution electrical conductivity on the expansion of the canopy were recorded. The interactions were revealed by the changes in canopy diameter of the plants at all measurement dates. The canopy diameter of lemon basil grown under irradiance levels of 160 µmol m−2 s−1 and irrigated with an EC of 2.6 mS cm−1 and 160 µmol m−2 s−1: 1.8 mS cm−1 were prominently wider than that of the plants grown under other treatments (Figure 2).

3.1.3. Number of Leaves

The leaves number of the lemon basil expanded exponentially resulting from the function y = Aebx days after transplanting (Figure 3). The number of lemon basil leaves cultivated on red and blue spectra irradiance levels of 160 µmol m−2 s−1 and irrigated with an EC of 3.4 mS cm−1, 160 µmol m−2 s−1:2.6 mS cm−1 and 160 µmol m−2 s−1:1.8 mS cm−1 were higher compared to other treatments due to higher rates in the rise of leaf production. The number of lemon basil leaves cultivated on irradiance levels of 160 µmol m−2 s−1 and irrigated with an EC of 2.6 and 3.4 mS cm−1 were both were recorded at 180, while 1.8 mS cm−1 was recorded at 160, with the other treatments in the range of 70 to 118.

3.2. Yield Parameters

3.2.1. Fresh Weight

Table 2 shows the fresh weight of the three plant parts: leaves, stem, and roots of the lemon basil, as affected by LED irradiance levels and nutrient solution electrical conductivity (EC). The fresh weight of the leaves, stem, and roots increased with increasing irradiance levels and nutrient solution EC. Interaction effects were observed between the irradiance levels and the EC of the nutrient solution on the fresh stem weight of the lemon basil (Figure 4). However, there were significant differences for both treatments on the leaves and roots. Plants cultivated at an irradiance level of 160 µmol m−2 s−1 produced a higher fresh weight for the leaves and roots. Plants supplemented with an EC of 2.6 mS cm−1 also produced a higher fresh weight for both parts when compared with other ECs. Plants grown under 160 µmol m−2 s−1 produced 60% and 55% higher leaf and root fresh weights than those from 80 µmol m−2 s−1.
There is an interaction effect observed on the application of various LEDs and nutrient solution ECs on fresh stem weight (Figure 4). The application of various nutrient solution ECs at 80 µmol m−2 s−1 did not produce a significant difference in the stem weight of the lemon basil. However, the fresh weight of the stem increased when the EC of the nutrient solution increased at 160 µmol m−2 s−1. The highest fresh stem weight was observed at irradiance levels of 160 µmol m−2 s−1 in combination with a nutrient solution EC of 2.6 mS cm−1. The application of a higher nutrient solution EC of 3.4 mS cm−1 decreased the fresh weight of the lemon basil stem.

3.2.2. Dry Weight

The consequences of LED irradiance levels and the nutrient solution EC on the dry weight of lemon basil (leaves, stem, and roots) are shown in Table 3. The interaction effects observed between the irradiance levels and the nutrient solution EC on the dry weight of the three different parts of lemon basil are shown in Figure 5. An increase in nutrient solution EC caused an increase in the dry weight of the leaves, stem, and roots at both LED irradiance levels. However, further increases in nutrient solution EC up to 3.4 mS cm−1 at 160 µmol m−2 s−1 reduced the dry weight of all parts of the plants.
The highest dry weight of the leaves was observed at 160 µmol m−2 s−1 in combination with 1.8 and 2.6 mS cm−1 with 1.97 and 1.79 g (Figure 5a), respectively; the dry weight of the stems at 160 µmol m−2 s−1 with 2.6 mS cm−1 was 1.82 g (Figure 5b), and the dry weight of the roots at 160 µmol m−2 s−1 in combination with 1.0, 1.8, and 2.6 mS cm−1 produced 0.65, 0.66, and 0.63 g (Figure 5c), respectively. In contrast, the lowest dry weight of all parts was observed at LED irradiance levels of 80 µmol m−2 s−1 and in combination with all EC levels except for 3.4 mS cm−1.

3.2.3. Leaf Area

Table 4 illustrates the effects of red and blue spectra irradiance levels of LEDs and the nutrient solution ECs on leaf area in lemon basil. No interaction was observed between the irradiance levels and nutrient solution EC, but there were significant differences in both of the main effects. The leaf area of lemon basil grown under an irradiance level of 160 µmol m−2 s−1 was significantly (p < 0.001) the highest with 1020.62 cm²/plant, which is 65% higher than 80 µmol m−2 s−1. In addition, the lemon basil irrigated with a nutrient solution EC of 1.8 mS cm−1 also produced a greater leaf area (p < 0.001) compared with other EC levels with 943.23 cm2/plant.

3.3. Phytochemical Contents

3.3.1. Ascorbic Acid

Table 5 shows the ascorbic acid contents of the lemon basil grown under varying LED red and blue spectra irradiance levels and nutrient solution ECs. Significant interactions were not observed between the irradiance levels and the nutrient solution EC on the ascorbic acid contents in lemon basil. However, the ascorbic acid contents in the lemon basil grown under LED red and blue spectra irradiance levels at 160 µmol m−2 s−1 were significantly higher than those obtained at 80 µmol m−2 s−1. In addition, the lemon basil fertilized with an EC of 2.6 mS cm−1 was also higher in ascorbic acid contents than with other ECs. The lowest contents were observed at 1.0 (67.43 mg 100−1 g FW).

3.3.2. Total Phenolic Content

Table 5 shows the lemon basil’s TPC as affected by LED red and blue spectra irradiance levels and nutrient solution EC. The interaction between the irradiance levels and the solution EC significantly influenced TPC (Figure 6). Increasing nutrient solution EC increased the TPC at both irradiance levels of 80 and 160 µmol m−2 s−1. Plants grown at irradiance levels of 160 µmol m−2 s−1 in combination with a nutrient solution EC of 2.6 mS cm−1 significantly increased in TPC compared to other levels with 1440.62 mg GAE 100 g−1 DW (Figure 6), and the lowest was observed at an irradiance level of 80 µmol m−2 s−1 and in combination with an EC level of 1.0 mS cm−1 at 491.56 mg GAE 100 g−1 DW. However, there was no difference with 160 µmol m−2 s−1:3.4 mS cm−1.

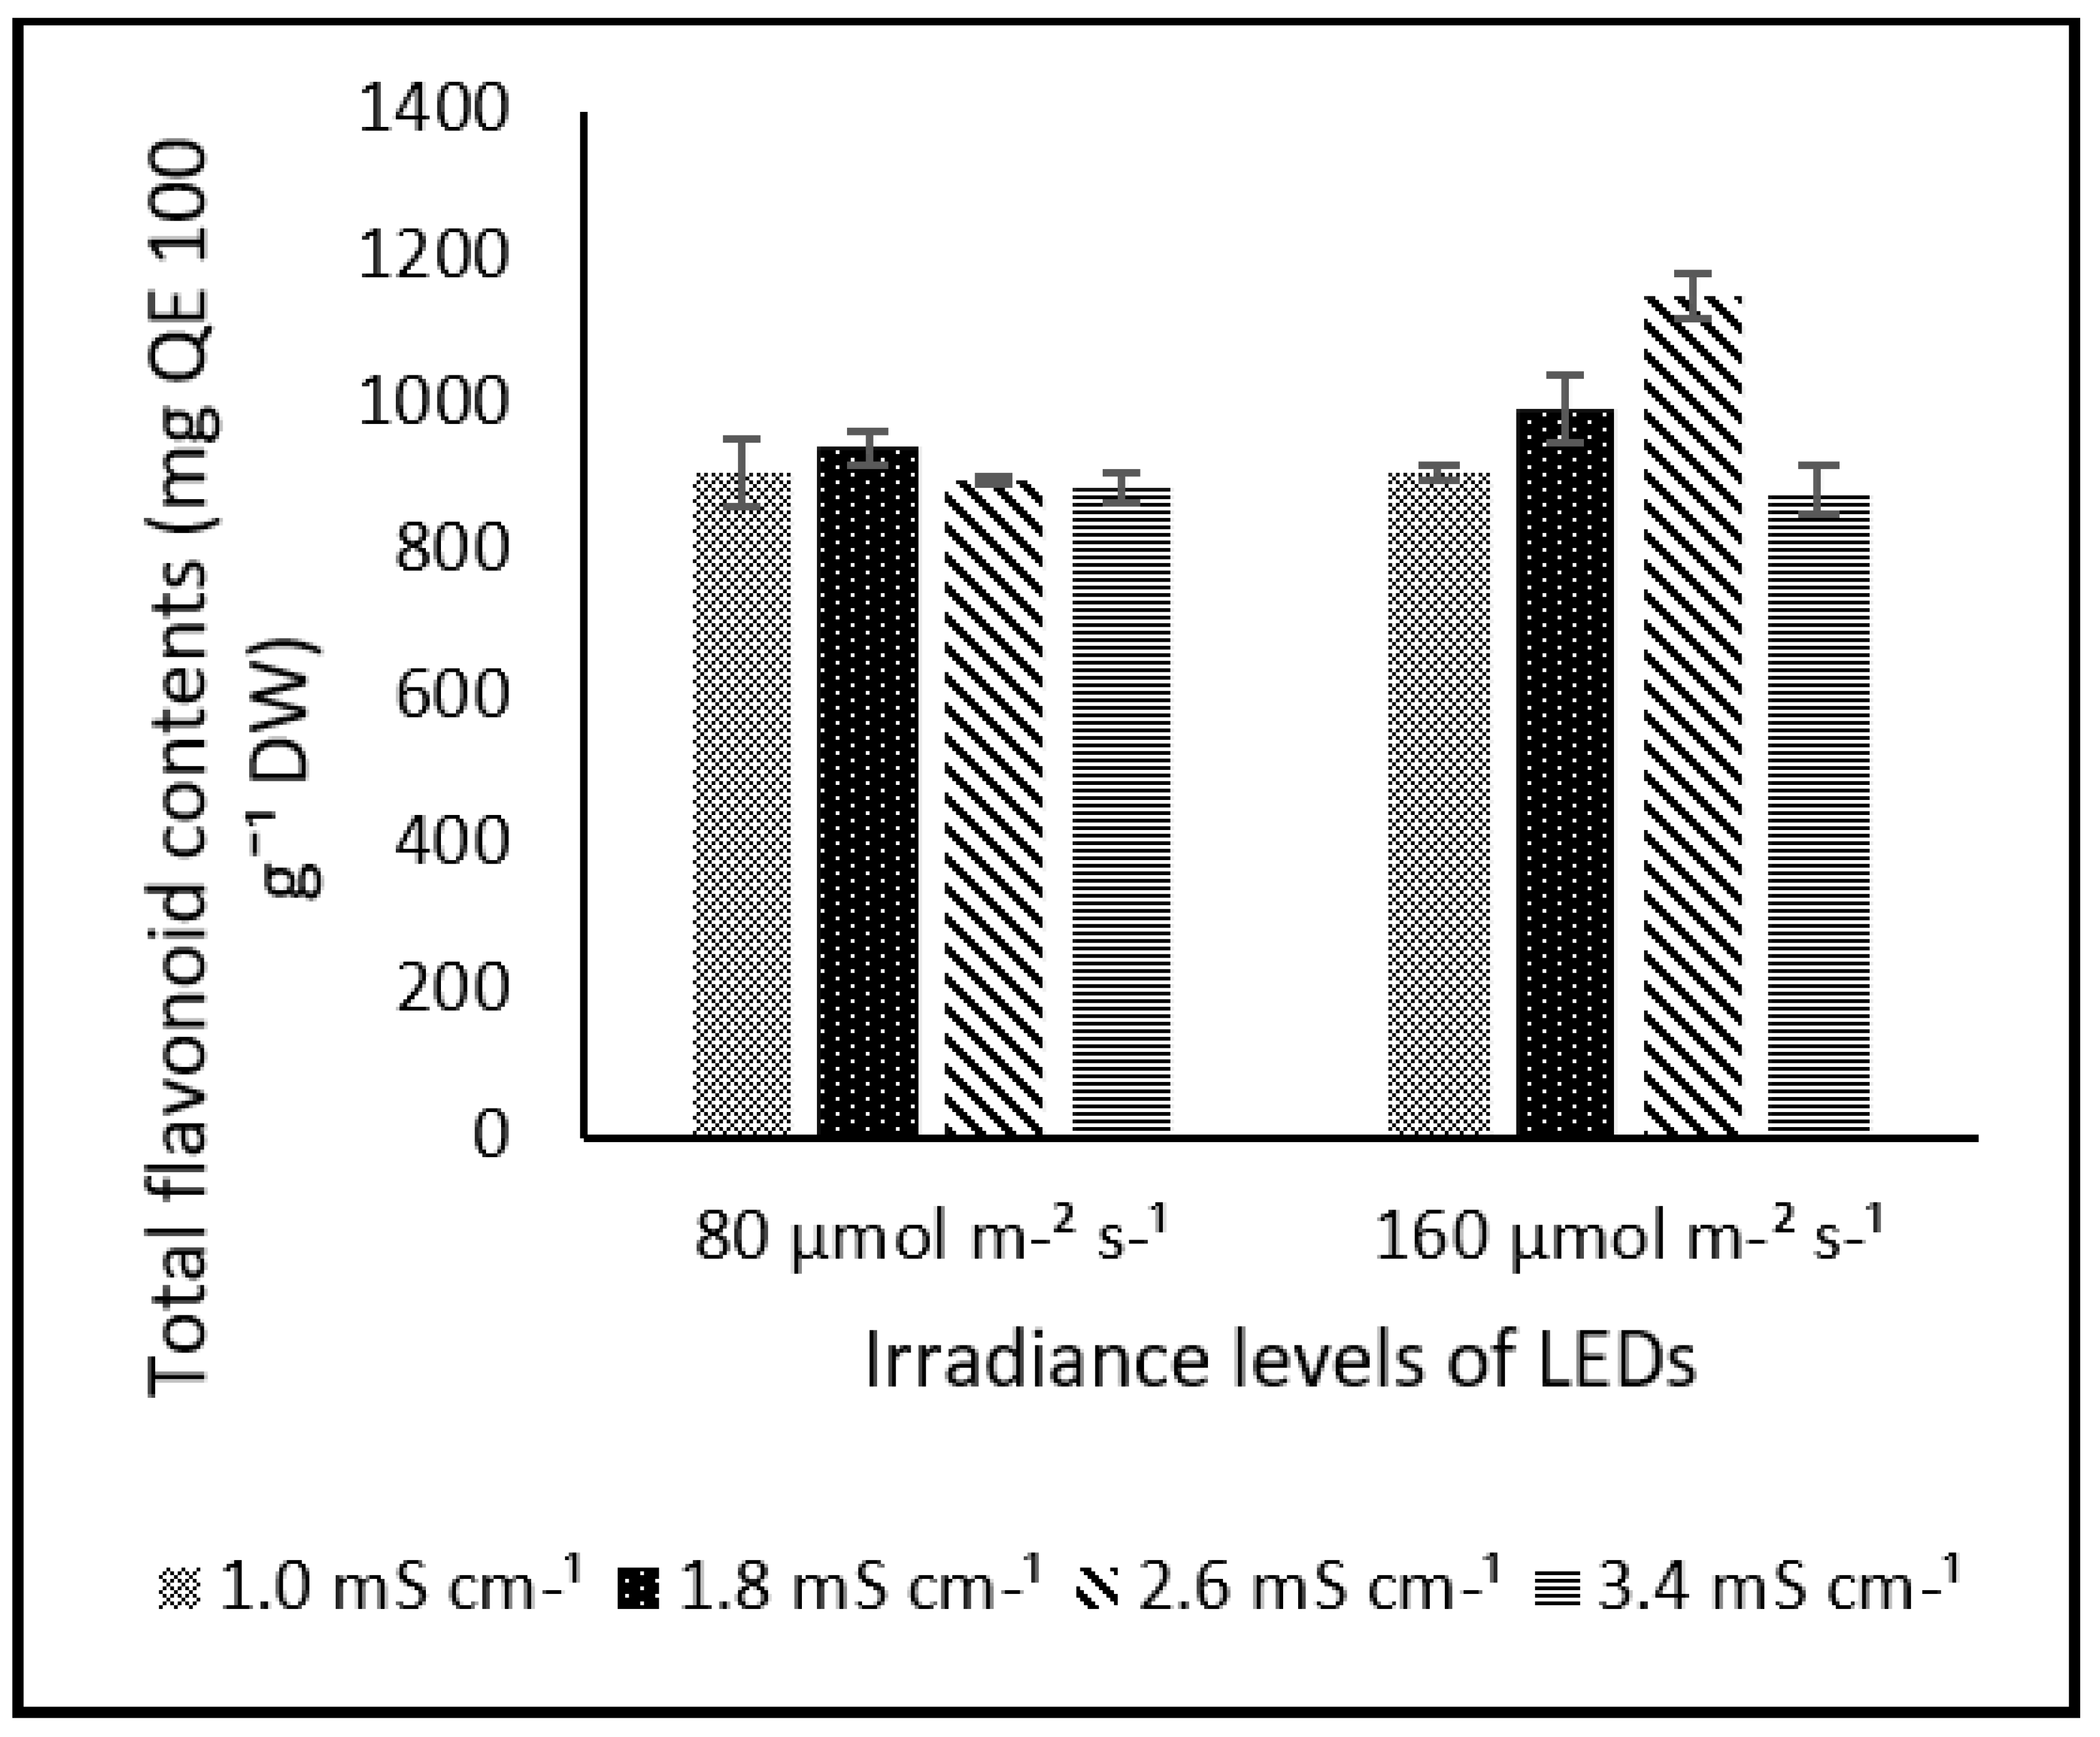
3.3.3. Total Flavonoid Content

The total flavonoid content (TFC) of lemon basil was significantly affected by the LED red and blue spectra irradiance levels and the nutrient solution EC, and there is interaction between both (Table 5 and Figure 7). TFC decreased with increasing nutrient solution EC at 80 µmol m−2 s−1. While at 160 µmol m−2 s−1, increasing the nutrient solution EC up to 2.6 mS cm−1 increased TFC. A further increase to 3.4 mS cm−1 degraded the flavonoid content. The highest TFC was observed at 160 µmol m−2 s−1 irradiance supplemented with an EC of 2.6 mS cm−1 with 1148.79 mg quercetin equivalent 100 g−1 DW.

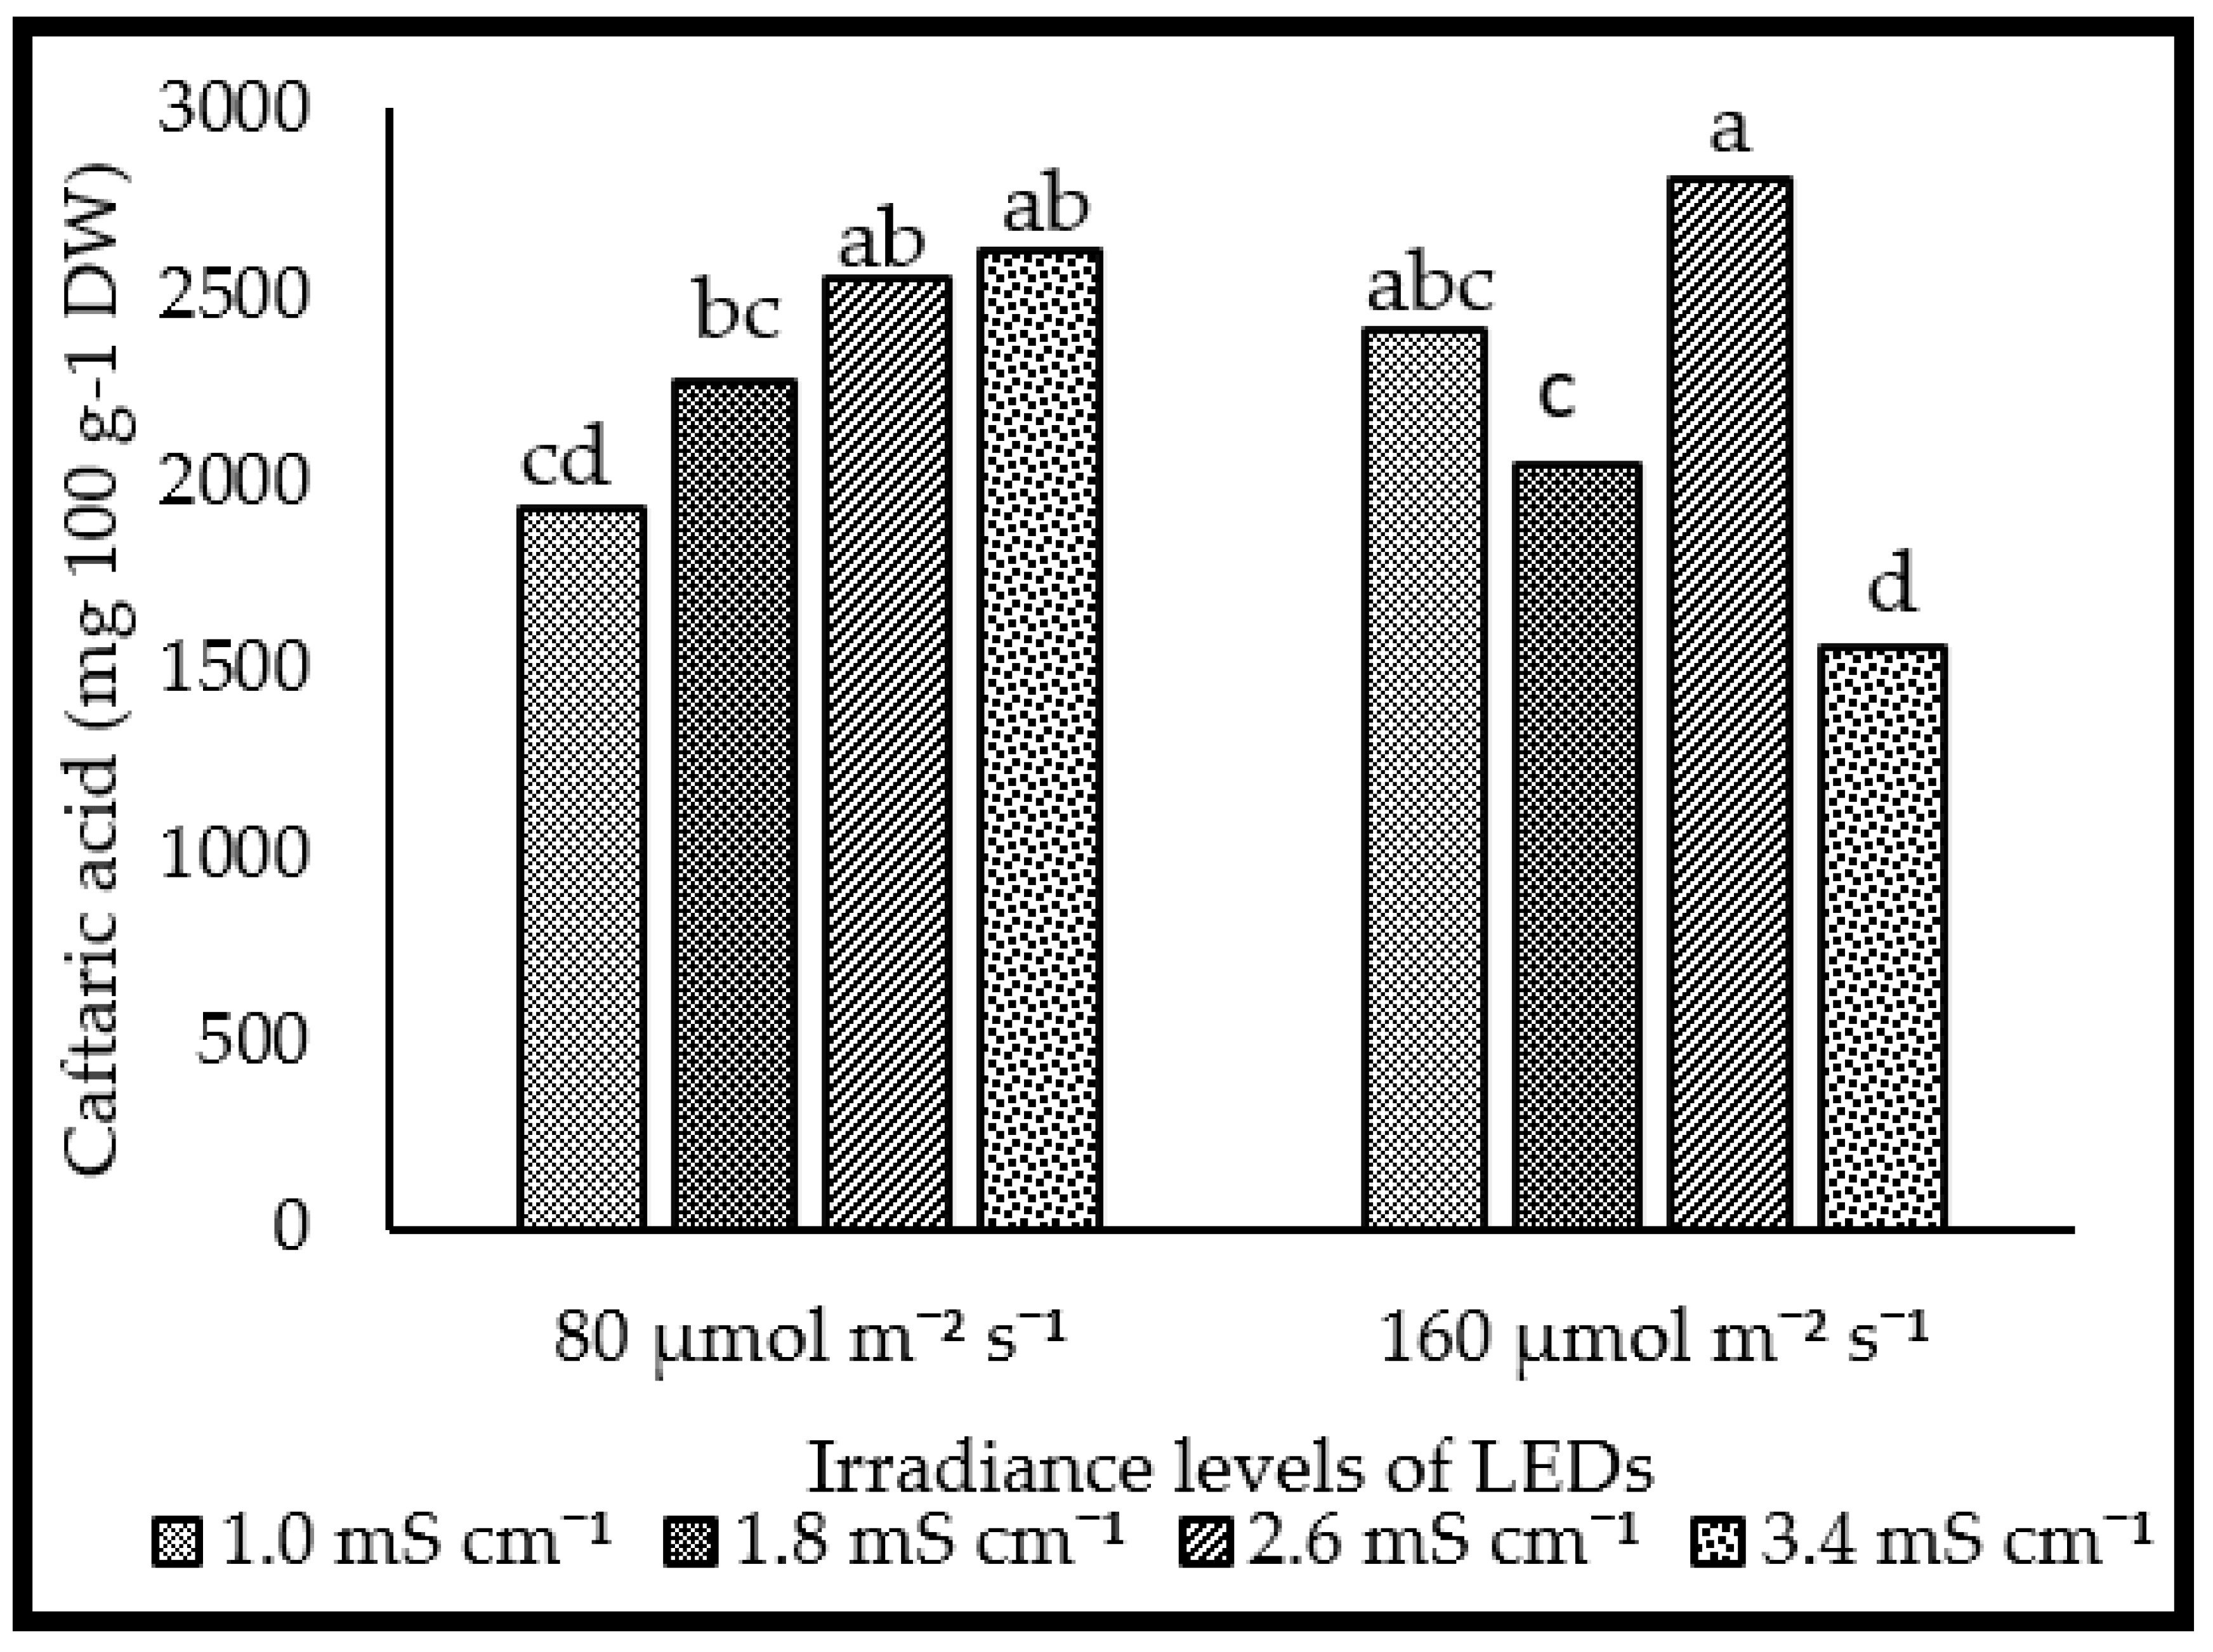
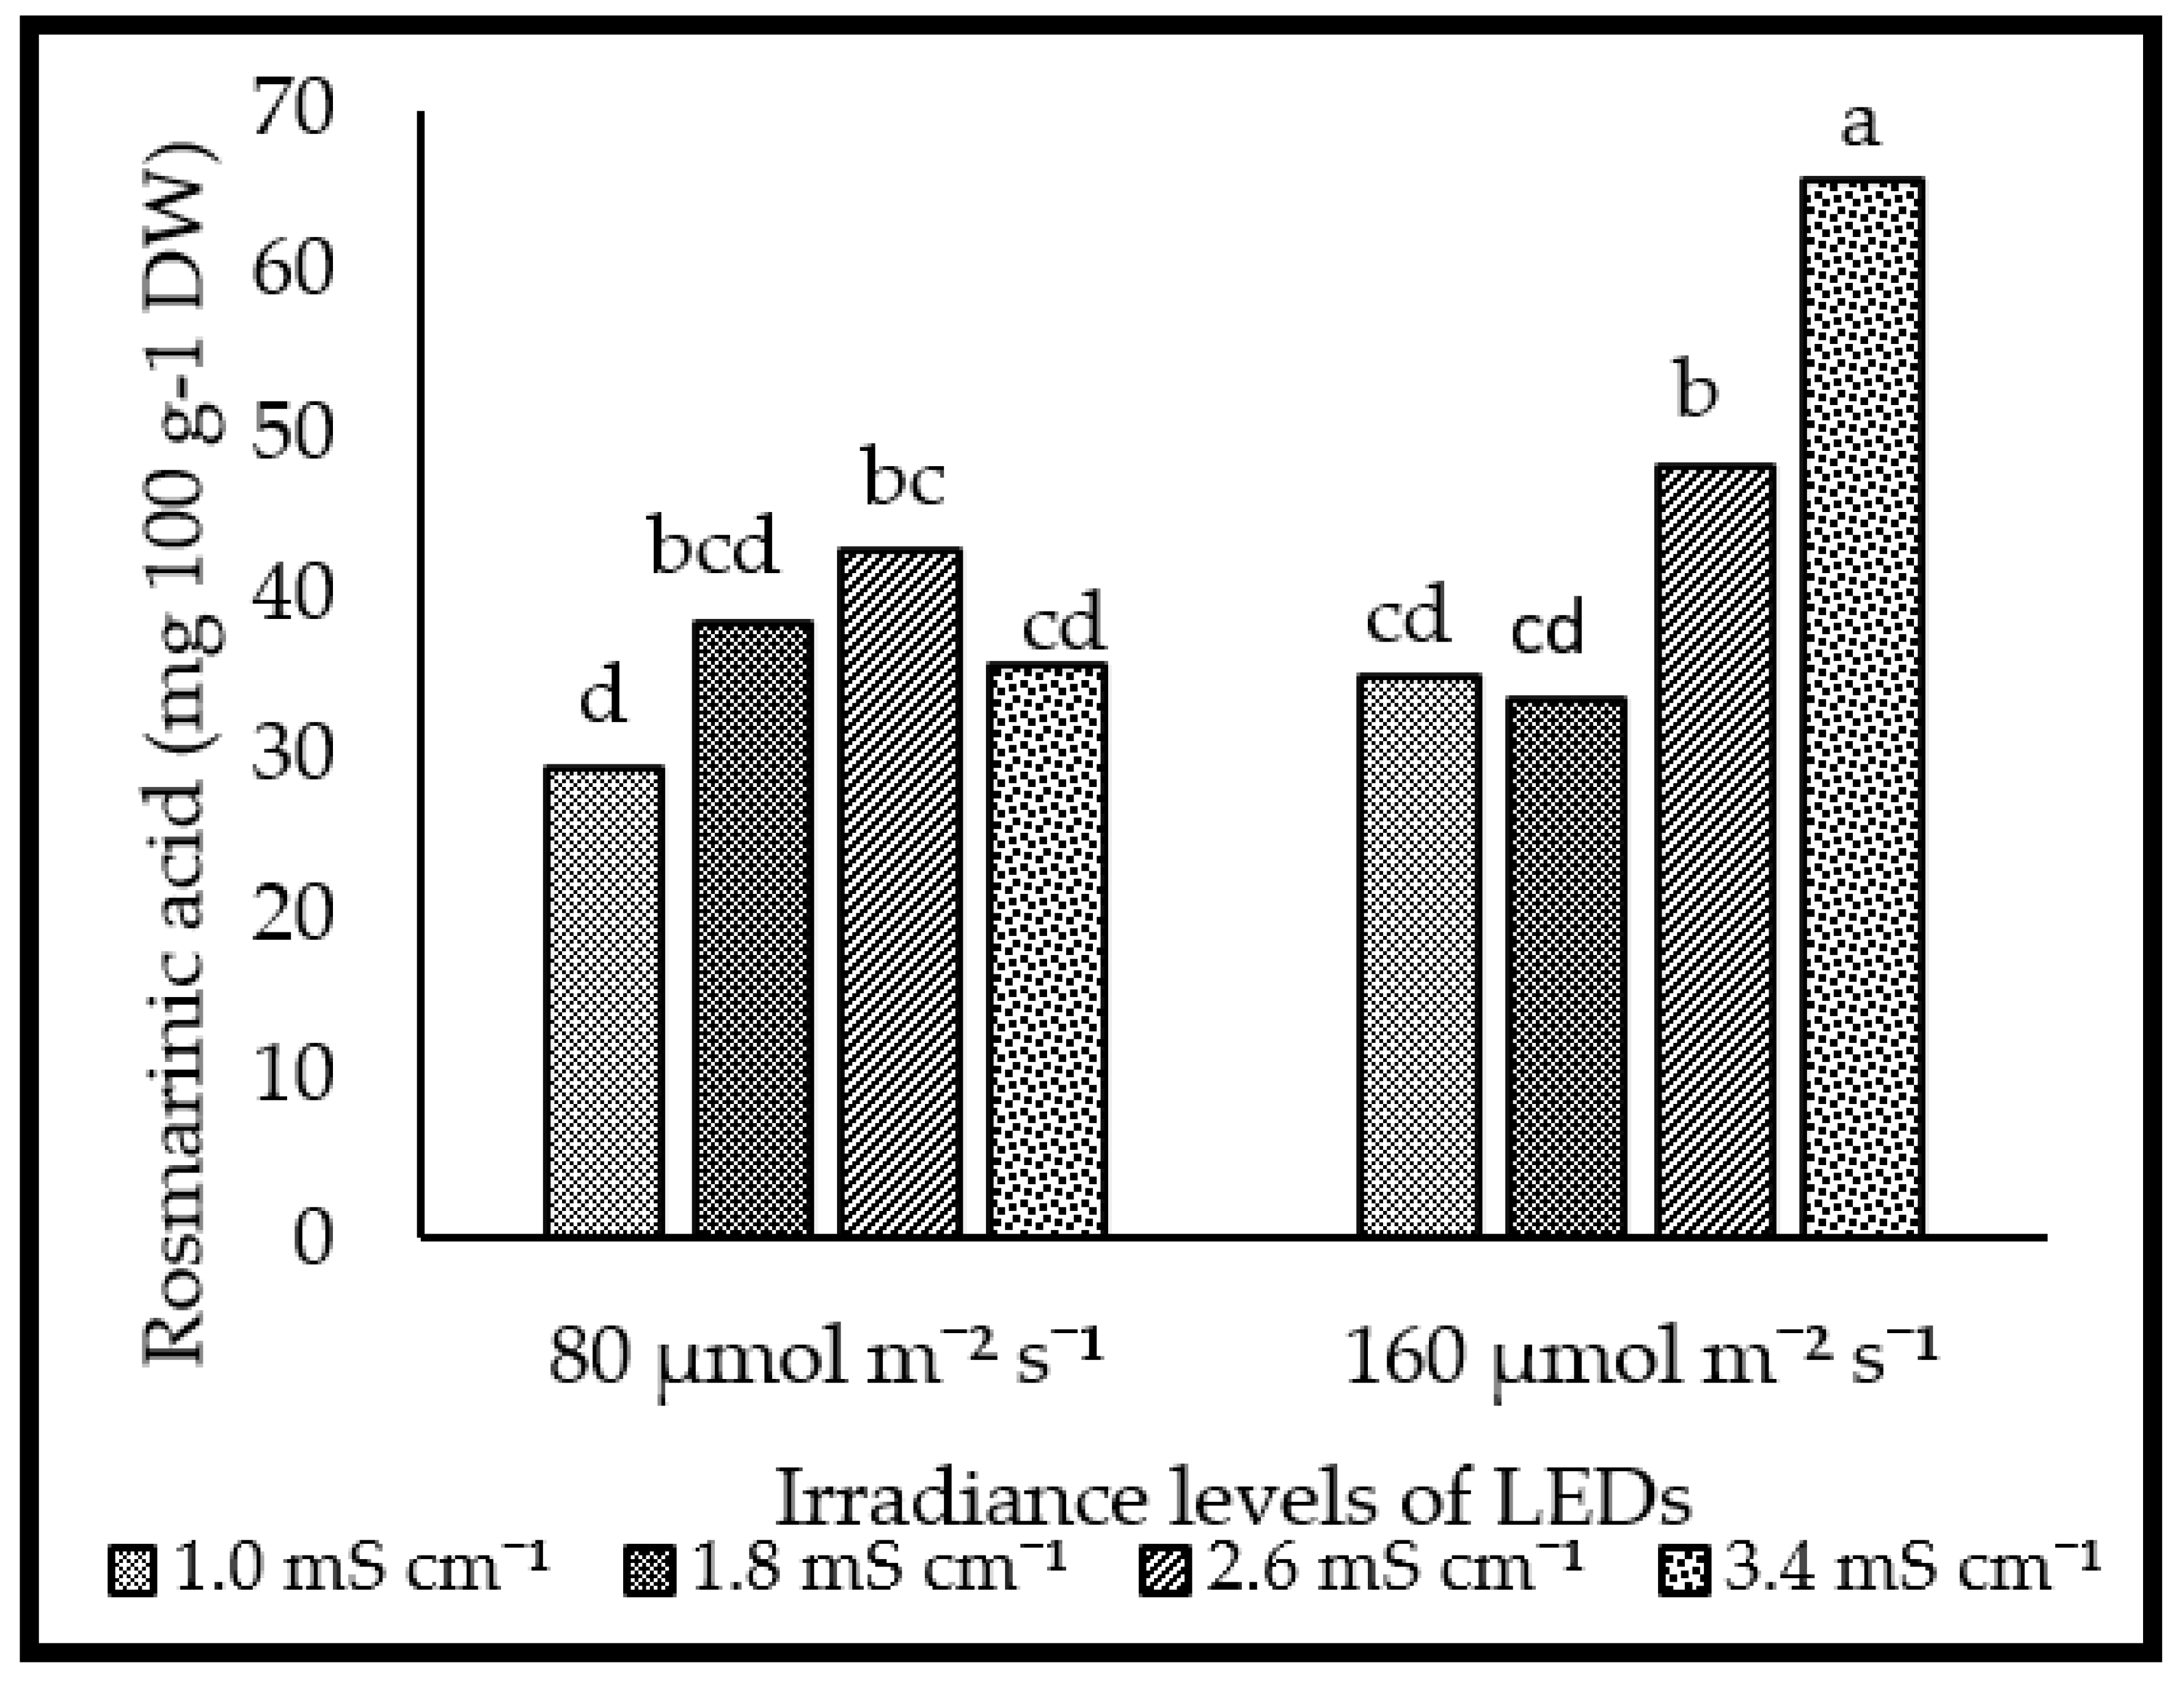
3.4. Individual Phenolic Compound

Table 6 shows the effects of the LEDs and EC on the concentrations of the prominent individual phenolic compounds (caftaric, rosmarinic, chicoric, and gentisic acid) of lemon basil. The interaction effects between the LED irradiance levels and nutrient solution EC on caftaric acid (Figure 8) and rosmarinic acid (Figure 9) were significantly different. In contrast, no interaction or significant differences were observed in either of the main effects on lemon basil’s chicoric and gentisic acid concentrations.
The caftaric acid concentration increased with increasing nutrient solution EC at 80 µmol m−2 s−1, whereas it fluctuated at 160 µmol m−2 s−1 with rising nutrient solution EC. The highest caftaric acid concentration was observed at an irradiance level of 160 µmol m−2 s−1 in combination with 2.6 mS cm−1 EC when compared to other combinations but had no differences with 80 µmol m−2 s−1:2.6 mS cm−1, 80 µmol m−2 s−1:1.8 mS cm−1, and 160 µmol m−2 s−1:1.0 mS cm−1. In contrast, the lowest caftaric acid was recorded at an LED irradiance level of s at 160 µmol m−2 s−1 supplied with a nutrient solution EC of 3.4 mS cm−1, but this had no differences at 80 µmol m−2 s−1:1.0 mS cm−1.
For rosmarinic acid, significant differences were not examined at 80 µmol m−2 s−1 with increasing nutrient solution EC, whereas rosmarinic acid concentration was elevated with increasing nutrient solution EC at 160 µmol m−2 s−1. The highest concentration was observed at 160 µmol m−2 s−1 in combination with a nutrient solution EC of 3.4 mS cm−1, though the lowest was at 80 µmol m−2 s−1:1.0 mS cm−1.

4. Discussion

4.1. Plant Growth Performance

The present study reveals that the growth parameters of lemon basil (Ocimum citriodorum Vis.) were strongly influenced by LED red and blue spectra irradiance levels and nutrient solution EC. The growth parameters, such as plant height, canopy diameter, and the number of leaves, showed significant effects between the different treatments regarding the levels of LED irradiance and the EC of the nutrient solution. Plants cultivated at an irradiance level of 160 µmol m−2 s−1 and supplemented with an EC of 2.6 mS cm−1 produced optimum growth performance compared to other treatments. A previous study by Morano et al. [36] stated that a nutrient solution EC of 2.8 mS cm−1 in the shortest crop cycle increased basil yield (whole plants and leaves), while an EC of 2.2 mS cm−1 exhibited the worst performance.

4.2. Yield Production

Leafy herbs, such as basil, are very popular crops among farmers because they are easy to grow, have a high yield index, are suitable for hydroponic and closed farming, and simultaneously have a high margin for profitability [37]. Considering our results, LED irradiance levels and nutrient solution EC significantly affected the yield production of both the fresh and dry products (Table 2 and Table 3). Increases in yield for the fresh and dry weight were optimized by the appliance of LED irradiance levels of 160 µmol m−2 s−1 in combination with an EC of 2.6 mS cm−1. However, the fresh and dry weights were severely inhibited at irradiance levels of 80 µmol m−2 s−1 supplemented at all nutrient solution ECs. Nemali and van Iersel [38] found similar results, reporting on the interaction effect of fertilizer concentration and photosynthetic photon flux (PPF) on the dry weight of petunia and wax begonia plants. The dry mass of the fertilized plants was higher for those plants grown at higher irradiance levels (268 µmol m−2 s−1) when compared to those grown at low irradiance levels (113 µmol m−2 s−1). In addition to the irradiance level treatments employed, the optimal range of nutrient concentration for dry mass varied from 0.65 to 2.0 mS cm−1 (wax begonia) and 1.18 to >2.77 mS cm−1 (petunia). In addition, no interaction was observed between the LED irradiance levels and EC on the leaf area of lemon basil. However, there were significant effects observed for both parameters on leaf area in lemon basil. Lemon basil cultivated under 160 µmol m−2 s−1 and irrigated at 1.8 mS cm−1 produced a higher leaf area.

4.3. Phytochemical Contents

The interaction between the LED red and blue spectra irradiance levels and nutrient solution EC did not significantly influence the ascorbic acid contents of lemon basil. However, the main effects of the LED irradiance levels and nutrient solution EC were significant. According to Fraszczak et al. [39], the amount of ascorbic acid can vary according to light conditions. The current study is in concurrence with this statement. It was observed that the ascorbic acid contents of lemon basil were significantly higher when grown at higher irradiance levels of 160 µmol m−2 s−1 than at lower irradiance levels of 80 µmol m−2 s−1. The study by Ohashi-Kaneko et al. [40] and Fraszczak et al. [39] also revealed that plants cultivated under red and blue light saw significant increases in the content of ascorbic acid. In addition, Lee et al. [41] discovered that plant tissues would accumulate more ascorbic acid content when irradiated with high light intensity. The high light intensity would strengthen the plants so as to acquire greater photosynthesis, which would relocate more assimilation products for growth and metabolism. According to Ding et al. [42], the ascorbic acid of pak choi plants showed an increasing trend of up to 2.4 mS cm−1 but did not significantly increase over this nutrient concentration level. This divergence between different vegetable crops may be due to the differences in growth habitats and growing conditions.
The effect of LED irradiance levels on TPC and TFC varied depending on the nutrient solution EC (Figure 6 and Figure 7). Increasing nutrient solution EC increased TPC and TFC at both irradiance levels of 80 and 160 µmol m−2 s−1. Higher TPC and TFC were observed at irradiance levels of 160 µmol m−2 s−1 in combination with s nutrient solution EC of 2.6 mS cm−1. It was revealed that LED red and blue spectra irradiance levels and nutrient solution EC influenced the accumulations of phenolic and flavonoid contents in lemon basil. The previous study by Son et al. [43] showed that blue LEDs could significantly increase the accumulation of phenolic compounds in plants. The phenolic compound content was similar between the control and white LEDs treatments in red curled lettuce, but the white LEDs accelerated the accumulation of phenolic compounds in green curled lettuce. Few studies have concluded that red light can stimulate an increase in phenolics in plants [39,44,45]. Although the mechanism is still unknown, one assumption is that red light increases the cytokinin level and thus stimulates the synthesis of phenolics [46]. A previous study by Kiferle et al. [47] stated that a lower amount of fertilizer had a significant effect on the accumulation of rosmarinic acid. In contrast, our results showed that basil fertilized at a higher nutrient solution EC accumulated significantly more rosmarinic acid compared to other ECs (Table 6).

5. Conclusions

An LED irradiance level of 160 µmol m−2 s−1 in combination with a nutrient solution EC of 2.6 mS cm−1 produced higher plant growth performance in terms of plant height, canopy diameter, the number of leaves, higher fresh and dry yield production, and higher phytochemical contents, such as total phenolic and total flavonoid content, along with caftaric acid concentration. The present study’s findings have improved the comprehension of the effects of LED red and blue spectra irradiance levels and nutrient solution EC and its interaction on lemon basil plants that are cultivated on a vertical structure by using the hydroponic system in a controlled environment facility.

Author Contributions

Conceptualization, Z.M.D. and M.F.I.; methodology, Z.M.D. and M.F.I.; resources, Z.M.D.; data curation, Z.M.D.; writing—original draft preparation, Z.M.D.; writing—review and editing, Z.M.D., M.F.I. and M.H.; supervision, M.F.I. and M.H.; funding acquisition, M.F.I. and M.H. All authors have read and agreed to the published version of the manuscript.

Funding

This research was funded by Ministry of Higher Education Malaysia (Translational Research Program (TR@M) and Universiti Putra Malaysia (Putra Grant), grant number 5526700 and 9433800, respectively and the APC was funded by Universiti Putra Malaysia.

Institutional Review Board Statement

Not applicable.

Informed Consent Statement

Not applicable.

Data Availability Statement

The data presented in this study are available in the article.

Acknowledgments

Authors would like to thank the Ministry of Higher Education, Malaysia, for the scholarship.

Conflicts of Interest

The authors declare no conflict of interest.

References

  1. Makri, O.; Kintzios, S. Ocimum sp. (basil) botany, cultivation, pharmaceutical properties and biotechnology. J. Herbs Spices Med. Plants 2008, 13, 123–150. [Google Scholar] [CrossRef]
  2. Kwee, E.M.; Niemeyer, E.D. Variations in phenolic compositions and antioxidant properties among 15 basil (Ocimum basilicum L.) cultivars. J. Food Chem. 2011, 128, 1044–1050. [Google Scholar] [CrossRef]
  3. Lee, J.; Scagel, C.F. Chicoric acid found in basil (Ocimum basilicum L.) leaves. J. Food Chem. 2009, 115, 650–656. [Google Scholar] [CrossRef]
  4. Javanmardi, J.; Khalighi, A.; Kashi, A.; Bais, H.P.; Vivanco, J.M. Chemical characterization of basil (Ocimum basilicum L.) found in local accessions and used in traditional medicines in Iran. Agric. Food Chem. 2002, 50, 5878–5883. [Google Scholar] [CrossRef] [PubMed]
  5. Department of Agriculture, Forestry and Fisheries of Republic of South Africa. Basil Production; Department of Agriculture, Forestry and Fisheries: Pretoria, South Africa, 2012.
  6. Fischer, R.; Nitzan, N.; Chaimovitsh, D.; Rubin, B.; Dudai, N. Variation in essential oil composition within individual leaves of sweet basil (Ocimum basilicum L.) is more affected by leaf position than by leaf age. J. Agric. Food Chem. 2011, 59, 4913–4922. [Google Scholar] [CrossRef] [PubMed]
  7. Hassanpouraghdam, M.B.; Gohari, G.R.; Tabatabaei, S.J.; Dadpour, M.R. Inflorescence and leaves essential oil composition of hydraponically grown Ocimum basilicum L. J. Serbian Chem. Soc. 2010, 75, 1361–1368. [Google Scholar] [CrossRef]
  8. Pushpangadam, P.; George, V. Basil. In Handbook of Herbs and Spices; Peter, K.V., Ed.; Elsevier: Atlanta, GA, USA, 2012; pp. 55–72. [Google Scholar]
  9. Despommier, D. Farming up the city: The rise of urban vertical farms. Trends Biothechnol. 2013, 31, 388–389. [Google Scholar] [CrossRef]
  10. Kozai, T.; Niu, G.; Takagaki, M. Plant Factory: An Indoor Vertical Farming System for Efficient Quality Food Production; Academic Press: San Diego, CA, USA, 2015. [Google Scholar]
  11. Chang, X.; Alderson, P.G.; Wright, C.J. Solar irradiance level alters the growth of basil (Ocimum basilicum L.) and its content of volatile oils. Environ. Expt. Bot. 2008, 63, 216–223. [Google Scholar] [CrossRef]
  12. Dou, H.; Niu, G.; Gu, M.; Masabni, J.G. Effects of light quality on growth and phytonutrient accumulation of herbs under controlled environments. Horticulturae 2017, 3, 36. [Google Scholar] [CrossRef] [Green Version]
  13. Figueiredo, A.C.; Barroso, J.G.; Pedro, L.G.; Scheffer, J.J. Factors affecting secondary production in plants: Volatile components and essential oils. J. Flav. Frag. 2008, 23, 213–226. [Google Scholar] [CrossRef]
  14. Shaffie-Hajiabad, M.; Novak, J.; Honermeier, B. Content and composition of essential oil of four Origanum vulgare L. accessions under reduced and normal light intensity conditions. J. Appl. Bot. Food Qual. 2016, 89, 126–134. [Google Scholar]
  15. Olle, M.; Virsille, A. The effect of light emitting diode lighting on greenhouse plant growth and quality. J. Agric. Food Sci. 2013, 22, 223–234. [Google Scholar] [CrossRef] [Green Version]
  16. Darko, E.; Heydarizadeh, P.; Shoefs, B.; Sabzalian, M.R. Photosynthesis under artificial light: The shift in primary and secondary metabolism. J. Philos. Trans. R. Soc. Biol. Sci. 2014, 369, 20130243. [Google Scholar] [CrossRef] [PubMed] [Green Version]
  17. Shiga, T.; Shoji, K.; Shimada, H.; Hashida, S.N.; Goto, F.; Yoshihara, T. Effect of light quality on rosmarinic acid content and antioxidant activity of sweet basil, Ocimum basilicum L. J. Plant Biotechnol. 2009, 26, 255–259. [Google Scholar] [CrossRef] [Green Version]
  18. Liao, H.L.; Alferez, F.; Burns, J.K. Assessment of blue light treatments on citrus postharvest diseases. J. Postharvest Biol. Technol. 2013, 81, 81–88. [Google Scholar] [CrossRef]
  19. Johkan, M.; Shoji, K.; Goto, F.; Hashida, S.; Yoshihara, T. Blue light-emitting diode light irradiation of seedlings improves seedling quality and growth after transplanting in red leaf lettuce. J. Hortic. Sci. 2010, 45, 1809–1814. [Google Scholar] [CrossRef] [Green Version]
  20. Kook, H.S.; Park, S.H.; Jang, Y.J.; Lee, G.W.; Kim, J.S.; Kim, H.M.; Oh, B.T.; Chae, J.C.; Lee, K.J. Blue LED (light-emitting diodes)-mediated growth promotion and control of Botrytis disease in lettuce. Acta Agric. Scand. Sect. B-Soil Plant Sci. 2013, 63, 271–277. [Google Scholar]
  21. Samuoliene, G.; Brazaityte, A.; Jankauskiene, J.; Virsile, A.; Sirtautas, R.; Novickovas, A.; Sakalauskiene, S.; Sakalauskaite, J.; Duchovskis, P. LED irradiance level affects growth and nutritional quality of Brassica microgreens. J. Century Eur. Biol. 2013, 8, 1241–1249. [Google Scholar] [CrossRef]
  22. Bantis, F.; Ouzounis, T.; Radoglou, K. Artificial LED lighting enhances growth characteristics and total phenolic content of Ocimum basilicum, but variably affects transplant success. J. Hortic. Sci. 2016, 198, 277–283. [Google Scholar] [CrossRef] [Green Version]
  23. Bekhradi, F.; Delshad, M.; Marin, A.; Luna, M.C.; Garrido, Y.; Kashi, A.; Babalar, M.; Gil, M.I. Effects of salt stress on physiological and postharvest quality characteristics of different Iranian genotypes of basil. Hortic. Environ. Biotechnol. 2015, 56, 777–785. [Google Scholar] [CrossRef]
  24. De Pascale, S.; Maggio, A.; Orsini, F.; Barbieri, G. Nutrient influence on ready to eat sweet basil quality. Acta Hortic. 2006, 718, 523–530. [Google Scholar] [CrossRef]
  25. Fallovo, C.; Rouphael, Y.; Rea, E.; Battistelli, A.; Colla, G. Nutrient solution concentration and growing season affect yield and quality of Lactuca sativa L. var. acephala raft culture. J. Food Sci. Agric. 2009, 89, 1682–1689. [Google Scholar] [CrossRef]
  26. Vendrame, W.; Moore, K.K.; Broschat, T.K. Interaction of light intensity and controlled release fertilization rate on growth and flowering of two New Guinea impatiens cultivars. HortTechnology 2004, 14, 491–495. [Google Scholar]
  27. Poorter, H.; Nagel, O. The role of biomass allocation in the growth response of plants to different levels of light, CO2, nutrients andwater: A quatitative review. J. Funct. Plant Biol. 2000, 27, 1191. [Google Scholar] [CrossRef] [Green Version]
  28. Lu, N.; Bernardo, E.L.; Tippayadarapanich, C.; Takagaki, M.; Kagawa, N.; Yamori, W. Growth and accumulation of secondary metabolites in Perilla as affected by photosynthetic photon flux density and electrical conductivity of the nutrient solution. Front. Plant Sci. 2017, 8, 708. [Google Scholar] [CrossRef] [PubMed] [Green Version]
  29. Samarakoon, U.C.; Weerasinghe, P.A.; Weerakkody, A.P. Effect of electrical conductivity (EC) of the nutrient solution on nutrient uptake, growth, and yield of leaf lettuce (Lactuca sativa L.) in stationary culture. J. Trop. Agric. Res. 2006, 18, 13–21. [Google Scholar]
  30. Jagota, S.K.; Dani, H.M. A new colorimetric technique for the estimation of vitamin C using Folin phenol reagent. Anal. Biochem. 1982, 127, 178–182. [Google Scholar] [CrossRef]
  31. Nguyen, P.M.; Niemeyer, E.D. Effects of nitrogen fertilization on the phenolic composition and antioxidant properties of basil (Ocimum basilicum L.). Agric. Food Chem. 2008, 56, 8685–8691. [Google Scholar] [CrossRef] [PubMed] [Green Version]
  32. Ghasemzadeh, A.; Jaffar, H.Z.; Rahmat, A. Synthesis of phenolics and flavonoids in ginger (Zingiber officinale Roscoe) and their effects on photosynthesis rate. Int. J. Mol. Sci. 2010, 11, 4539–4555. [Google Scholar] [CrossRef] [Green Version]
  33. Ismail, H.I.; Chan, K.W.; Mariad, A.A.; Ismail, M. Phenolic content, and antioxidant activity of cantaloupe (Cucumis melo) methanolic extracts. J. Food Chem. 2010, 119, 643–647. [Google Scholar] [CrossRef]
  34. Flanigan, P.M.; Niemeyer, E.D. Effect of cultivar on phenolic levels, anthocyanin composition, and antioxidant properties in purple basil (Ocimum basilicum L.). Food Chem. 2014, 164, 518–526. [Google Scholar] [CrossRef] [PubMed]
  35. SAS Institute. SAS User’s Guide: Statistics; SAS Institute: Cary, NC, USA, 1999. [Google Scholar]
  36. Morano, G.; Amalfitano, C.; Sellitto, M.; Cuciniello, A.; Maiello, R.; Caruso, G. Effects of nutritive solution electrical conductivity and plant density on growth, yield, and quality of sweet basil grown in gullies by subirrigation. J. Adv. Hortic. Sci. 2017, 31, 25–30. [Google Scholar]
  37. Ruta, S.; Lauzike, K.; Pukas, T.; Samuoliene, G. Effect of light intensity on the growth and antioxidant activity of sweet basil and lettuce. J. Plants 2022, 11, 1709. [Google Scholar]
  38. Nemali, K.S.; van Iersel, M.W. Light intensity and fertilizer concentration: I. Estimating optimal fertilizer concentration from water-use efficiency of wax begonia. HortScience 2004, 39, 1287–1292. [Google Scholar] [CrossRef] [Green Version]
  39. Fraszczak, B.; Golcz, A.; Zawirska-Wojtasiak, R.; Janowska, B. Growth rate of sweet basil and lemon balm plants grown under fluorescent lamps and LED modules. Acta Sci. Pol. Hortorum Cultus 2014, 13, 3–13. [Google Scholar]
  40. Ohashi-Kaneko, K.; Takse, M.; Kon, N.; Fujiwara, K.; Kurata, K. Effect of light quality on growth and vegetable quality in leaf lettuce, spinach and komatsuna. J. Environ. Control Biol. 2007, 45, 189–198. [Google Scholar] [CrossRef] [Green Version]
  41. Lee, S.K.; Kader, A.A. Pre-harvest and postharvest factors influencing vitamin C content of horticultural crops. J. Postharvest Biol. Technol. 2000, 20, 207–220. [Google Scholar] [CrossRef] [Green Version]
  42. Ding, X.; Jiang, Y.; Zhao, H.; Guo, D.; He, L.; Liu, F.; Zhou, Q.; Nandwani, D.; Hui, D.; Yu, J. Electrical conductivity of nutrient solution influenced photosynthesis, quality and antioxidant enzyme activity of pakchoi (Brassica campestris L. ssp. chinensis) in a hydroponic system. PLoS ONE 2018, 13, e0202090. [Google Scholar] [CrossRef]
  43. Son, K.H.; Park, J.H.; Kim, D.; Oh, M.M. Leaf shape, growth and phytochemicals in two leaf lettuce cultivars grown under monochromatic light-emitting diodes. Korean J. Hortic. Sci. Technol. 2012, 30, 664–672. [Google Scholar] [CrossRef]
  44. Lee, Y.J.; Ha, J.Y.; Oh, J.E.; Cho, M.S. The effect of LED irradiation on the quality of cabbage stored at a low temperature. J. Food Sci. Biotechnol. 2014, 23, 1087–1093. [Google Scholar] [CrossRef]
  45. Li, Q.; Kubota, C. Effects of supplemental light quality on growth and phytochemicals of baby leaf lettuce. J. Environ. Exp. Bot. 2009, 67, 59–64. [Google Scholar] [CrossRef]
  46. Galuszka, P.; Frebortova, J.; Luhova, L.; Bilyeu, K.D.; English, J.T.; Frebort, I. Tissue localization of cytokinin dehydrogenase in maize: Possible involvement of quinone species generated from plant phenolic by other enzymatic systems in the catalytic reaction. J. Plant Cell Physiol. 2005, 46, 716–728. [Google Scholar] [CrossRef] [PubMed] [Green Version]
  47. Kiferle, C.; Maggini, R.; Pardossi, A. Influence of nitrogen nutrition on growth and accumulation of rosmarinic acid in sweet basil (Ocimum basilicum L.) grown in hydroponic culture. J. Aus. Crop Sci. 2013, 9, 3–12. [Google Scholar]
Figure 1. Plant height of lemon basil for a growing duration of 30 days under different LEDs and nutrient solution ECs.
Horticulturae 09 00416 g001
Figure 2. Canopy diameter of lemon basil for 30 days growing duration under different LEDs and nutrient solution ECs.
Horticulturae 09 00416 g002
Figure 3. Number of lemon basil leaves after 30 days growing duration under different LEDs and nutrient solution ECs.
Horticulturae 09 00416 g003
Figure 4. Interaction effect of LED irradiance levels and nutrient solution EC on fresh stem weight of lemon basil.
Horticulturae 09 00416 g004
Figure 5. Interaction effect of LED irradiance levels and nutrient solution EC on the dry weight of the leaves (a), stems (b), and roots (c) of lemon basil.
Horticulturae 09 00416 g005
Figure 6. Interaction effect of LED irradiance levels and nutrient solution EC on total phenolic content of lemon basil.
Horticulturae 09 00416 g006
Figure 7. Interaction effect of LED irradiance levels and nutrient solution EC on total flavonoid content of lemon basil.
Horticulturae 09 00416 g007
Figure 8. Interaction effect of LED irradiance levels and nutrient solution EC on caftaric acid in lemon basil.
Horticulturae 09 00416 g008
Figure 9. Interaction effect of LED irradiance levels and nutrient solution EC on rosmarinic acid in lemon basil.
Horticulturae 09 00416 g009
Table 1. Mineral composition of nutrient solution.
Electrical Conductivity (EC)Nutrient Concentrations (mg L−1)
1.0N = 92.80, P = 26.80, K = 95.60, Ca = 40.00, Mg = 12.00, S = 32.00, Fe = 1.20, Mn = 0.248, B = 0.176, Cu = 0.008, Zn = 0.044, Mo = 0.019
1.8N = 232.00, P = 67.00, K = 239.00, Ca = 100.00, Mg = 30.00, S = 80.00, Fe = 3.00, Mn = 0.62, B = 0.44, Cu = 0.02, Zn = 0.11, Mo = 0.048
2.6N = 278.00, P = 80.40, K = 286.80, Ca = 120.00, Mg = 36.00, S = 96.00, Fe = 3.60, Mn = 0.744, B = 0.528, Cu = 0.024, Zn = 0.132, Mo = 0.058
3.4N = 324.80, P = 93.80, K = 334.60, Ca = 140.00, Mg = 42.00, S = 112.00, Fe = 4.20, Mn = 0.868, B = 0.616, Cu = 0.028, Zn = 0.154, Mo = 0.067
Note: N-nitrogen, P-phosphorus, K-potassium, Ca-calcium, Mg-magnesium, S-sulfur, Mn-manganese, Fe-iron, Cu-copper, B-boron, Zn-zinc, and Mo-molybdenum.
Table 2. Effects of LED irradiance levels and nutrient solution EC on the fresh weight (g) of three different parts (leaves, stem, and roots) of lemon basil.
Factor LeavesStemRoots
Irradiance levels of LEDs (µmol m−2 s−1)
8015.90 b6.19 b4.82 b
16025.44 a12.45 a7.47 a
EC of nutrient solution (mS cm−1)
1.016.75 c7.04 c4.60 c
1.821.14 b10.21 b5.862 b
2.623.77 a11.84 a8.72 a
3.421.02 b8.21 c5.40 b
Irradiance levels of LEDs*********
EC of nutrient solution*********
Irradiance levels of LEDs × EC of nutrient solutionns***ns
*** Significant at p < 0.001 probability level, ns = not significant. Means in each column with different letters within each factor indicate significant differences at p ≤ 0.05 level according to DMRT.
Table 3. Effects of LED irradiance levels and nutrient solution EC on the dry weight (g) of three different parts (leaves, stem, and roots) of lemon basil.
Factor LeavesStemRoots
Irradiance levels of LEDs (µmol m−2 s−1)
800.85 b0.64 b0.32 b
1601.64 a1.29 a0.60 a
EC of nutrient solution (mS cm−1)
1.01.10 b0.69 d0.45
1.81.41 a1.89 c0.48
2.61.26 a,b1.22 a0.48
3.41.21 b1.05 b0.43
Irradiance levels of LEDs*********
EC of nutrient solution******ns
Irradiance levels of LEDs × EC of nutrient solution*********
*** Significant at p < 0.001 probability level, ns = not significant. Means in each column with different letters within each factor indicate significant differences at p ≤ 0.05 level according to DMRT.
Table 4. Effects of LED irradiance levels and nutrient solution EC on leaf area (cm2/plant) in lemon basil.
Factor Leaf Area
Irradiance levels of LEDs (µmol m−2 s−1)
80617.14 b
1601020.62 a
EC of nutrient solution (mS cm−1)
1.0772.84 b
1.8943.23 a
2.6831.26 b
3.4848.19 b
Irradiance levels of LEDs***
EC of nutrient solution***
Irradiance levels of LEDs × EC of nutrient solutionns
*** Significant at p < 0.001 probability level, ns = not significant. Means in each column with different letters within each factor indicate significant differences at p ≤ 0.05 level according to DMRT.
Table 5. Effects of LED irradiance levels and nutrient solution EC on ascorbic acid, total phenolic, and total flavonoid contents in lemon basil.
Factor Ascorbic Acid (mg 100 g−1 FW)Total Phenolic Content (mg GAE 100 g−1 DW) Total Flavonoid Content (mg QE 100 g−1 DW)
Irradiance levels of LEDs (µmol m−2 s−1)
8072.82 b620.30 b907.87 b
16077.59 a1346.28 a982.72 a
EC of nutrient solution (mS cm−1)
1.067.43 c866.27 b907.34 b,c
1.868.54 c995.49 a966.63 a,b
2.688.37 a1039.30 a1022.52 a
3.476.48 b1032.10 a884.98 b,c
Irradiance levels of LEDs********
EC of nutrient solution*********
Irradiance levels of LEDs × EC of nutrient solutionns****
*** significant at p < 0.001 probability level, ** significant at p < 0.01 probability level, * significant at p < 0.05 probability level, ns = not significant. Means in each column with different letters within each factor indicate significant differences at p ≤ 0.05 level according to DMRT.
Table 6. Effects of LED irradiance levels and nutrient solution EC on the concentration of the individual phenolic compounds of lemon basil.
Factor Caftaric Acid (mg 100 g−1 DW)Rosmarinic Acid (mg 100 g−1 DW) Chicoric Acid (mg 100 g−1 DW)Gentisic Acid (mg 100 g−1 DW)
Irradiance levels of LEDs (µmol m−2 s−1)
802341.3036.44 b23.272.96
1602205.7045.41 a23.313.14
EC of nutrient solution (mS cm−1)
1.02167.90 b32.03 b23.402.35
1.82157.70 b35.83 b23.302.60
2.62677.10 a45.28 a23.364.08
3.42091.20 b50.58 a23.093.17
Irradiance levels of LEDsns **ns ns
EC of nutrient solution*****nsns
Irradiance levels of LEDs × EC of nutrient solution*****nsns
*** significant at p < 0.001 probability level, ** significant at p < 0.01 probability level, ns = not significant. Means in each column with different letters within each factor indicate significant differences at p≤ 0.05 level according to DMRT.
Disclaimer/Publisher’s Note: The statements, opinions and data contained in all publications are solely those of the individual author(s) and contributor(s) and not of MDPI and/or the editor(s). MDPI and/or the editor(s) disclaim responsibility for any injury to people or property resulting from any ideas, methods, instructions or products referred to in the content.

