
Variability of Nutritional, Antioxidant, and Textural Traits of a Collection of Snap Beans of Different Colors
 , , ,
, , ,  ,
,  and
and
Abstract
:1. Introduction
2. Materials and Methods
2.1. Plant Materials and Experimental Design
2.2. Phenotyping of Fresh Snap Beans
2.3. Phenotyping of Cooked Snap Beans
2.3.1. Cooking of Snap Bean
2.3.2. Texture Determination
2.3.3. Color Measurement
2.4. Extraction and Analysis of Phenolic Compounds
2.5. Trolox Equivalent Antioxidant Capacity (TEAC)
2.6. Phenolic Content
2.7. Statistic Analysis
3. Results and Discussion
3.1. Characterization of the Entire Set of SBP
3.2. Characterization of the Selected Snap Bean Lines
4. Conclusions
Supplementary Materials
Author Contributions
Funding
Institutional Review Board Statement
Informed Consent Statement
Data Availability Statement
Conflicts of Interest
References
- Bellucci, E.; Aguilar, O.M.; Alseekh, S.; Bett, K.; Brezeanu, K.; Cook, D.; De la Rosa, L.; Delledonne, M.; Dostatny, D.F.; Ferreira, J.J.; et al. The INCREASE project: Intelligent Collections of food-legume genetic resources for European agrofood systems. Plant J. 2021, 108, 646–660. [Google Scholar] [CrossRef] [PubMed]
- Bitocchi, E.; Rau, D.; Bellucci, E.; Rodriguez, M.; Murgia, M.L.; Gioia, T.; Santo, D.; Nanni, L.; Attene, G.; Papa, R. Beans (Phaseolus ssp.) as a Model for Understanding Crop Evolution. Front. Plant Sci. 2017, 8, 722. [Google Scholar] [CrossRef] [PubMed]
- UN Food and Agriculture Organization. Green Bean Production in 2021, Crops/Regions/World List/Production Quantity (Pick Lists); Corporate Statistical Database (FAOSTAT): Rome, Italy, 2022; Retrieved 23 December 2022. [Google Scholar]
- Chaurasia, S. Green Beans. In Nutritional Composition and Antioxidant Properties of Fruits and Vegetables; Jaiswal, A.K., Ed.; Elsevier: Amsterdam, The Netherlands, 2020; Chapter 17; pp. 289–300. [Google Scholar] [CrossRef]
- Hosseinpour-Niazi, S.; Mirmiran, P.; Hedayati, M.; Azizi, F. Substitution of red meat with legumes in the therapeutic lifestyle change diet based on dietary advice improves cardiometabolic risk factors in overweight type 2 diabetes patients: A cross-over randomized clinical trial. Eur. J. Clin. Nutr. 2015, 69, 592–597. [Google Scholar] [CrossRef]
- Lourenço, S.C.; Moldão-Martins, M.; Alves, V.D. Antioxidants of Natural Plant Origins: From Sources to Food Industry Applications. Molecules 2019, 24, 4132. [Google Scholar] [CrossRef] [PubMed]
- Beninger, C.W.; Hosfield, G.L. Antioxidant activity of extracts, condensed tannin fractions, and pure flavonoids from Phaseolus vulgaris L. seed coat color genotypes. J. Agric. Food Chem. 2003, 51, 7879–7883. [Google Scholar] [CrossRef] [PubMed]
- Mojica, L.; Berhow, M.; Gonzalez de Mejia, E. Black bean anthocyanin-rich extracts as food colorants: Physicochemical stability and antidiabetes potential. Food Chem. 2017, 229, 628–639. [Google Scholar] [CrossRef] [PubMed]
- McCrory, M.A.; Hamaker, B.R.; Lovejoy, J.C.; Eichelsdoerfer, P.E. Pulse consumption, satiety, and weight management. Adv. Nutr. 2010, 1, 17–30. [Google Scholar] [CrossRef]
- Monk, J.M.; Lepp, D.; Zhang, C.P.; Wu, W.; Zarepoor, L.; Lu, J.T.; Pauls, K.P.; Tsao, R.; Wood, G.A.; Robinson, L.E.; et al. Diets enriched with cranberry beans alter the microbiota and mitigate colitis severity and associated inflammation. J. Nutr. Biochem. 2016, 28, 129–139. [Google Scholar] [CrossRef]
- Inthachat, W.; Suttisansanee, U.; Kruawan, K.; On-Nom, N.; Chupeerach, C.; Temviriyanukul, P. Evaluation of Mutagenicity and Anti-Mutagenicity of Various Bean Milks Using Drosophila with High Bioactivation. Foods 2022, 11, 3090. [Google Scholar] [CrossRef]
- Ganesan, K.; Xu, B. Polyphenol-Rich Dry Common Beans (Phaseolus vulgaris L.) and Their Health Benefits. Int. J. Mol. Sci. 2017, 18, 2331. [Google Scholar] [CrossRef]
- Cortinovis, G.; Di Vittori, V.; Bellucci, E.; Bitocchi, E.; Papa, R. Adaptation to novel environments during crop diversification. Curr. Opin. Plant Biol. 2020, 56, 203–217. [Google Scholar] [CrossRef] [PubMed]
- Singh, S.P.; Gepts, P.; Debouck, D.G. Races of common bean (Phaseolus vulgaris, Fabaceae). Econ. Bot. 1991, 45, 379–396. [Google Scholar] [CrossRef]
- Myers, J.R.; Baggett, J.R. Improvement of Snap Bean. In Common Bean Improvement in the Twenty-First Century; Springer: Basel, Switzerland, 1999; pp. 289–329. [Google Scholar]
- Rau, D.; Murgia, M.L.; Rodriguez, M.; Bitocchi, E.; Bellucci, E.; Fois, D.; Albani, D.; Nanni, L.; Gioia, T.; Santo, D.; et al. Genomic dissection of pod shattering in common bean: Mutations at non-orthologous loci at the basis of convergent phenotypic evolution under domestication of leguminous species. Plant J. 2019, 97, 693–714. [Google Scholar] [CrossRef] [PubMed]
- Wallace, L.; Arkwazee, H.; Vining, K.; Myers, J.R. Genetic diversity within snap beans and their relation to dry beans. Genes 2018, 9, 587. [Google Scholar] [CrossRef]
- García-Fernández, C.; Campa, A.; Garzón-Soler, A.; Miklas, P.; Ferreira, J.J. GWAS of pod morphological and color characters in common bean. BMC Plant Biol. 2021, 21, 184. [Google Scholar] [CrossRef]
- García-Fernández, C.; Jurado, M.; Campa, A.; Brezeanu, C.; Geffroy, V.; Bitocchi, E.; Papa, R.; Ferreira, J.J. A Core Set of Snap Bean Genotypes Established by Phenotyping a Large Panel Collected in Europe. Plants 2022, 11, 577. [Google Scholar] [CrossRef]
- Pevicharova, G.; Sofkova-Bobcheva, S.; Zsivanovits, G. Sensory and Instrumental Texture of Snap Bean (Phaseolus vulgaris L.). Int. J. Food Prop. 2015, 18, 1169–1180. [Google Scholar] [CrossRef]
- Garcia, E.; Barrett, D.M. Preservative Treatments for Fresh-Cut Fruits and Vegetables; CRC Press: Boca Raton, FL, USA, 2002; pp. 267–304. [Google Scholar]
- Abdelgawad, K.F.; Awad, A.H.R.; Ali, M.R.; Ludlow, R.A.; Chen, T.; El-Mogy, M.M. Increasing the Storability of Fresh-Cut Green Beans by Using Chitosan as a Carrier for Tea Tree and Peppermint Essential Oils and Ascorbic Acid. Plants 2022, 11, 783. [Google Scholar] [CrossRef]
- Proulx, E.; Yagiz, Y.; Nunes, M.C.N.; Emond, J.-P. Quality Attributes Limiting Snap Bean (Phaseolus vulgaris L.) Postharvest Life at Chilling and Non-chilling Temperatures. Hortscience 2010, 45, 1238–1249. [Google Scholar] [CrossRef]
- Miao, Y.; Tian, W.N.; Hao, C.M.; Rao, L.; Cao, J.K.; Jiang, W.B. Study on pods fibrosis delaying of postharvest common bean by chitosan treatment. J. China Agric. Univ. 2012, 17, 132–137. [Google Scholar]
- Xie, G.F.; Zhang, M.S. Research advances in the postharvest storage and preservation techniques of fresh common bean (Phaseolus vulgaris L.). Sci. Technol. Food Ind. 2019, 40, 326–330. [Google Scholar]
- Rosenthal, A.J. Relation between Instrumental and Sensory Measurement of Food Texture. In Food Texture, Measurement, and Perception; Rosenthal, A.J., Ed.; Chapman & Hall/Aspen Publication: Gaithersburg, MD, USA, 1999; pp. 1–17. [Google Scholar]
- Nunes, M.C.N. Quality of Fruits and Vegetables. In Color Atlas of Postharvest; Wiley-Blackwell Publishing: Ames, IA, USA, 2008; ISBN 978-0-813-81752-1. [Google Scholar]
- Taştan, Ö.; Pataro, G.; Donsì, F.; Ferrari, G.; Baysal, T. Decontamination of fresh-cut cucumber slices by a combination of a modified chitosan coating containing carvacrol nanoemulsions and pulsed light. Int. J. Food Microbiol. 2017, 260, 75–80. [Google Scholar] [CrossRef] [PubMed]
- Palermo, M.; Pellegrini, N.; Fogliano, V. The effect of cooking on the phytochemical content of vegetables. J. Sci. Food Agric. 2014, 94, 1057–1070. [Google Scholar] [CrossRef] [PubMed]
- Fabbri, A.D.T.; Crosby, G.A. A review of the impact of preparation and cooking on the nutritional quality of vegetables and legumes. Int. J. Gastron. Food Sci. 2016, 3, 2–11. [Google Scholar] [CrossRef]
- Ferracane, R.; Pellegrini, N.; Visconti, A.; Graziani, G.; Chiavaro, E.; Miglio, C.; Fogliano, V. Effects of Different Cooking Methods on Antioxidant Profile, Antioxidant Capacity, and Physical Characteristics of Artichoke. J. Agric. Food Chem. 2008, 56, 8601–8608. [Google Scholar] [CrossRef]
- Şengül, M.; Yildiz, H.; Kavaz, A. The Effect of Cooking on Total Polyphenolic Content and Antioxidant Activity of Selected Vegetables. Int. J. Food Prop. 2014, 17, 481–490. [Google Scholar] [CrossRef]
- Branca, F.; Papa, R.; Bitocchi, E.; Ferreira, J.J.; Cardi, T.; Tripodi, P.; Lozano, R.; Ovesna, J.; Sheng, X.; Dever, L.; et al. Developing New Cultivars of Broccoli, Snap Bean, and Tomato for Resilient, Efficient, and Sustainable Organic Vegetable Production: Preliminary Results of the H2020 BRESOV Project. In Proceedings of the ISHS Acta Horticulturae 1355: XXXI International Horticultural Congress (IHC2022): International Symposium on Agroecology and System Approach for Sustainable and Resilient Horticultural Production, Angers, France, 14–20 August 2022. [Google Scholar] [CrossRef]
- AOAC Official Method 990.03. Protein (Crude) in Animal Feed. Combustion method. In Official Methods of Analysis; AOAC International: Gaithersburg, MD, USA, 2000. [Google Scholar]
- Guzmán-Maldonado, S.H.; Acosta-Gallegos, J.; Paredes-López, O. Protein and mineral content of a novel collection of wild and weedy common bean (Phaseolus vulgaris L.). J. Sci. Food Agric. 2000, 80, 1874–1881. [Google Scholar] [CrossRef]
- Laparra, J.M.; Glahn, R.P.; Miller, D.D. Bioaccessibility oh phenols in common beans (Phaseolus vulgaris L.) and iron (Fe) availability to caco-2 cells. J. Agric. Food Chem. 2008, 56, 10999–11005. [Google Scholar] [CrossRef]
- Re, R.; Pellegrini, N.; Proteggente, A.; Pannala, A.; Yang, M.; Rice-Evans, C. Antioxidant activity applying an improved ABTS radical cation decolorization assay. Free Radic. Biol. Med. 1999, 98, 1231–1237. [Google Scholar] [CrossRef]
- Kim, K.H.; Tsa, R.; Yang, R.; Cui, W. Phenolic acid profiles and antioxidant activities of wheat bran extracts and effect of hydrolysis conditions. Food Chem. 2006, 95, 466–473. [Google Scholar] [CrossRef]
- Ferreira, J.J.; Campa, A.; García, C. Pod Phenotypic Variation in the Snap Bean Panel (SBP). 2020. Available online: http://zenodo.org/record/5557139#Y5h6AXbMJPY (accessed on 8 October 2021).
- Jacinto-Hernández, C.; Coria-Peña, M.; Contreras-Santos, G.; Martínez-López, L.; Zapata-Martelo, E.; Ayala-Carrillo, M.d.R. Total sugars and protein in beans native to the Triqui Alta region, Oaxaca. Rev. Mex. Cienc. Agríc. 2019, 10, 7. [Google Scholar]
- Flores-Sosa, Á.R.; Aquino-Bolaños, E.N.; Cardador-Martínez, A.; Chávez-Servia, J.L.; Vera-Guzmán, A.M.; Carrillo-Rodríguez, J.C.; Jiménez, J.E.A. Variation in protein and amino acids content among landraces of common bean (Phaseolus vulgaris L.). Emir. J. Food Agric. 2020, 32, 750. [Google Scholar] [CrossRef]
- Teferi, M.F.; Tesfaye, B.; Woldemichael, A.; Debella, A. Snap Bean (Phaseolus vulgaris) Response to Deficit Irrigation and Nitrogen Fertilizer and Relationships between Yield, Yield Component, and Protein Content. Int. J. Agron. 2022, 2022, 4148983. [Google Scholar] [CrossRef]
- Wszelaki, A.L.; Delwiche, J.F.; Walker, S.D.; Liggett, R.E.; Miller, S.A.; Kleinhenz, M.D. Consumer liking and descriptive analysis of six varieties of organically grown edamame type soybean. Food Qual. Prefer. 2005, 16, 651–658. [Google Scholar] [CrossRef]
- Mkanda, A.V.; Minnaar, A.; de Kock, H.L. Relating consumer preference to sensory and physicochemical properties of dry beans (Phaseolus vulgaris). J. Sci. Food Agric. 2007, 87, 2868–2879. [Google Scholar] [CrossRef]
- Sánchez-Mata, M.C.; Cámara-Hurtado, M.; Díez-Marqués, C. Identification and quantification of soluble sugars in green beans by HPLC. Eur. Food Res. Technol. 2002, 214, 254–258. [Google Scholar] [CrossRef]
- VandenLangenberg, K.M.; Bethke, P.C.; Nienhuis, J. Patterns of Fructose, Glucose, and Sucrose Accumulation in Snap and Dry Bean (Phaseolus vulgaris) Pods. HortScience 2012, 47, 874–878. [Google Scholar] [CrossRef]
- Martınez, C.; Ros, G.; Periago, M.; López, G.; Ortuño, J.; Rincón, F. Physico-Chemical and Sensory Quality Criteria of Green Beans (Phaseolus vulgaris, L.). LWT 1995, 28, 515–520. [Google Scholar] [CrossRef]
- Aquino-Bolaños, E.N.; Garzón-García, A.K.; Alba-Jiménez, J.E.; Chávez-Servia, J.L.; Vera-Guzmán, A.M.; Carrillo-Rodríguez, J.C.; Santos-Basurto, M.A. Physicochemical Characterization and Functional Potential of Phaseolus vulgaris L. and Phaseolus coccineus L. Landrace Green Beans. Agronomy 2021, 11, 803. [Google Scholar] [CrossRef]
- Lima, G.P.P.; Costa, S.M.; de Almeida Monaco, K.; Rodrigues, U.M.; Fernandez, R.M.; Correa, C.R.; Vianello, F.; Cisneros-Zevallos, L.; Minatel, I.O. Cooking processes increase bioactive compounds in organic and conventional green beans. Int. J. Food Sci. Nutr. 2017, 68, 919–930. [Google Scholar] [CrossRef]
- Natella, F.; Belelli, F.; Ramberti, A.; Scaccini, C. Microwave and traditional cooking methods: Effect of cooking on antoxidant capacity and phenolic compounds content of seven vegetables. J. Food Biochem. 2010, 34, 796–810. [Google Scholar] [CrossRef]
- Ismail, A.; Marjan, Z.M.; Foong, C.W. Total antioxidant activity and phenolic content in selected vegetables. Food Chem. 2004, 87, 581–586. [Google Scholar] [CrossRef]
- Turkmen, N.; Sari, F.; Velioglu, Y.S. The effect of cooking methods on total phenolics and antioxidant activity of selected green vegetables. Food Chem. 2005, 93, 713–718. [Google Scholar] [CrossRef]
- Benner, M.; Shen, Y.; Apak, R.; Finley, J.W.; Xu, Z. Release and Degradation of Anthocyanins and Phenolics from Blueberry Pomace during Thermal Acid Hydrolysis and Dry Heating. J. Agric. Food Chem. 2013, 61, 6643–6649. [Google Scholar] [CrossRef] [PubMed]
- Gunathilake, K.D.P.P.; Ranaweera, K.K.D.S.; Rupasinghe, H.P.V. Effect of Different Cooking Methods on Polyphenols, Carotenoids and Antioxidant Activities of Selected Edible Leaves. Antioxidants 2018, 7, 117. [Google Scholar] [CrossRef]
- Park, Y.S.; Im, M.H.; Ham, K.; Kang, S.; Park, Y.; Namiesnik, J.; Leontowicz, H.; Leontowicz, M.; Katrich, E.; Gorinstein, S. Nutritional and pharmaceutical properties of bioactive compounds in organic and conventional growing kiwifruit. Plants Foods Hum. Nutr. 2013, 68, 57–64. [Google Scholar] [CrossRef]
- Drinkwater, J.M.; Tsao, R.; Liu, R.; Defelice, C.; Wolyn, D.J. Effects of cooking on rutin and glutathione concentrations and antioxidant activity of green asparagus (Asparagus officinalis) spears. J. Funct. Foods 2015, 12, 342–353. [Google Scholar] [CrossRef]
- Jiménez-Monreal, A.M.; García-Diz, L.; Martínez-Tomé, M.; Mariscal, M.; Murcia, M.A. Influence of cooking methods on antioxidant activity of vegetables. J. Food Sci. 2009, 74, H97–H103. [Google Scholar] [CrossRef]
- Preti, R.; Rapa, M.; Vinci, G. Effect of Steaming and Boiling on the Antioxidant Properties and Biogenic Amines Content in Green Bean (Phaseolus vulgaris) Varieties of Different Colours. J. Food Qual. 2017, 2017, 5329070. [Google Scholar] [CrossRef]
- Baardseth, P.; Bjerke, F.; Martinsen, B.K.; Skrede, G. Vitamin C, total phenolics and antioxidative activity in tip-cut green beans (Phaseolus vulgaris) and swede rods (Brassica napus var. napobrassica) processed by methods used in catering. J. Sci. Food Agric. 2010, 90, 1245–1255. [Google Scholar] [CrossRef]
- Delchier, N.; Reich, M.; Renard, C.M.G.C. Impact of cooking methods on folates, ascorbic acid and lutein in green beans (Phaseolus vulgaris) and spinach (Spinacea oleracea). LWT Food Sci. Technol. 2012, 49, 197–201. [Google Scholar] [CrossRef]
- Kinyi, H.W.; Tirwomwe, M.; Ninsiima, H.I.; Miruka, C.O. Effect of Cooking Method on Vitamin C Loses and Antioxidant Activity of Indigenous Green Leafy Vegetables Consumed in Western Uganda. Int. J. Food Sci. 2022, 19, 2088034. [Google Scholar] [CrossRef] [PubMed]
- Hopia, A.; Heinonen, M. Antioxidant Activity of Flavonol Aglycones and Their Glycosides in Methyl Linoleate. JAOCS 1999, 76, 139–144. [Google Scholar] [CrossRef]
- Plumb, G.W.; Price, K.R.; Williamson, G. Antioxidant properties of flavonol glycosides from green beans. Redox Rep. 1999, 4, 123–127. [Google Scholar] [CrossRef] [PubMed]
- Farha, A.K.; Gan, R.-Y.; Li, H.-B.; Wu, D.-T.; Atanasov, A.G.; Gul, K.; Zhang, J.-R.; Yang, Q.-Q.; Corke, H. The anticancer potential of the dietary polyphenol rutin: Current status, challenges, and perspectives. Crit. Rev. Food Sci. Nutr. 2020, 62, 832–859. [Google Scholar] [CrossRef]


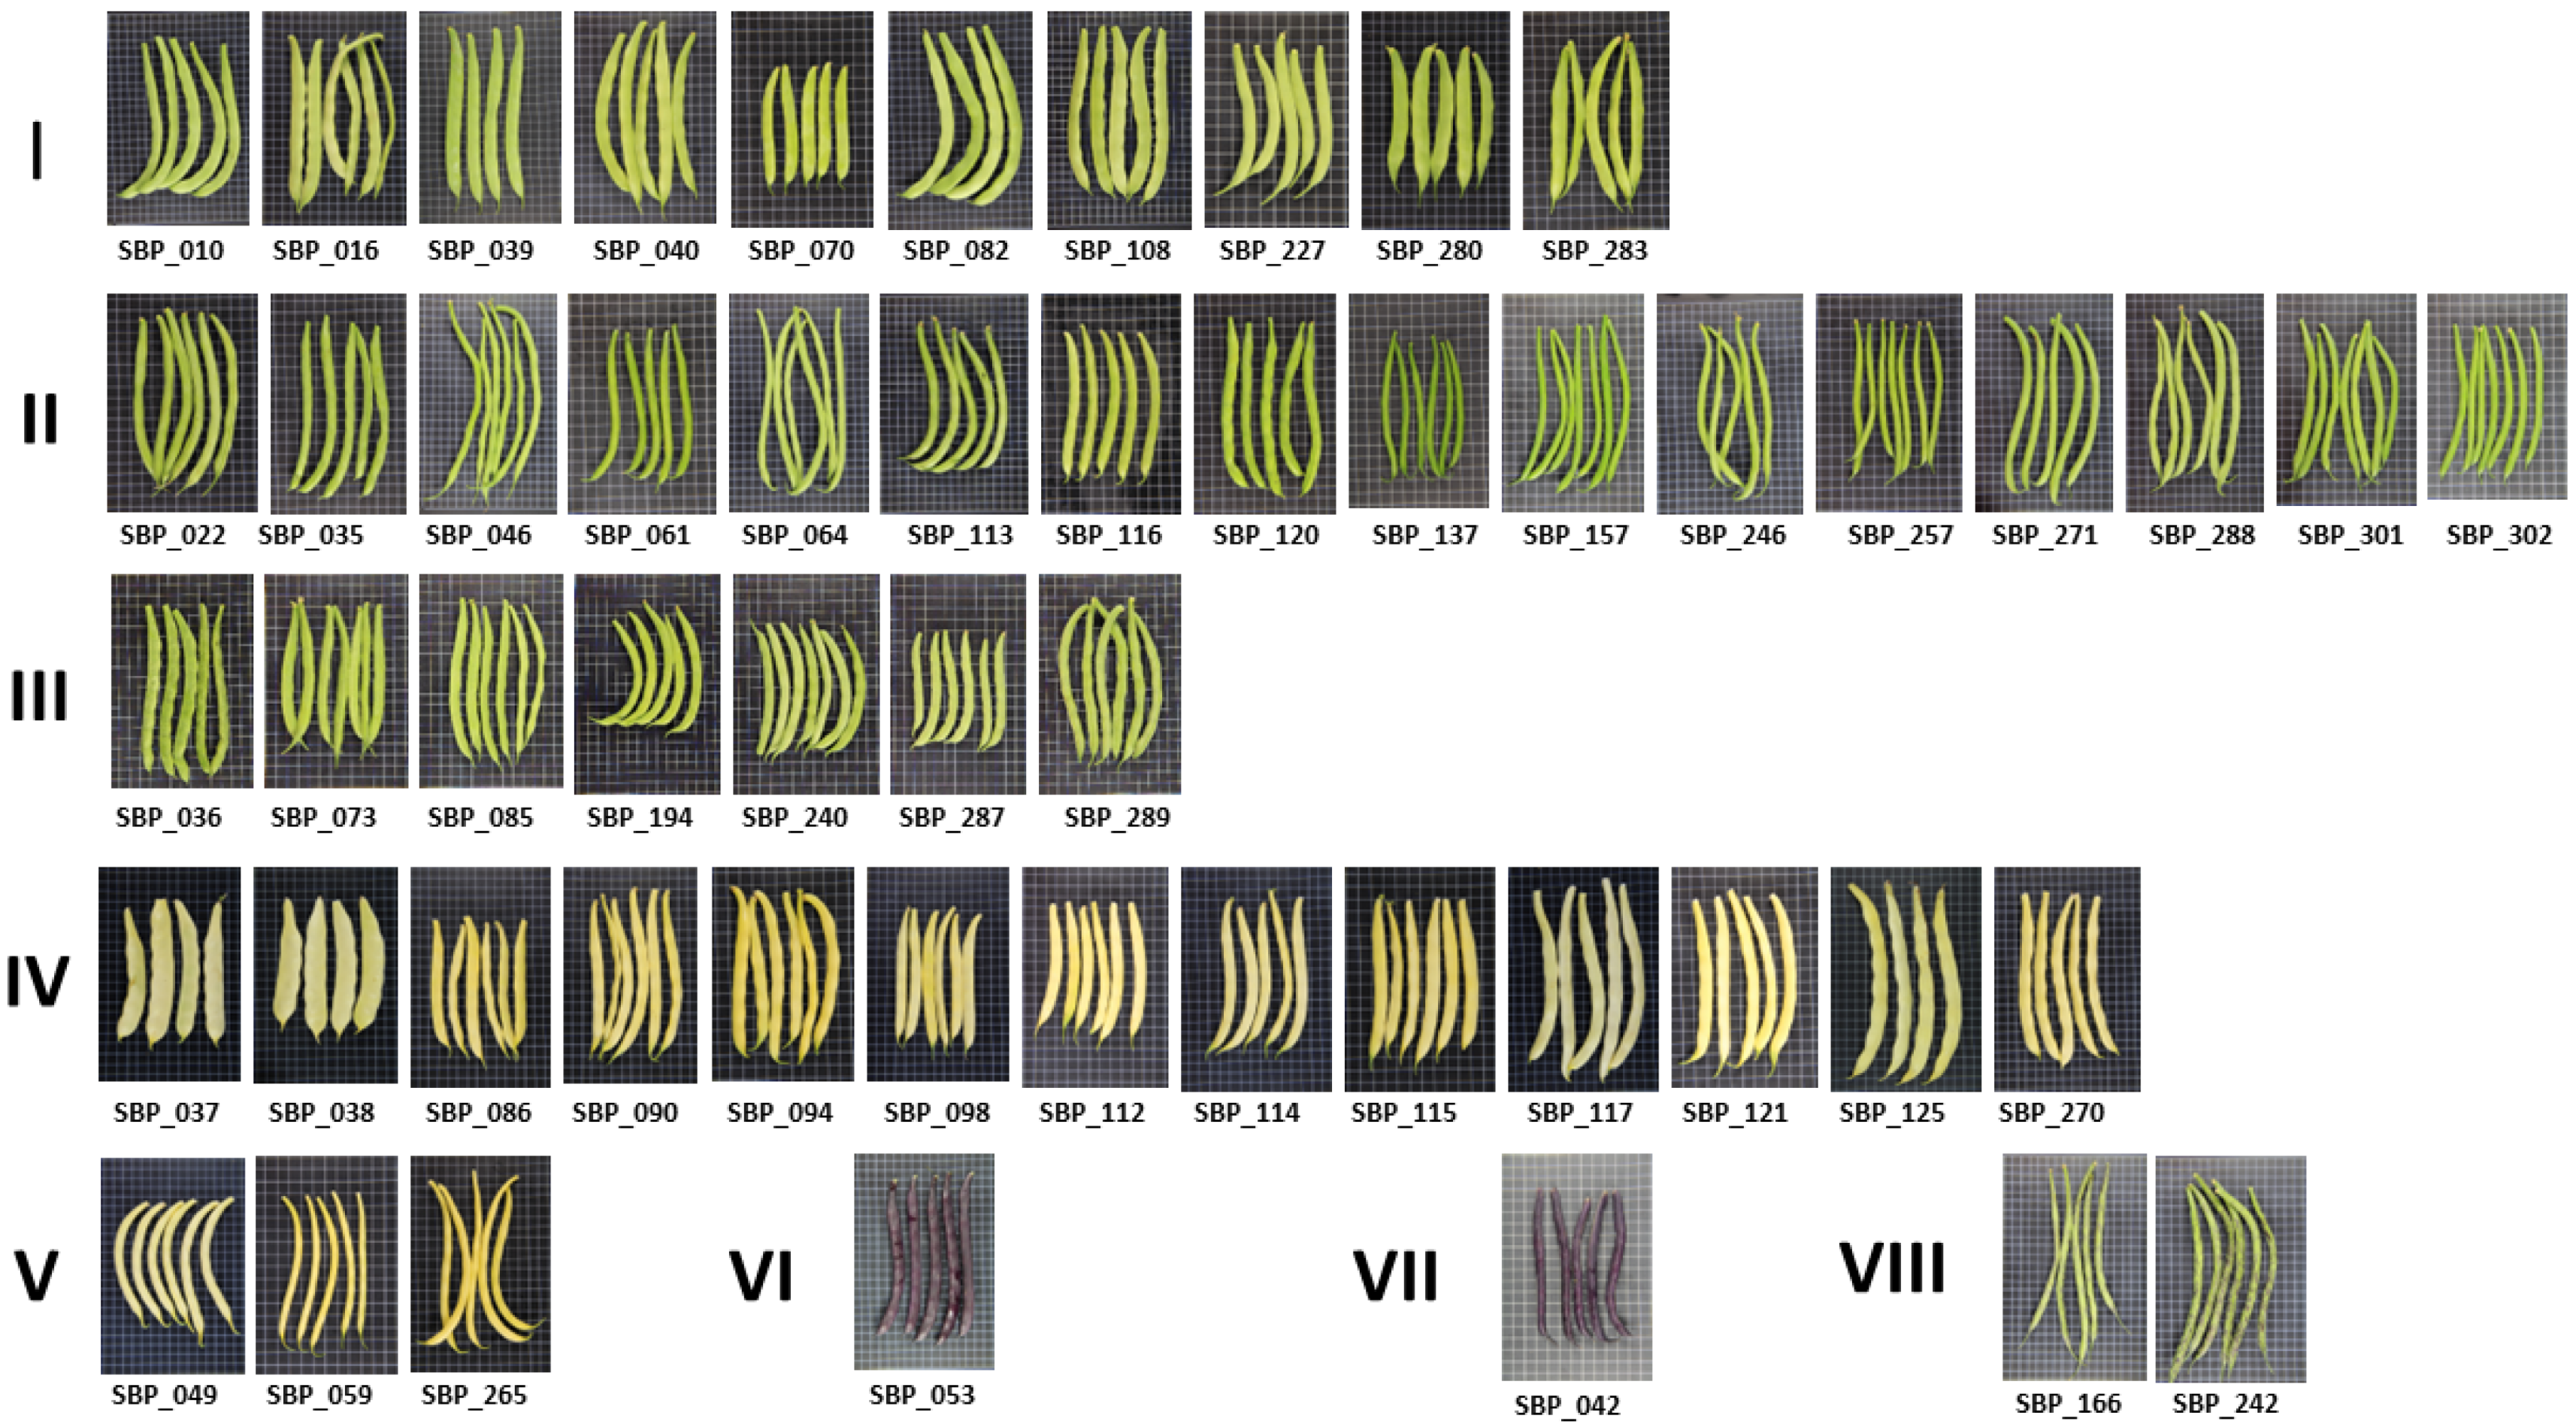
| Line Code | DOI 1 | Gene Pool 2 | Biological Status | Growth Habit | Fresh Pod Color | Cross-Section Shape | Group | Total Number of Lines |
|---|---|---|---|---|---|---|---|---|
| SBP010 | 10.18730/SBC1E | AND | cultivar | indeterminate | green | flat | I | 10 |
| SBP016 | 10.18730/SC0XG | AND | cultivar | determinate | green | flat | I | |
| SBP039 | 10.18730/SC1J0 | AND | landrace | determinate | green | flat | I | |
| SBP040 | 10.18730/SC1K1 | AND | landrace | determinate | green | flat | I | |
| SBP070 | 10.18730/H7QGQ | MESO | landrace | determinate | green | flat | I | |
| SBP082 | 10.18730/H7PJY | AND | cultivar | indeterminate | green | flat | I | |
| SBP108 | 10.18730/H825Z | AND | landrace | determinate | green | flat | I | |
| SBP227 | 10.18730/SC4MR | AND | cultivar | determinate | green | flat | I | |
| SBP280 | 10.18730/SC61* | AND | breeding line | determinate | green | flat | I | |
| SBP283 | 10.18730/SC62~ | AND | landrace | determinate | green | flat | I | |
| SBP022 | 10.18730/SC13P | AND | cultivar | determinate | green | round | II | 16 |
| SBP035 | 10.18730/SC1E~ | MESO | landrace | indeterminate | green | round | II | |
| SBP046 | 10.18730/SC1S7 | AND | cultivar | determinate | green | round | II | |
| SBP061 | 10.18730/SC24J | MIX | cultivar | determinate | green | round | II | |
| SBP064 | 10.18730/SC27N | AND | cultivar | indeterminate | green | round | II | |
| SBP113 | 10.18730/H82H6 | AND | landrace | determinate | green | round | II | |
| SBP116 | 10.18730/H847Q | MESO | landrace | indeterminate | green | round | II | |
| SBP120 | 10.18730/SC2K~ | MESO | landrace | indeterminate | green | round | II | |
| SBP137 | 10.18730/SC34D | MIX | cultivar | determinate | green | round | II | |
| SBP157 | 10.18730/SC543 | AND | cultivar | determinate | green | round | II | |
| SBP246 | 10.18730/SC5DC | AND | cultivar | determinate | green | round | II | |
| SBP257 | 10.18730/SC5TS | AND | cultivar | determinate | green | round | II | |
| SBP271 | 10.18730/SBB9V | AND | cultivar | determinate | green | round | II | |
| SBP288 | 10.18730/SC6E8 | AND | cultivar | determinate | green | round | II | |
| SBP301 | 10.18730/SC6F9 | MIX | cultivar | determinate | green | round | II | |
| SBP302 | 10.18730/SC1F$ | MIX | cultivar | determinate | green | round | II | |
| SBP036 | 10.18730/H81C6 | MESO | landrace | indeterminate | green | elliptical | III | 8 |
| SBP073 | 10.18730/H7VG3 | AND | landrace | determinate | green | elliptical | III | |
| SBP085 | 10.18730/SC415 | AND | landrace | determinate | green | elliptical | III | |
| SBP194 | 10.18730/SC426 | MIX | cultivar | determinate | green | elliptical | III | |
| SBP195 | 10.18730/SC4Z= | MIX | cultivar | determinate | green | elliptical | III | |
| SBP240 | 10.18730/SBC4H | MIX | cultivar | determinate | green | elliptical | III | |
| SBP287 | 10.18730/SBBV8 | MESO | cultivar | determinate | green | elliptical | III | |
| SBP289 | 10.18730/SC1G= | AND | cultivar | determinate | green | elliptical | III | |
| SBP037 | 10.18730/SC1HU | AND | landrace | indeterminate | yellow | flat | IV | 13 |
| SBP038 | 10.18730/H7XV4 | AND | landrace | indeterminate | yellow | flat | IV | |
| SBP086 | 10.18730/H7YEQ | AND | landrace | determinate | yellow | flat | IV | |
| SBP090 | 10.18730/H7YY2 | n.a. | n.a. | determinate | yellow | flat | IV | |
| SBP094 | 10.18730/H80CB | AND | landrace | determinate | yellow | flat | IV | |
| SBP098 | 10.18730/H82G5 | AND | landrace | determinate | yellow | flat | IV | |
| SBP112 | 10.18730/H82M9 | AND | landrace | determinate | yellow | flat | IV | |
| SBP114 | 10.18730/H82NA | AND | cultivar | determinate | yellow | flat | IV | |
| SBP115 | 10.18730/H83Q7 | AND | landrace | determinate | yellow | flat | IV | |
| SBP117 | 10.18730/H84EY | n.a. | landrace | indeterminate | yellow | flat | IV | |
| SBP121 | 10.18730/H851C | AND | landrace | indeterminate | yellow | flat | IV | |
| SBP125 | 10.18730/SC5SR | AND | landrace | indeterminate | yellow | flat | IV | |
| SBP270 | 10.18730/SC1V9 | AND | cultivar | determinate | yellow | flat | IV | |
| SBP049 | 10.18730/SC22G | AND | cultivar | determinate | yellow | round | V | 3 |
| SBP059 | 10.18730/SC5MK | MIX | cultivar | determinate | yellow | round | V | |
| SBP265 | 10.18730/SC1XB | AND | cultivar | determinate | yellow | round | V | |
| SBP053 | 10.18730/SC1N3 | MESO | cultivar | indeterminate | purple | flat | VI | 1 |
| SBP042 | 10.18730/SC3BM | MIX | cultivar | determinate | purple | round | VII | 1 |
| SBP166 | 10.18730/SC50U | AND | cultivar | determinate | mottled green | round | VIII | 2 |
| SBP242 | 10.18730/SBC1E | AND | cultivar | determinate | mottled green | round | VIII |
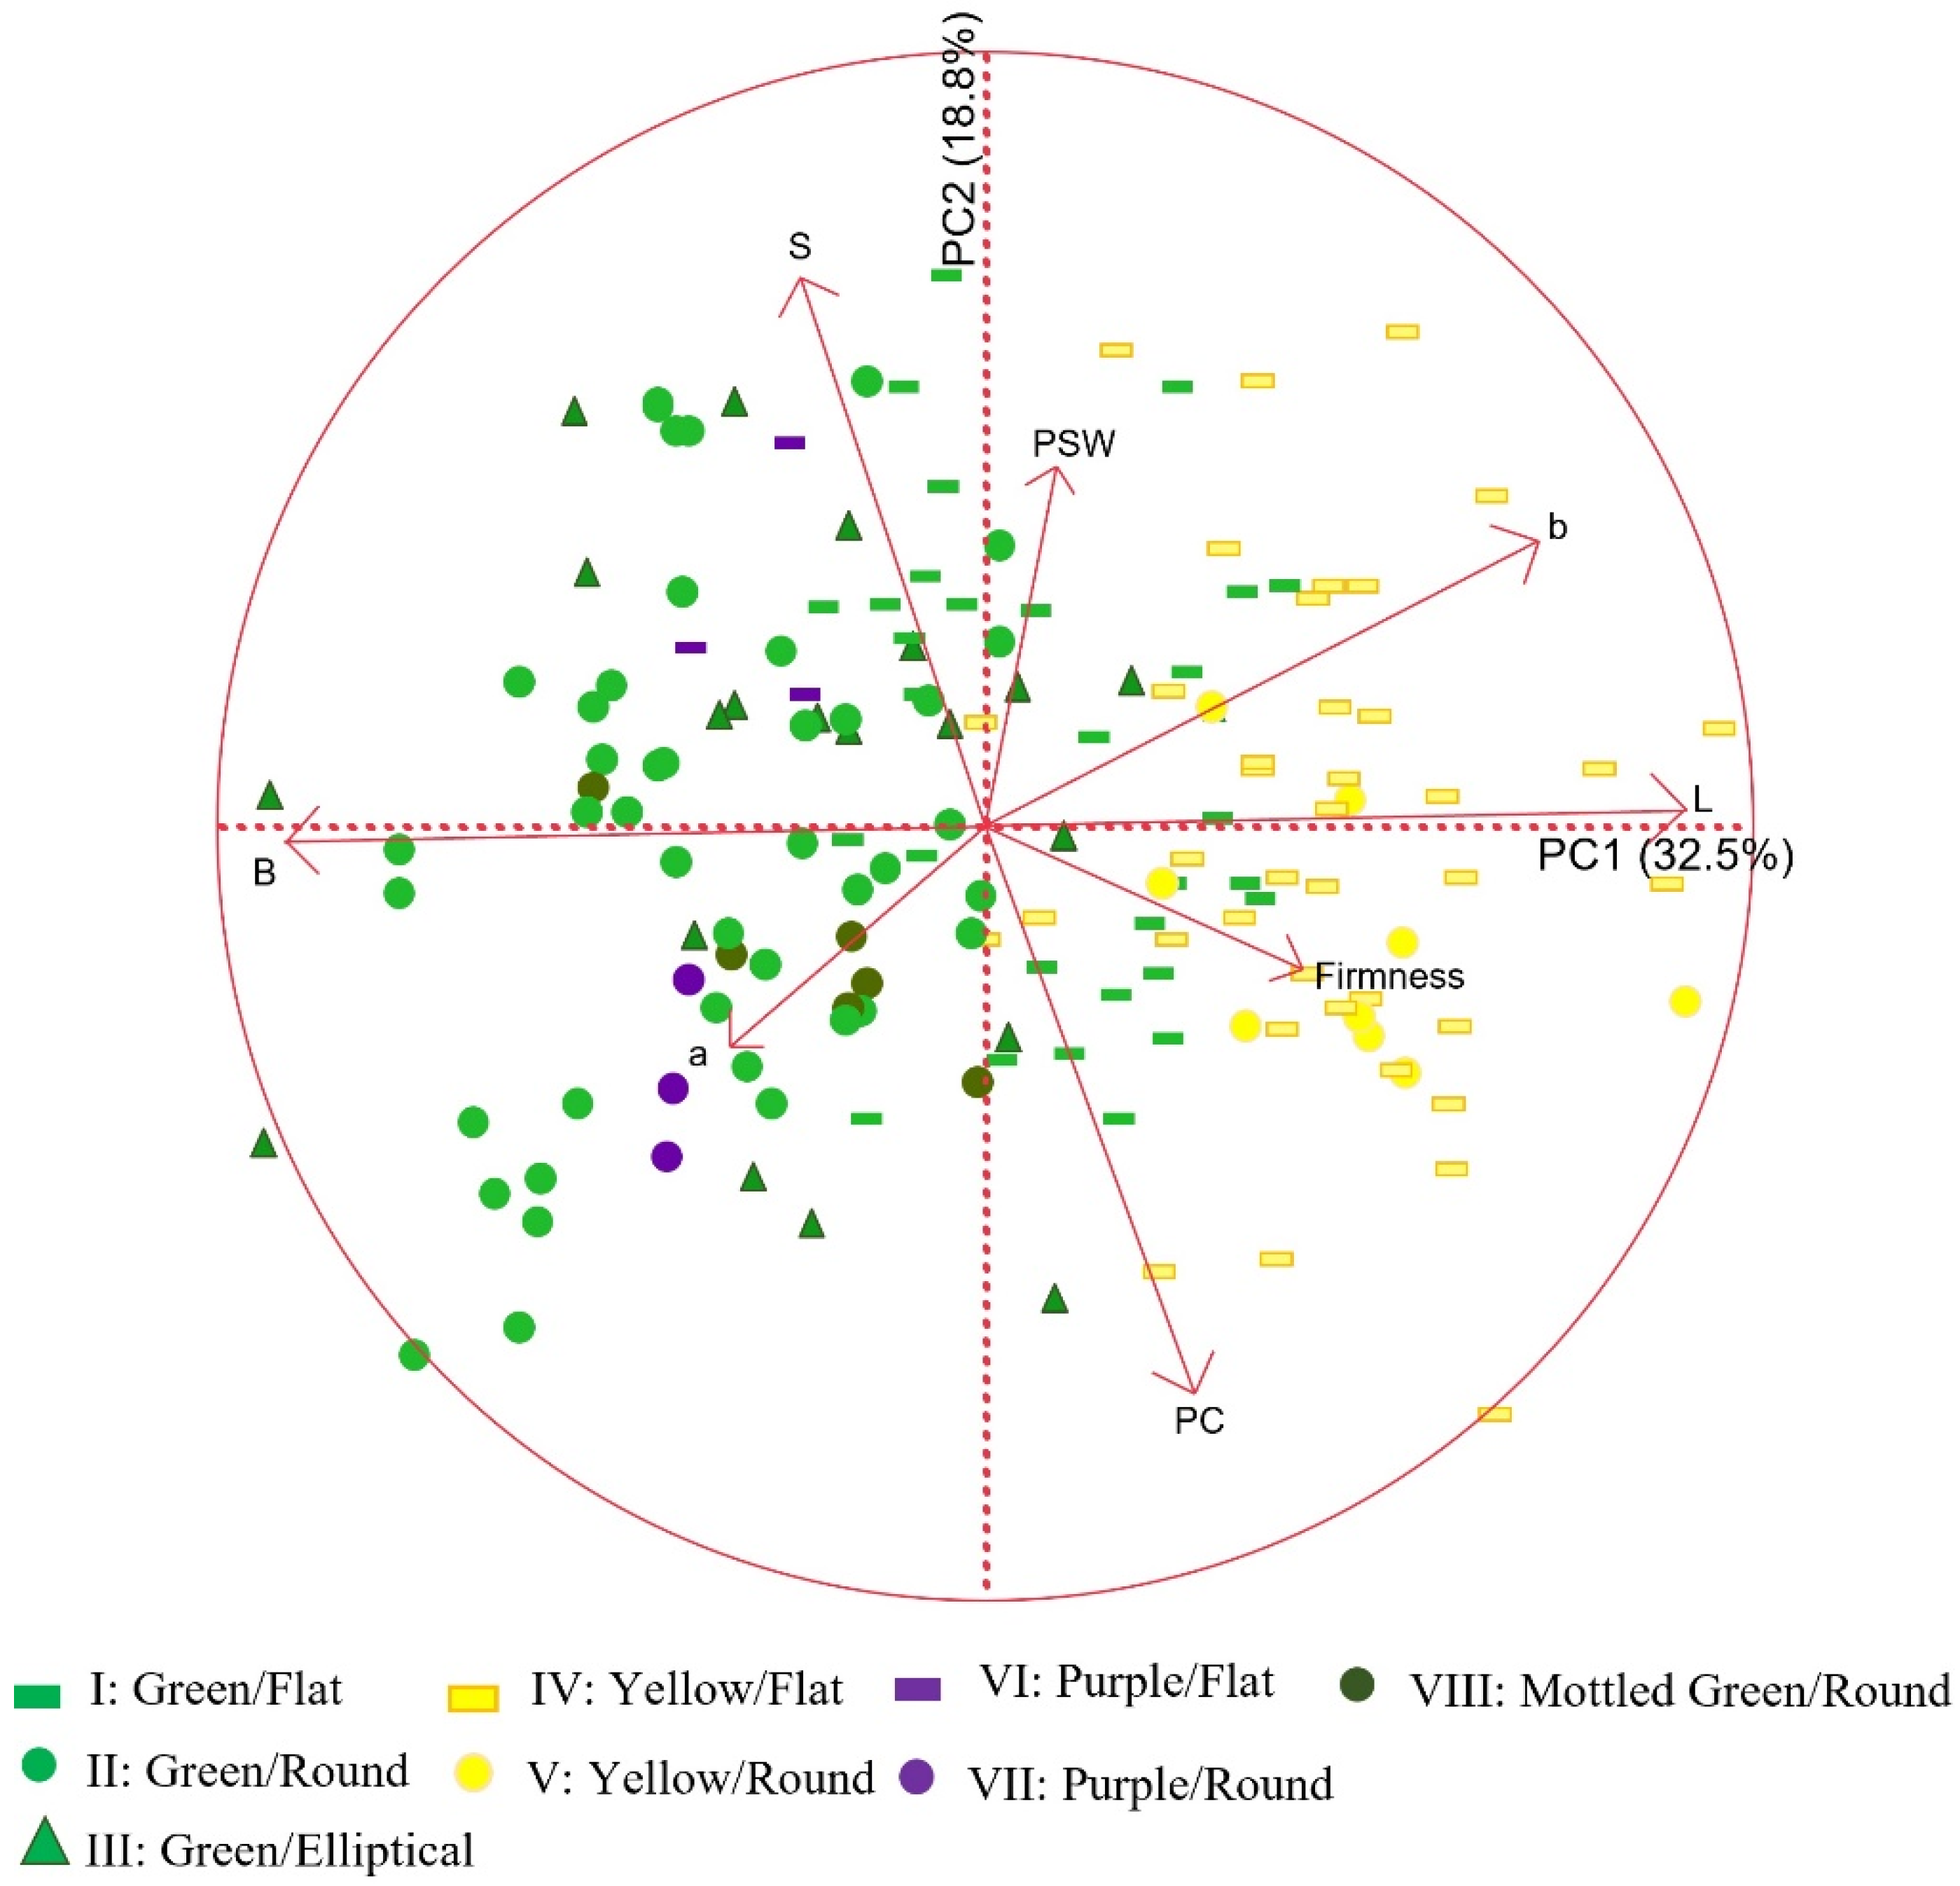
| Traits 1 | Description of Trait | Unit | Mean | Min | Max | SE |
|---|---|---|---|---|---|---|
| Pod Section Width (PSW) | Width of the section taken perpendicular to the suture of 6 randomly pods | mm | 7.13 | 5.22 | 9.02 | 0.10 |
| Total Sugar Content (S) | Total sugar content determined from the extracted juice | °Brix | 5.04 | 4.27 | 6.40 | 0.08 |
| Protein Content (PC) | N × 6.25 | % | 21.59 | 16.82 | 26.60 | 0.31 |
| Firmness | Rupture Force | N | 13.15 | 5.87 | 23.76 | 0.60 |
| CIE-L* | Brightness (L* = 0 [black], L* = 100 [white]) | 43.46 | 31.95 | 56.27 | 1.02 | |
| CIE-a* | (−a* = greenness, +a* = redness) | −7.63 | −9.82 | −4.36 | 0.15 | |
| CIE-b* | (−b* = blueness, +b* = yellowness) | 17.90 | 9.96 | 25.80 | 0.46 | |
| B | Brownness (100 − CIE-L*) | 56.57 | 43.73 | 68.05 | 1.03 |
| Group Code | PSW | PC | Sugar | Firmness | L* | a* | b* | B (100-L*) |
|---|---|---|---|---|---|---|---|---|
| I | 6.98 | 20.67 c 1 | 5.16 b | 19.45 a | 42.25 b | −8.84 b | 20.13 a | 57.75 c |
| II | 7.07 | 20.97 c | 5.12 b | 10.30 c | 36.97 d | −7.30 a | 15.47 bc | 63.02 a |
| III | 7.29 | 21.31 c | 5.16 b | 11.20 bc | 38.76 d | −7.85 a | 16.94 b | 61.24 b |
| IV | 7.30 | 21.99 abc | 4.94 bc | 13.58 b | 54.34 a | −7.12 a | 20.06 a | 45.66 d |
| V | 7.09 | 23.92 ab | 4.63 c | 12.29 bc | 53.33 a | −7.85 ab | 21.04 a | 46.66 d |
| VI | 6.42 | 20.10 bc | 6.37 a | 10.75 bc | 39.55 bcd | −7.64 ab | 17.77 abc | 60.45 abc |
| VII | 6.99 | 25.13 a | 5.17 bc | 11.32 bc | 37.33 cd | −6.34 a | 12.20 c | 62.66 ab |
| VIII | 7.41 | 21.52 abc | 4.52 c | 12.11 bc | 39.30 cd | −6.99 a | 15.29 bc | 60.70 ab |
| p | n.s. | 0.0241 | 0.0005 | <0.0001 | <0.0001 | 0.0007 | <0.0001 | <0.0001 |
Disclaimer/Publisher’s Note: The statements, opinions and data contained in all publications are solely those of the individual author(s) and contributor(s) and not of MDPI and/or the editor(s). MDPI and/or the editor(s) disclaim responsibility for any injury to people or property resulting from any ideas, methods, instructions or products referred to in the content. |
© 2023 by the authors. Licensee MDPI, Basel, Switzerland. This article is an open access article distributed under the terms and conditions of the Creative Commons Attribution (CC BY) license (https://creativecommons.org/licenses/by/4.0/).
Share and Cite
Menga, V.; Fares, C.; Campa, A.; Ferreira, J.J.; Bitocchi, E.; Papa, R.; Beleggia, R. Variability of Nutritional, Antioxidant, and Textural Traits of a Collection of Snap Beans of Different Colors. Horticulturae 2023, 9, 311. https://doi.org/10.3390/horticulturae9030311
Menga V, Fares C, Campa A, Ferreira JJ, Bitocchi E, Papa R, Beleggia R. Variability of Nutritional, Antioxidant, and Textural Traits of a Collection of Snap Beans of Different Colors. Horticulturae. 2023; 9(3):311. https://doi.org/10.3390/horticulturae9030311
Chicago/Turabian StyleMenga, Valeria, Clara Fares, Ana Campa, Juan Jose Ferreira, Elena Bitocchi, Roberto Papa, and Romina Beleggia. 2023. "Variability of Nutritional, Antioxidant, and Textural Traits of a Collection of Snap Beans of Different Colors" Horticulturae 9, no. 3: 311. https://doi.org/10.3390/horticulturae9030311