Article

Physiological and Transcriptomic Analyses Reveal the Response of Medicinal Plant Bletilla striata (Thunb. ex A. Murray) Rchb. f. via Regulating Genes Involved in the ABA Signaling Pathway, Photosynthesis, and ROS Scavenging under Drought Stress

1
Institute of Modern Chinese Herbal Medicines, Guizhou Academy of Agricultural Sciences, Guiyang 550025, China
2
Science and Technology Bureau of Pengyang County, Guyuan 756500, China
3
Fujian Key Laboratory of Subtropical Plant Physiology and Biochemistry, Fujian Institute of Subtropical Botany, Xiamen 361006, China
*
Authors to whom correspondence should be addressed.
Horticulturae 2023, 9(3), 307; https://doi.org/10.3390/horticulturae9030307
Submission received: 24 November 2022 / Revised: 10 February 2023 / Accepted: 20 February 2023 / Published: 23 February 2023

Abstract

:
Bletilla striata is a valuable Chinese herbal medicinal plant widely used in various fields. To meet the market demand for this herb, the tissue culture technology of B. striata was developed. However, drought stress has been a significant threat to the survival of cultivated B. striata. To further understand the underlying mechanisms of B. striata under drought stress, its response was investigated at the physiological and transcriptional levels. Our photosynthesis results show that the decline of the net photosynthesis rate (Pn) in B. striata leaves was mainly caused by nonstomatal limitation factors. Using transcriptomic analysis 2398, differentially expressed genes (DEGs) were identified. KEGG enrichment analysis showed that DEGs involved in plant hormone signal transduction (ko04075) were significantly altered, especially the abscisic-acid signaling pathway. The up-regulations of the serine/threonine protein kinase (SnRK2) and S-type anion (SLAH2) channels might lead to stomatal closure, which is the reason for decline of photosynthesis. Moreover, the downregulation of cytochrome b6 and photosystem I reaction center subunit III/IV might be the major reason for nonstomatal limitation. In addition, B. striata enhanced the ability of ROS scavenging via activating the gene expression of superoxide dismutase, catalase, and peroxidase in response to drought stress. Our study enhanced the understanding of B. striata in response to drought stress.

1. Introduction

Drought is a critical environmental factor that seriously threatens plant growth and development [1]. Drought stress hampers various biological processes in plants, such as photosynthesis, cell elongation, nutrient uptake, and reproduction [2,3,4,5,6]. Plants have evolved a battery of defense mechanisms to ensure their survival and fitness in the face of a drought.
One plant response to drought is to reduce stomatal apertures so that leaf water potential is maintained [7]. While it restricts water from exiting, stomatal closure also restricts CO2 from entering, thereby reducing the photosynthesis rate. Reactive oxygen species (ROSs) are also produced from photosynthesis and photorespiration [8]. The restriction of the photosynthesis rate caused by stomatal closure leads to overproduction of toxic ROS, which disrupts the electron transport system and starves cellular organelles of their carbon feedstock [7]. These toxic compounds cause oxidative damage that limits plant growth and development [8]. In response to this, a cell would synthesize antioxidants such as catalase (CAT), superoxide dismutase (SOD), peroxidase (POX), ascorbate peroxidase (APX), glutathione (GSH), and glutathione sulfo-transferase (GST) [9]. The biosyntheses of these complex antioxidants form the primary defense line against drought stress [10,11,12].
As a valuable Chinese herbal medicine, Bletilla striata (Thunb. ex A. Murray) Rchb. f. has received increasing attention from scholars in the last decade. The Bletilla striata polysccharide (BSP) is the important component in the B. striata tuber, purported to accelerate localized hemostasis in the lungs and stomach [13,14]. The development of omics technology enabled us to further explore the potential application value of B. striata. With bioinformatic analyses of the transcriptome data, auxin/indole-3-acetic acid (Aux/IAA) genes were suggested to participate in B. striata tuber development [15]. Similarly, another transcriptomic study proposed a pathway for BSP biosynthesis [16]. Recently, the genome of B. striata was sequenced and analyzed, and it will enhance molecular marker-assisted breeding of B. striata to improve traits of medicinal value [17]. These studies provide a solid foundation for B. striata planting and engineering of breeding for the future.
Although B. striata is widely distributed in China, the current industry of foraging B. striata from the wilderness is unable to meet the market demand not only due to its long growth periods and low breeding efficiency but also because it is widely used in various fields [18,19]. To solve this problem, the tissue culture technique was applied to successfully breed tissue culture seedlings [20]. However, the seedlings suffered from dehydration when they were transplanted to greenhouses and fields. Recently, a study found that PYLs-PP2C22/38-SnRK2s function as the ABA core signal pathway in response to multiple abiotic stresses [21]. Another study of B. striata suggested that an appropriate drought condition could improve its growth [22]. However, the mechanism of B. striata in response to drought stress is not well-known. To better understand the underlying mechanism of the B. striata response to drought stress, physiological and transcriptomic analyses were performed in the present study.

2. Materials and Methods

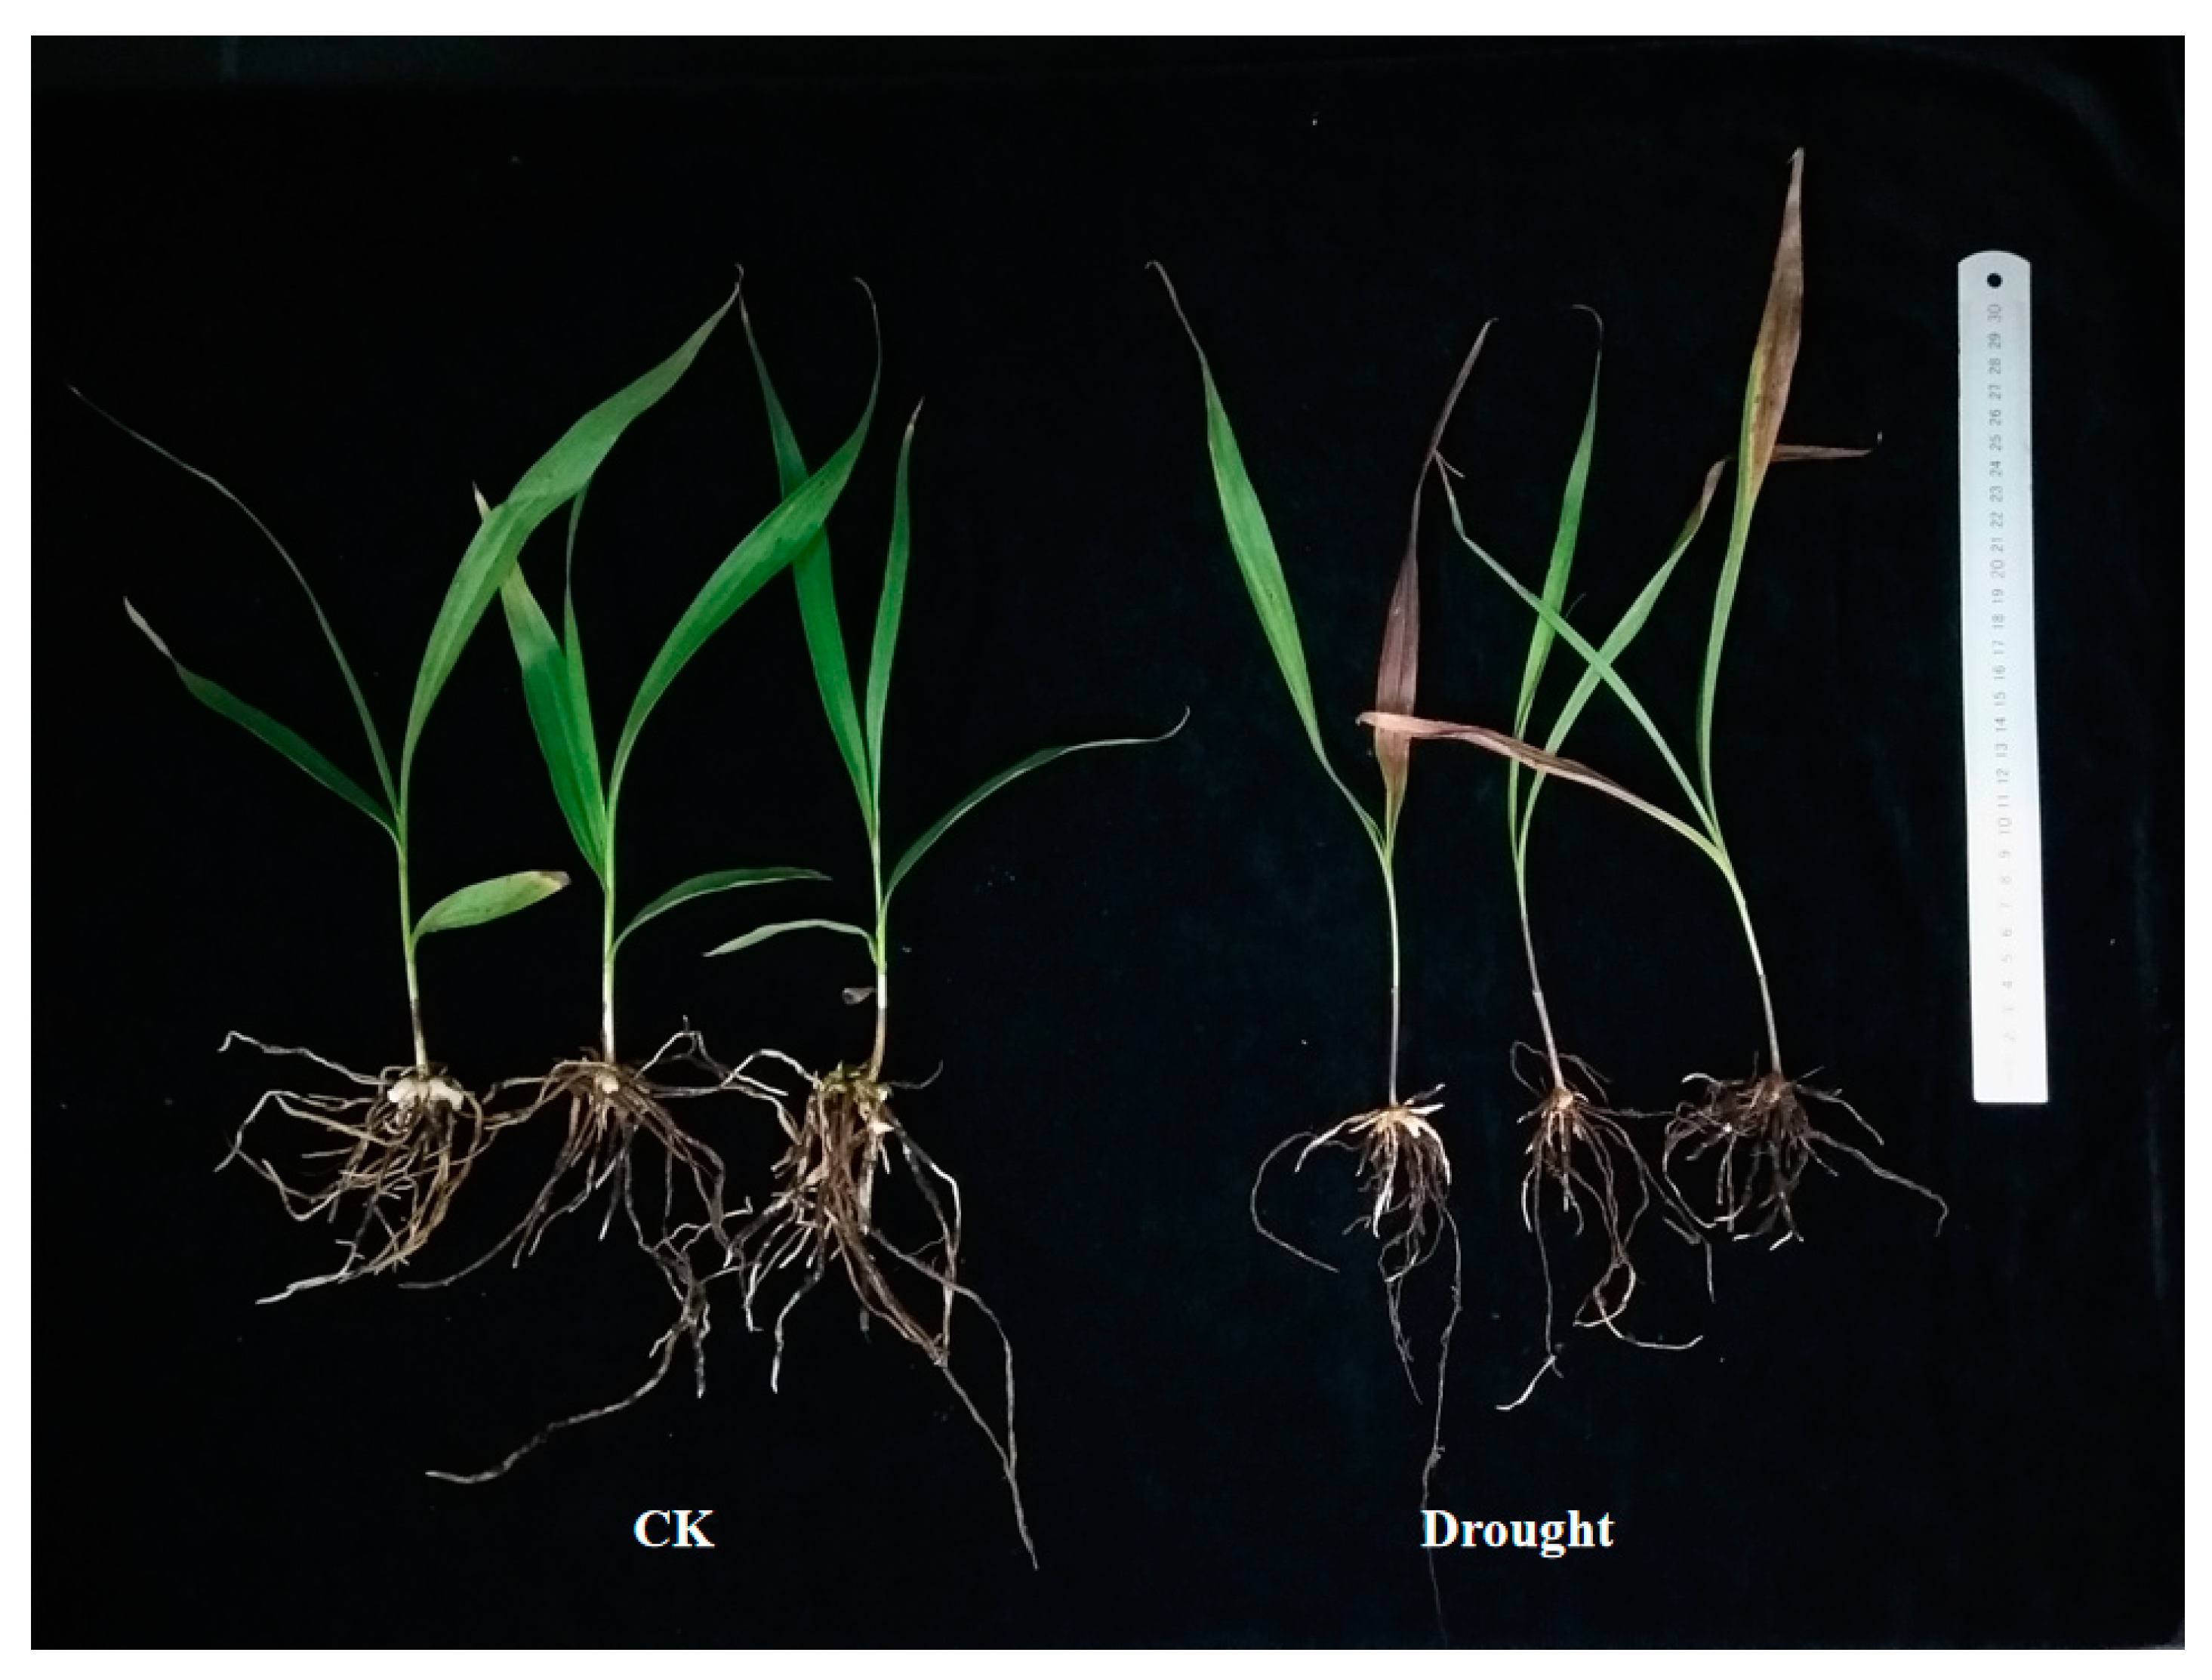
2.1. Plant Growth and Drought Treatment

Bletilla striata seedlings were produced through tissue culturing at the Institute of Modern Chinese Herbal Medicines, Guizhou Academy of Agricultural Sciences (Guizhou, China). Three seedlings with similar sizes (22–26 cm height, with 3 leaves) were transplanted into one pot (15 cm height × 14 cm diameter). A mixture of humus, vermiculite, and sand (1:1:1, v:v:v) was used as a soil matrix. Every twelve pots were put in a box (each group contained 36 seedlings at least). The seedlings were grown in a greenhouse at a daily temperature of 26–28 °C, a light intensity of 500–800 μmL·m−2·s−1, a photoperiod of 12/12 h (day/night), and a relative humidity of 50–80%. After two weeks of cultivation in the greenhouse, healthy seedlings were randomly divided into two groups (CK and drought).
At the beginning of the drought treatment, the plot containing soil matric was fully irrigated with tap water and put in a greenhouse until no water came out from the bottom of the plot. Then, the weight of the soil was recorded (g1). The soil was dried out until its weight was stable (g2). Subsequently, soil water content was calculated with the following formula: soil water content = (g1 − g2)/g2 × 100%. Afterward, a certain amount of water (g3) was added to the soil (soil water content = g3/(g2 + g3) × 100%). Then, the B. striate seedlings were transplanted into these plots. The seedlings were irrigated with tap water every three days to maintain the soil water content at 25–35% (CK) or 5–10% (drought) for four weeks. Soil water content was real-time-monitored using time-domain reflectometry (Field Scout TDR 100, Spectrum Technologies Inc., Aurora, CO, USA). Each group had three replicates.

2.2. Leaf Photosynthesis Measurement

The second fully expanded leaf from the top was selected for photosynthesis measurement using the portable Li-6400XT photosynthesis measurement system (Li-6400, Li-Cor, Lincoln, NE, USA). This test measured the net photosynthetic rate (Pn), intercellular CO2 concentration (Ci), stomatal conductance (Gs), and transpiration rate (E) of the plant. From there, the stomatal limitation (Ls) and nonstomatal limitation (Ci/Gs) were calculated using formulae described in previous studies [23,24]. For each treatment, the photosynthesis measurement was performed on at least five seedlings. The photosynthetically active radiation (PAR) was set at 500 μmol·m−2·s−1, while the concentration of atmospheric CO2 was maintained at around 400 μmol·mol−1.

2.3. RNA Extraction, Library Construction, and Sequencing

A 0.2 g sample of a fresh leaf was ground into powder in liquid nitrogen, and the total RNA was extracted using the Trizol (Invitrogen, Carlsbad, CA, USA) method, following the instructions provided by the vendor. The RNA quality was analyzed using the RNA Nano 6000 Assay Kit of the Bioanalyzer 2100 system (Agilent Technologies, Santa Clara, CA, USA). The value of the RIN (RNA integrity number) should have been higher than 8.5, and 28S:18S should have been higher than 1.5. After RNA extraction, a cDNA library was constructed according to vendor recommendation (Illumina, San Diego, CA, USA). The total RNA was used to isolate poly-(A) mRNA with Oligo-(dT) magnetic beads. The poly-(A) mRNA was fragmented in a fragmentation buffer. M-MuLV reverse transcriptase (RNase H-) was used for first-strand cDNA synthesis. The synthesis of second-strand cDNA was catalyzed with DNA polymerase in a buffer containing dNTPs and RNaseH. The passivation of the remaining overhangs was conducted through exonuclease/polymerase activities. With adenylation of 3′ ends of DNA fragments, a NEBNext adaptor with a hairpin loop structure was ligated to prepare for hybridization. The cDNA fragments with 250–300 bp lengths were purified with an AMPure XP system (Beckman Coulter, Beverly, CA, USA). Then, 3 μL of the USER enzyme (NEB, Ipswich, MA, USA) was used with size-selected, adaptor-ligated cDNA at 37 °C for 15 min. This selected cDNA was amplified by the polymerase chain reaction (PCR) in the mixed solution containing Universal PCR primers, Q5 Hot Start HiFi DNA polymerase, and Index (X) primer.
The amplified DNA were purified (AMPure XP system), and the quality of the cDNA library was assessed using the Agilent Bioanalyzer 2100 system. The index-coded samples were clustered using a cBot Cluster Generation System and a TruSeq PE Cluster Kit v4-cBot-HS (Illumia, San Diego, CA, USA) according to the vendor instructions. Afterward, the library preparations were sequenced on an Illumina Hiseq 2500 platform, and 100/50 bp single-end reads were generated.

2.4. De Novo Assembly and Sequence Annotation

Raw data were initially processed through in-house perl scripts, resulting in clean data, which was defined as having a Q20 value higher than 90% per our quality assessment criteria. The clean data were assembled using Trinity software [25]. Unigenes were generated and aligned to various databases. The thresholds for the Nr, Nt, and Swiss-Prot databases were each less than 1 × 10⁻⁵, and the thresholds for the Pfam, KOG, GO, and KEGG databases were less than 1 × 10⁻², 1 × 10⁻³, 1 × 10⁻⁶, and 1 × 10⁻¹⁰, respectively.

2.5. Analyses of Differentially Expressed Genes (DEGs)

The clean data were searched against the assembled unigenes, and the read count for each unigene was calculated using the RSEM method [26]. EdgeR software was used to adjust the read counts through one scaling normalized factor. Differential expression analysis was then performed using the DEGSeq R package. The p values were adjusted using the method described by Yoav et al. [27]. The threshold of significant differential expression was q-value < 0.005, |log2(fold change)| > 1.

2.6. KEGG Enrichment Analysis of Differentially Expressed Genes

KEGG and GO (Biological process) enrichment were performed to further understand the function of differentially expressed genes (DEGs). Hypergeometric distribution was used to test the statistical enrichment of DEGs in KEGG pathways.

2.7. Statistical Analysis

The data displayed in the figures were presented as means ± SE. The statistical significance of all data was analyzed using a univariate analysis of variance (p < 0.05) (one-way ANOVA; SPSS version 19.0).

3. Results

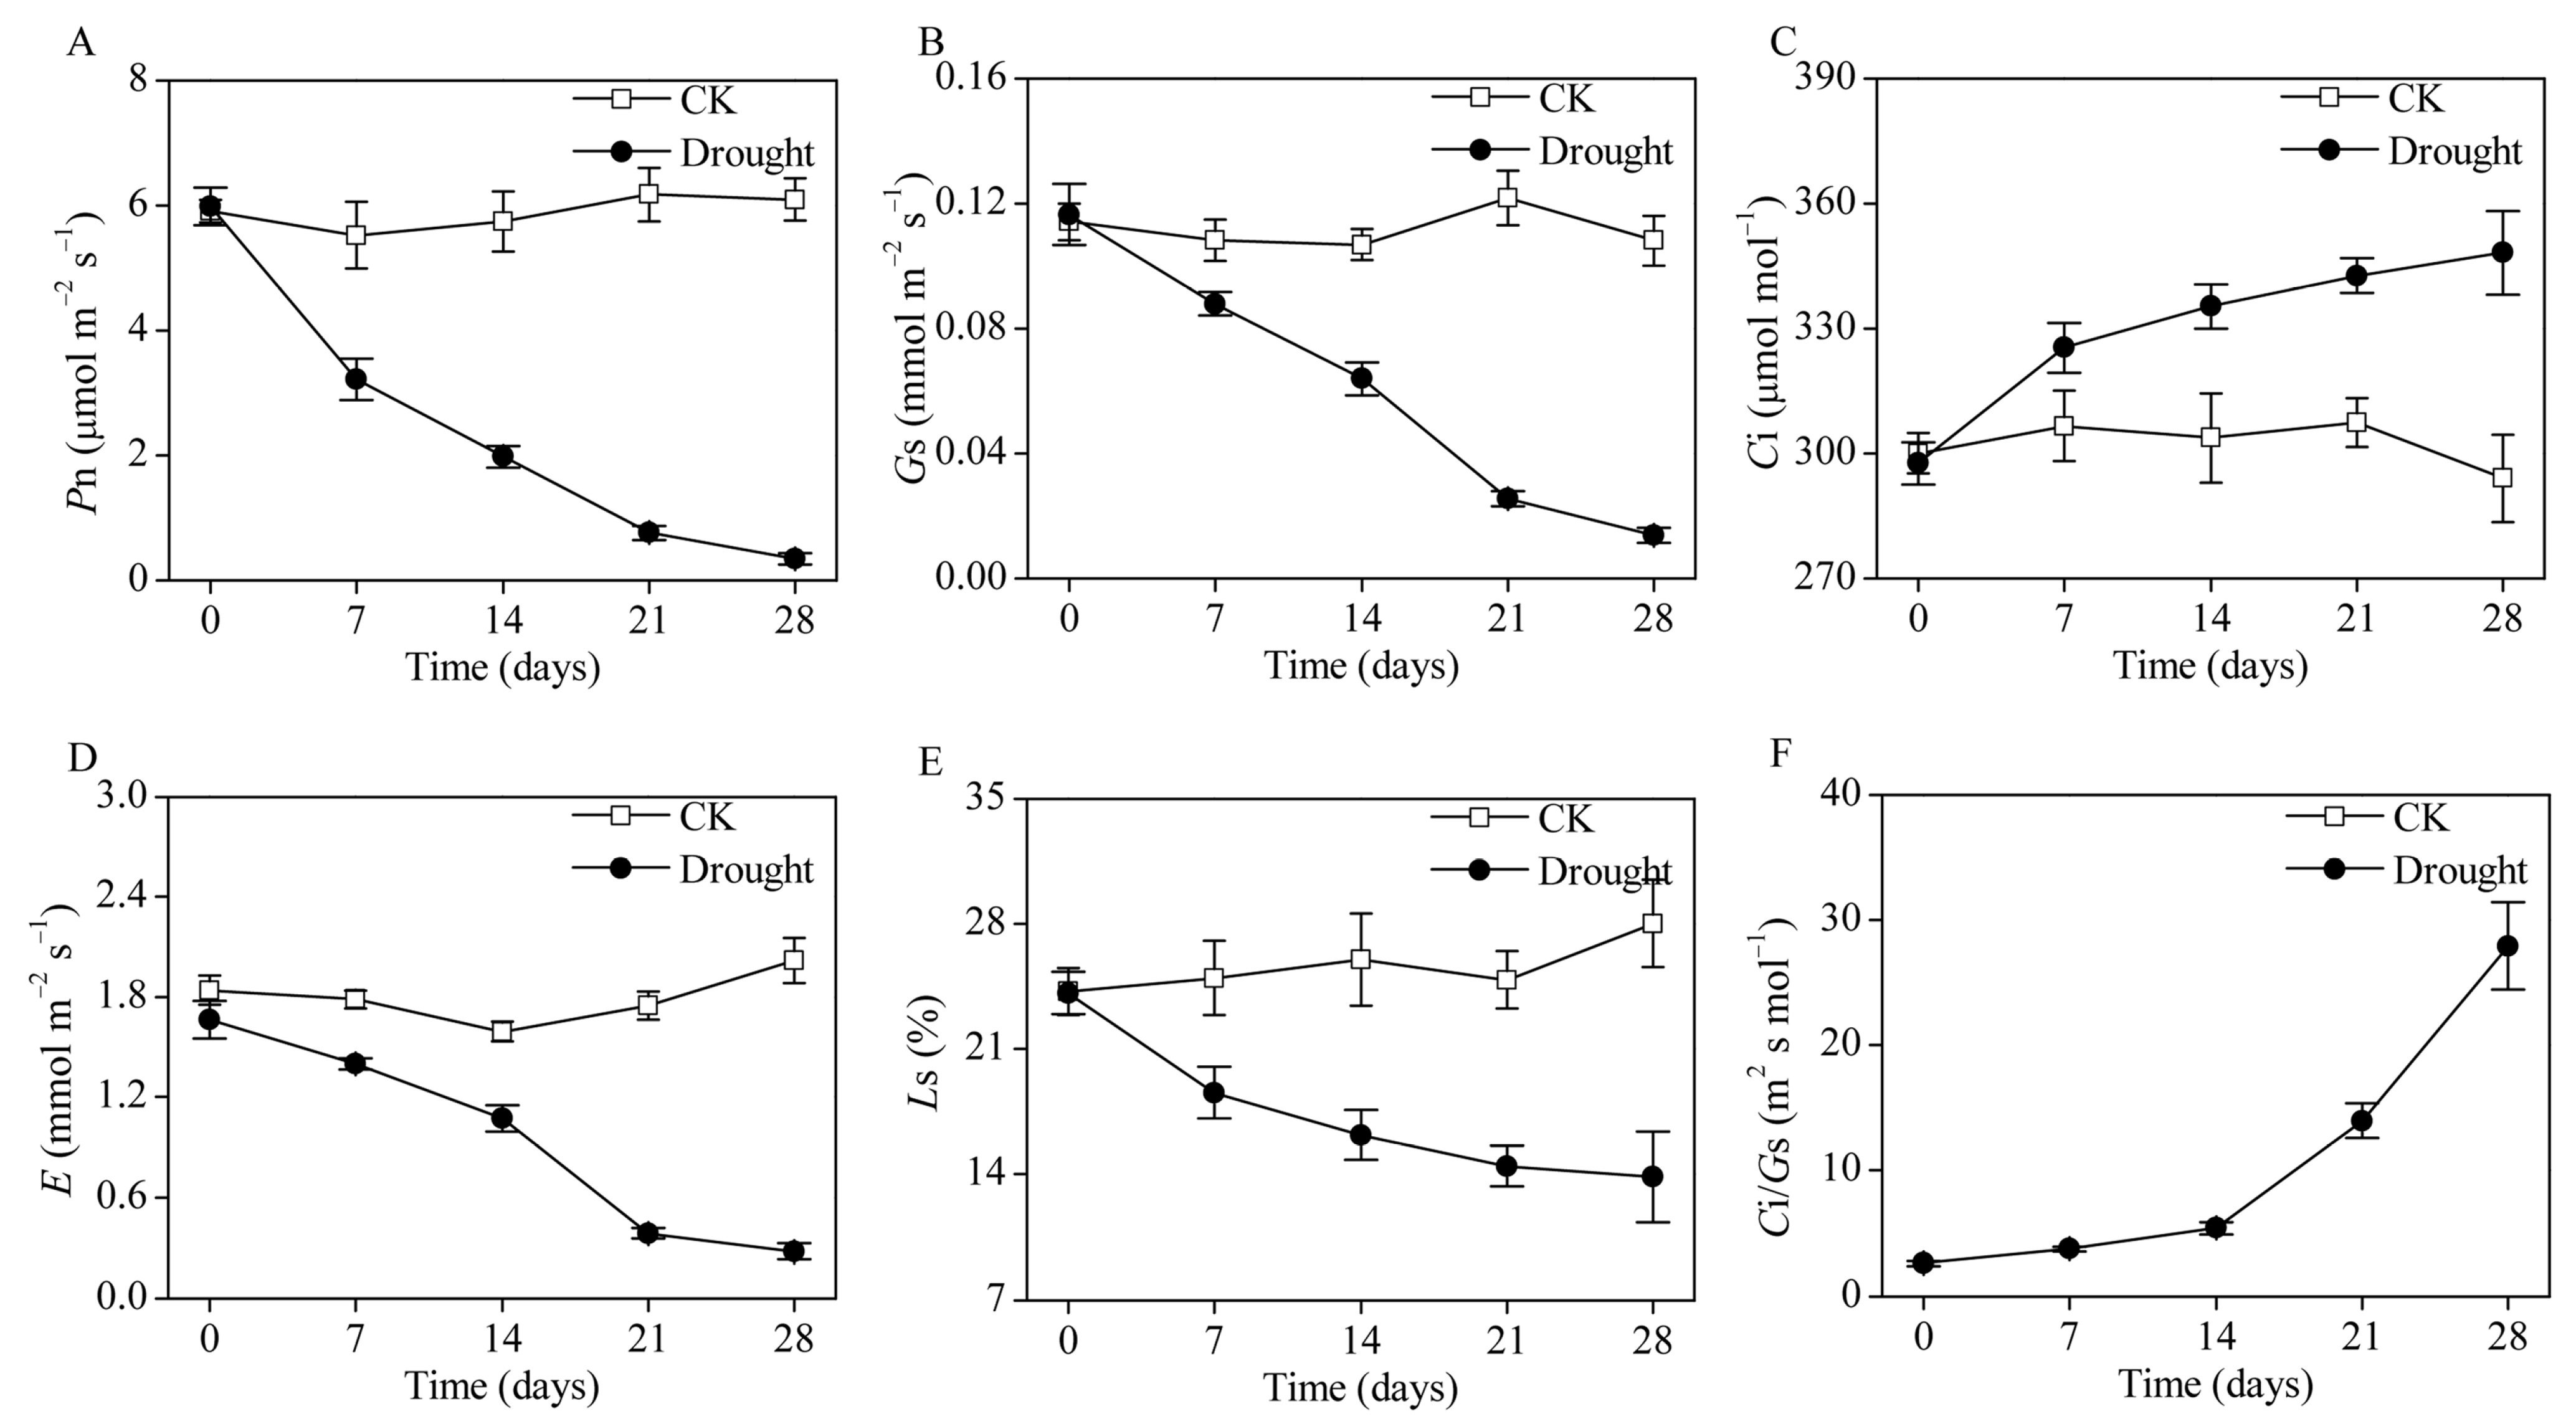
3.1. The Photosynthesis of B. striata under Drought Stress

After four weeks of exposure to the simulated drought condition, most of the B. striata leaves turned yellow and dry, and the roots were short and slim (Figure 1). As illustrated in Figure 2, for the drought-treated plants, a gradual decrease in net photosynthetic rate (Pn), stomatal conductance (Gs), and transpiration rate (E) was recorded throughout the four weeks, except for a sharp decline from days 14 to 21. In addition, the intercellular CO2 concentration (Ci) gradually increased in the drought treatment but did not significantly change in the CK. Further analysis showed that the value of stomatal limitation, Ls, gradually decreased, while the nonstomatal limitation, Ci/Gs, sharply increased from days 14 to 21, which suggested that the plant had incurred serious cellular damage after 21 days of drought condition.

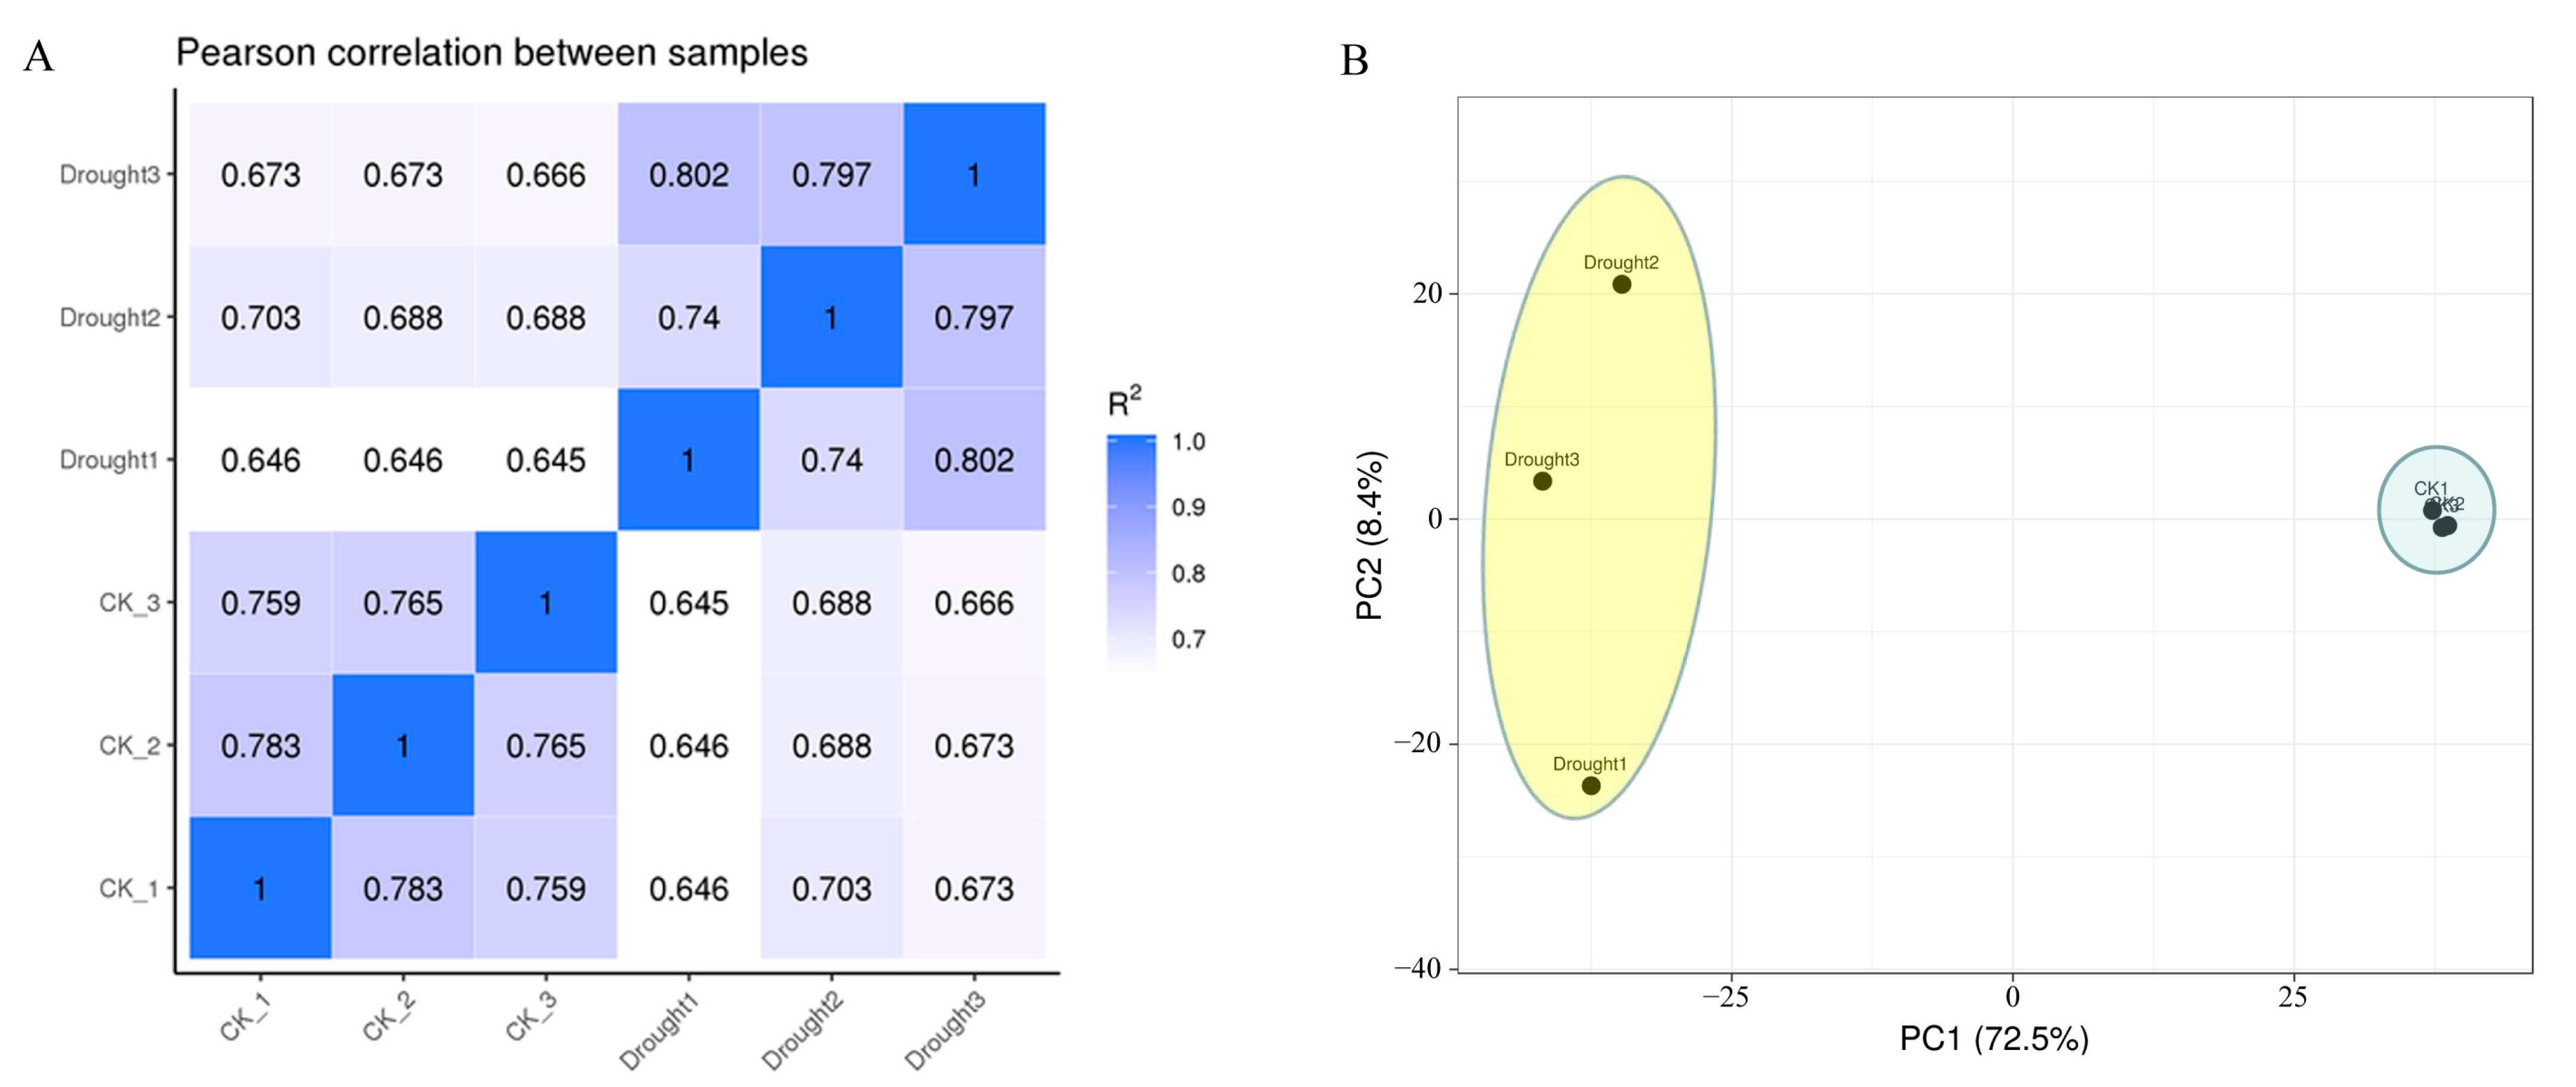
3.2. De Novo Assembly, Quality Assessment, and Annotation of Transcriptome

To further investigate the mechanisms that regulate the drought response of B. striata, Illumina RNA-Seq sequencing was performed in the present study. Totals of 51,068,510, 47,394,690, 49,121,326, 45,204,114, 56,709,020, and 55,046,454 paired-end reads (150 bp) were obtained in CK1, CK2, CK3, drought1, drought2, and drought3, respectively (Table 1). After removal of the adapter and the low-quality reads, 49,902,994, 46,355,072, 48,119,710, 44,225,174, 55,207,808, and 53,905,350 clean reads were retained in CK1, CK2, CK3, drought1, drought2, and drought3, respectively (Table 1). The value of Q30 in each sample was more than 90%, implying that the clean data were of high quality and could be used for further analysis (Table 1). To assess the reproducibility of the CK and the drought treatments, the Pearson analysis was performed in this study. The results showed that values of R2 among CK1, CK2, and CK3 ranged from 0.75 to 0.79, while the values among drought1, drought2, and drought3 ranged from 0.74 to 0.80 (Figure 3). These results suggest good reproducibility in the group. Trinity software was used to assemble the clean reads de novo, and 122,160 unigenes with a 1451 bp mean length were obtained. The median length and N50 were 1044 and 2240 bp, respectively. Afterward, the unigenes were aligned to various databases. From a total of 122,160 unigenes, 81,958 (67.09%) unigenes were aligned to the Nr database, 45,174 (36.97%) unigenes were aligned to the NT database, 29,847 (24.43%) unigenes were aligned to the KO database, 57,293 (46.89%) unigenes were aligned to the SwissProt database, 56,063 (45.89%) unigenes were aligned to the PFAM database, 56,063 (45.89%) unigenes were aligned to the PFAM database, and 21,869 (17.90%) unigenes were aligned to the KOG database. In total, 86,618 (70.90%) out of the 122,160 unigenes could be aligned to at least one database (Table 2).

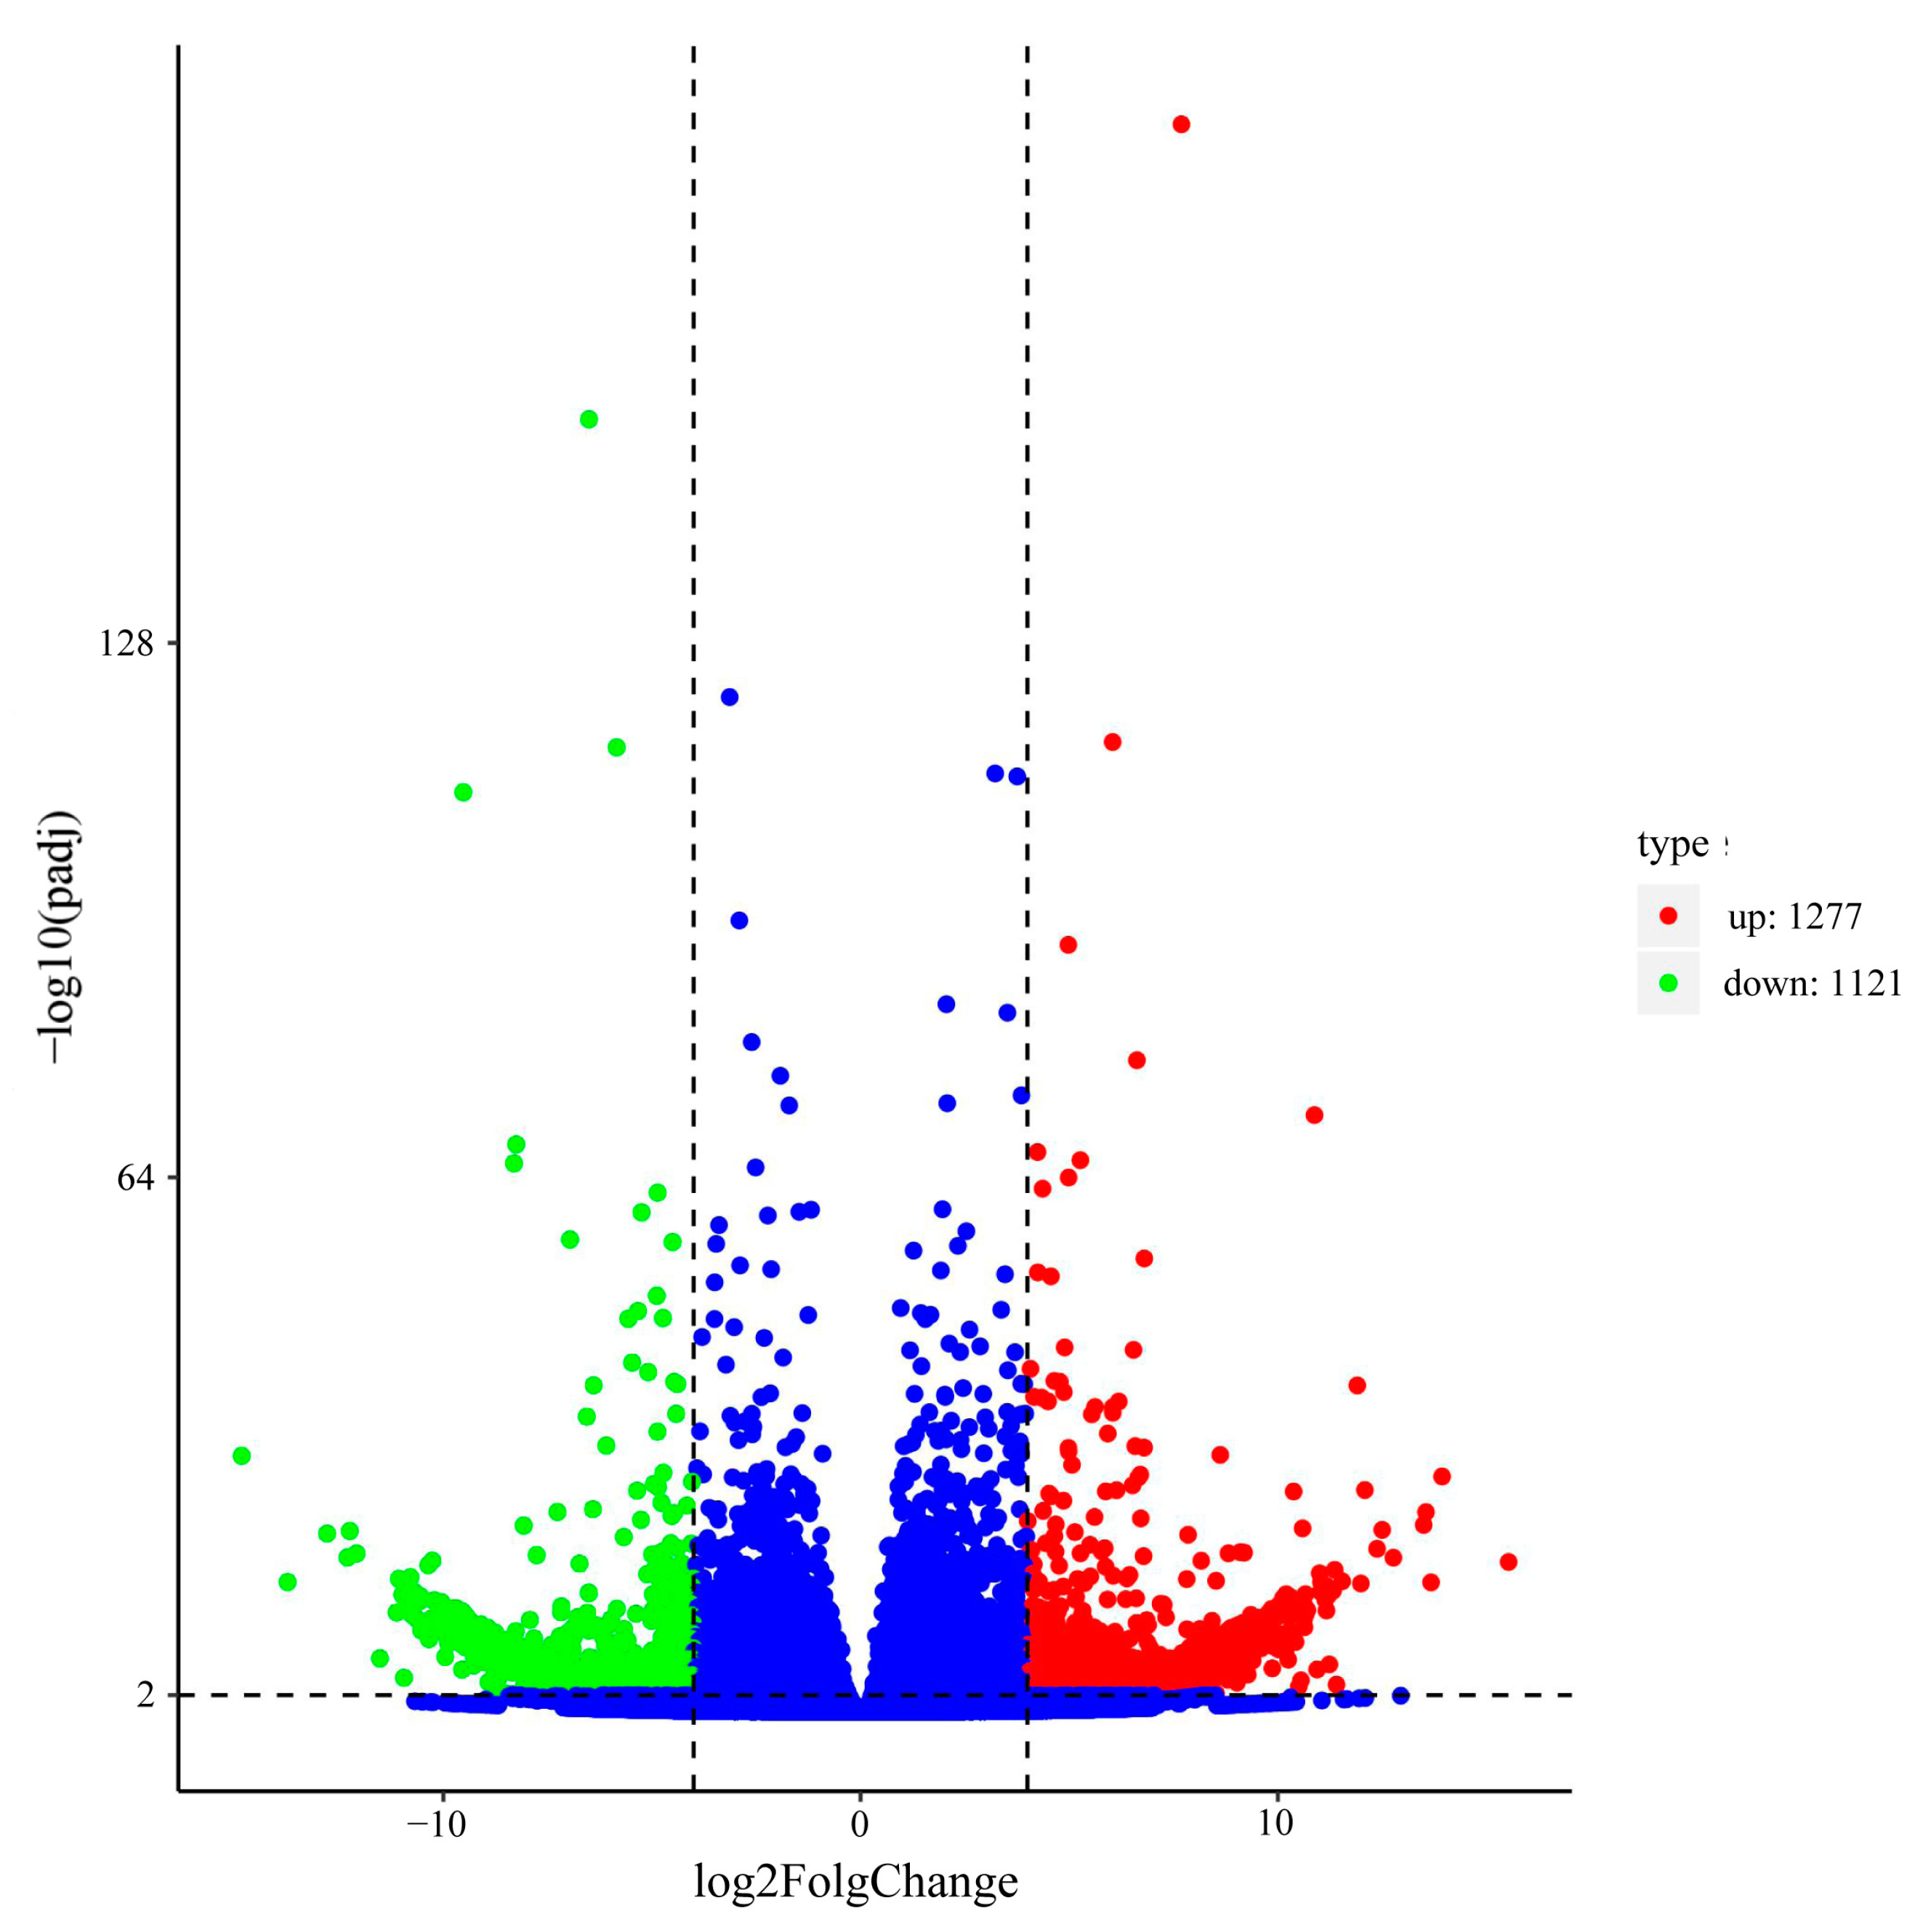
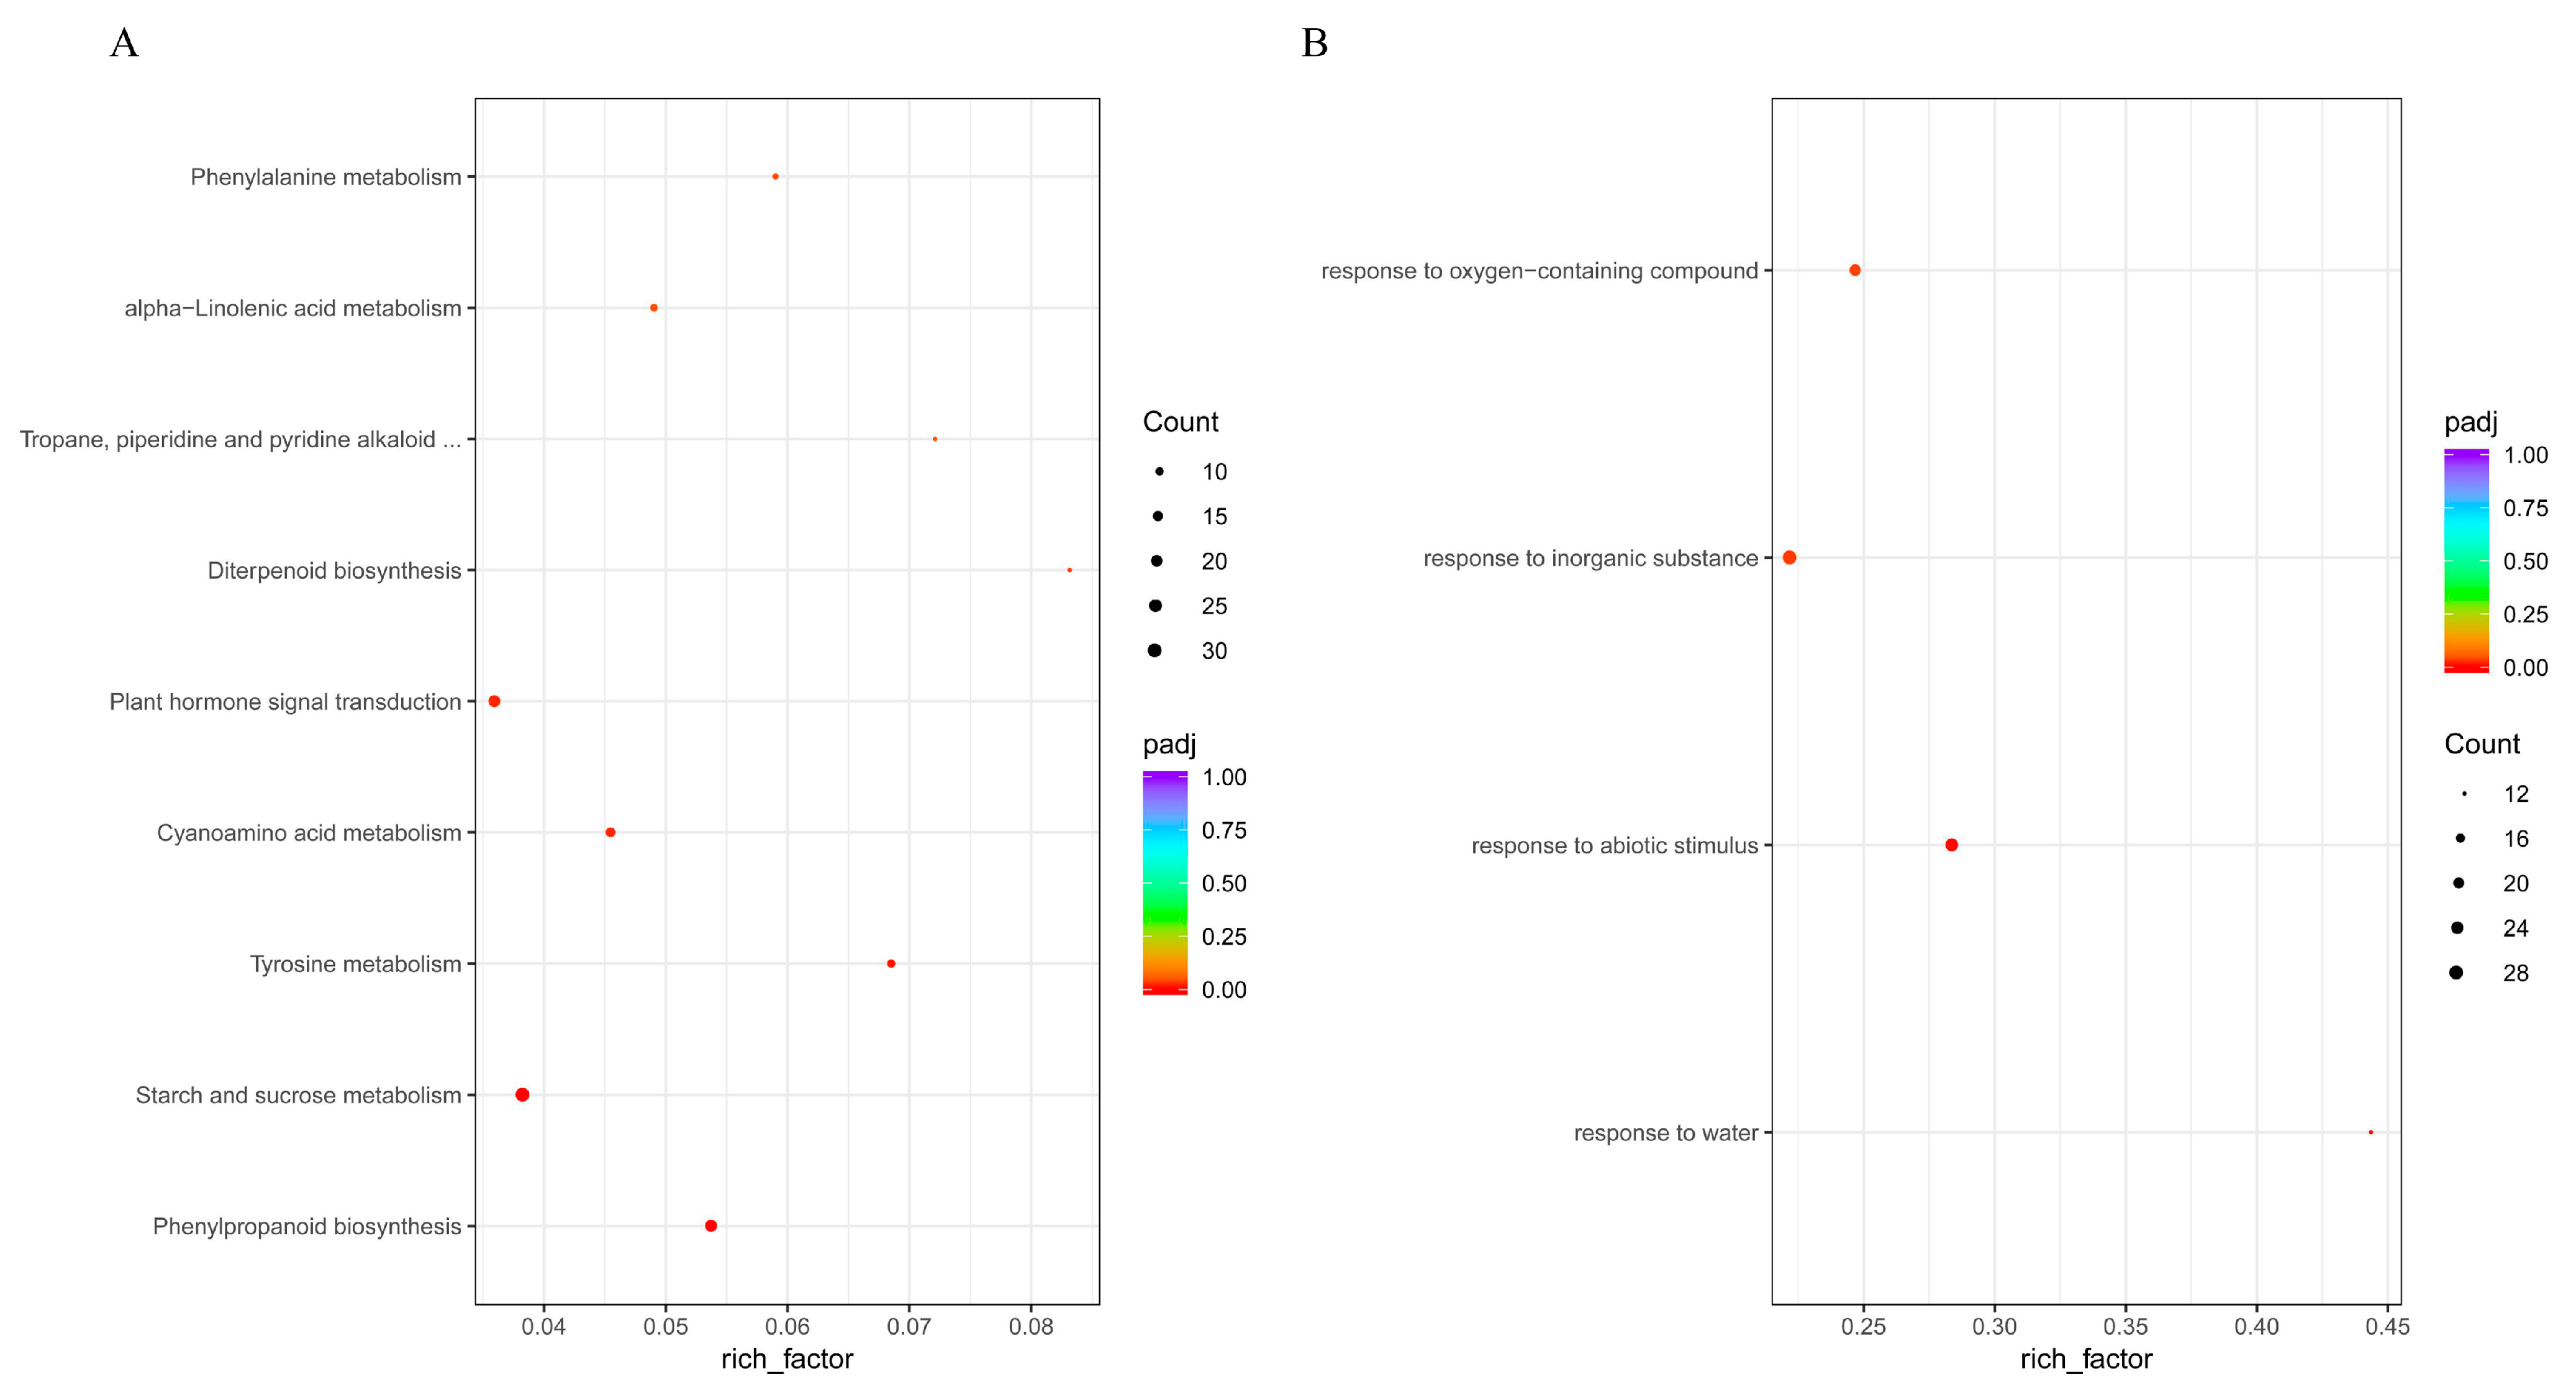
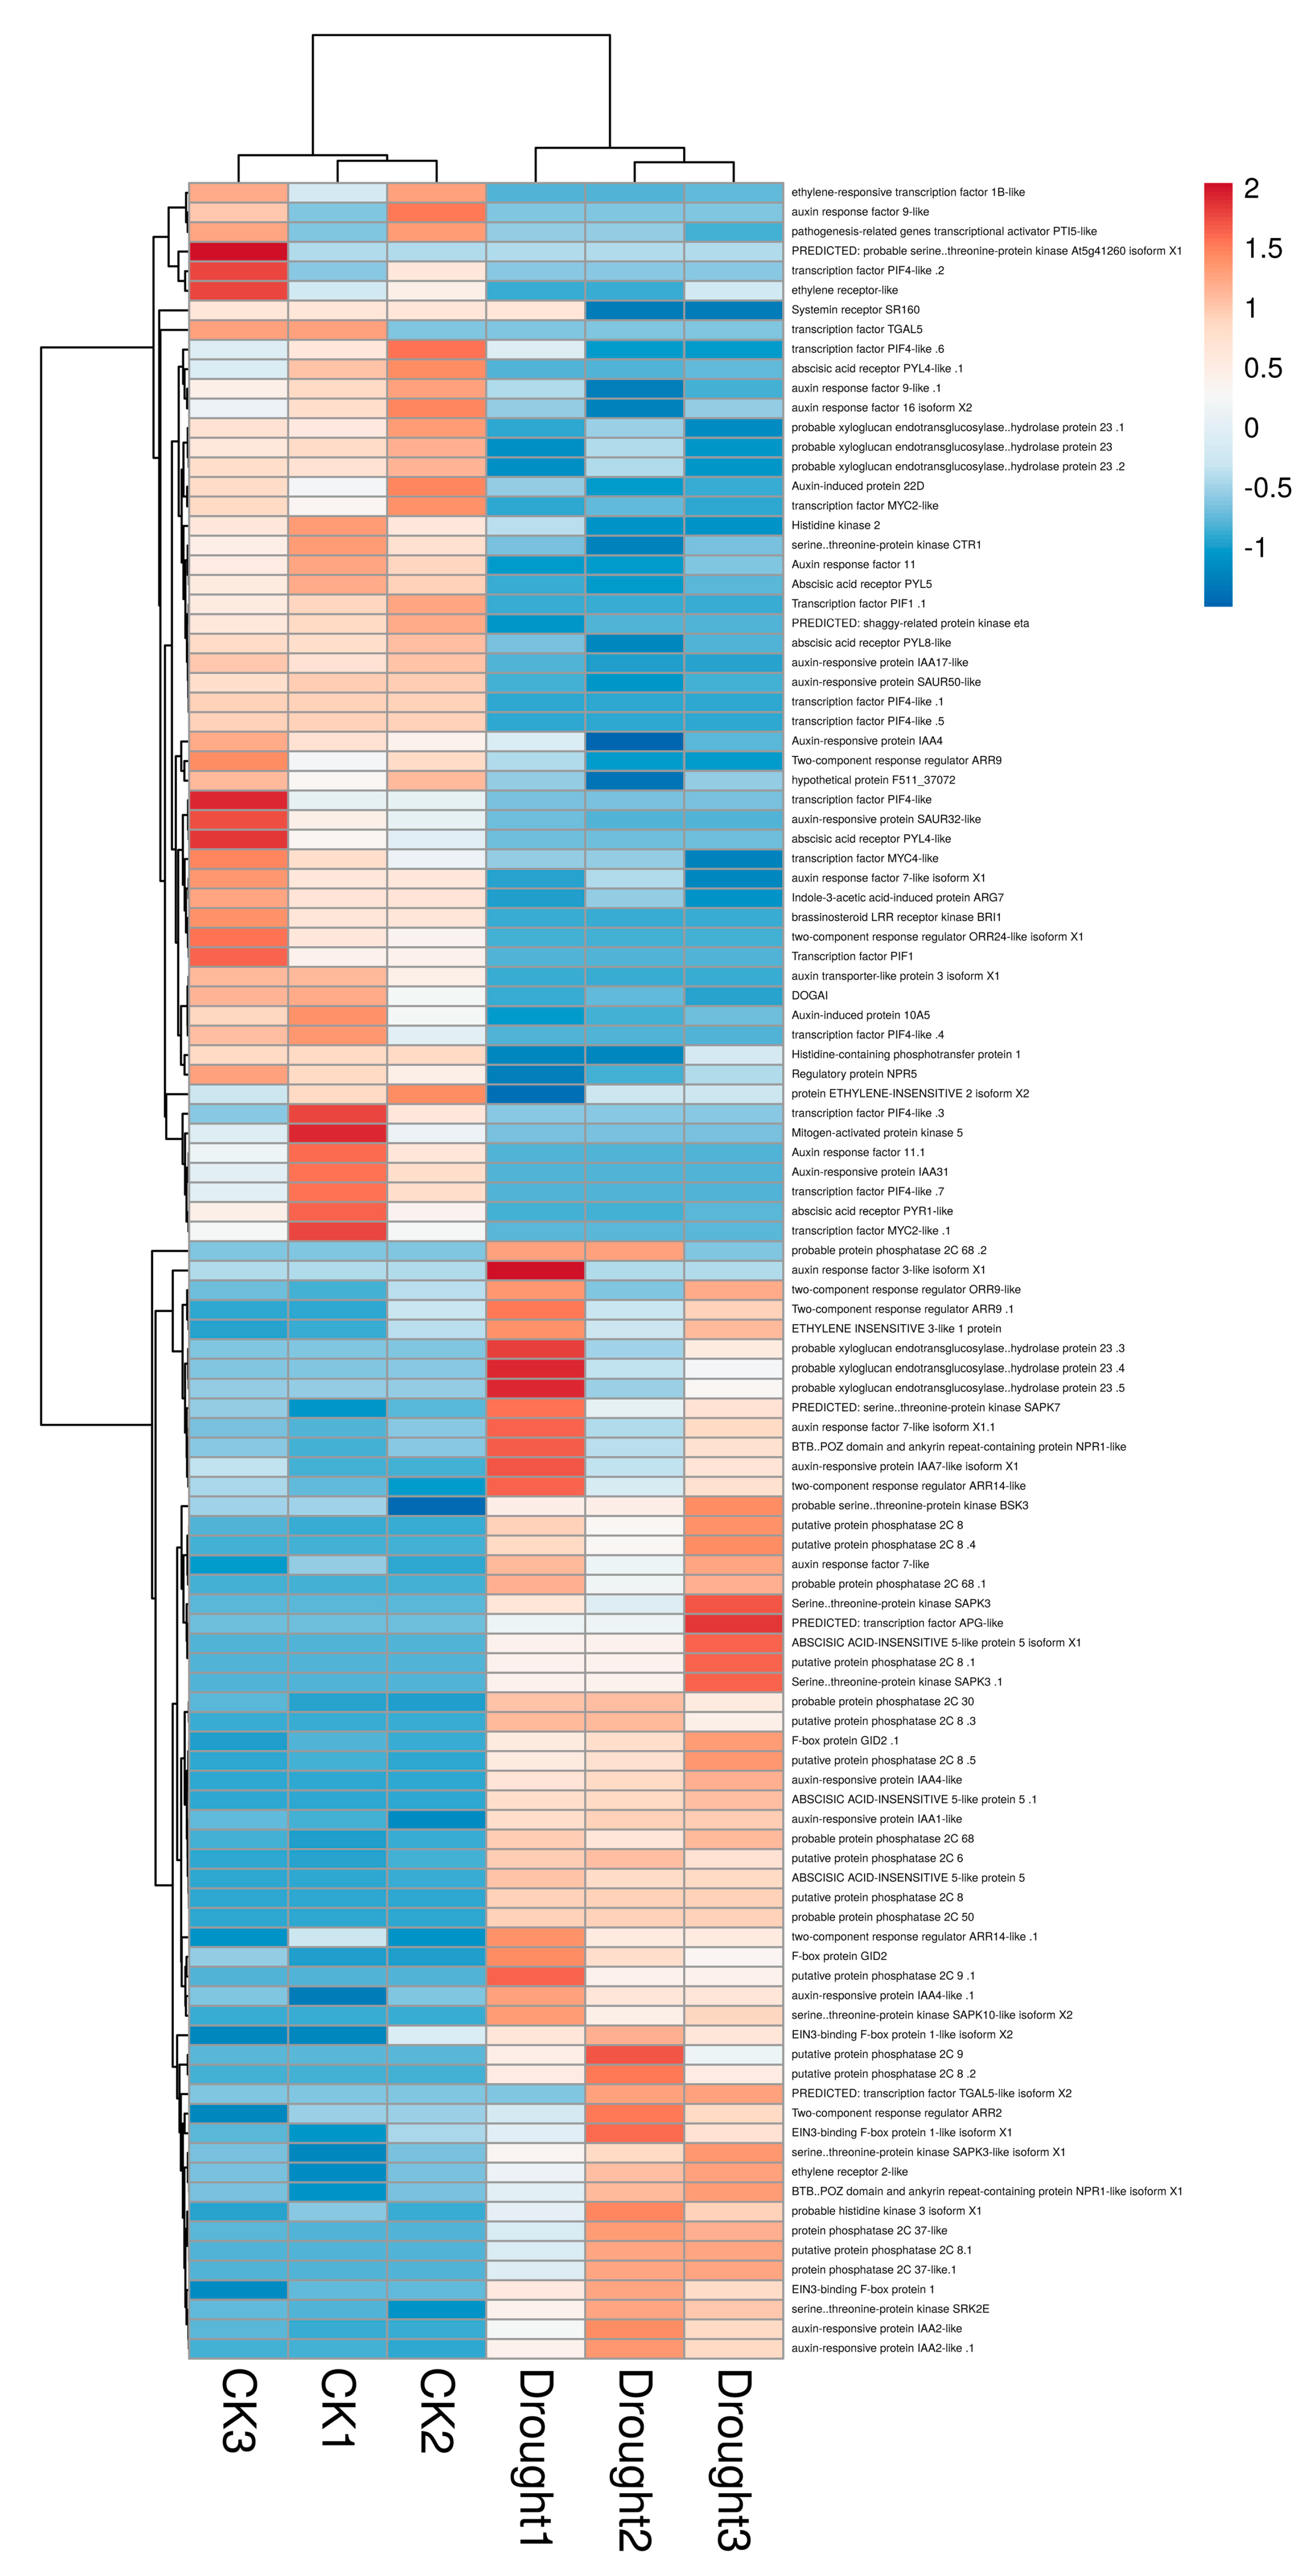
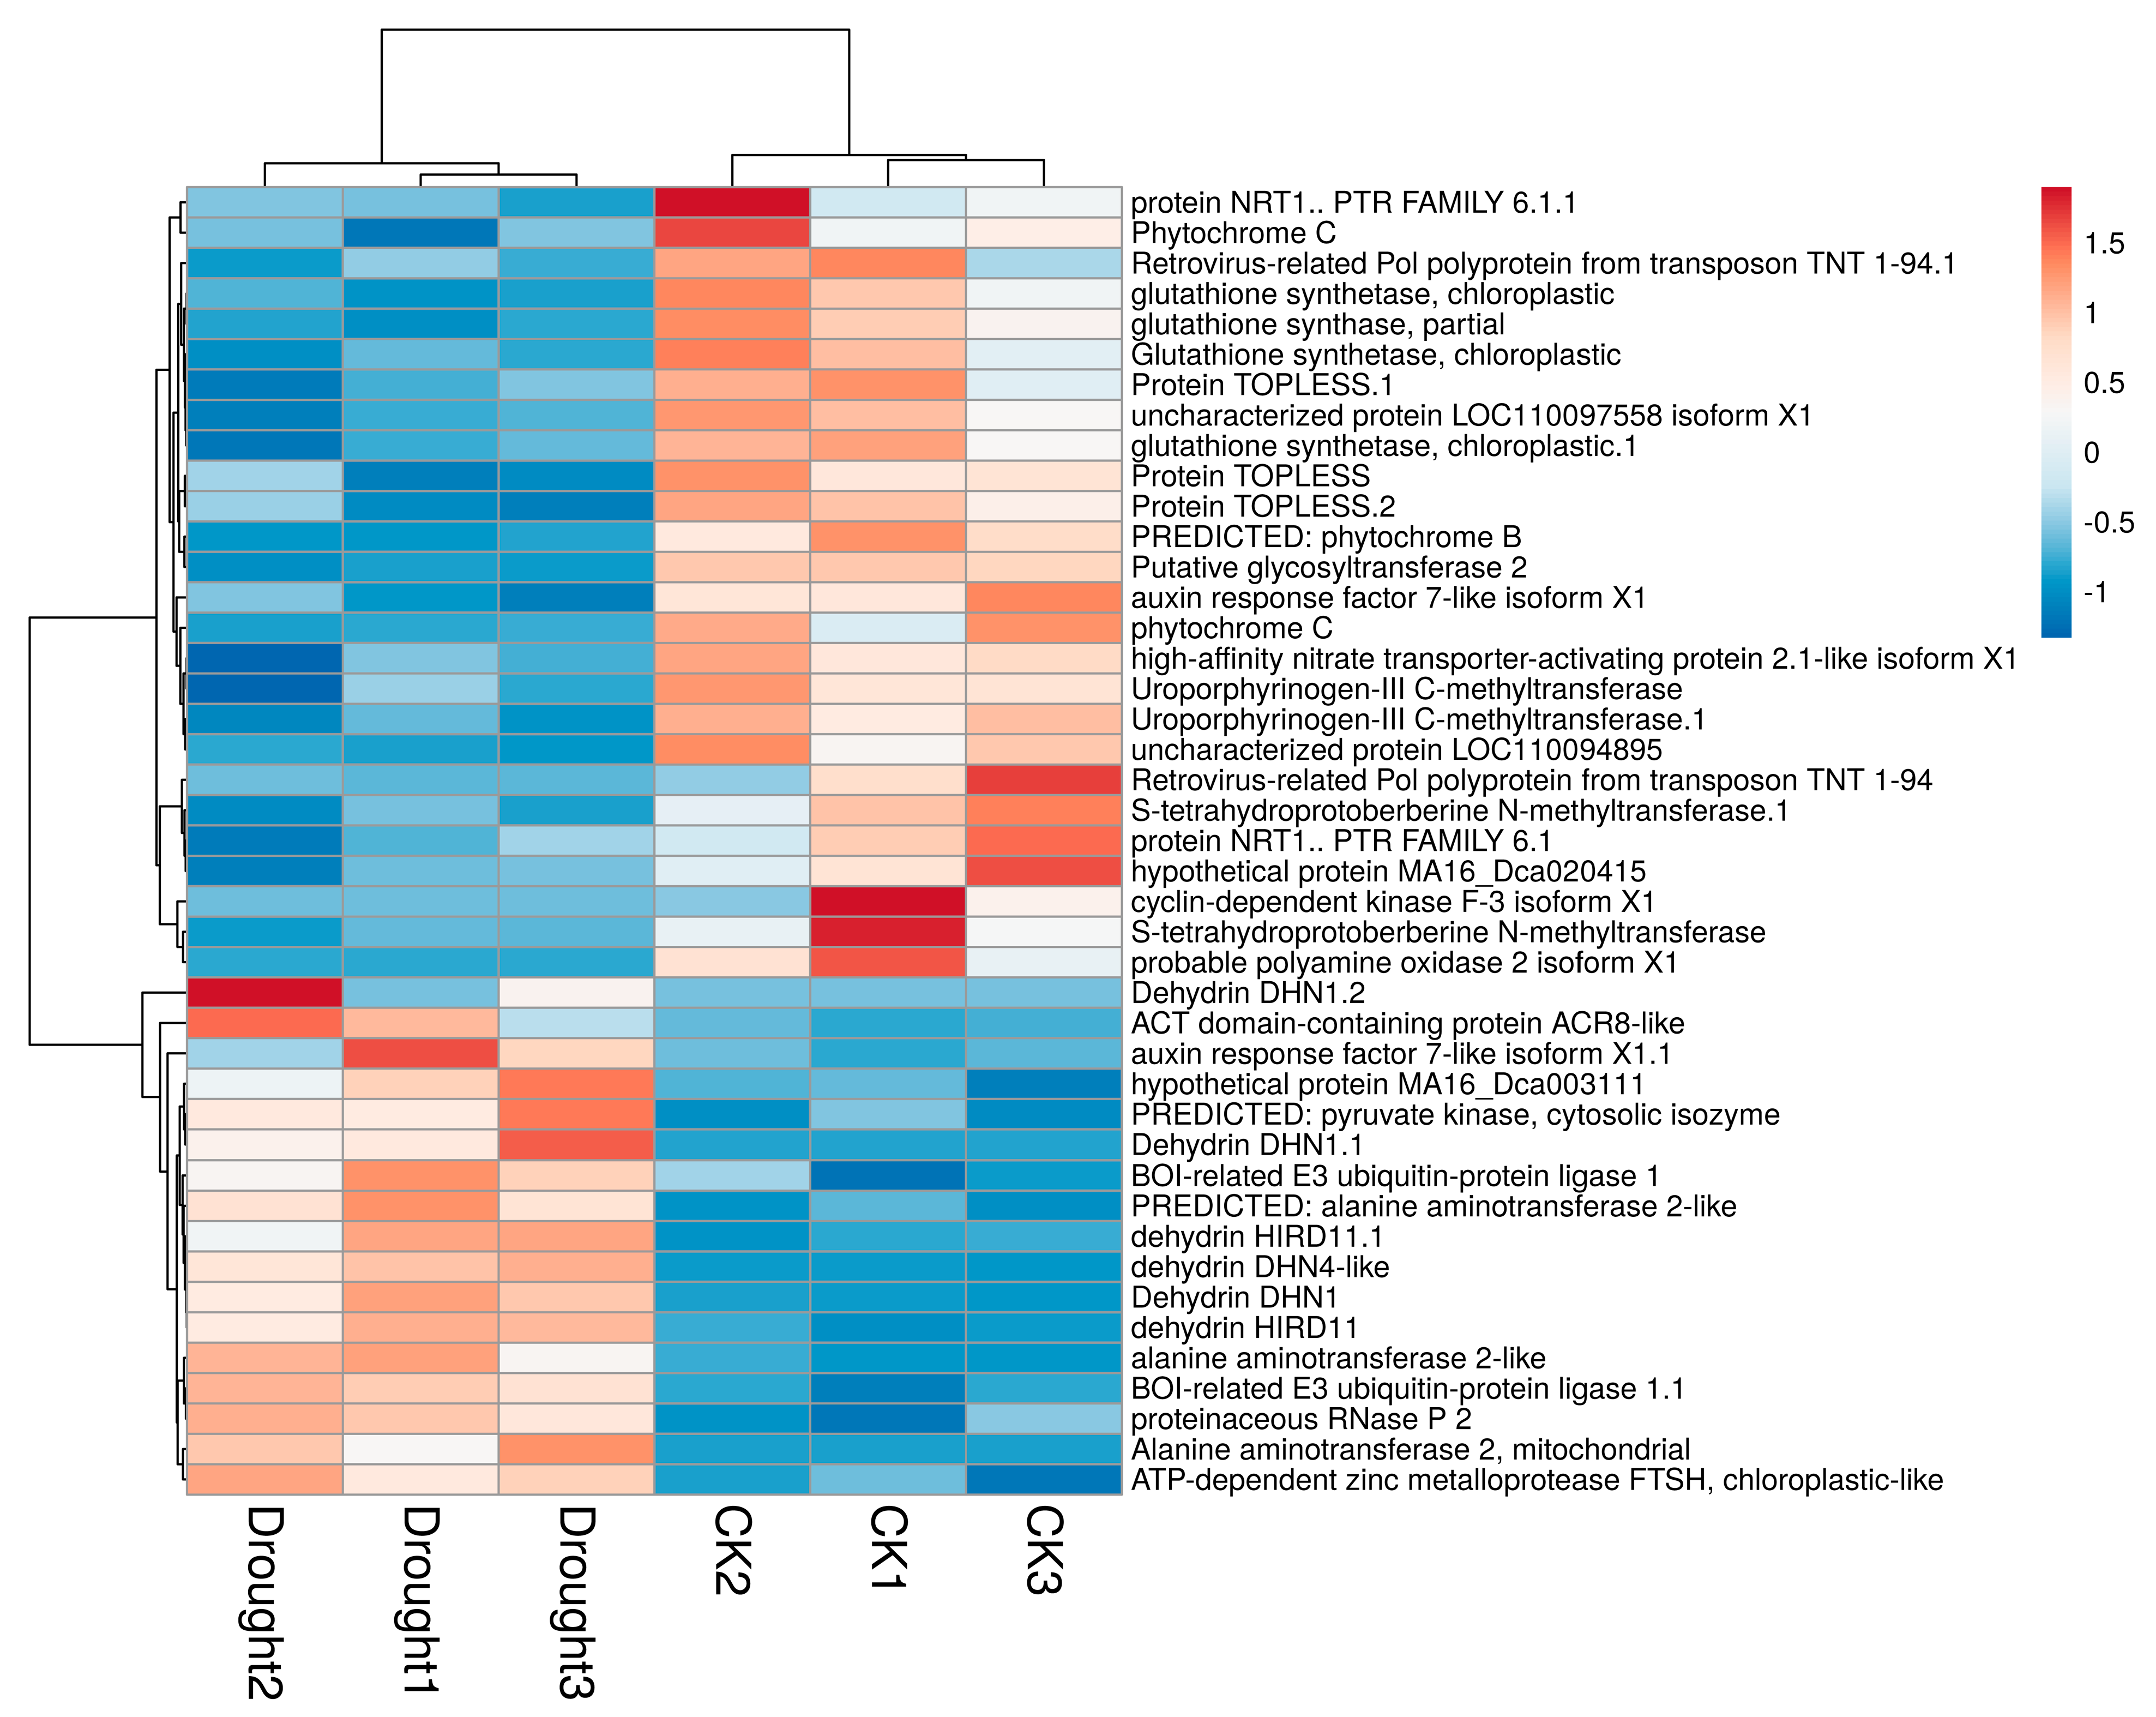
3.3. KEGG and GO Enrichment Analysis of Differentially Expressed Genes (DEGs)

To identify the differentially expressed genes (DEGs) in B. striata leaves under drought stress, the expression level of each DEG was calculated. A total of 2398 DEGs were identified, 1271 DEGs were upregulated, and 1127 DEGs were downregulated (Figure 4).
To further explore the underlying mechanism of the B. striata response to drought stress, KEGG and GO (Biological process) enrichment analyses were performed. Figure 5A shows that nine KEGG pathways (p < 0.05) were significantly enriched in B. striata exposed to drought conditions: plant hormone signal transduction (ko04075); phenylpropanoid biosynthesis (ko00940); tropane, piperidine, and pyridine alkaloid biosynthesis (ko00960); phenylalanine metabolism (ko00360); tyrosine metabolism (ko00350); starch and sucrose metabolism (ko00500); cyanoamino acid metabolism (ko00460); diterpenoid biosynthesis (ko00904); and alpha-linolenic acid metabolism (ko00592). Figure 6 presents the expression profiles of the DEGs involved in plant hormone signal transduction. Almost half of the DEGs identified in these pathways were upregulated, and the other half were downregulated, which highlighted the complicated roles of plant hormones in orchestrating the response to drought stress. Most DEGs involved in abscisic-acid signal transduction were also upregulated, such as protein phosphatase 2C (PP2C), abscisic acid-insensitive 5-like protein 5 (ABF), and serine/threonine protein kinase SAPKs (SnRK2).
Four GO terms (p < 0.05) related to stress are laid out in Figure 5B: response to water (GO:0009415), response to an abiotic stimulus (GO:0009628), response to an inorganic substance (GO:0010035), and response to an oxygen-containing compound (GO:1901700). From there, the expression patterns of DEGs related to these GO terms are presented in Figure 7. Interestingly, we found several DEGs, which encoded dehydrin proteins, were profoundly induced under drought stress (Figure 7).
In addition, detailed information of the DEGs, related to photosynthesis, ABA signal transduction and antioxidant metabolism, are presented in Table 3. Fourteen DEGs were involved in photosynthesis. Four DEGs (Cluster-6724.91253, Cluster-6724.49822, Cluster-6724.49802, and Cluster-6724.50075) were downregulated, and the other ten DEGs were upregulated. Five out of thirty-four DEGs (PYLs and PYR, which are ABA acceptors) were downregulated in ABA signal transduction, and twenty-nine DEGs (PP2C, ABF, and SLAH2) were upregulated. All DEGs in antioxidant metabolism (SOD, CAT, POD, and GST) were upregulated except for Cluster-6724.52388 and Cluster-6724.52387 (APX).

4. Discussion

4.1. ABA Signal Transduction in B. striata Leaves under Drought Stress

Phytohormones regulate various biological processes to control plant growth and stress responses [28]. To survive under drought stress, plants have evolved extensive phytohormone signaling pathways in response to drought stress, such as those of auxin (IAA), cytokinin (CK), abscisic acid (ABA), jasmonic acid (JA), salicylic acid (SA), ethylene (ET), and gibberellin (GA) [29,30]. The present study identified a series of DEGs that participate in plant hormone signal transduction (ko04075) (Figure 5A and Figure 6; detailed information for ko04075 is shown in Supplementary Table S2). Among these phytohormones, ABA was regarded as the major stress-responsive hormone under drought stress [30]. Under normal conditions, PP2C would inhibit the activity of SnRK2 protein via dephosphorylating [30]. When a plant is exposed to drought conditions, its cellular ABA concentration increases, which binds PYL/PYR/RCARs proteins. This ABA-PYL/PYR/RCARs complex would then inhibit the activity of PP2C, which would lead to the activation of SnRK2 [31,32]. The activated SnRK2 would phosphorylate downstream genes and trigger the ABA-induced response [30]. A recent study reported that PYL-PP2C-SnRK2s, which function as the ABA core signal pathway, also exist in B. striata [21]. Our results also showed that many DEGs engaged in ABA signal transduction (PP2C, ABF, SnRK2), and most of them were upregulated except for PYL/PYR/RCARs (Figure 6). The SnRK2 gene is suspected to be positively related to stomatal closure, since a srk2e mutation in Arabidopsis resulted in a wilty mutant caused by a loss of stomatal closure under drought stress [33]. Upregulated SnRK2 could activate several cation or anion channels, such as S-type anion channels (SLAHs), to force the stomata to close [34]. Based on these results, the upregulations of SnRK2 and SLAH2 (Table 3) in B. striata under drought stress suggest that drought stress might result in promoting stomatal closure to prevent water loss from leaves via controlling ion efflux in guard cells. Mori et al. (2006) also found that ABA was initially synthesized in the roots and subsequently migrated to the leaves, where it would shut the stomata and reduce plant photosynthesis [35]. Consistently with previous studies, our results found that most of the DEGs (PP2C, SnRK2, and SLAH2) that participated in core ABA signaling pathway PYL-PP2C-SnRK2 were upregulated (Table 3), and the values of the net photosynthetic rate (Pn) and stomatal conductance (Gs) were decreased under drought stress (Figure 2). The same results were also reported by Liu et al. [21]; stomatal closure was gradually decreased in B. striata leaves with lower soil water content. The decline of Pn could have been caused by stomatal limitation (Ls) and nonstomatal limitation (Ci/Gs) [36]. Our results found a decrease in Ls but an increase in Ci/Gs in B. striata leaves under drought stress (Figure 2). According to the results presented above, we concluded that the decline of photosynthesis in B. striata leaves under drought stress is mainly caused by nonstomatal limitation factors, which are mediated with the ABA signaling pathway.
Moreover, SnRK2 could activate downstream genes such as ABF [37]. Overexpression of ABF in Arabidopsis resulted in ABA hypersensitivity and high drought tolerance [38]. Meanwhile, upregulated SnRK2 could activate several cation or anion channels, such as S-type anion channel 3 (SLAH3), to force stomata to close [34]. In the present study, the upregulation of ABFs indicated that the high expression level of ABFs in B. striata leaves could enhance the plant’s drought tolerance under drought stress.

4.2. Effect of Drought Stress on DEGs Involved in Photosynthesis

As we mentioned above, nonstomatal limitation factors were the main reason for photosynthesis reduction. In other words, there was metabolic damage in the photosynthetic process, such as downregulation of gene expression of some photosynthesis-related proteins. Our transcriptional analyses found that four DEGs that participated in photosynthesis were downregulated. Cytochrome b6 was reported to function in regulating electron transfer between photosystem II and photosystem I [39]. The stability of petB transcripts could control cytochrome b6 levels. The transcriptional level of Cytochrome b6 (petB, Cluster-6724.91253) was decreased in our study, suggesting that the level of cytochrome b6 is reduced under drought stress and leads to an inhibition of electron transfer between photosystem II and photosystem I, which would result in low photosynthesis in B. striata. Photosystem I reaction center subunit III (psaF, Cluster-6724.49822) is a plastocyanin-docking protein participating in regulating efficiency of electron transfer from plastocyanin to P700 [40]. The lack of psaF results in an inability of energy transfer from light-harvesting complex I-730 to the P700 reaction center [40]. Photosystem I reaction center subunit IV (psaE, Cluster-6724.49802) participates in docking of ferredoxin to PSI and interaction with ferredoxin-NADP oxidoreductase [41]. Absence of psaE leads to low O2 production and serious damage in PSII under photoinhibition conditions [41]. In other words, low transcriptional levels of psaE are adverse for plant photosynthesis. The downregulations of psaE and psaF in the present study imply that drought stress inhibits energy transfer and PSI assembling via regulating the expressions of psaE and psaF and subsequently affecting the photosynthesis of B. striata. As Krieger-Liszkav (2020) pointed out, high O2 production protects PSII against photoinhibition [41]. Our transcriptomic data also found several DEGs related to O2 production in B. striata leaves under drought stress. For example, psbP-domain-containing proteins (Cluster-6724.68113, Cluster-6724.86842, and Cluster-6724.74411) and psbQ proteins (Cluster-6724.44868 and Cluster-6724.11910) were reported to play a functional role in optimization of photosynthetic oxygen evolution [42,43]. Interestingly, all of these DEGs were upregulated, which will lead to higher efficiency of O2 production, suggesting that B. striata might enhance O2 production to protect its photosystem under drought stress. In addition, ATP-dependent zinc metalloprotease FTSH 11 (Cluster-6724.55459, Cluster-6724.47025) was found to be upregulated in B. striata leaves under drought stress (Table 3). In Arabidopsis, FtsH6 was found to participate in degradation of light-harvesting complex II during high-light acclimation [44]. Upregulation of FtsH11, a homologous protein, might have the same function in regulating degradation of light-harvesting complex II, which would lead to low efficiency of light-energy absorption. These changes in gene expression may be a self-protection mechanism for plants under drought stress.

4.3. Drought-Induced Gene Expression of Stress-Response Protein

When a plant is exposed to drought stress, many stress-responsive genes are induced to protect it from drought-induced damage [10]. Plants generally overaccumulate ROS in their tissues after any stressful insult, both biotic and abiotic. An antioxidant battery is the first line of defense against oxidative damage in plant cells [10]. The antioxidants commonly utilized by plants include catalase (CAT), superoxide dismutase (SOD), peroxidase (POX), ascorbate peroxidase (APX), glutathione sulfo-transferase (GST), and others [9]. As displayed in Table 3, almost all DEGs related to antioxidant metabolism were significantly upregulated except for APX. Overproduction of O2− is the first step undertaken by a plant under drought stress. SOD catalyzes O2− into the significantly less toxic H2O2 [12]. As more and more H2O2 is produced in a cell, it becomes reduced into H2O with the enzymatic antioxidant CAT through electron transport, photorespiratory oxidation, and oxidation of fatty acids [7]. Alternatively, H2O2 can also be converted into H2O with APX via the AsA-GSH cycle [7]. Under drought conditions, however, the expression level of APX was decreased, whereas the expression levels of SOD and CAT were increased, implying that ROS produced in drought-stressed B. striata leaves is mainly scavenged by SOD and CAT and not via the APX-mediated AsA-GSH cycle. In addition, POX was reported to minimize drought-induced cellular damage due to its ability to lignify and crosslink structural proteins in cell walls [11]. These results indicate that B. striata leaves reduce drought-induced oxidative damage via activating expressions of SOD, CAT, and POX to scavenge ROS.
Moreover, GO enrichment analysis identified six dehydrin (DHN) genes, which were highly expressed under drought stress (Figure 5 and Figure 7). DHNs were initially recognized as “dehydration-induced proteins” in response to desiccation [45]. An increasing body of evidence suggests that DHN proteins impart drought stress tolerance through activating various biological processes, such as photosynthesis, ROS scavenging, accumulation of compatible solutes, and others [46]. Overexpression of DHNs could significantly enhance drought tolerance in plants. For example, overexpressions of two dehydrins, Y2SK2 and SK3, in Arabidopsis thaliana resulted in higher tolerance of salt, osmotic cold, and drought stress, with higher antioxidant activity and photosynthesis [47]. In addition, DHN1 was reported to maintain high chlorophyll content and water fresh/dry weight but low H2O2 concentration, resulting from enhanced ROS scavenging [48]. Similar to these findings, we found that DHNs were significantly engaged in B. striata leaves under drought stress, implying that a high expression level of DHNs could enhance drought tolerance through enhancing ROS scavenging, which was consistent with our results of high expression levels of SOD, CAT, and POX.

5. Conclusions

B. striata is a valuable Chinese herbal medicinal plant. During the planting process, drought is one of the most serious threats to its growth and development. In the present study, the response of B. striata under drought stress was investigated at the physiological and transcriptional levels. Photosynthetic results indicated that the decline of photosynthesis in B. striata leaves was mainly caused by nonstomatal limitation factors. Transcriptomic analysis showed that DEGs involved in photosynthesis processes, such as electron transfer (cytochrome b6) and light-energy harvesting and transfer (photosystem I reaction center subunit III and photosystem I reaction center subunit IV), might lead to reduction in B. striata photosynthesis, while DEGs related to O2 production (psbP, psbQ) and light-energy absorption (ATP-dependent zinc metalloprotease FTSH 11) are activated to protect the plant from drought stress. Moreover, the DEGs involved in the ABA signaling pathway were the most upregulated. Upregulations of PP2C, SnRK2, and SLAH2 might lead to stomatal closure, which is one of the reasons for photosynthesis reduction. In response to drought stress, the B. striata leaves recruited SOD, CAT, and POX, which enhanced the ability of ROS scavenging. High expressions of ABF and DHNs might result in high drought tolerance in B. striata. According to these results, a better understanding of B. striata in response to drought stress was presented in our study.

Supplementary Materials

The following supporting information can be downloaded at: https://www.mdpi.com/article/10.3390/horticulturae9030307/s1, Table S1: The detailed information of KEGG and GO enrichment analyses, Table S2: The information of DEGs involved in plant hormone signal transduction.

Author Contributions

Conceptualization, Z.S. and M.W.; methodology, H.L. and L.Y.; software, Z.S. and H.L.; validation, X.H., K.C. and Z.S.; formal analysis, M.W.; investigation, H.L. and K.C.; resources, M.W. and H.L.; data curation, M.W. and Z.S.; writing—original draft preparation, H.L. and K.C.; writing—review and editing, K.C., X.H., Z.S. and M.W.; visualization, H.L. and X.H.; supervision, Z.S. and M.W.; project administration, H.L. and M.W.; funding acquisition, M.W. All authors have read and agreed to the published version of the manuscript.

Funding

This research was funded by the National Key Research and Development Program of China (Grant No. 2021YFD1601002), the Guizhou Provincial Department of Science and Technology (Grant No. QKHFQ2020-4008, QKHZC2022-ZD023), the Modern Industrial Technology System of Chinese Medicinal Materials in Guizhou Province (No. GZCYTX2021-0202), the Natural Science Foundation of China (Grant No. 31401362), and the Major Science and Technology Program of Xiamen, China (Grant No. 3502Z20211004).

Data Availability Statement

The raw sequence data reported in this paper have been deposited in the Genome Sequence Archive (Genomics, Proteomics & Bioinformatics 2021) in the National Genomics Data Center (Nucleic Acids Res 2022), China National Center for Bioinformation/Beijing Institute of Genomics, Chinese Academy of Sciences (GSA: CRA008921), which is publicly accessible at https://ngdc.cncb.ac.cn/gsa.

Conflicts of Interest

The authors declare no conflict of interest.

References

  1. Gupta, A.; Rico-Medina, A.; Caño-Delgado, A.I. The physiology of plant responses to drought. Science 2020, 368, 266–269. [Google Scholar] [CrossRef] [PubMed]
  2. Hussain, M.; Malik, M.A.; Farooq, M.; Ashraf, M.Y.; Cheema, M.A. Improving Drought Tolerance by Exogenous Application of Glycinebetaine and Salicylic Acid in Sunflower. J. Agron. Crop. Sci. 2008, 194, 193–199. [Google Scholar] [CrossRef]
  3. Cattivelli, L.; Rizza, F.; Badeck, F.-W.; Mazzucotelli, E.; Mastrangelo, A.M.; Francia, E.; Marè, C.; Tondelli, A.; Stanca, A.M. Drought tolerance improvement in crop plants: An integrated view from breeding to genomics. Field Crop. Res. 2008, 105, 1–14. [Google Scholar] [CrossRef]
  4. Mckay, J.K.; Richards, J.H.; Mitchell-Olds, T. Genetics of drought adaptation in Arabidopsis thaliana: I. Pleiotropy contributes to genetic correlations among ecological traits. Mol. Ecol. 2003, 12, 1137–1151. [Google Scholar] [CrossRef] [Green Version]
  5. Prasad, P.V.V.; Staggenborg, S.; Ristic, Z. Impacts of drought and/or heat stress on physiological, developmental, growth, and yield processes of crop plants. Adv. Agric. Syst. Model. Ser. 2008, 1, 301–355. [Google Scholar]
  6. Shao, H.-B.; Chu, L.-Y.; Jaleel, C.A.; Zhao, C.-X. Water-deficit stress-induced anatomical changes in higher plants. Comptes Rendus Biol. 2008, 331, 215–225. [Google Scholar] [CrossRef]
  7. Laxa, M.; Liebthal, M.; Telman, W.; Chibani, K.; Dietz, K.-J. The Role of the Plant Antioxidant System in Drought Tolerance. Antioxidants 2019, 8, 94. [Google Scholar] [CrossRef] [Green Version]
  8. Corpas, F.J.; González-Gordo, S.; Palma, J.M. Plant Peroxisomes: A Factory of Reactive Species. Front. Plant Sci. 2020, 11, 853. [Google Scholar] [CrossRef]
  9. Lukatkin, A.S.; Anjum, N.A. Control of cucumber (Cucumis sativus L.) tolerance to chilling stress—evaluating the role of ascorbic acid and glutathione. Front. Environ. Sci. 2014, 2, 62. [Google Scholar] [CrossRef] [Green Version]
  10. Mukarram, M.; Choudhary, S.; Kurjak, D.; Petek, A.; Khan, M.M.A. Drought: Sensing, signalling, effects and tolerance in higher plants. Physiol. Plant. 2021, 172, 1291–1300. [Google Scholar] [CrossRef]
  11. Quan, L.-J.; Zhang, B.; Shi, W.-W.; Li, H.-Y. Hydrogen Peroxide in Plants: A Versatile Molecule of the Reactive Oxygen Species Network. J. Integr. Plant Biol. 2008, 50, 2–18. [Google Scholar] [CrossRef]
  12. Zandalinas, S.I.; Balfagón, D.; Arbona, V.; Gómez-Cadenas, A. Modulation of Antioxidant Defense System Is Associated with Combined Drought and Heat Stress Tolerance in Citrus. Front. Plant Sci. 2017, 8, 953. [Google Scholar] [CrossRef] [Green Version]
  13. Chen, Z.; Cheng, L.; He, Y.; Wei, X. Extraction, characterization, utilization as wound dressing and drug delivery of Bletilla striata polysaccharide: A review. Int. J. Biol. Macromol. 2018, 120, 2076–2085. [Google Scholar] [CrossRef] [PubMed]
  14. Zhang, C.; Gao, F.; Gan, S.; He, Y.; Chen, Z.; Liu, X.; Fu, C.; Qu, Y.; Zhang, J. Chemical characterization and gastroprotective effect of an isolated polysaccharide fraction from Bletilla striata against ethanol-induced acute gastric ulcer. Food Chem. Toxicol. 2019, 131, 110539. [Google Scholar] [CrossRef] [PubMed]
  15. Liu, H.; Li, L.; Li, C.; Huang, C.; ShangGuan, Y.; Chen, R.; Xiao, S.; Wen, W.; Xu, D. Identification and bioinformatic analysis of Aux/IAA family based on transcriptome data of Bletilla striata. Bioengineered 2019, 10, 668–678. [Google Scholar] [CrossRef] [PubMed] [Green Version]
  16. Niu, J.; Zhao, G.; Mi, Z.; Chen, L.; Liu, S.; Wang, S.; Wang, D.; Wang, Z. De novo sequencing of Bletilla striata (Orchidaceae) transcriptome and identification of genes involved in polysaccharide biosynthesis. Genet. Mol. Biol. 2020, 43, e20190417. [Google Scholar] [CrossRef] [PubMed]
  17. Jiang, L.; Lin, M.; Wang, H.; Song, H.; Zhang, L.; Huang, Q.; Chen, R.; Song, C.; Li, G.; Cao, Y. Haplotype-resolved genome assembly of Bletilla striata (Thunb.) Reichb.f. to elucidate medicinal value. Plant J. 2022, 111, 1340–1353. [Google Scholar] [CrossRef]
  18. Ding, L.; Shan, X.; Zhao, X.; Zha, H.; Chen, X.; Wang, J.; Cai, C.; Wang, X.; Li, G.; Hao, J.; et al. Spongy bilayer dressing composed of chitosan–Ag nanoparticles and chitosan–Bletilla striata polysaccharide for wound healing applications. Carbohydr. Polym. 2017, 157, 1538–1547. [Google Scholar] [CrossRef]
  19. Wang, C.X.; Tian, M.; Li, Q.J.; Liu, F. Floral syndrome and breeding system of Bletilla striata. Acta Hortic. Sin. 2012, 39, 1159–1166. [Google Scholar]
  20. Zhang, M.; Shao, Q.; Xu, E.; Wang, Z.; Wang, Z.; Yin, L. Bletilla striata: A review of seedling propagation and cultivation modes. Physiol. Mol. Biol. Plants 2019, 25, 601–609. [Google Scholar] [CrossRef]
  21. Liu, S.; Lu, C.; Jiang, G.; Zhou, R.; Chang, Y.; Wang, S.; Wang, D.; Niu, J.; Wang, Z. Comprehensive functional analysis of the PYL-PP2C-SnRK2s family in Bletilla striata reveals that BsPP2C22 and BsPP2C38 interact with BsPYLs and BsSnRK2s in response to multiple abiotic stresses. Front. Plant Sci. 2022, 13, 963069. [Google Scholar] [CrossRef] [PubMed]
  22. Gao, Y.; Cai, C.; Yang, Q.; Quan, W.; Li, C.; Wu, Y. Response of Bletilla striata to Drought: Effects on Biochemical and Physiological Parameter Also with Electric Measurements. Plants 2022, 11, 2313. [Google Scholar] [CrossRef]
  23. Larocque, G.R. Coupling a detailed photosynthetic model with foliage distribution and light attenuation functions to compute daily gross photosynthesis in sugar maple (Acer saccharum Marsh.) stands. Ecol. Model. 2002, 148, 213–232. [Google Scholar] [CrossRef]
  24. Ramanjulu, S.; Sreenivasulu, N.; Sudhakar, C. Effect of Water Stress on Photosynthesis in Two Mulberry Genotypes with Different drought Tolerance. Photosynthetica 1998, 35, 279–283. [Google Scholar] [CrossRef]
  25. Grabherr, M.G.; Haas, B.J.; Yassour, M.; Levin, J.Z.; Thompson, D.A.; Amit, I.; Adiconis, X.; Fan, L.; Raychowdhury, R.; Zeng, Q.D.; et al. Full-length transcriptome assembly from RNA-Seq data without a reference genome. Nat. Biotechnol. 2011, 29, 644–652. [Google Scholar] [CrossRef] [PubMed] [Green Version]
  26. Li, B.; Dewey, C.N. RSEM: Accurate transcript quantification from RNA-Seq data with or without a reference genome. BMC Bioinform. 2011, 12, 323. [Google Scholar] [CrossRef] [PubMed] [Green Version]
  27. Benjamini, Y.; Drai, D.; Elmer, G.; Kafkafi, N.; Golani, I. Controlling the false discovery rate in behavior genetics research. Behav. Brain Res. 2001, 125, 279–284. [Google Scholar] [CrossRef] [Green Version]
  28. Weyers, J.D.B.; Paterson, N.W. Plant hormones and the control of physiological processes. New Phytol. 2001, 152, 375–407. [Google Scholar] [CrossRef] [Green Version]
  29. Kazan, K. Diverse roles of jasmonates and ethylene in abiotic stress tolerance. Trends Plant Sci. 2015, 20, 219–229. [Google Scholar] [CrossRef]
  30. Ullah, A.; Manghwar, H.; Shaban, M.; Khan, A.H.; Akbar, A.; Ali, U.; Ali, E.; Fahad, S. Phytohormones enhanced drought tolerance in plants: A coping strategy. Environ. Sci. Pollut. Res. 2018, 25, 33103–33118. [Google Scholar] [CrossRef]
  31. Danquah, A.; de Zelicourt, A.; Colcombet, J.; Hirt, H. The role of ABA and MAPK signaling pathways in plant abiotic stress responses. Biotechnol. Adv. 2014, 32, 40–52. [Google Scholar] [CrossRef] [PubMed]
  32. Ullah, A.; Sun, H.; Yang, X.; Zhang, X. Drought coping strategies in cotton: Increased crop per drop. Plant Biotechnol. J. 2017, 15, 271–284. [Google Scholar] [CrossRef] [PubMed] [Green Version]
  33. Yoshida, R.; Hobo, T.; Ichimura, K.; Mizoguchi, T.; Takahashi, F.; Aronso, J.; Ecker, J.; Shinozaki, K. ABA-Activated SnRK2 Protein Kinase is Required for Dehydration Stress Signaling in Arabidopsis. Plant Cell Physiol. 2002, 43, 1473–1483. [Google Scholar] [CrossRef]
  34. Bharath, P.; Gahir, S.; Raghavendra, A.S. Abscisic Acid-Induced Stomatal Closure: An Important Component of Plant Defense Against Abiotic and Biotic Stress. Front. Plant Sci. 2021, 12, 615114. [Google Scholar] [CrossRef]
  35. Mori, I.C.; Murata, Y.; Yang, Y.; Munemasa, S.; Wang, Y.-F.; Andreoli, S.; Tiriac, H.; Alonso, J.M.; Harper, J.F.; Ecker, J.R.; et al. CDPKs CPK6 and CPK3 Function in ABA Regulation of Guard Cell S-Type Anion- and Ca2+- Permeable Channels and Stomatal Closure. PLoS Biol. 2006, 4, 1749–1762. [Google Scholar] [CrossRef] [PubMed] [Green Version]
  36. Flexas, J.; Medrano, H. Drought-inhibition of photosynthesis in C3 plants: Stomatal and non-stomatal limitations revisited. Ann. Bot. 2002, 89, 183–189. [Google Scholar] [CrossRef] [PubMed] [Green Version]
  37. de Ollas, C.; Dodd, I.C. Physiological impacts of ABA–JA interactions under water-limitation. Plant Mol. Biol. 2016, 91, 641–650. [Google Scholar] [CrossRef] [PubMed] [Green Version]
  38. Fujita, Y.; Fujita, M.; Satoh, R.; Maruyama, K.; Parvez, M.M.; Seki, M.; Hiratsu, K.; Ohme-Takagi, M.; Shinozaki, K.; Yamaguchi-Shinozaki, K. AREB1 Is a Transcription Activator of Novel ABRE-Dependent ABA Signaling That Enhances Drought Stress Tolerance in Arabidopsis. Plant Cell 2005, 17, 3470–3488. [Google Scholar] [CrossRef] [Green Version]
  39. Stoppel, R.; Lezhneva, L.; Schwenkert, S.; Torabi, S.; Felder, S.; Meierhoff, K.; Westhoff, P.; Meurer, J. Recruitment of a Ribosomal Release Factor for Light- and Stress-Dependent Regulation of petB Transcript Stability in Arabidopsis Chloroplasts. Plant Cell 2011, 23, 2680–2695. [Google Scholar] [CrossRef] [Green Version]
  40. Haldrup, A.; Simpson, D.J.; Scheller, H.V. Down-regulation of the PSI-F Subunit of Photosystem I (PSI) in Arabidopsis thaliana—The PSI-F subunit is essential for photoautotrophic growth and contributes the antenna function. J. Biol. Chem. 2000, 275, 31211–31218. [Google Scholar] [CrossRef] [Green Version]
  41. Krieger-Liszkay, A.; Shimakawa, G.; Sétif, P. Role of the two PsaE isoforms on O2 reduction at photosystem I in Arabidopsis thaliana. Biochim. Biophys. Acta (BBA)—Bioenerg. 2019, 1861, 148089. [Google Scholar] [CrossRef] [PubMed]
  42. Bricker, T.M.; Roose, J.L.; Zhang, P.; Frankel, L.K. The PsbP family of proteins. Photosynth. Res. 2013, 116, 235–250. [Google Scholar] [CrossRef] [PubMed]
  43. Kakiuchi, S.; Uno, C.; Ido, K.; Nishimura, T.; Noguchi, T.; Ifuku, K.; Sato, F. The PsbQ protein stabilizes the functional binding of the PsbP protein to photosystem II in higher plants. Biochim. Biophys. Acta (BBA)—Bioenerg. 2012, 1817, 1346–1351. [Google Scholar] [CrossRef] [PubMed] [Green Version]
  44. Żelisko, A.; García-Lorenzo, M.; Jackowski, G.; Jansson, S.; Funk, C. AtFtsH6 is involved in the degradation of the light-harvesting complex II during high-light acclimation and senescence. Proc. Natl. Acad. Sci. USA 2005, 102, 13699–13704. [Google Scholar] [CrossRef] [Green Version]
  45. Close, T.J.; Kortt, A.A.; Chandler, P.M. A cDNA-based comparison of dehydration-induced proteins (dehydrins) in barley and corn. Plant Mol. Biol. 1989, 13, 95–108. [Google Scholar] [CrossRef]
  46. Riyazuddin, R.; Nisha, N.; Singh, K.; Verma, R.; Gupta, R. Involvement of dehydrin proteins in mitigating the negative effects of drought stress in plants. Plant Cell Rep. 2021, 41, 519–533. [Google Scholar] [CrossRef]
  47. Yang, Z.; Sheng, J.; Lv, K.; Ren, L.; Zhang, D. Y2SK2 and SK3 type dehydrins from Agapanthus praecox can improve plant stress tolerance and act as multifunctional protectants. Plant Sci. 2019, 284, 143–160. [Google Scholar] [CrossRef]
  48. Verma, G.; Dhar, Y.V.; Srivastava, D.; Kidwai, M.; Chauhan, P.S.; Bag, S.K.; Asif, M.H.; Chakrabarty, D. Genome-wide analysis of rice dehydrin gene family: Its evolutionary conservedness and expression pattern in response to PEG induced degydration stress. PLoS ONE 2017, 12, e0176399. [Google Scholar] [CrossRef] [Green Version]
Figure 1. Images of B. striata under normal (CK) and drought conditions.
Horticulturae 09 00307 g001
Figure 2. The photosynthetic characteristics of B. striata under normal and drought conditions: (A) net photosynthetic rate (Pn), (B) stomatal conductance (Gs), (C) intercellular CO2 concentration (Ci), (D) evaporation rate (E), (E) stomatal limitation (Ls), and (F) ratio of Ci/Gs. Means and standard errors of at least five replicates are shown.
Horticulturae 09 00307 g002
Figure 3. The Pearson correlation coefficient (A) and principal component analysis (B) of B. striata under CK and drought stress.
Horticulturae 09 00307 g003
Figure 4. The volcano plot of differentially expressed genes (DEGs) in B. striata leaves under CK and drought conditions. Red plots represent upregulated DEGs, green plots represent downregulated DEGs, and blue plots represent the DEGs without significantly change.
Horticulturae 09 00307 g004
Figure 5. The KEGG and GO enrichment analyses of B. striata under CK and drought conditions. (A) The results of KEGG enrichment analysis; (B) the results of GO (biological process) enrichment analysis.
Horticulturae 09 00307 g005
Figure 6. Hierarchical clustering analysis of DEGs involved in plant hormone signal transduction (ko04075) in B. striata under CK and drought conditions. Each group has three replicates.
Horticulturae 09 00307 g006
Figure 7. The expression profiles of DEGs involved in four GO terms in B. striata under CK and drought conditions, including response to water (GO:0009415), response to an abiotic stimulus (GO:0009628), response to an inorganic substance (GO:0010035), and response to an oxygen-containing compound (GO:1901700). Each group has three replicates.
Horticulturae 09 00307 g007
Table 1. Summary of transcriptomes in B. striata under drought stress.
SampleCK1CK2CK3Drought1Drought2Drought3
Raw Data51,068,51047,394,69049,121,32645,204,11456,709,02055,046,454
Clean Data49,902,99446,355,07248,119,71044,225,17455,207,80853,905,350
Q30 (%)92.5690.1492.2492.3492.4092.03
GC Content (%)47.7147.6147.6546.9947.3046.97
Table 2. Annotations of unigenes in various databases.
DatabaseNumber of GenesPercentage (%)
Annotated in NR81,95867.09
Annotated in NT45,17436.97
Annotated in KO29,84724.43
Annotated in SwissProt57,29346.89
Annotated in PFAM56,06345.89
Annotated in GO56,06345.89
Annotated in KOG21,86917.9
Annotated in At Least One Database86,61870.9
Table 3. DEGs related to photosynthesis, ABA signal transduction, and antioxidant metabolism in B. striata under drought stress.
Gene IDNR IDNR Descriptionlog2FCq-Value
Photosynthesis
Cluster-6724.91253YP_009347733.1Cytochrome b6, chloroplast−2.22240.009795
Cluster-6724.49822XP_020586841.1Photosystem I reaction center subunit III, chloroplastic−1.20250.015406
Cluster-6724.49802XP_020584337.1Photosystem I reaction center subunit V, chloroplastic−1.25160.000058
Cluster-6724.50075XP_020592430.1Photosystem I reaction center subunit psaK, chloroplastic−1.24830.00262
Cluster-6724.44868XP_020674733.1psbQ-like protein 3, chloroplastic7.57570.000007
Cluster-6724.68113PKU73612.1PsbP domain-containing protein 3, chloroplastic7.63450.026749
Cluster-6724.86842XP_020701207.1psbP domain-containing protein 1, chloroplastic isoform X11.17280.000497
Cluster-6724.55459PKU68001.1ATP-dependent zinc metalloprotease FTSH 11, chloroplastic6.16540.012827
Cluster-6724.47025XP_020682163.1ATP-dependent zinc metalloprotease FTSH 11, chloroplastic7.03830.018672
Cluster-6724.49015AVI16663.1Photosystem I reaction center subunit psaK3.48850.020947
Cluster-6724.74411XP_020682631.1Oxygen-evolving enhancer protein 2, chloroplastic-like1.72170.005108
Cluster-2398.0XP_018676095.1PREDICTED: photosynthetic NDH subunit of lumenal location 3, chloroplastic-like5.48060.041334
Cluster-6724.11910XP_020600282.1Oxygen-evolving enhancer protein 3-2, chloroplastic-like1.11120.030315
Cluster-6724.49786XP_020672629.1Photosystem II core complex proteins psbY, chloroplastic isoform X21.37620.000000
ABA Signal Transduction
Cluster-6724.40260XP_020672595.1Abscisic-acid receptor PYL4-like −6.93960.000001
Cluster-6724.91783XP_020673631.1Abscisic-acid receptor PYR1-like −3.49960.000000
Cluster-6724.61155XP_020587854.1Abscisic-acid receptor PYL8-like−1.43270.000000
Cluster-6724.38513PKU64533.1Abscisic-acid receptor PYL5 −2.90870.000000
Cluster-6724.40259XP_020672595.1Abscisic-acid receptor PYL4-like −4.0460.000000
Cluster-6724.61497KZV54161.1Hypothetical protein F511_37072−1.54310.046313
Cluster-6724.3652PKU68005.1Putative protein phosphatase 2C 8 2.17360.032413
Cluster-6724.16415PKU68005.1Putative protein phosphatase 2C 8 3.97370.000260
Cluster-6724.91192XP_020597478.1Protein phosphatase 2C 37-like4.67380.000000
Cluster-6724.6728XP_020698862.1Probable protein phosphatase 2C 68 4.15380.000000
Cluster-6724.46469PKA58960.1Putative protein phosphatase 2C 83.07050.000000
Cluster-6724.86228PKA58960.1Putative protein phosphatase 2C 84.1320.01917
Cluster-6724.93558PKU74952.1Putative protein phosphatase 2C 9 5.56980.000110
Cluster-6724.93557PKU74952.1Putative protein phosphatase 2C 9 5.44730.000036
Cluster-6724.15036XP_020682015.1Probable protein phosphatase 2C 30 2.14850.000000
Cluster-6724.22798XP_020698862.1Probable protein phosphatase 2C 68 8.70290.000000
Cluster-6724.22799XP_020698862.1Probable protein phosphatase 2C 68 7.59180.000025
Cluster-6724.5916PKU68005.1Putative protein phosphatase 2C 8 2.95110.000000
Cluster-6724.5917PKU68005.1Putative protein phosphatase 2C 8 3.250.000000
Cluster-6724.5919PKU68005.1Putative protein phosphatase 2C 8 3.92310.000000
Cluster-6724.90331XP_020597478.1Protein phosphatase 2C 37-like6.60680.000000
Cluster-6724.48042PKU76292.1Putative protein phosphatase 2C 6 1.92410.000000
Cluster-6724.69799XP_020693557.1Probable protein phosphatase 2C 50 5.13970.000052
Cluster-6724.5918PKU68005.1Putative protein phosphatase 2C 8 3.81780.000000
Cluster-6724.65584XP_020573821.1Serine/threonine protein kinase SAPK3-like isoform X11.07950.041358
Cluster-6724.50267XP_020705528.1Serine/threonine protein kinase SAPK10-like isoform X2 2.51980.000000
Cluster-6724.56769XP_015636932.1PREDICTED: serine/threonine protein kinase SAPK71.96860.000100
Cluster-6724.18821PKU80471.1Serine/threonine protein kinase SAPK3 5.66940.004812
Cluster-6724.60505API65110.1Serine/threonine protein kinase SRK2E1.04740.000001
Cluster-6724.52592PKU80471.1Serine/threonine protein kinase SAPK3 6.83540.000240
Cluster-6724.41934PKU79905.1ABSCISIC ACID-INSENSITIVE 5-like protein 5 1.27120.000000
Cluster-6724.51613XP_020694098.1ABSCISIC ACID-INSENSITIVE 5-like protein 5 isoform X1 3.94250.008781
Cluster-6724.93796PKU83951.1ABSCISIC ACID-INSENSITIVE 5-like protein 5 3.22590.000000
Cluster-7290.0PKU75117.1S-type anion channel SLAH2 4.1460.000001
Antioxidant Metabolism
Cluster-6724.52388ACN25039.1Ascorbate peroxidase−4.33020.000005
Cluster-6724.52387ACN25039.1Ascorbate peroxidase−9.20540.000000
Cluster-6724.51106XP_020590426.1Superoxide dismutase [Cu-Zn] 4A7.63690.000002
Cluster-6724.49968XP_020702876.1Catalase isozyme A 7.88410.000000
Cluster-4051.0XP_020585759.1Peroxidase P7-like isoform X14.51870.000000
Cluster-6724.2897PKU65314.1Peroxidase 42 4.64610.000000
Cluster-6724.98401PKU59654.1Cationic peroxidase 1 7.7970.000086
Cluster-6724.78777XP_020679253.1Probable glutathione S-transferase parA 9.86730.000006
Cluster-6724.95492PKU87189.1Putative glutathione S-transferase parA 6.93820.003953
Cluster-6724.45643PKU87189.1Putative glutathione S-transferase parA 4.10340.002935
Cluster-15974.0XP_020573757.1Glutathione S-transferase F8, chloroplastic-like4.54250.000004
Disclaimer/Publisher’s Note: The statements, opinions and data contained in all publications are solely those of the individual author(s) and contributor(s) and not of MDPI and/or the editor(s). MDPI and/or the editor(s) disclaim responsibility for any injury to people or property resulting from any ideas, methods, instructions or products referred to in the content.

