
Evaluation of SPAD Index for Estimating Nitrogen and Magnesium Contents in Three Blueberry Varieties (Vaccinium corymbosum L.) on the Andean Tropics

 ,
,  and
and
Abstract
:1. Introduction
2. Materials and Methods
2.1. Localization
2.2. Plant Materials
2.3. Crop Management
2.4. Measurement of SPAD, Nitrogen y Magnesium Values
2.5. Statistical Analysis
3. Results
4. Discussion
5. Conclusions
Author Contributions
Funding
Data Availability Statement
Acknowledgments
Conflicts of Interest
References
- Lim, T.K. Vaccinium corymbosum. In Edible Medicinal and Non-Medicinal Plants; Springer: Dordrecht, The Netherlands, 2012; pp. 452–464. [Google Scholar] [CrossRef]
- Jaime-Guerrero, M.; Álvarez-Herrera, J.G.; Ruiz-Berrío, H.D. Postharvest application of acibenzolar-S-methyl and plant extracts affect physicochemical properties of blueberry (Vaccinium corymbosum L.) fruits. Agron. Colomb. 2022, 40, 42–52. [Google Scholar] [CrossRef]
- Zhang, Y.; Huang, D.; Wang, B.; Yang, X.; Wu, H.; Qu, P.; Yan, L.; Li, T. Characterization of Highbush Blueberry (Vaccinium corymbosum L.) Anthocyanin Biosynthesis Related MYBs and Functional Analysis of VcMYB Gene. Curr. Issues Mol. Biol. 2023, 45, 379–399. [Google Scholar] [CrossRef] [PubMed]
- Protzman, E. Blueberries Around the Globe—Past, Present, and Future. In International Agricultural Trade Report; U.S. Department of Agriculture: Washington, DC, USA, 2021; pp. 1–6. Available online: https://www.fas.usda.gov/sites/default/files/2021-10/GlobalBlueberriesFinal_1.pdf (accessed on 8 January 2023).
- Cleves, J. Fundamentos Técnicos del Cultivo del Arándano (Vaccinium corymbosum L.) en la Región Central de Colombia; Editorial de la Universidad Pedagógica y Tecnológica de Colombia-UPTC: Tunja, Colombia, 2021; p. 96. [Google Scholar]
- Fischer, G.; Parra-Coronado, A.; Balaguera-López, H.E. Altitude as a determinant of fruit quality with emphasis on the Andean tropics of Colombia—A review. Agron. Colomb. 2022, 40, 70–85. [Google Scholar] [CrossRef]
- Roveda-Hoyos, G.; Venegas-Gómez, J.F.; Moreno-Fonseca, L.P.; Magnitskiy, S.; Ramírez-Gómez, M. Effect of inoculation with Acaulospora and Glomus on the growth and nutrition of blueberries (Vaccinium corymbosum) with different fertilization levels. Rev. Colomb. Cienc. Hortícolas 2022, 16, e13561. [Google Scholar] [CrossRef]
- Tagliavini, M.; Baldi, E.; Lucchi, P.; Antonelli, M.; Sorrenti, G.; Baruzzi, G.; Faedi, W. Dynamics of nutrients uptake by strawberry plants (Fragaria x Ananassa Dutch.) grown in soil and soilless culture. Eur. J. Agron. 2005, 23, 15–25. [Google Scholar] [CrossRef]
- Han, D.G.; Heo, S.; Chio, J.M.; Chung, Y.S. SPAD: Potential phenotyping method for characterization of blueberry. Mol. Biol. Rep. 2022, 49, 5505–5510. [Google Scholar] [CrossRef]
- Srivastava, A.K.; Hu, C. Fruit Crops—Diagnosis and Management of Nutrient Constraints; Elsevier: Amsterdam, The Netherlands, 2020; p. 776. [Google Scholar]
- Prado, R.M.; Rozane, D.E. Chapter 11. Leaf analysis as diagnostic tool for balanced fertilization in tropical fruits. In Fruit Crops—Diagnosis and Management of Nutrient Constraints; Srivastava, A.K., Hu, C., Eds.; Elsevier: Amsterdam, The Netherlands, 2020; pp. 131–143. [Google Scholar]
- Güiza-Castillo, L.; Pinzón-Sandoval, E.H.; Serrano-Reyes, P.A.; Cely-Reyes, G.E.; Serrano-Agudelo, P.C. Estimation and correlation of chlorophyll and nitrogen contents in Psidium guajava L. with destructive and non-destructive methods. Rev. Colomb. Cienc. Hortícolas 2020, 14, 462–470. [Google Scholar] [CrossRef]
- Nestbya, R.; Retamales, J.B. Chapter 40. Diagnosis and management of nutritional constraints in berries. In Fruit Crops—Diagnosis and Management of Nutrient Constraints; Srivastava, A.K., Hu, C., Eds.; Elsevier: Amsterdam, The Netherlands, 2020; pp. 567–582. [Google Scholar]
- Xiong, D.; Chen, J.; Yu, T.; Gao, W.; Ling, X.; Li, Y.; Peng, S.; Huang, J. SPAD-based leaf nitrogen estimation is impacted by environmental factors and crop leaf characteristics. Sci. Rep. 2015, 5, 13389. [Google Scholar] [CrossRef] [Green Version]
- Marschner, P. Mineral Nutrition of Higher Plants, 3rd ed.; Elsevier Ltd.: Amsterdam, The Netherlands, 2012; p. 668. [Google Scholar]
- Evans, J.R.; Poorter, H. Photosynthetic acclimation of plants to growth irradiance: The relative importance of specific leaf area and nitrogen partitioning in maximizing carbon gain. Plant Cell Environ. 2001, 24, 755–767. [Google Scholar] [CrossRef]
- Pinzón-Sandoval, E.H.; Almanza-Merchán, P.J.; Cely-Reyes, G.E.; Serrano-Cely, P.A.; Ayala-Martínez, G.A. Correlation between SPAD and chlorophylls a, b and total in leaves from Vaccinium corymbosum L. cv. Biloxi, Legacy and Victoria in the high tropics. Rev. Colomb. Cienc. Hortícolas 2022, 16, e14693. [Google Scholar] [CrossRef]
- Saravia, D.; Farfán-Vignolo, E.R.; Gutiérrez, R.; De Mendiburu, F.; Schafleitner, R.; Bonierbale, M.; Khan, M.A. Yield and Physiological Response of Potatoes Indicate Different Strategies to Cope with Drought Stress and Nitrogen Fertilization. Am. J. Potato Res. 2016, 93, 288–295. [Google Scholar] [CrossRef] [Green Version]
- Mehrabi, F.; Sepaskhah, A.R. Leaf Nitrogen, Based on SPAD Chlorophyll Reading Can Determine Agronomic Parameters of Winter Wheat. Int. J. Plant Prod. 2022, 16, 77–91. [Google Scholar] [CrossRef]
- Zhang, K.; Yuan, Z.; Yang, T.; Lu, Z.; Cao, Q.; Tian, Y.; Zhu, Y.; Cao, W.; Liu, X. Chlorophyll meter–based nitrogen fertilizer optimization algorithm and nitrogen nutrition index for in-season fertilization of paddy rice. Agron. J. 2020, 112, 288–300. [Google Scholar] [CrossRef]
- Ramos-García, C.A.; Martínez-Martínez, L.J.; Bernal-Riobo, J.H. Estimating chlorophyll and nitrogen contents in maize leaves (Zea mays L.) with spectroscopic analysis. Rev. Colomb. Cienc. Hortícolas 2022, 16, e13398. [Google Scholar] [CrossRef]
- Callejas, R.; Kania, E.; Contreras, A.; Peppi, C.; Morales, L. Evaluación de un método no destructivo para estimar las concentraciones de clorofila en hojas de variedades de uva de mesa. Idesia 2014, 31, 19–26. [Google Scholar] [CrossRef] [Green Version]
- Castañeda, C.; Almanza-Merchán, P.; Pinzón-Sandoval, E.; Cely, G.; Serrano, P. Estimación de la concentración de clorofila mediante métodos no destructivos en vid (Vitis vinifera L.) cv. Riesling Becker. Rev. Colomb. Cienc. Hortícolas 2018, 12, 329–337. [Google Scholar] [CrossRef] [Green Version]
- Cepeda, M.A.; Vélez-Sánchez, J.E.; Balaguera-López, H.E. Analysis of growth and physicochemical changes in apple cv. Anna in a high-altitude tropical climate. Rev. Colomb. Cienc. Hortícolas 2021, 15, e12508. [Google Scholar] [CrossRef]
- Hirzel, J. Fertilización en el Arándano. In Manual de Arándano; Undurraga, P., Vargas, S., Eds.; Centro Regional de Investigación Quilamapu: Chillán, Chile, 2013; pp. 31–42. [Google Scholar]
- Han, D.G.; Ho Jung, D.; Heo, S.; Suk Chung, Y. SPAD Value Difference between Blueberry Cultivar ‘STAR’ by Planted Ground and Pot. Phyton 2022, 91, 2583–2590. [Google Scholar] [CrossRef]
- R Core Team. R: A Language and Environment for Statistical Computing; R Foundation for Statistical Computing: Vienna, Austria, 2022. [Google Scholar]
- Jiang, Y.; Zeng, Q.; Wei, J.; Jiang, J.; Li, Y.; Chen, J.; Yu, H. Growth, fruit yield, photosynthetic characteristics, and leaf microelement concentration of two blueberry cultivars under different long-term soil pH treatments. Agronomy 2019, 9, 357. [Google Scholar] [CrossRef] [Green Version]
- Lambers, H.; Oliveira, R.S. Plant Physiological Ecology. Encyclopedia of Ecology, Five-Volume Set; Springer International Publishing: Cham, Switzerland, 2019; pp. 2744–2751. [Google Scholar] [CrossRef]
- Zydlik, Z.; Zydlik, P.; Kafkas, N.E.; Yesil, B.; Cieśliński, S. Foliar Application of Some Macronutrients and Micronutrients Improves Yield and Fruit Quality of Highbush Blueberry (Vaccinium corymbosum L.). Horticulturae 2022, 8, 664. [Google Scholar] [CrossRef]
- Baek, S.-A.; Im, K.-H.; Park, S.U.; Oh, S.-D.; Choi, J.; Kim, J.K. Dynamics of Short-Term Metabolic Profiling in Radish Sprouts (Raphanus sativus L.) in Response to Nitrogen Deficiency. Plants 2019, 8, 361. [Google Scholar] [CrossRef] [PubMed] [Green Version]
- Bassi, D.; Menossi, M.; Mattiello, L. Nitrogen supply influences photosynthesis establishment along the sugarcane leaf. Sci. Rep. 2018, 8, 2327. [Google Scholar] [CrossRef] [Green Version]
- Lukas, S.; Singh, S.; DeVetter, L.W.; Davenport, J.R. Leaf Tissue Macronutrient Standards for Northern Highbush Blueberry Grown in Contrasting Environments. Plants 2022, 11, 3376. [Google Scholar] [CrossRef] [PubMed]
- Ye, X.; Chen, X.F.; Deng, C.L.; Yang, L.T.; Lai, N.W.; Guo, J.X.; Chen, L.S. Magnesium-deficiency effects on pigments, photosynthesis and photosynthetic electron transport of leaves, and nutrients of leaf blades and veins in citrus sinensis seedlings. Plants 2019, 8, 389. [Google Scholar] [CrossRef] [Green Version]
- Islam, W.; Tauqeer, A.; Waheed, A.; Zeng, F. MicroRNA Mediated Plant Responses to Nutrient Stress. Int. J. Mol. Sci. 2022, 23, 2562. [Google Scholar] [CrossRef]
- Lee, Y.; Kweon, H.J.; Park, M.-Y.; Lee, D. Field Assessment of Macronutrients and Nitrogen in Apple Leaves Using a Chlorophyll Meter. Horttechnology 2019, 29, 300–307. [Google Scholar] [CrossRef] [Green Version]
- Simkó, A.; Veres, S. Evaluation of the correlation between SPAD readings and absolute chlorophyll content of maize under different nitrogen supply conditions. Acta Agrar. Debr. 2019, 2, 121–126. [Google Scholar] [CrossRef]
- Bloom, A.; Smith, S. Nutrição Mineral. In Fisiologia e Desenvolvimento Vegetal; Taiz, L., Zeiger, E., Møller, I., Murphy, A., Eds.; 6a Edição: Porto Alegre, Brazil, 2017; pp. 119–143. [Google Scholar]
- Fiedor, L.; Zbyradowski, M.; Pilch, M. Tetrapyrrole pigments of photosynthetic antennae and reaction centers of higher plants: Structures, biophysics, functions, biochemistry, mechanisms of regulation, applications. In Advances in Botanical Research, 1st ed.; Elsevier Ltd.: Amsterdam, The Netherlands, 2019; Volume 90, pp. 1–33. [Google Scholar] [CrossRef]
- Zeng, Z.; Lin, T.; Zhao, J.; Zheng, T.; Xu, L.; Wang, Y.; Liu, L.; Jiang, L.; Chen, S.; Wan, J. OsHemA gene, encoding glutamyl-tRNA reductase (GluTR) is essential for chlorophyll biosynthesis in rice (Oryza sativa). J. Integr. Agric. 2020, 19, 612–623. [Google Scholar] [CrossRef]
- Lin, F.F.; Qiu, L.F.; Deng, J.S.; Shi, Y.Y.; Chen, L.S.; Wang, K. Investigation of SPAD meter-based indices for estimating rice nitrogen status. Comput. Electron. Agric. 2010, 71, 60–65. [Google Scholar] [CrossRef]
- Willows, R.D. The Mg Branch of Chlorophyll Synthesis: Biosynthesis of Chlorophyll a from Protoporphyrin IX. In Advances in Botanical Research, 1st ed.; Elsevier Ltd.: Amsterdam, The Netherlands, 2019; Volume 90, pp. 141–182. [Google Scholar] [CrossRef]
- Tränkner, M.; Jamali, S. Minimum magnesium concentrations for photosynthetic efficiency in wheat and sunflower seedlings. Plant Physiol. Biochem. 2019, 144, 234–243. [Google Scholar] [CrossRef] [PubMed]
- Yousaf, M.; Bashir, S.; Raza, H.; Shah, A.N.; Iqbal, J.; Arif, M.; Bukhari, M.A.; Muhammad, S.; Hashim, S.; Alkahtani, J.; et al. Role of nitrogen and magnesium for growth, yield and nutritional quality of radish. Saudi J. Biol. Sci. 2021, 28, 3021–3030. [Google Scholar] [CrossRef] [PubMed]
- Wadas, W.; Dziugieł, T. Changes in assimilation area and chlorophyll content of very early potato (Solanum tuberosum L.) cultivars as influenced by biostimulants. Agronomy 2020, 10, 387. [Google Scholar] [CrossRef] [Green Version]


| February | March | April | May | June | July | August | |
|---|---|---|---|---|---|---|---|
| Temperature (°C) | 13.2 | 15.4 | 15.0 | 14.5 | 14 | 14.2 | 13.7 |
| RH (%) | 88.8 | 77.6 | 79.9 | 81.1 | 83.8 | 80.4 | 79.8 |
| Variety | Variable | Parameters Linear Regression | |||||
|---|---|---|---|---|---|---|---|
| Intercept | p-Value | Slope | p-Value | R2 Adjusted | Equation Lineal Model | ||
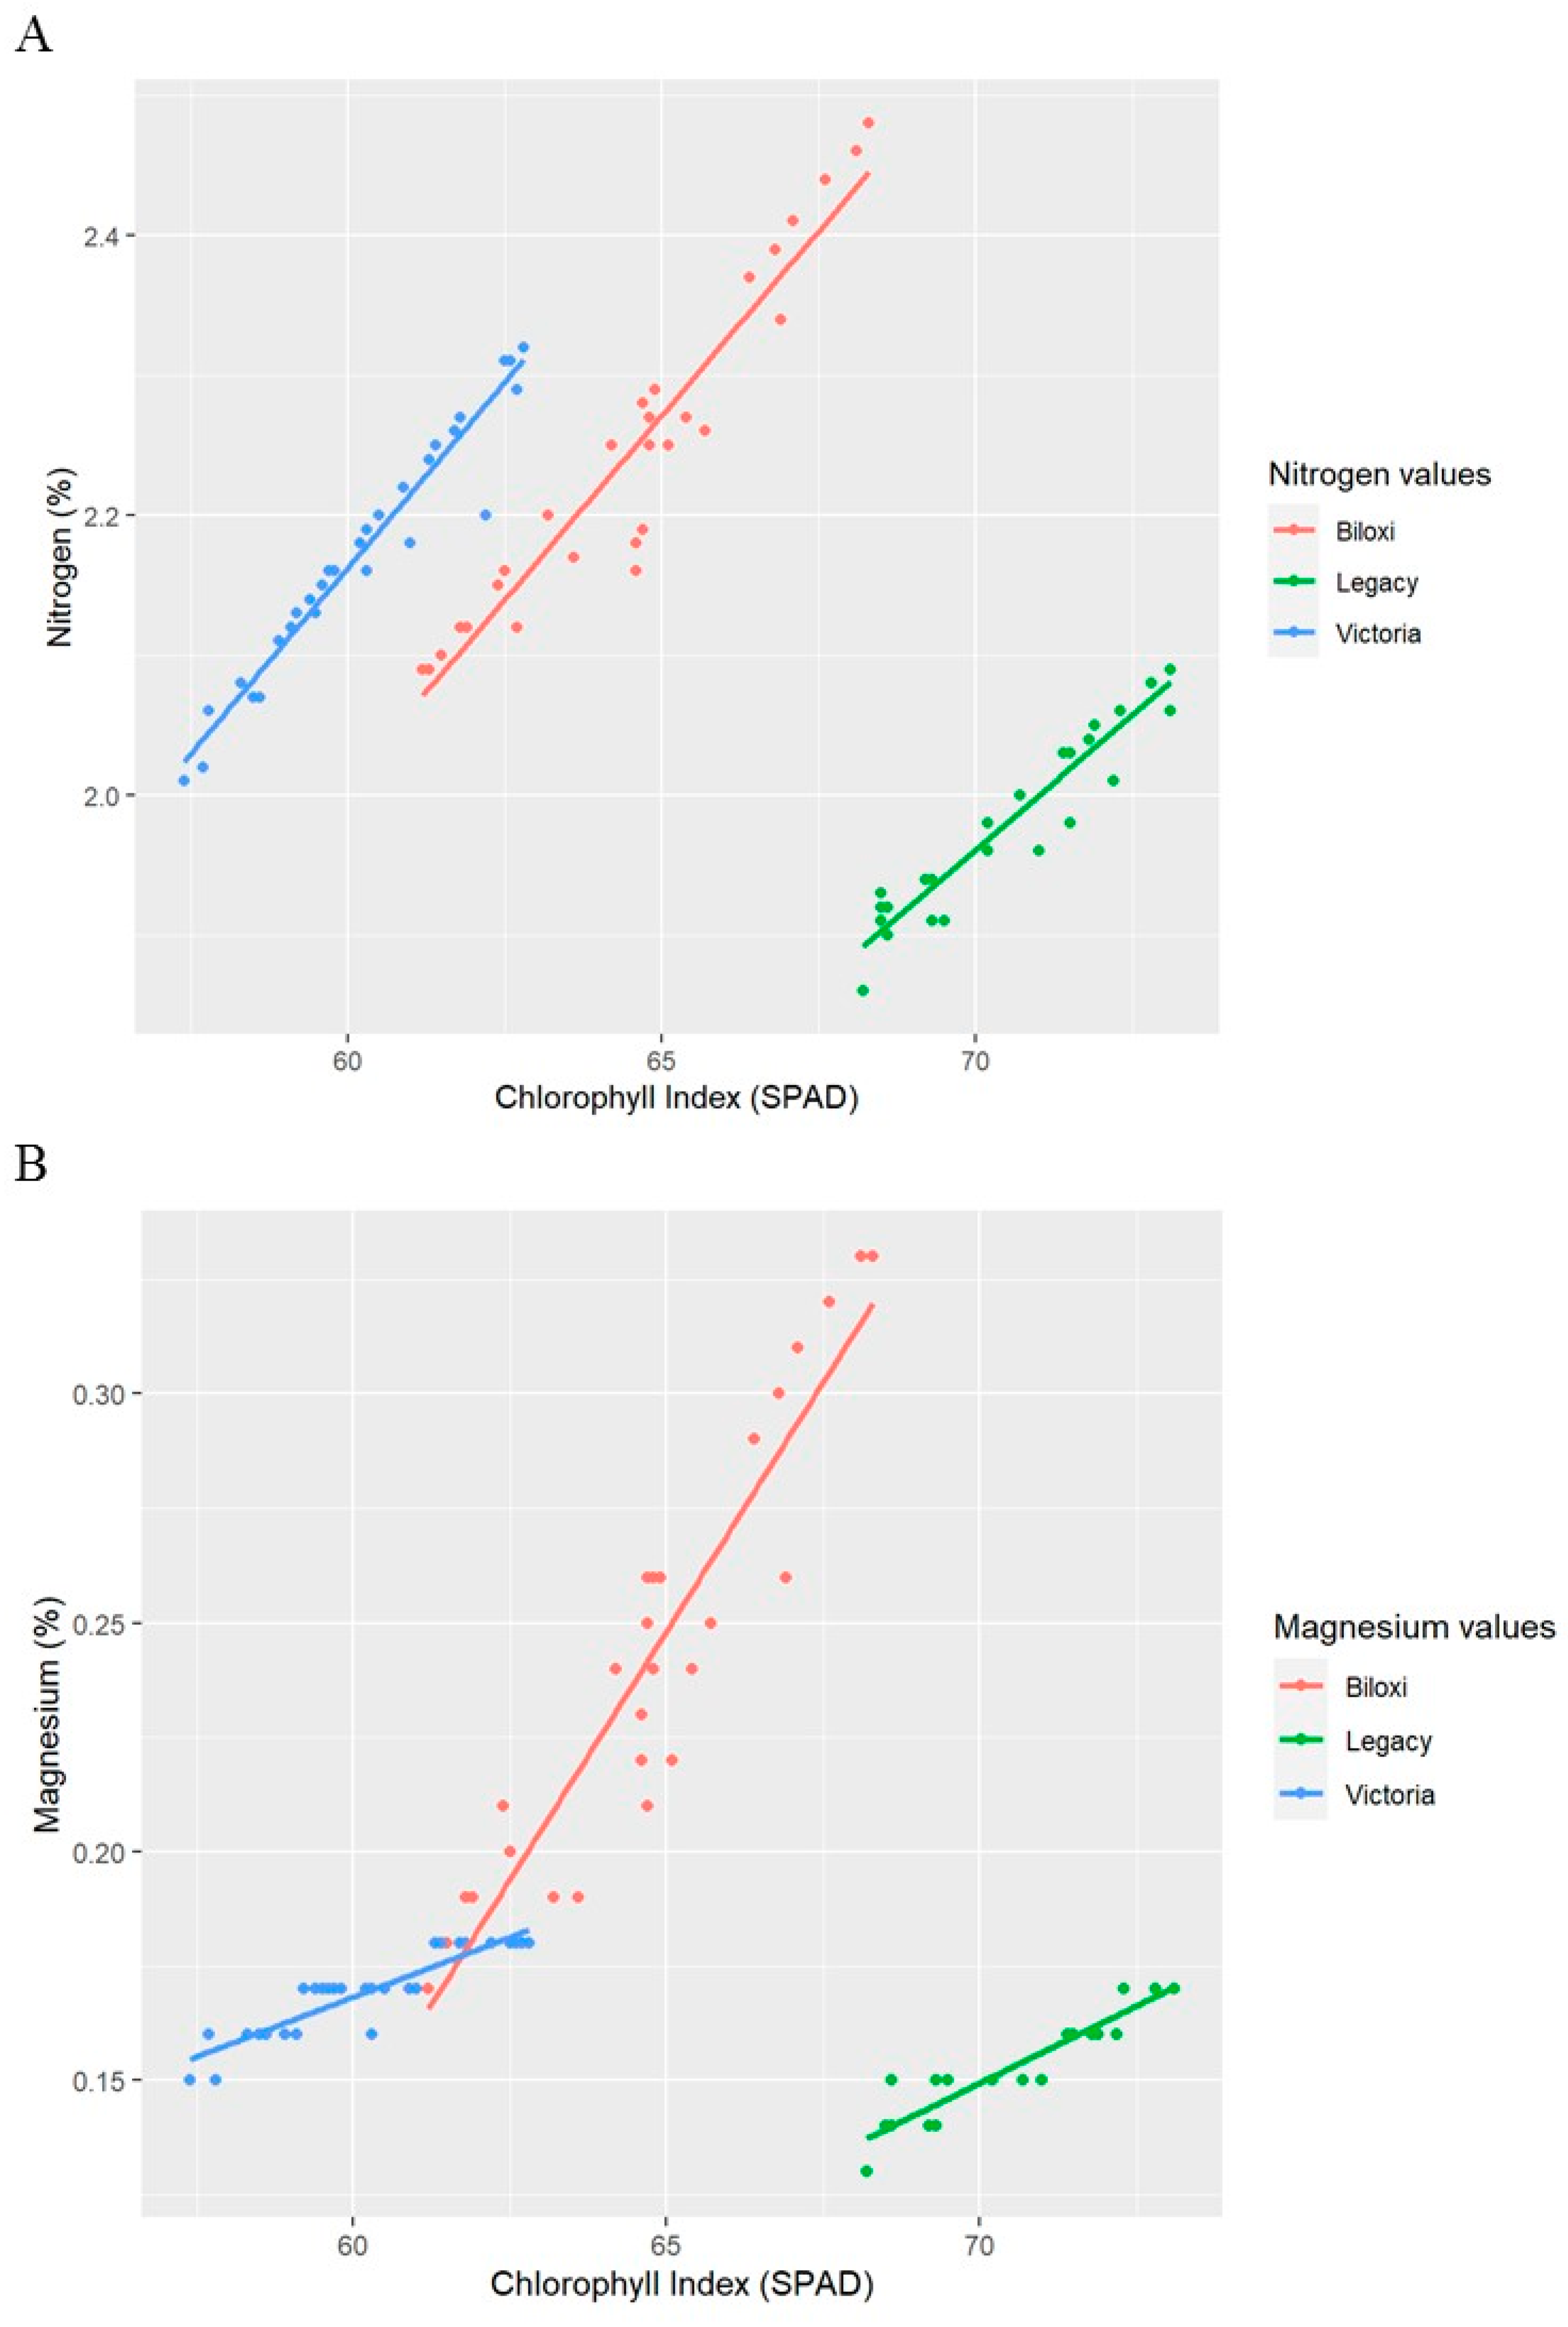
| Biloxi | Nitrogen | −1.1535 | <0.001 | 0.05269 | <0.001 | 0.91 | N = 0.0569 × SPAD − 1.1535 |
| Magnesium | −1.1637 | <0.001 | 0.02172 | <0.001 | 0.87 | Mg = 0.02172 × SPAD − 1.1637 | |
| Legacy | Nitrogen | −0.7309 | <0.001 | 0.03846 | <0.001 | 0.9 | N = 0.03846 × SPAD − 0.7309 |
| Magnesium | −0.3226 | <0.001 | 0.00674 | <0.001 | 0.89 | Mg = 0.00674 × SPAD − 0.3226 | |
| Victoria | Nitrogen | −1.0261 | <0.001 | 0.05313 | <0.001 | 0.94 | N = 0.05313 × SPAD − 1.0261 |
| Magnesium | −0.1448 | <0.001 | 0.005218 | <0.001 | 0.82 | Mg = 0.005218 × SPAD − 0.1448 | |
Disclaimer/Publisher’s Note: The statements, opinions and data contained in all publications are solely those of the individual author(s) and contributor(s) and not of MDPI and/or the editor(s). MDPI and/or the editor(s) disclaim responsibility for any injury to people or property resulting from any ideas, methods, instructions or products referred to in the content. |
© 2023 by the authors. Licensee MDPI, Basel, Switzerland. This article is an open access article distributed under the terms and conditions of the Creative Commons Attribution (CC BY) license (https://creativecommons.org/licenses/by/4.0/).
Share and Cite
Pinzón-Sandoval, E.H.; Balaguera-López, H.E.; Almanza-Merchán, P.J. Evaluation of SPAD Index for Estimating Nitrogen and Magnesium Contents in Three Blueberry Varieties (Vaccinium corymbosum L.) on the Andean Tropics. Horticulturae 2023, 9, 269. https://doi.org/10.3390/horticulturae9020269
Pinzón-Sandoval EH, Balaguera-López HE, Almanza-Merchán PJ. Evaluation of SPAD Index for Estimating Nitrogen and Magnesium Contents in Three Blueberry Varieties (Vaccinium corymbosum L.) on the Andean Tropics. Horticulturae. 2023; 9(2):269. https://doi.org/10.3390/horticulturae9020269
Chicago/Turabian StylePinzón-Sandoval, Elberth Hernando, Helber Enrique Balaguera-López, and Pedro José Almanza-Merchán. 2023. "Evaluation of SPAD Index for Estimating Nitrogen and Magnesium Contents in Three Blueberry Varieties (Vaccinium corymbosum L.) on the Andean Tropics" Horticulturae 9, no. 2: 269. https://doi.org/10.3390/horticulturae9020269