Article

Photosynthesis Characteristics of Tomato Plants and Its’ Responses to Microclimate in New Solar Greenhouse in North China

1
Beijing Key Laboratory of Urban Hydrological Cycle and Sponge City Technology, College of Water Sciences, Beijing Normal University, Beijing 100875, China
2
PowerChina Zhongnan Engineering Corporation Limited, Changsha 410014, China
*
Author to whom correspondence should be addressed.
Horticulturae 2023, 9(2), 197; https://doi.org/10.3390/horticulturae9020197
Submission received: 31 December 2022 / Revised: 30 January 2023 / Accepted: 1 February 2023 / Published: 3 February 2023

Abstract

:
With the increasing demand for vegetable fruits, vegetable plants are moved to protected structures for achieving high production and economic revenue, especially in undesirable seasons. In North China, tomato crops, as widely consumed vegetables, are now increasingly planted in solar greenhouses (GH), especially in the winter period. To improve the microclimate inside GH in winter, a sunken solar greenhouse was used recently. This study was to evaluate the photosynthetic characteristics of tomato plants and its responses to the inside microclimate in this new GH. In this experiment, the plant transpiration (E) and photosynthesis (Pn) rates of healthy and diseased plants were measured from July to December for three growth seasons in a commercial GH in North China. Results show both E and Pn were positively related to inside radiation and vapor pressure deficit. The stomata conductance to E (gsw) and Pn (gtc) performed relatively constant during daytime, and weakly related to inside microclimate. The parameters of E, Pn, gsw and gtc were greatly reduced for diseased plants in summer because of the heat shock. The water use efficiency at the leaf level, the ratio of Pn to E, was higher for solar radiation of 400–500 W m−2, temperature of 20–30 °C, relative humidity of higher than 80%, and vapor pressure deficit of less than 2.0 kPa. The results of this study could help farmers in the region of 30 to 40 degrees north latitude to enhance the growth of tomato crops in winter by using this sunken solar greenhouse.

1. Introduction

Tomato is a nutrient-rich fruit and is now widely planted in the world. Based on the data from FAO, tomato is the second most important vegetable crop next to potato. The total tomato area and production in 2021 were 5.17 × 10⁶ ha and 1.89 × 10⁸ ton, respectively, of which approximately 22% and 36% were from China (https://www.fao.org/faostat/en/#faq, accessed on 30 December 2022). The yield of tomato in China was 59 ton ha−1, and was 61% higher than the world mean (37 ton ha−1). Tomato is mainly produced in the northern hemisphere, for example China, USA and countries in Europe [1,2,3,4,5]. Due to the low temperature in winter in the north hemisphere, solar greenhouse (GH) as a simple and low-cost structure has been widely used for tomato, cucumber, pepper and other vegetable production [6,7,8]. Various studies have been reported to investigate the microclimate’s characteristics and their effects on plant growth, yield and evapotranspiration in GHs [9,10,11,12]. The results of these researches greatly improve the water and plant management for achieving a high quality and quantity of crop fruits in GHs.
Photosynthesis and transpiration are two important factors used to evaluate crops’ responses to microclimate change, chilling and heat shock, and water stress to optimize the growth environment and crop breeding [13,14,15,16]. Tomato crops are sensitive to water, radiation, and heat stress [17,18,19,20,21,22]. It was reported that air temperature higher than 38–40 °C greatly reduces the photosynthesis rate, stomatal conductance, plant growth, and fruit yield [15,17,18]. Using supplementary light did not influence the stomatal conductance and photosynthesis rate on the top canopy, whereas, improved these traits on the middle and low canopy, and finally enhanced tomato growth and yield production [16]. At high latitudes, increasing light intensity by using supplemental light greatly enhanced tomato production in greenhouse [5].
Microclimate in GHs has been greatly improved in winter [4,23,24]. Though the solar radiation in GHs is reduced by approximately 20–40% depending on the transmissivity of the cover materials [25,26], the days with a daily maximum inside temperature higher than 20 °C accounted for 80–90% of the days during the winter, compared to those outside [12]. As a result, fruit production in GHs was reported to be 180–200 ton ha−1 for cucumber crops [27], 26–46 ton ha−1 for pepper crops [28], and 60–70 ton ha−1 for tomato crops in the winter season [29].
In recent years, a newly developed solar greenhouse structure has been increasingly used in North China because of its’ high-temperature-improvement capacity [12,30]. Compared to the traditional solar greenhouse or plastic tunnel which are mostly not used in winter [31,32,33], the soil surface in this new type GH is approximately 1–2 lower than the soil surface outside (herein called sunken solar greenhouse, SSG), and the backwall is approximately 5–8 m width at bottom and 1–2 m in the top [12,34]. This structure greatly reduces the heat exchange between inside and outside, and finally results in a much higher inside temperature [12,34]. This climatic change could greatly influence plant transpiration and biochemical traits. Therefore, understanding the photosynthetic characteristics and its response to the improved microclimate in this new GH could help farmers to optimize the microclimate and finally produce high quality and quantity tomato fruits [35].
The objectives of this study were to investigate the characteristics of photosynthesis and evaporation rates at leave level from July to December in a commercial solar GH, analyze the relationship between photosynthesis and evaporation rates to inside microclimate, evaluate the water use efficiency, and finally recommend suitable microclimate range for tomato growth with high water use efficiency.

2. Materials and Methods

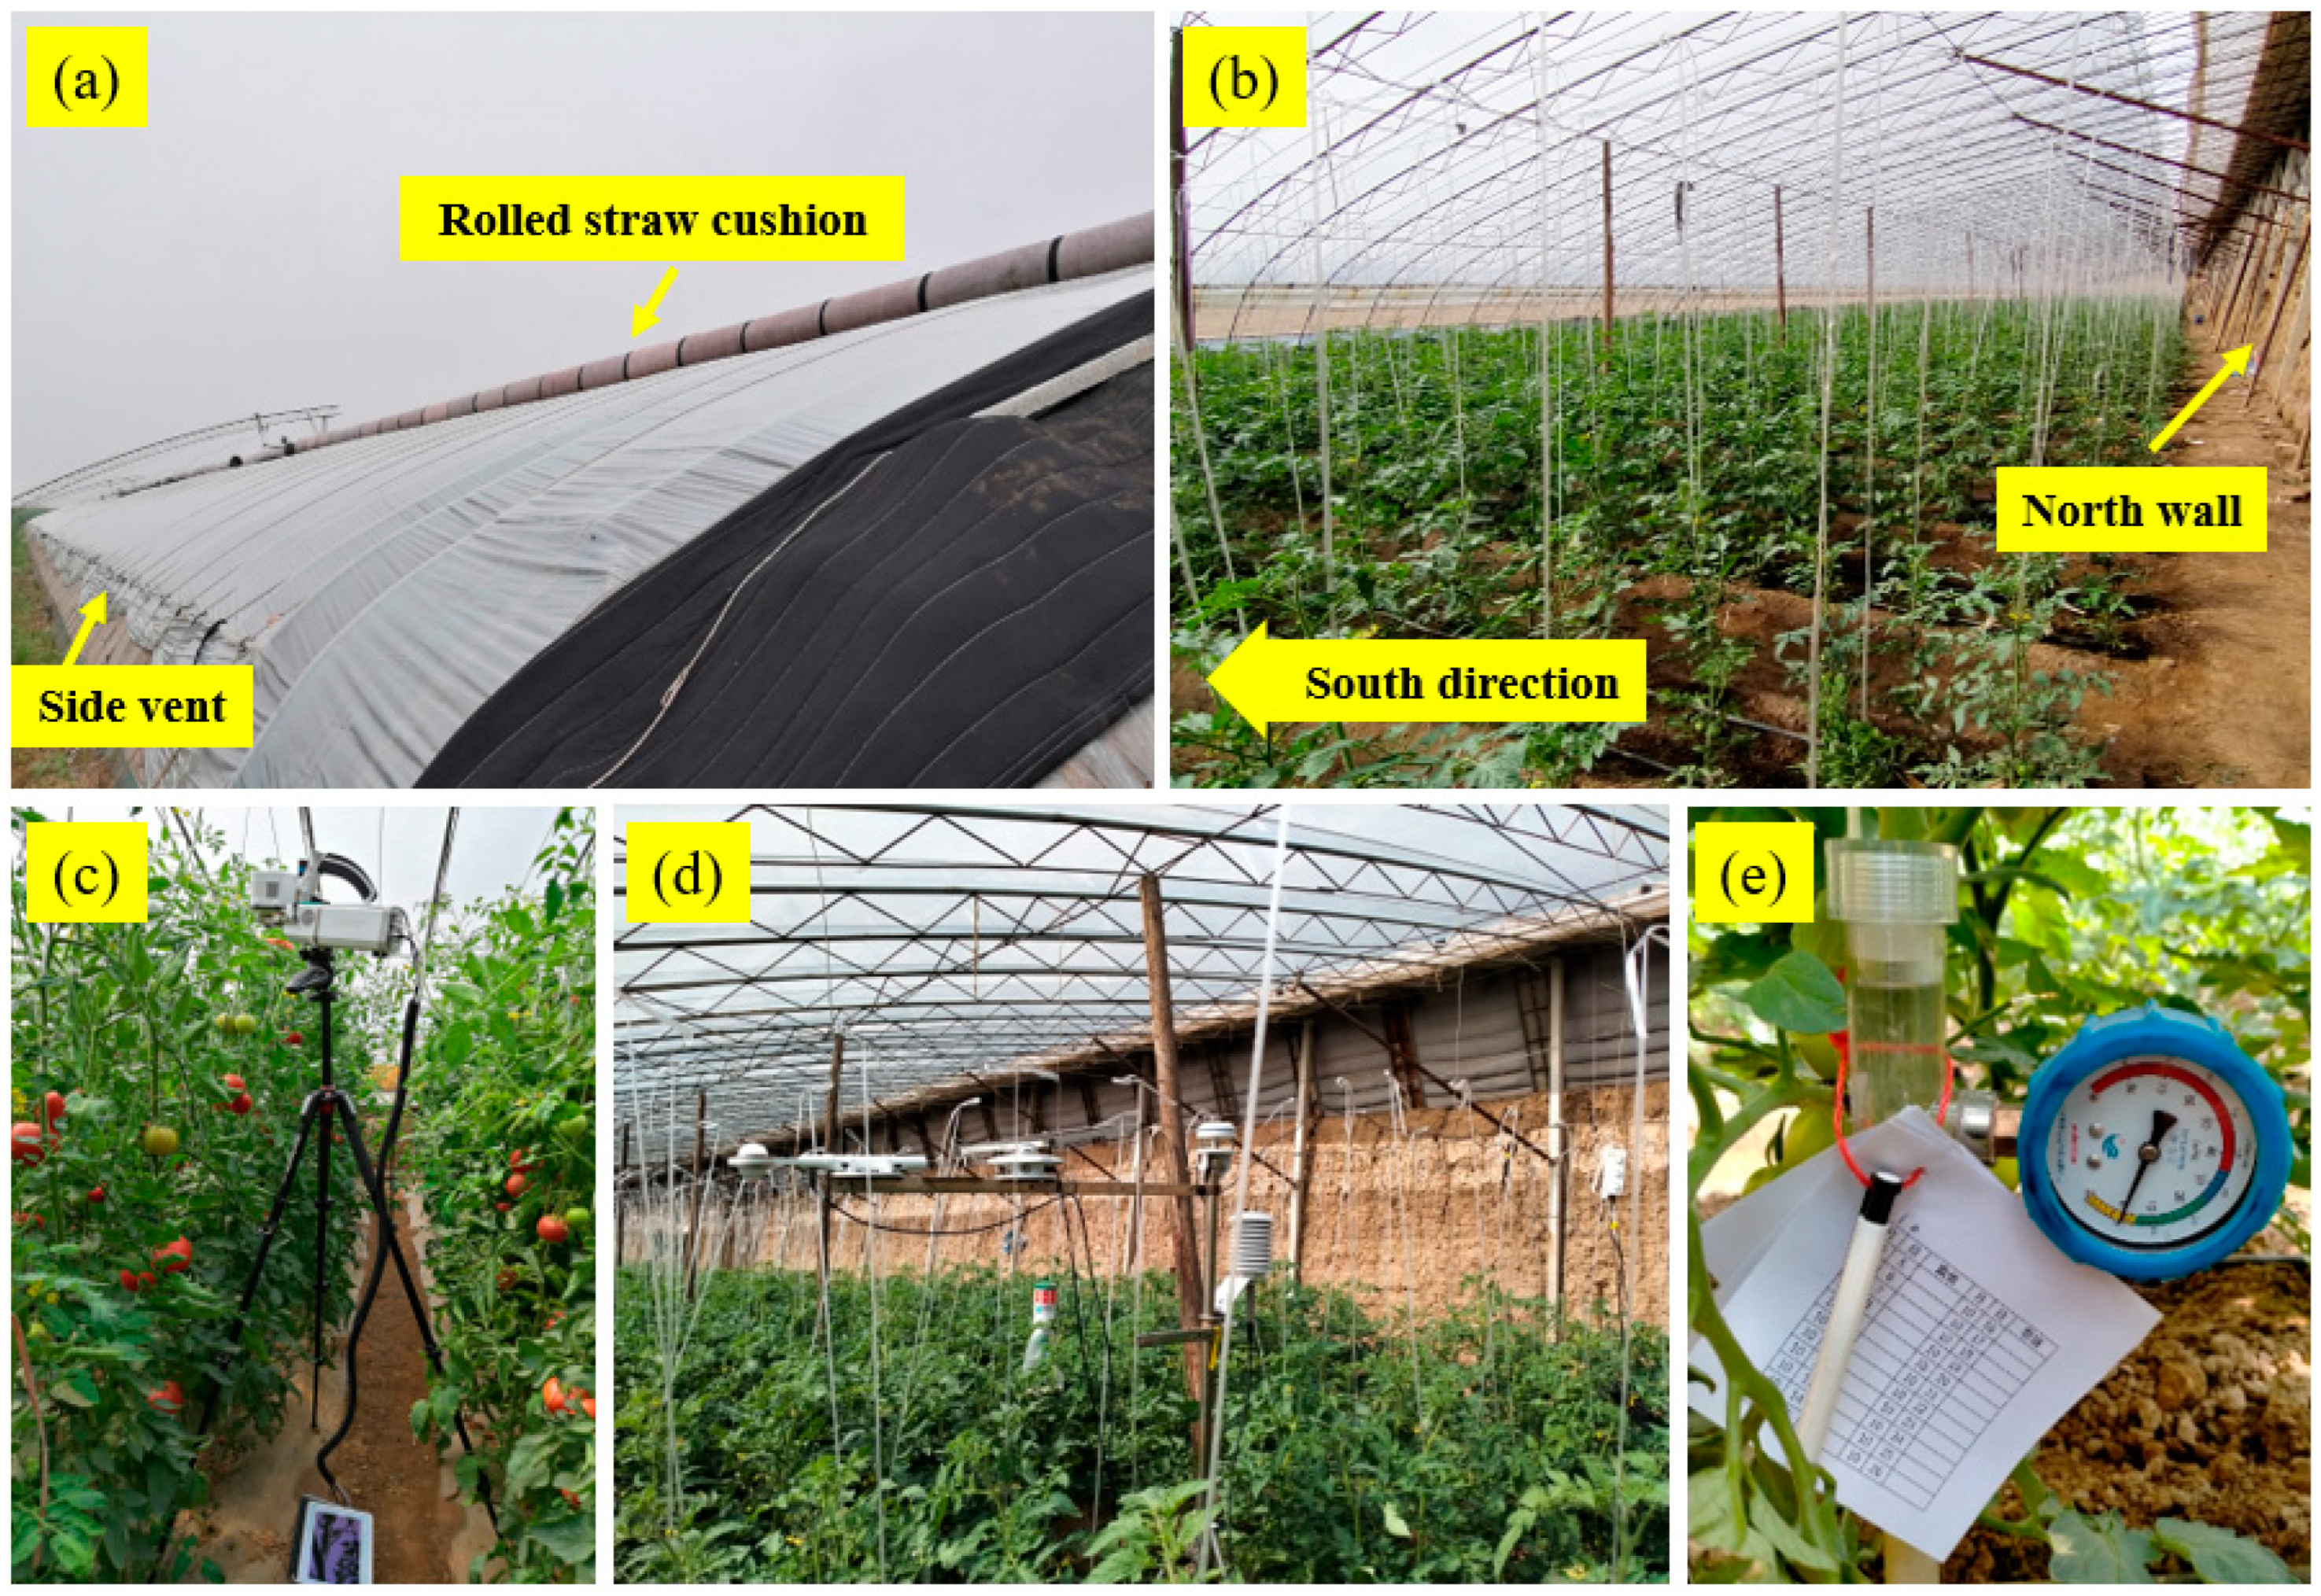
2.1. Greenhouse and Tomato Cultivation Description

The newly developed sunken solar greenhouse (Figure 1) in the experiment was located at Dacaozhuang National Breeding Experimental Station, Ningjin County, Hebei Province, China (37°30′6″ N, 114°57′22″ E, 26 m above sea level). The GH was 166 m long, 10 m wide, and covered an area of 1660 m2. The top and bottom of the north wall of the SSG were 1.2 m and 5.0 m respectively, thicker than a conventional solar greenhouse. The soil surface inside the SSG was 1 m lower than the outside. The GH was facing south and covered by a 0.1-mm-thick polyethylene. A line window was placed at the top near the north wall, which was manually opened for natural ventilation. In order to reduce heat loss in winter seasons, a roller straw curtain was installed on the roof of the GH, which covered the greenhouse from 17:00 to 9:00 the next day to reduce heat loss.
Tomatoes (Solanum lycopersicum L., variety Jinfenshuoguo) were planted in three growing seasons, including summer (May–August) and autumn-winter (September–January) seasons in 2019 and autumn-winter season (September–January) in 2020, which were abbreviated as 2019SU, 2019AW and 2020AW respectively. Tomato seedlings with four true leaves were transplanted to the ridges, each ridge planted in double rows. Planting patterns were as follows: the length, width, and height of the ridges were 9, 1 and 0.15–0.20 m, respectively; the distance between ridges was 0.4 m; the spacing between double rows was 0.5 m; and the tomato plant spacing was 0.4 m. Tomato plants were routinely managed by local farmers after transplantation. The stems above the fifth branch were trimmed when the fifth branch fruits were flowering to enhance ventilation and reduce nutrient absorption. Besides, the lower leaves of the stem were pruned at the later stages of the growing season.
Fertilizers included base and topdressing fertilization, and both were compound fertilizers. The base fertilizer was scattered manually before ridging, and topdressing fertilizer was soluble and applied through the drip fertigation system. The ratio of N, P2O5, and K2O fertilizer was 1:1:1 in each growing season. The total amount of each fertilizer was 103, 205, and 262 kg ha−1 in the 2019SU, 2019AW and 2020AW seasons, respectively.
A drip irrigation system was arranged in the SSG for irrigation in this experiment. Drip tapes were parallel to the tomato plant rows, and one tape corresponded to one row. The specific parameters of the drip tape (Hebei Runtian Water-Saving Equipment Co., Ltd., Shijiazhuang, China) were: the diameter of 16 mm, 2.5 L h−1 under working pressure of 0.1 MPa, dripper spacing of 40 cm. Dial-type tensiometers (Beijing Waterstar Tech Co., Ltd., Beijing, China) were installed at a depth of 20 cm below the drippers to guide irrigation. Irrigation began when the soil matrix potential (SMP) reached −35 kPa.

2.2. Plant Growth and Yield Measurement

Three plants were selected at the first measurement for height and leaf area and then used for the following measurement during the whole growth season. This arrangement made the data show the continuous development of the leaf area and plant height. Plant height and leaf area were measured at one-month intervals. Leaf area was determined by measuring the maximum length and width of each large stalk leaf and calculated by in situ fitting equation LA = 0.37L × W, where LA is the area of a leaf (cm2), L and W are leave’s length and width, respectively (cm). The total leaf area of a plant (LATotal) is the sum of each leave. Leaf area index (LAI) was calculated using the mean leaf area per plant and the corresponding soil surface (S, in cm2) covered by a plant using equation of LAI = LAtotal/S.
Fresh tomato amount was the whole tomato fruit production in the SSG and was recorded each sale by the farmer, and then converted to yield in a hectare. The seasonal yield was the sum of all sales in a season.

2.3. Photosynthesis Characteristics Measurement

Photosynthetic parameters, including transpiration rate (E), assimilation rate (Pn), conductance to transpiration (gsw) and CO2 assimilation (gtc), and the photosynthetic photon flux density (PPFD) in the environment and reaching to leaf surface were measured using the LI-6800 portable photosynthesis system (LI-COR Biosciences, Lincoln, NE, USA). The measurement periods were July and August in the 2019SU, December in the 2019AW and October, November and December in the 2020AW, depending on the availability of the LI-6800 system (Figure 1c). Two to four days were chosen for each month. Hourly measurements were taken from 8:00 to 18:00 in summer and from 8:00 to 17:00 in winter. The shorter measurement period in winter was due to the fact that it must be covered with a straw curtain about an hour before sunset to reduce heat loss in the greenhouse. Three full-growth leaves on the top canopy from three representative plants were selected as samples for photosynthetic measurements, and their average was taken for data analysis. During measurement, the CO2 concentration was controlled at 400 μmol mol−1, and other microclimate factors of radiation, air temperature and relative humidity were the same to the greenhouse environment. The water use efficiency at the leaf level was computed using the following equation:
WUE L = Pn E
where WUEL is the water use efficiency at leave level, (µmol m−2 s−1)/(mmol m−2 s−1); Pn is the photosynthesis rate, µmol m−2 s−1; and E is the transpiration rate, mmol m−2 s−1.

2.4. Microclimate Measurement

The inside microclimates were measured by a meteorological station (Figure 1d), which was deployed at a height of 2 m in the center of the greenhouse. Variables for the three growth periods included total solar radiation (Rs), air temperature (T), relative humidity (RH), and wind speed (u). The sensors shown below operated simultaneously: radiometer (Model TBQ-2, Jinzhou Sunshine Technology Co., Ltd., Jinzhou, China), temperature and relative humidity recorder (Model VP-4, METER Group, Inc., Pullman, WA, USA), and air velocity meter (two-dimensional ultrasonic anemometer ATMOS 22, METER Group, Inc., Pullman, WA, USA). In addition, the meteorological data obtained from the experimental station were used to represent the meteorological parameters outside the greenhouse. All measurements were sampled at 30 s intervals and were stored in 30 min averages by the data loggers. The vapor pressure deficit was calculated using the air temperature and relative humidity as followings:
VPD = 0.6108 exp [ 17.27 × T T + 237.3 ] ( RH 100 )
where VPD is the vapor pressure deficit, kPa; exp[…] is the base of the natural logarithm (2.7183) raised to the power […]; T is air temperature, °C; and RH is relative humidity, %.

2.5. Data Treatment and Figure Preparation

Microsoft EXCEL was applied to statistics and analysis of experimental data. ORIGIN2023 (OriginLab Corporation, Northampton, MA, USA) was used to perform the correlation analysis of the data and to plot all figures.

3. Results

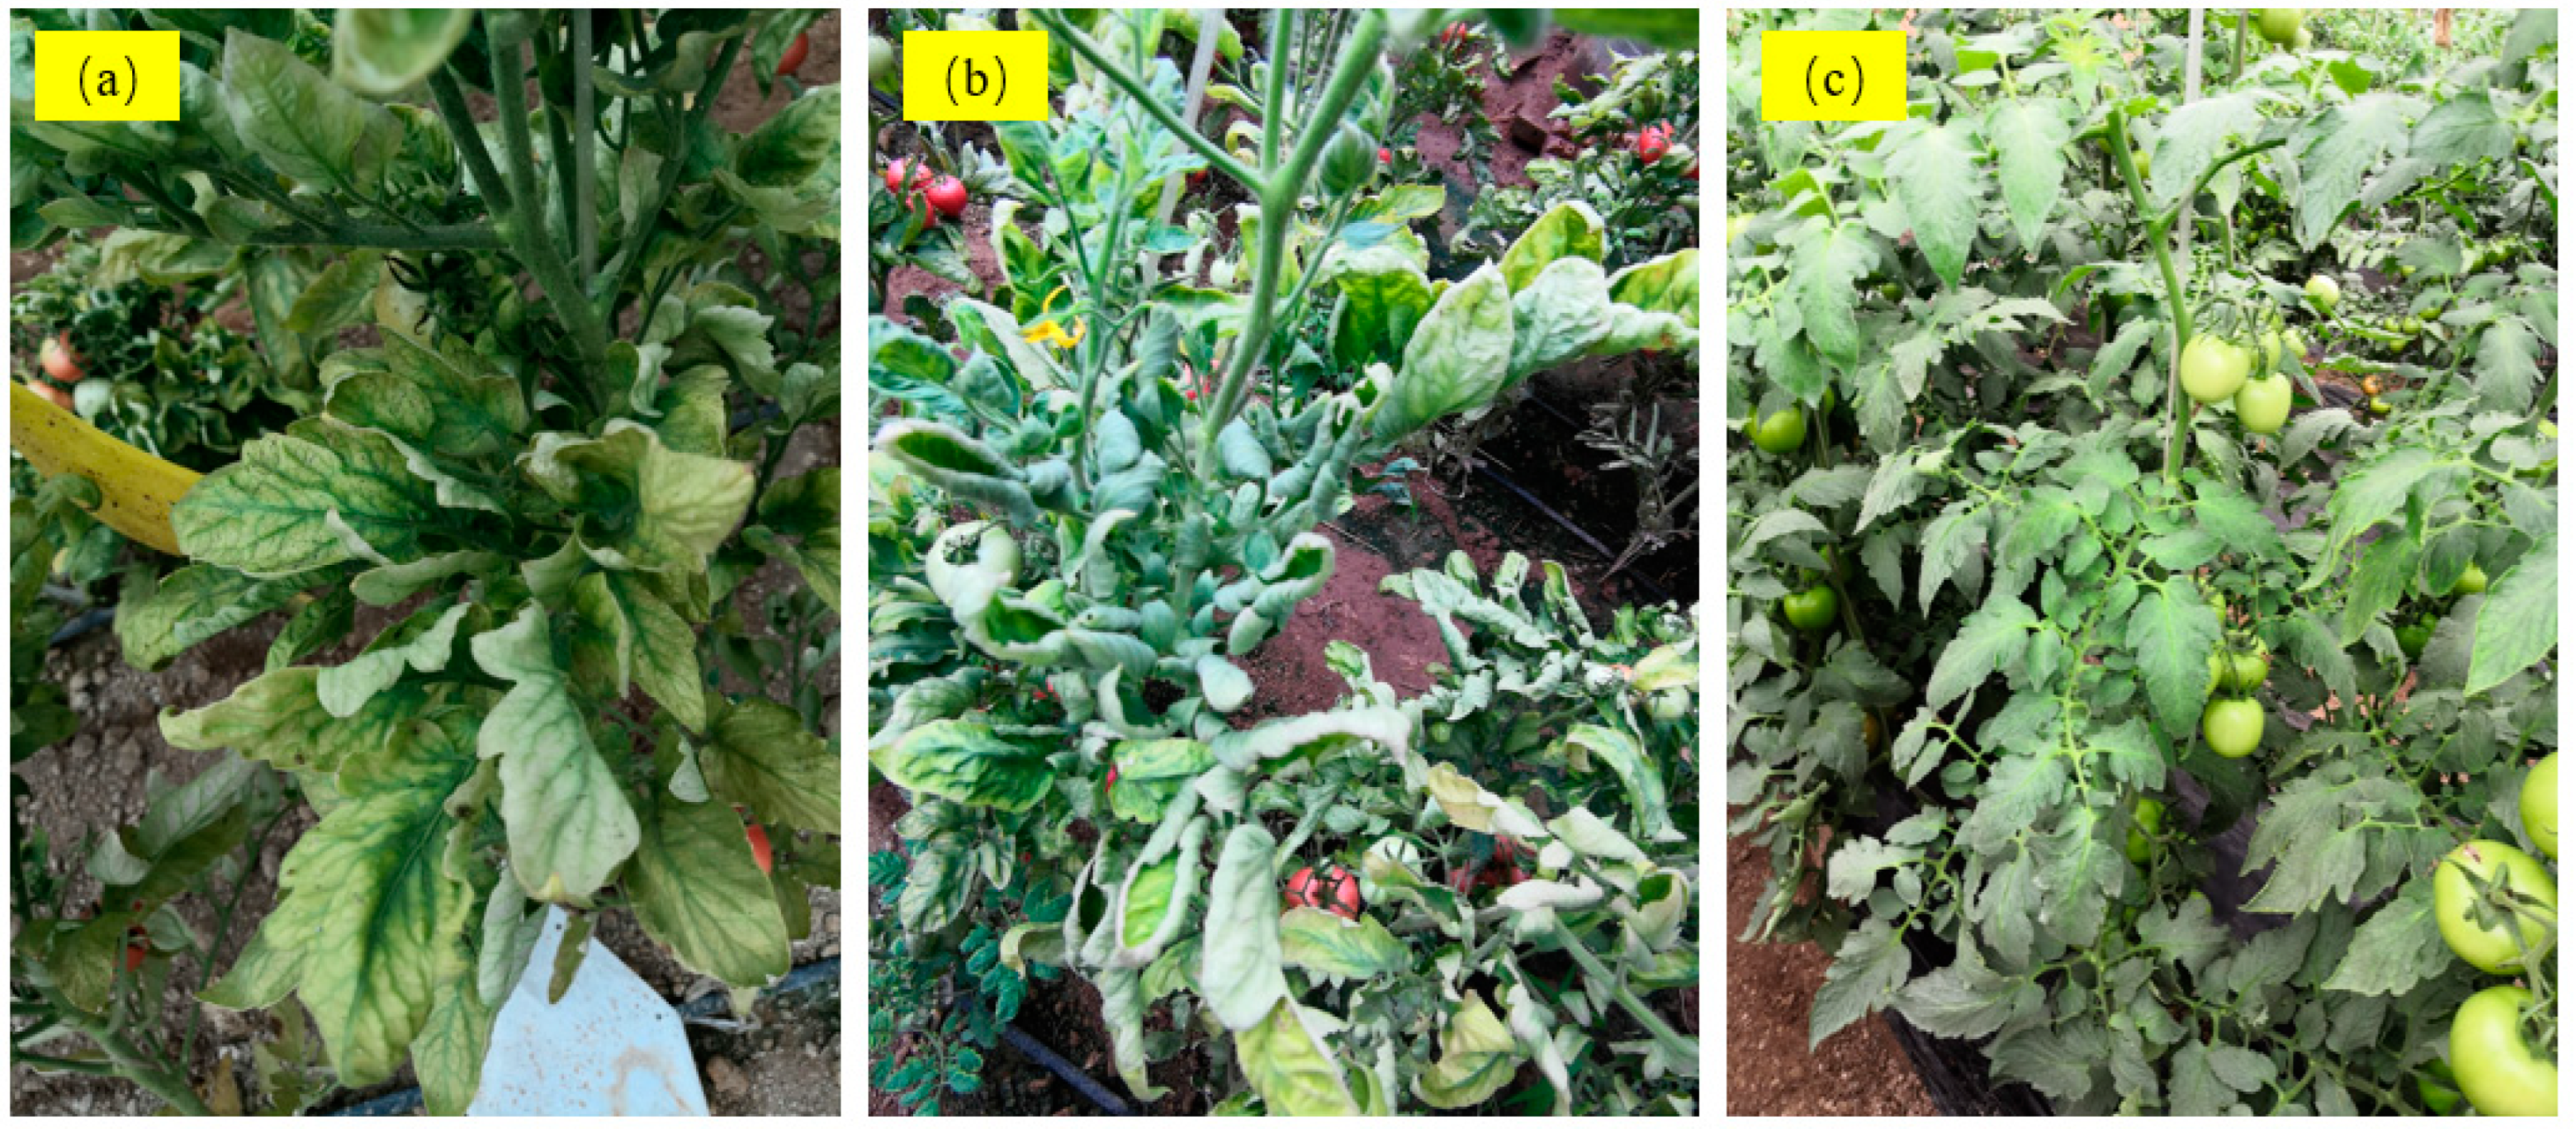
3.1. Tomato Growth and Yield

Leaf area index, height and yield of tomato plants in three growing seasons were summarized in Table 1. In the 2019SU season, the LAI of tomato plants ranged from 1.34 to 2.64, and the plant height varied from 0.94 m to 1.85 m. Both parameters were close to that in the two winter seasons. However, the seasonal yield was 10.8 ton ha−1 in the 2019SU, and was the least in the three seasons. This is due to the extremely high temperatures inside the GH in August 2019 summer season, during which the average daily maximum temperature was 38.9 °C. This high-temperature shock caused curled leaves in all plants (Figure 2), which consequently reduced fruit yield. The highest LAI during the middle stage was 2.75 in the 2020AW, and 19% and 41% higher than those in the 2019SU and 2019AW, respectively (Table 1). Therefore, the excellent tomato growth in the 2020AW resulted in the highest yields of 83.6 ton ha−1, which was 67.4% and 48.5% higher than those in the 2019SU and 2020AW growing seasons.

3.2. Microclimate Changes in the Greenhouse

The seasonal curves of radiation, temperature, relative humidity, vapor pressure deficit and wind speed inside and outside the GH in the three seasons are shown in Suppl. Figure S1, and seasonal means were summarized in Table 2. In general, the microclimate difference inside and outside the GH was remarkable, especially in winter. Inside radiation in the three seasons was 30–44% lower than those outside, indicating an average of 0.56–0.70 for the transmissivity of the cover material. Wind speed in the GH ranged from 0.07 to 0.53 m s−1, and was 12–28% of the outside, indicating a 70–90% reduction in the three seasons. Air temperature and relative humidity inside GH in the summer season were close to that outside, and finally resulted in similar VPD inside and outside. While in winter (2019AW and 2020AW), the daily mean air temperature varied from 8.13 to 24.95 °C inside, and averaged 9.54 °C higher than the outside. As well, the relative humidity was 11–16% higher inside the greenhouse than that outside. Both higher temperature and relative humidity finally resulted in 0.13–0.19 kPa and 34–50% higher VPD than those outside.

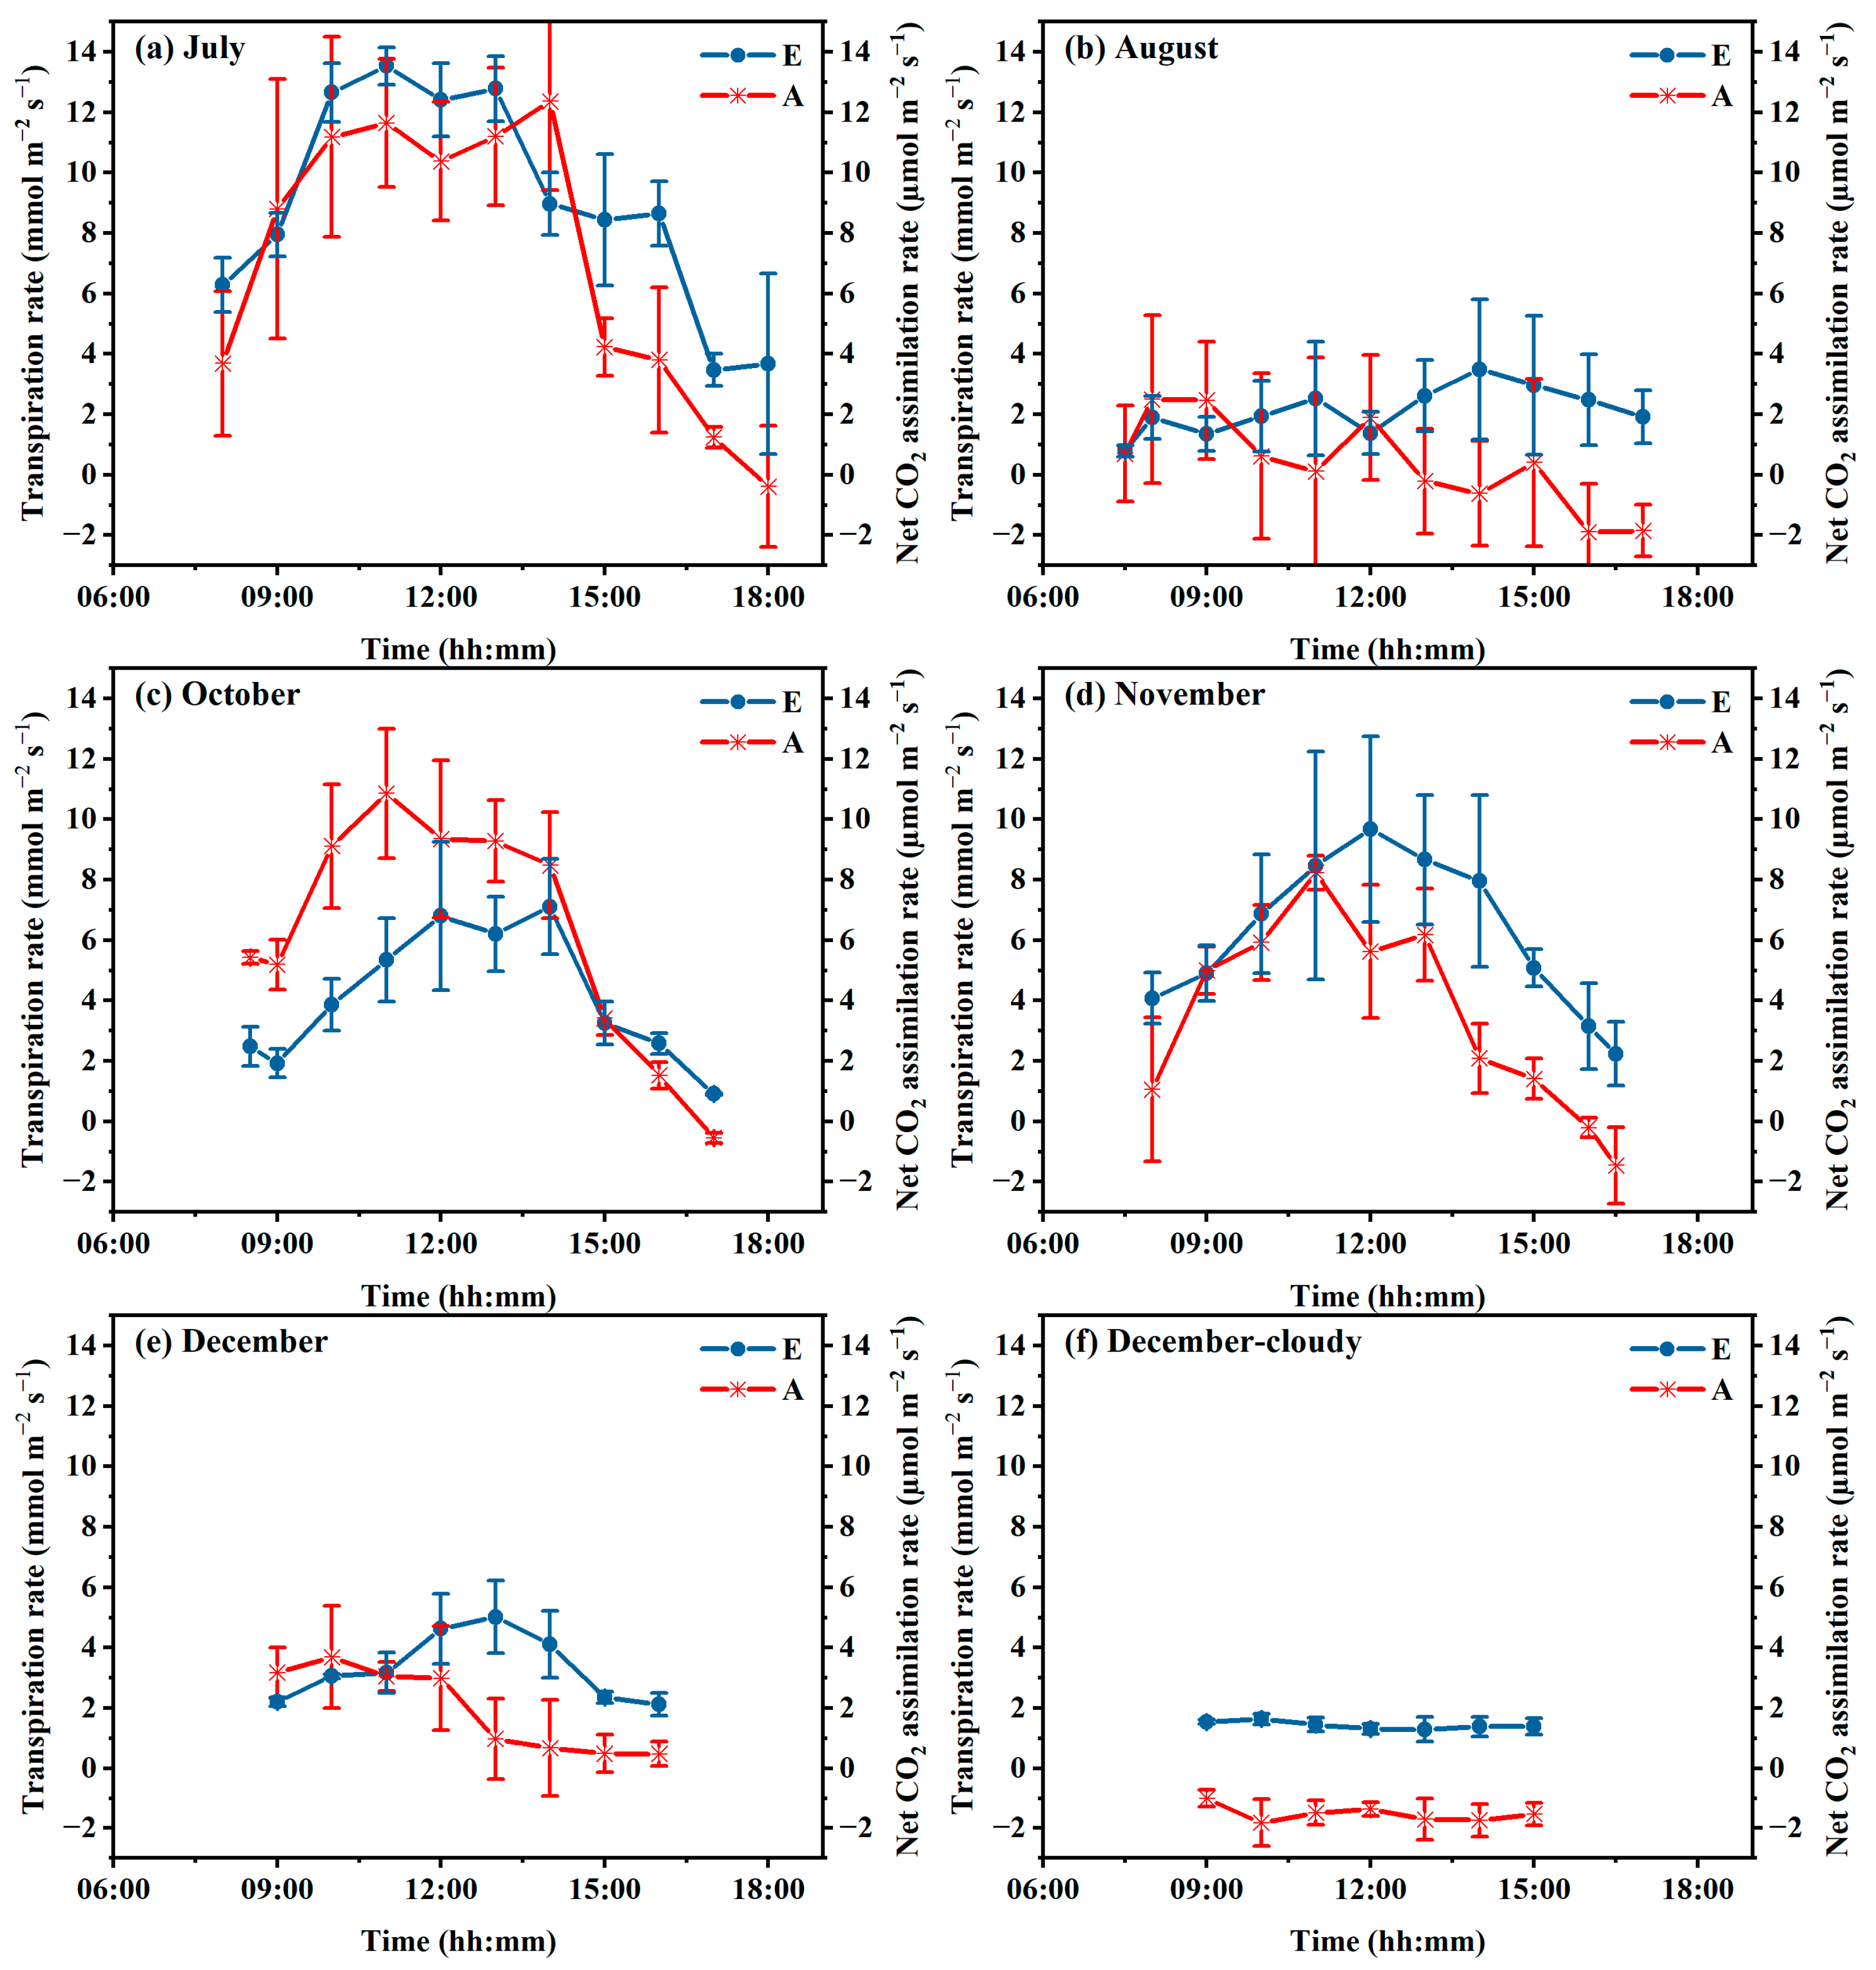
3.3. Photosynthesis Characteristic Changes

Figure 3 illustrates the daily courses of transpiration rate in different periods from July to December. It can be found there are great differences in transpiration rates in different period. The highest transpiration rate for healthy plants on sunny days was found in July with daily means of 11.4 µmol m−2 s−1, then in October (9.0 µmol m−2 s−1) and December (6.7 µmol m−2 s−1), and the least of 0.8–1.5 µmol m−2 s−1 was found in December. While in cloudy days in December, the transpiration rate was measured from 0.18 to 0.4 µmol m−2 s−1 with mean of 0.3 µmol m−2 s−1. This shows a great decline trend of E rate from July to December. As well, the E on sunny days was much higher than those on cloudy days. For diseased plants in August, the transpiration rate was 12% of that for healthy plants in July when inside microclimates are close, indicating approximately 90% E reduction.
Similar to the trend of daily values of transpiration, the photosynthesis rate for healthy plants on sunny days was the highest in July with a daily mean value of 11.3 µmol m−2 s−1, followed in October (9.0 µmol m−2 s−1) and November (6.7 µmol m−2 s−1), and the least was 1.3–4.4 µmol m−2 s−1 found in December. On a cloudy day in December, the Pn rate was averaged −1.6 µmol m−2 s−1, indicating great reduction of assimilated CO2 products. For diseased plants in August, the Pn rate (0.4 µmol m−2 s−1) was 3% of that for healthy plants under similar microclimate conditions. This low Pn resulted in less CO2 product accumulation and finally low tomato yield.
In sunny days for healthy plants, the E and Pn rates showed a clear curve during daytime (Figure 3a,c,d,e). Generally, both E and Pn rates were low in morning, then increased quickly and reached the maximum in middle day, after that decreased gradually. However for diseased plants and on cloudy days, there were no clear trends for both E and Pn rates, and both were much lower than those of healthy plants during daytime (Figure 3b,e).

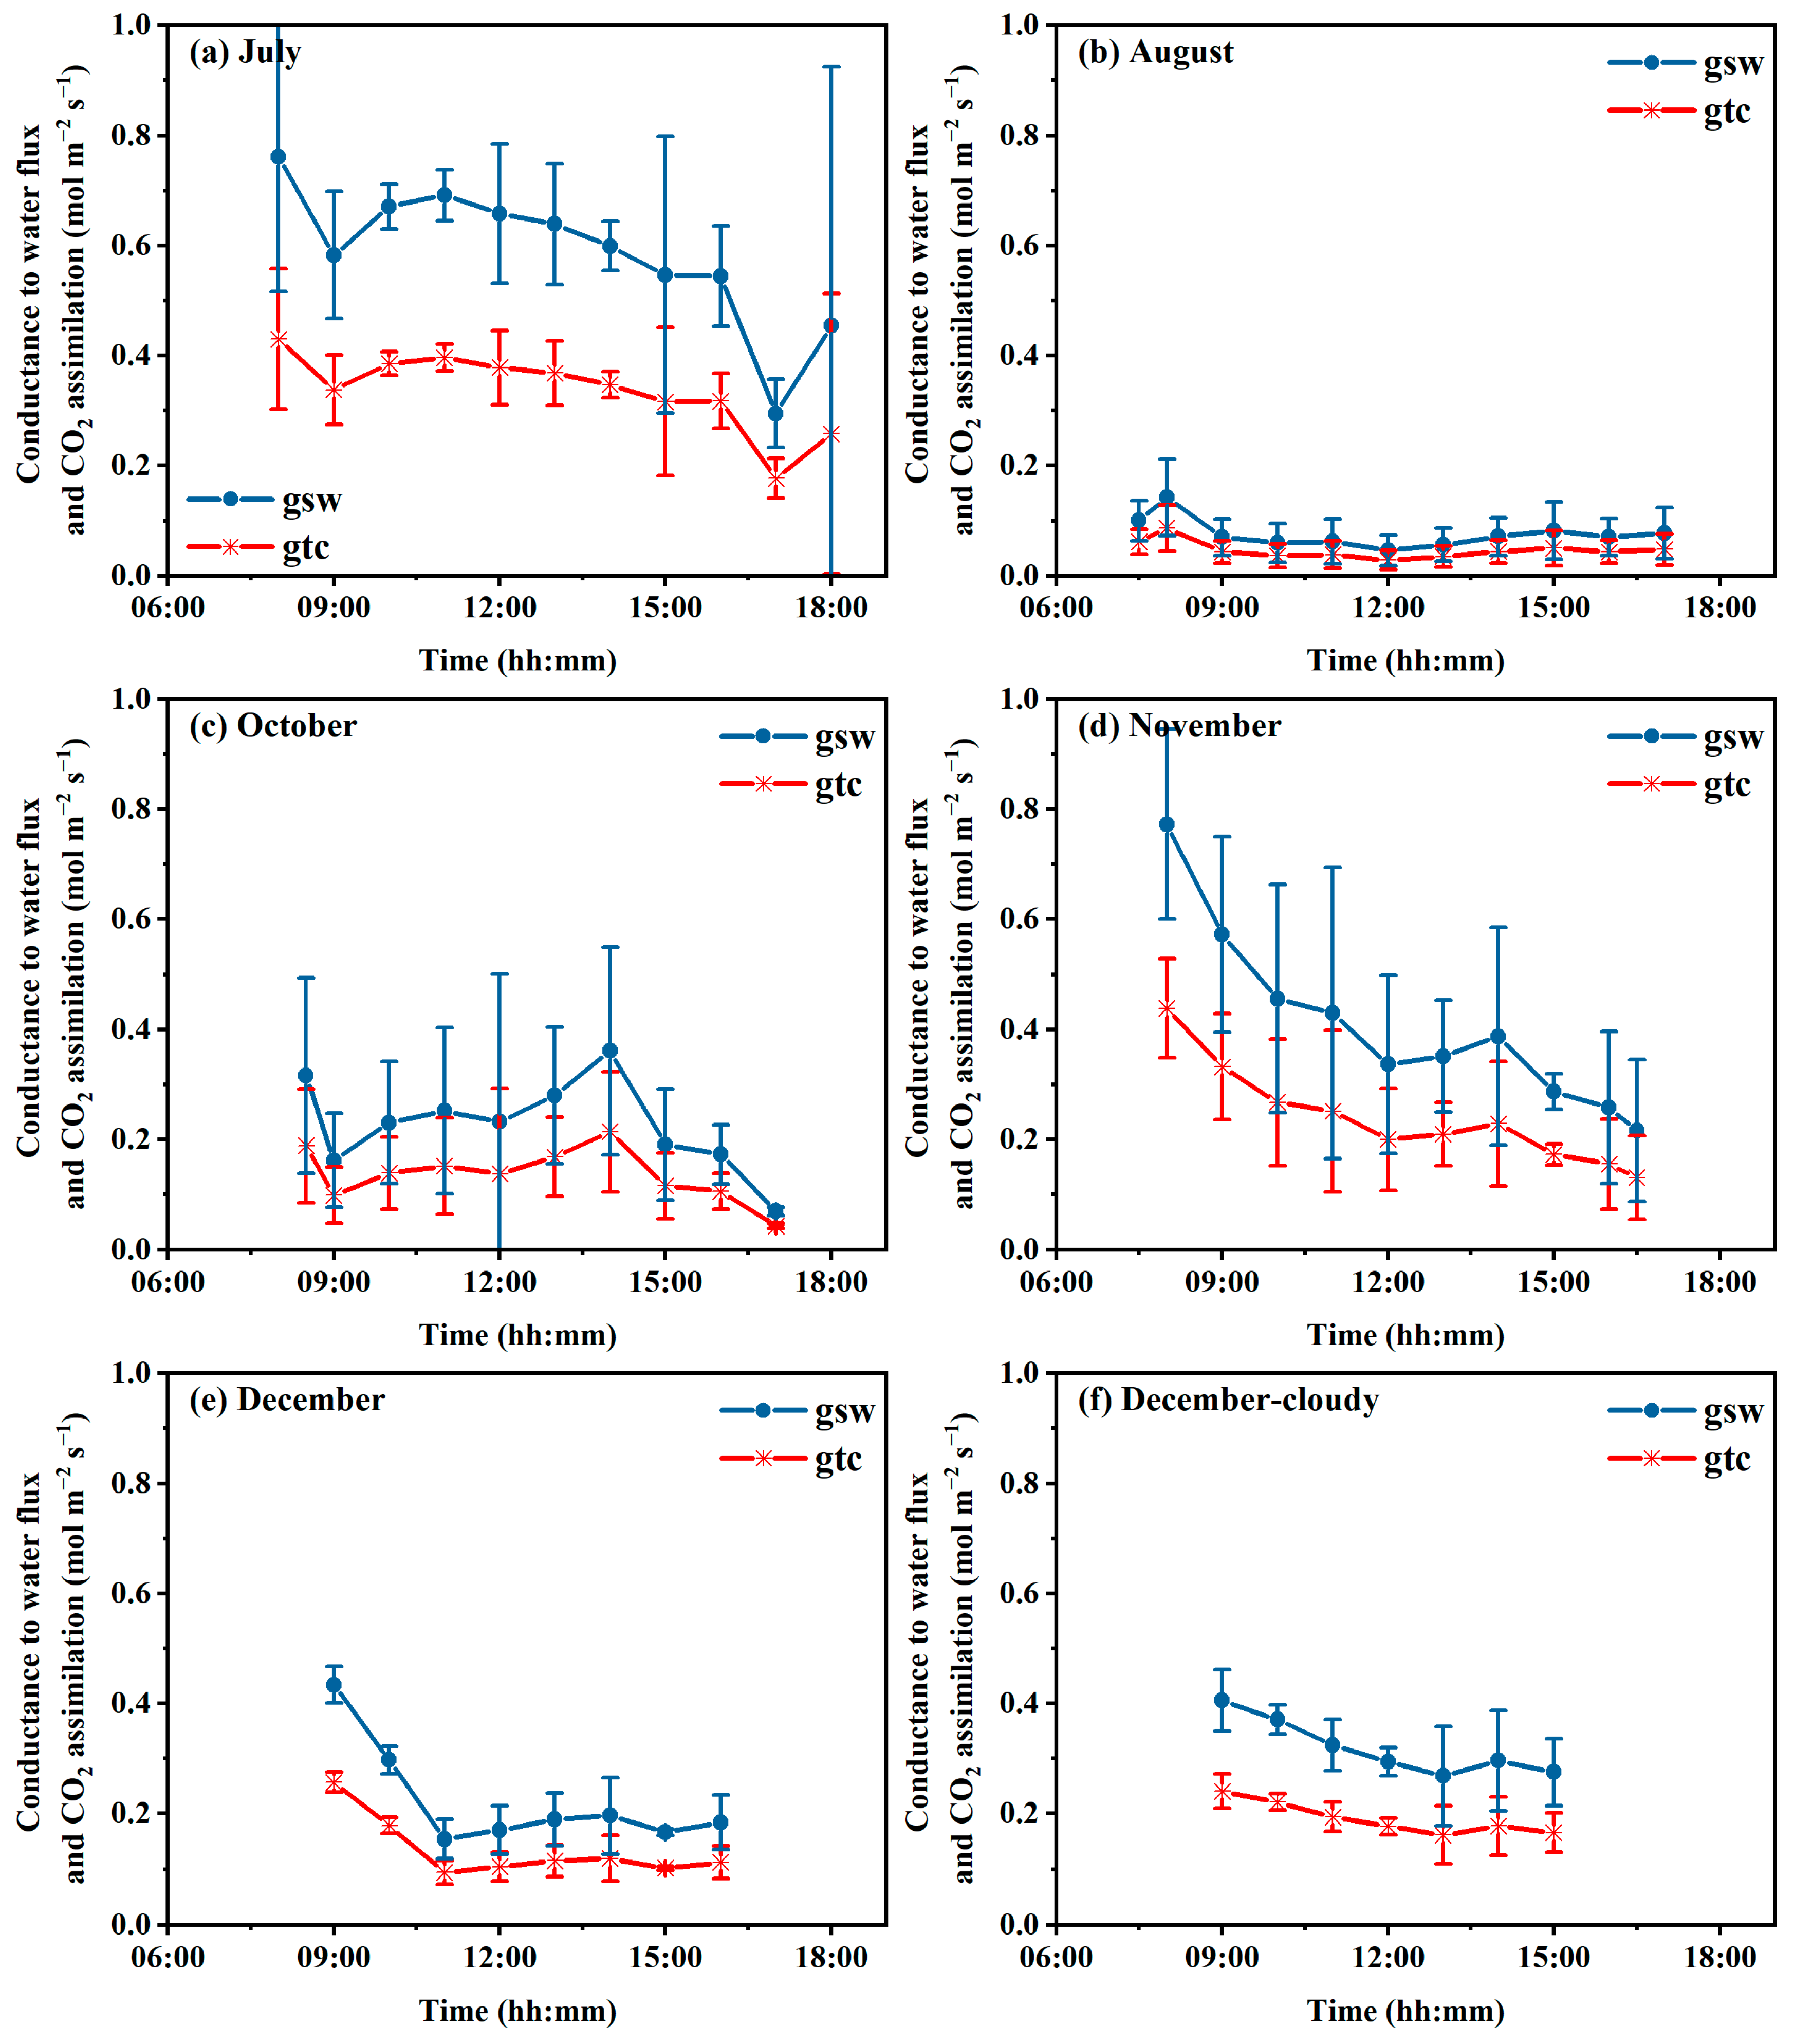
3.4. Conductance to Transpiration (gsw) and Photosynthesis (gtc)

The daily courses of stomatal conductance for E and Pn from July to December are illustrated in Figure 4. The stomatal conductance for E (gsw) is linearly related to the conductance to Pn (gtc). Therefore, both shows a similar trend in daytime in each period. Generally, both gsw and gtc were higher in the morning, then decreased slightly. However, there was no significant trend for gsw and gtc during the daytime.
Both gsw and gtc varied greatly with seasons and plant conditions. The highest gsw and gtc were found in July, then in October and November, and the smallest in December. Diseased plants in August showed the least gsw and gtc, and were approximately 10% of that for healthy plants under similar climatic conditions (Figure 4a,b). On a cloudy day in December, the gsw and gtc values were close to that on sunny days for healthy plants.

4. Discussion

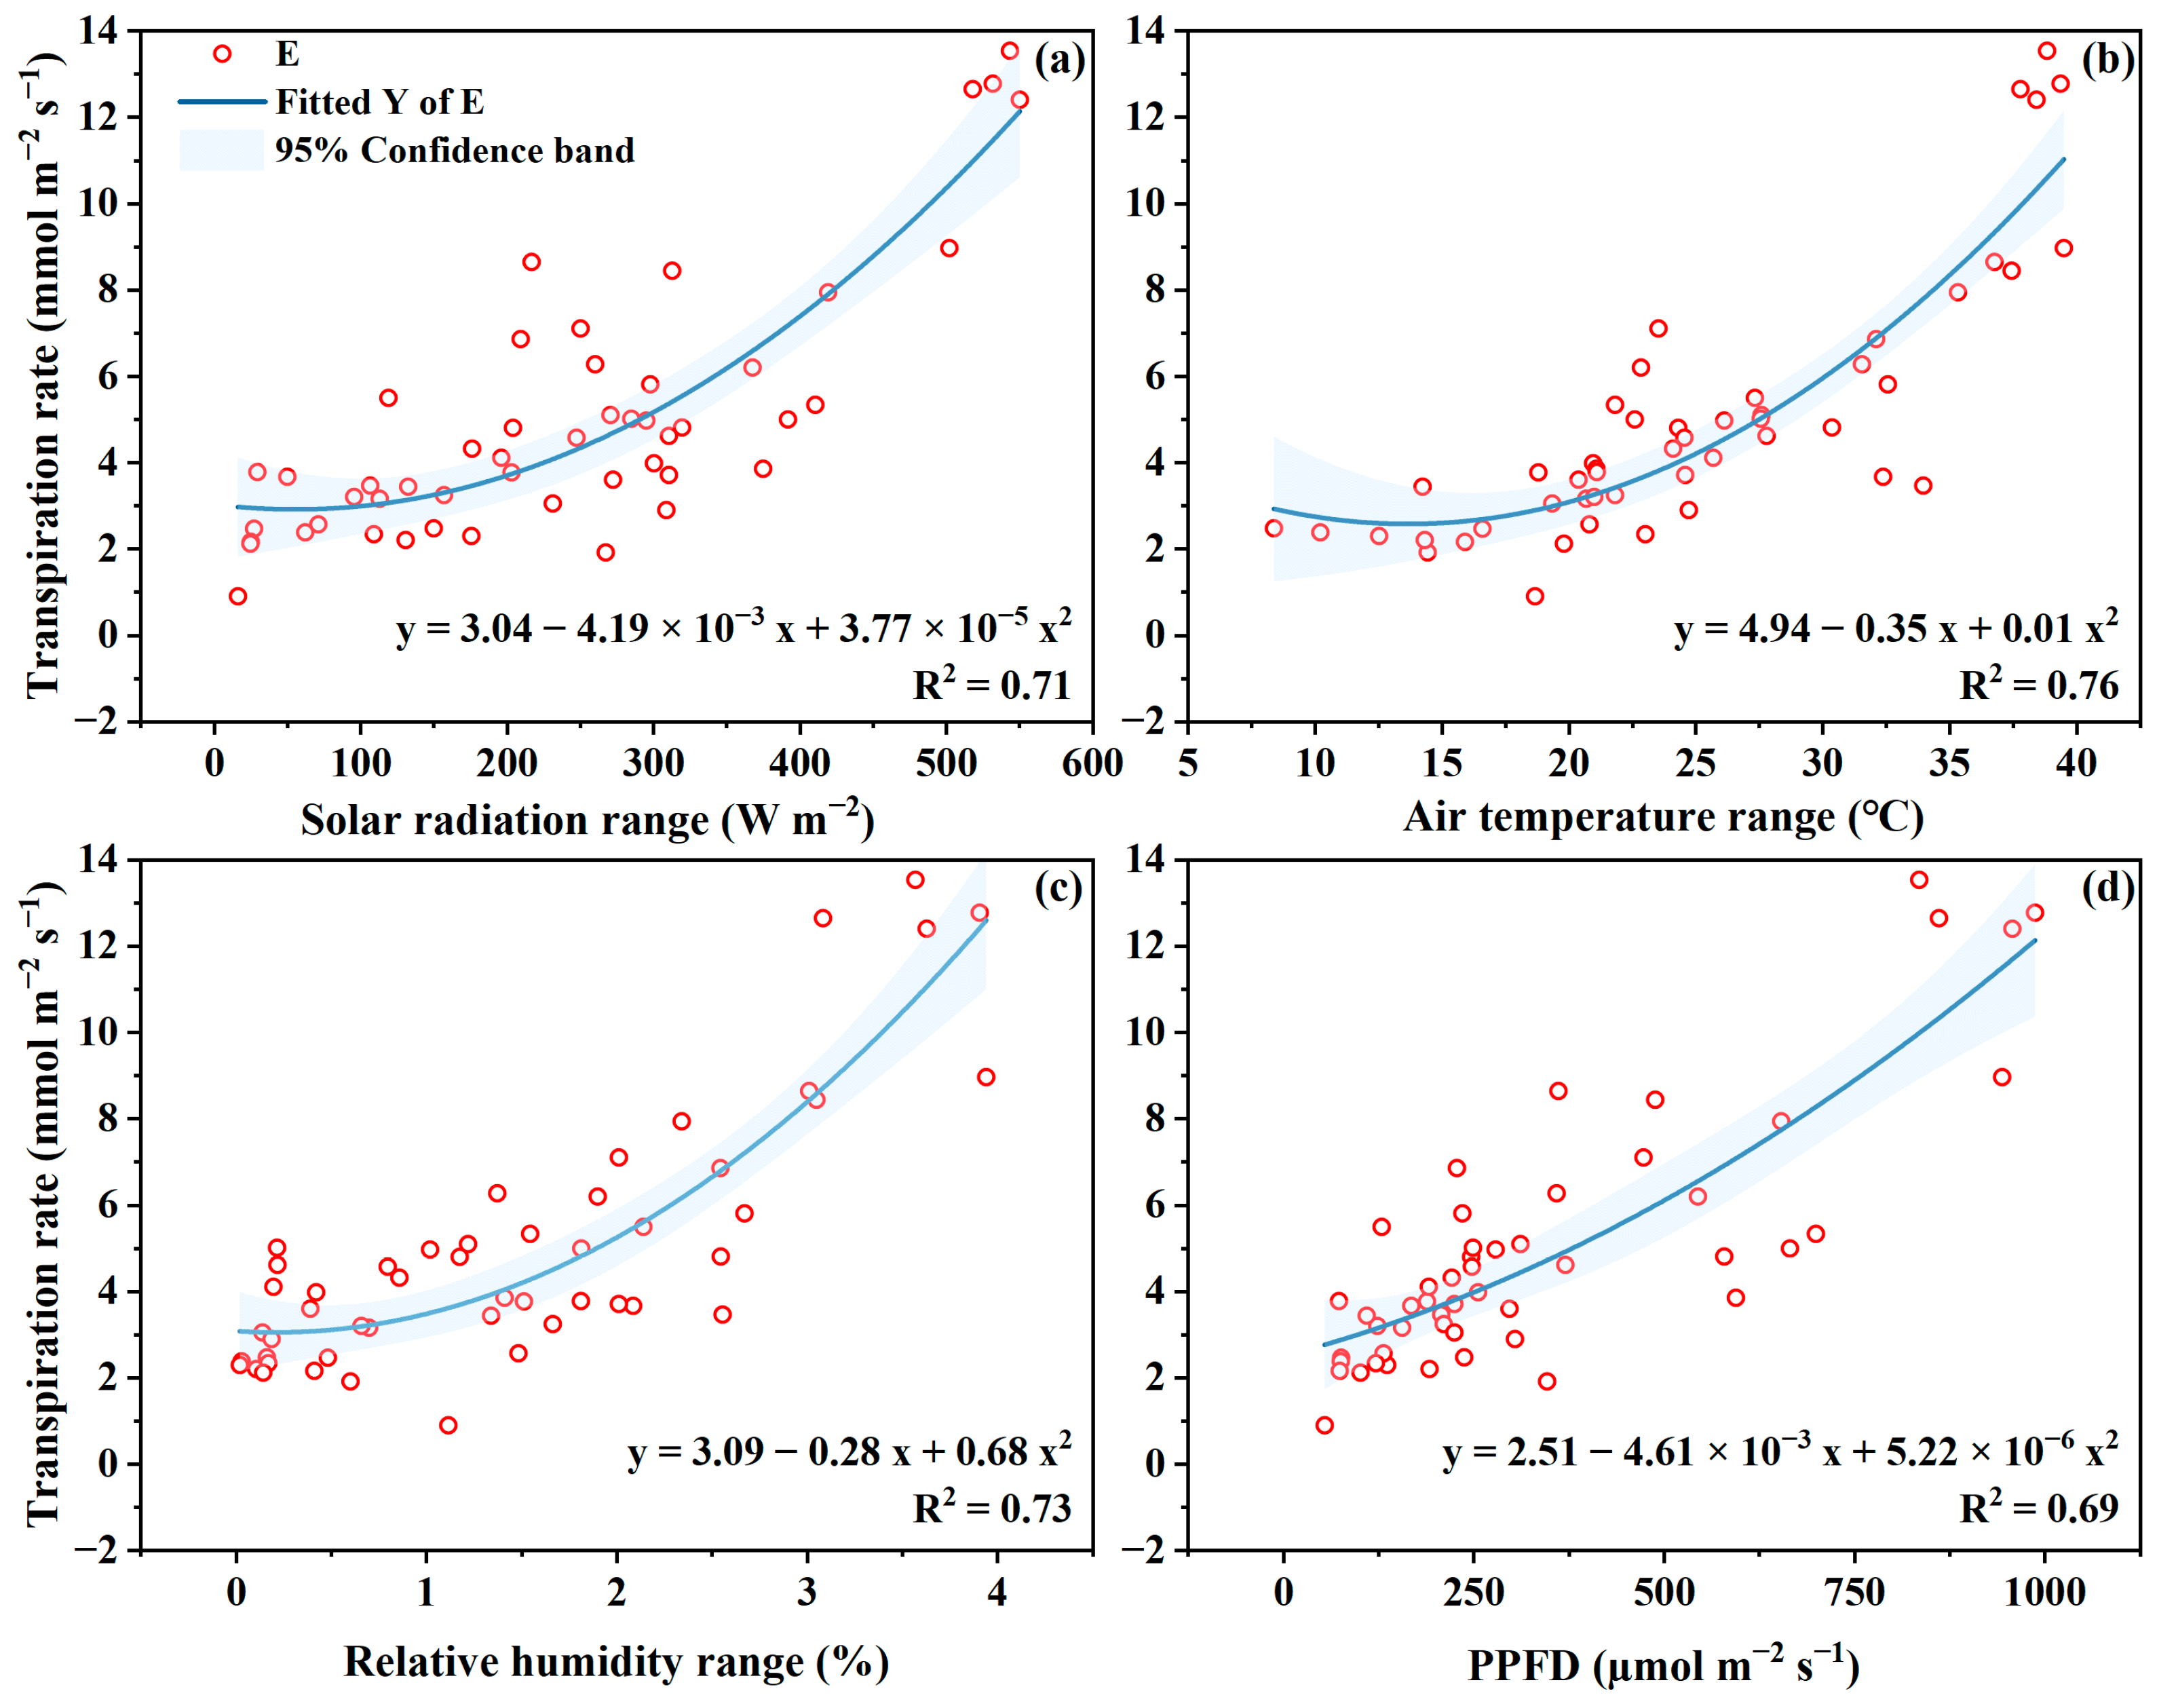
4.1. Transpiration Rate to Microclimate

Tomato crops’ transpiration is sensitive to soil water and microclimate conditions [36,37,38,39]. In this study, the plants were drip irrigated and soil water matric potential was higher than −35 kPa, indicating no-water-stress status based on results in the literature [40,41]. They reported the soil matric potential threshold of −35~−40 kPa can be used to make irrigation scheduling of tomato plants. Therefore, the microclimate could be the driving force for the tomato plants’ transpiration.
In this study, the instantaneously measured E at the leaf level was positively related to radiation, air temperature, VPD, and the light intensity on leaf surface (Figure 5). The E rate at leaf level to radiation, temperature, VPD, and light intensity can be better fitted using polynomial expressions with determination coefficient R2 of 0.69–0.75. These regression expressions show that leaf E was greatly influenced by the four microclimate variables. Considering the small wind speed in GH (0.1–0.3 m s−1) (Suppl. Figure S1e), leaf E was not significantly related to inside wind speed. The findings regarding the E and microclimate in this study are in agreement with the reports in the literatures [34,42,43,44,45]. Because of the closed environment in greenhouse, plant transpiration is decoupled to the environment [30,34,46]. In this case, transpiration is more closely related to inside incoming energy, i.e., the solar radiation. For example, Yang, Liu, Cohen, and Gao [34] measured the plant transpiration of tomato using the sap flow method and found plant transpiration was first linearly related to solar radiation in GH, followed by VPD, and temperature. Similar results are reported in greenhouse crops [47,48]. In a greenhouse in Israel, Liu, Cohen, Hugo, Yair and Josef [46] also reported that the banana sap flow was linearly related to radiation, temperature and vapor pressure deficit.

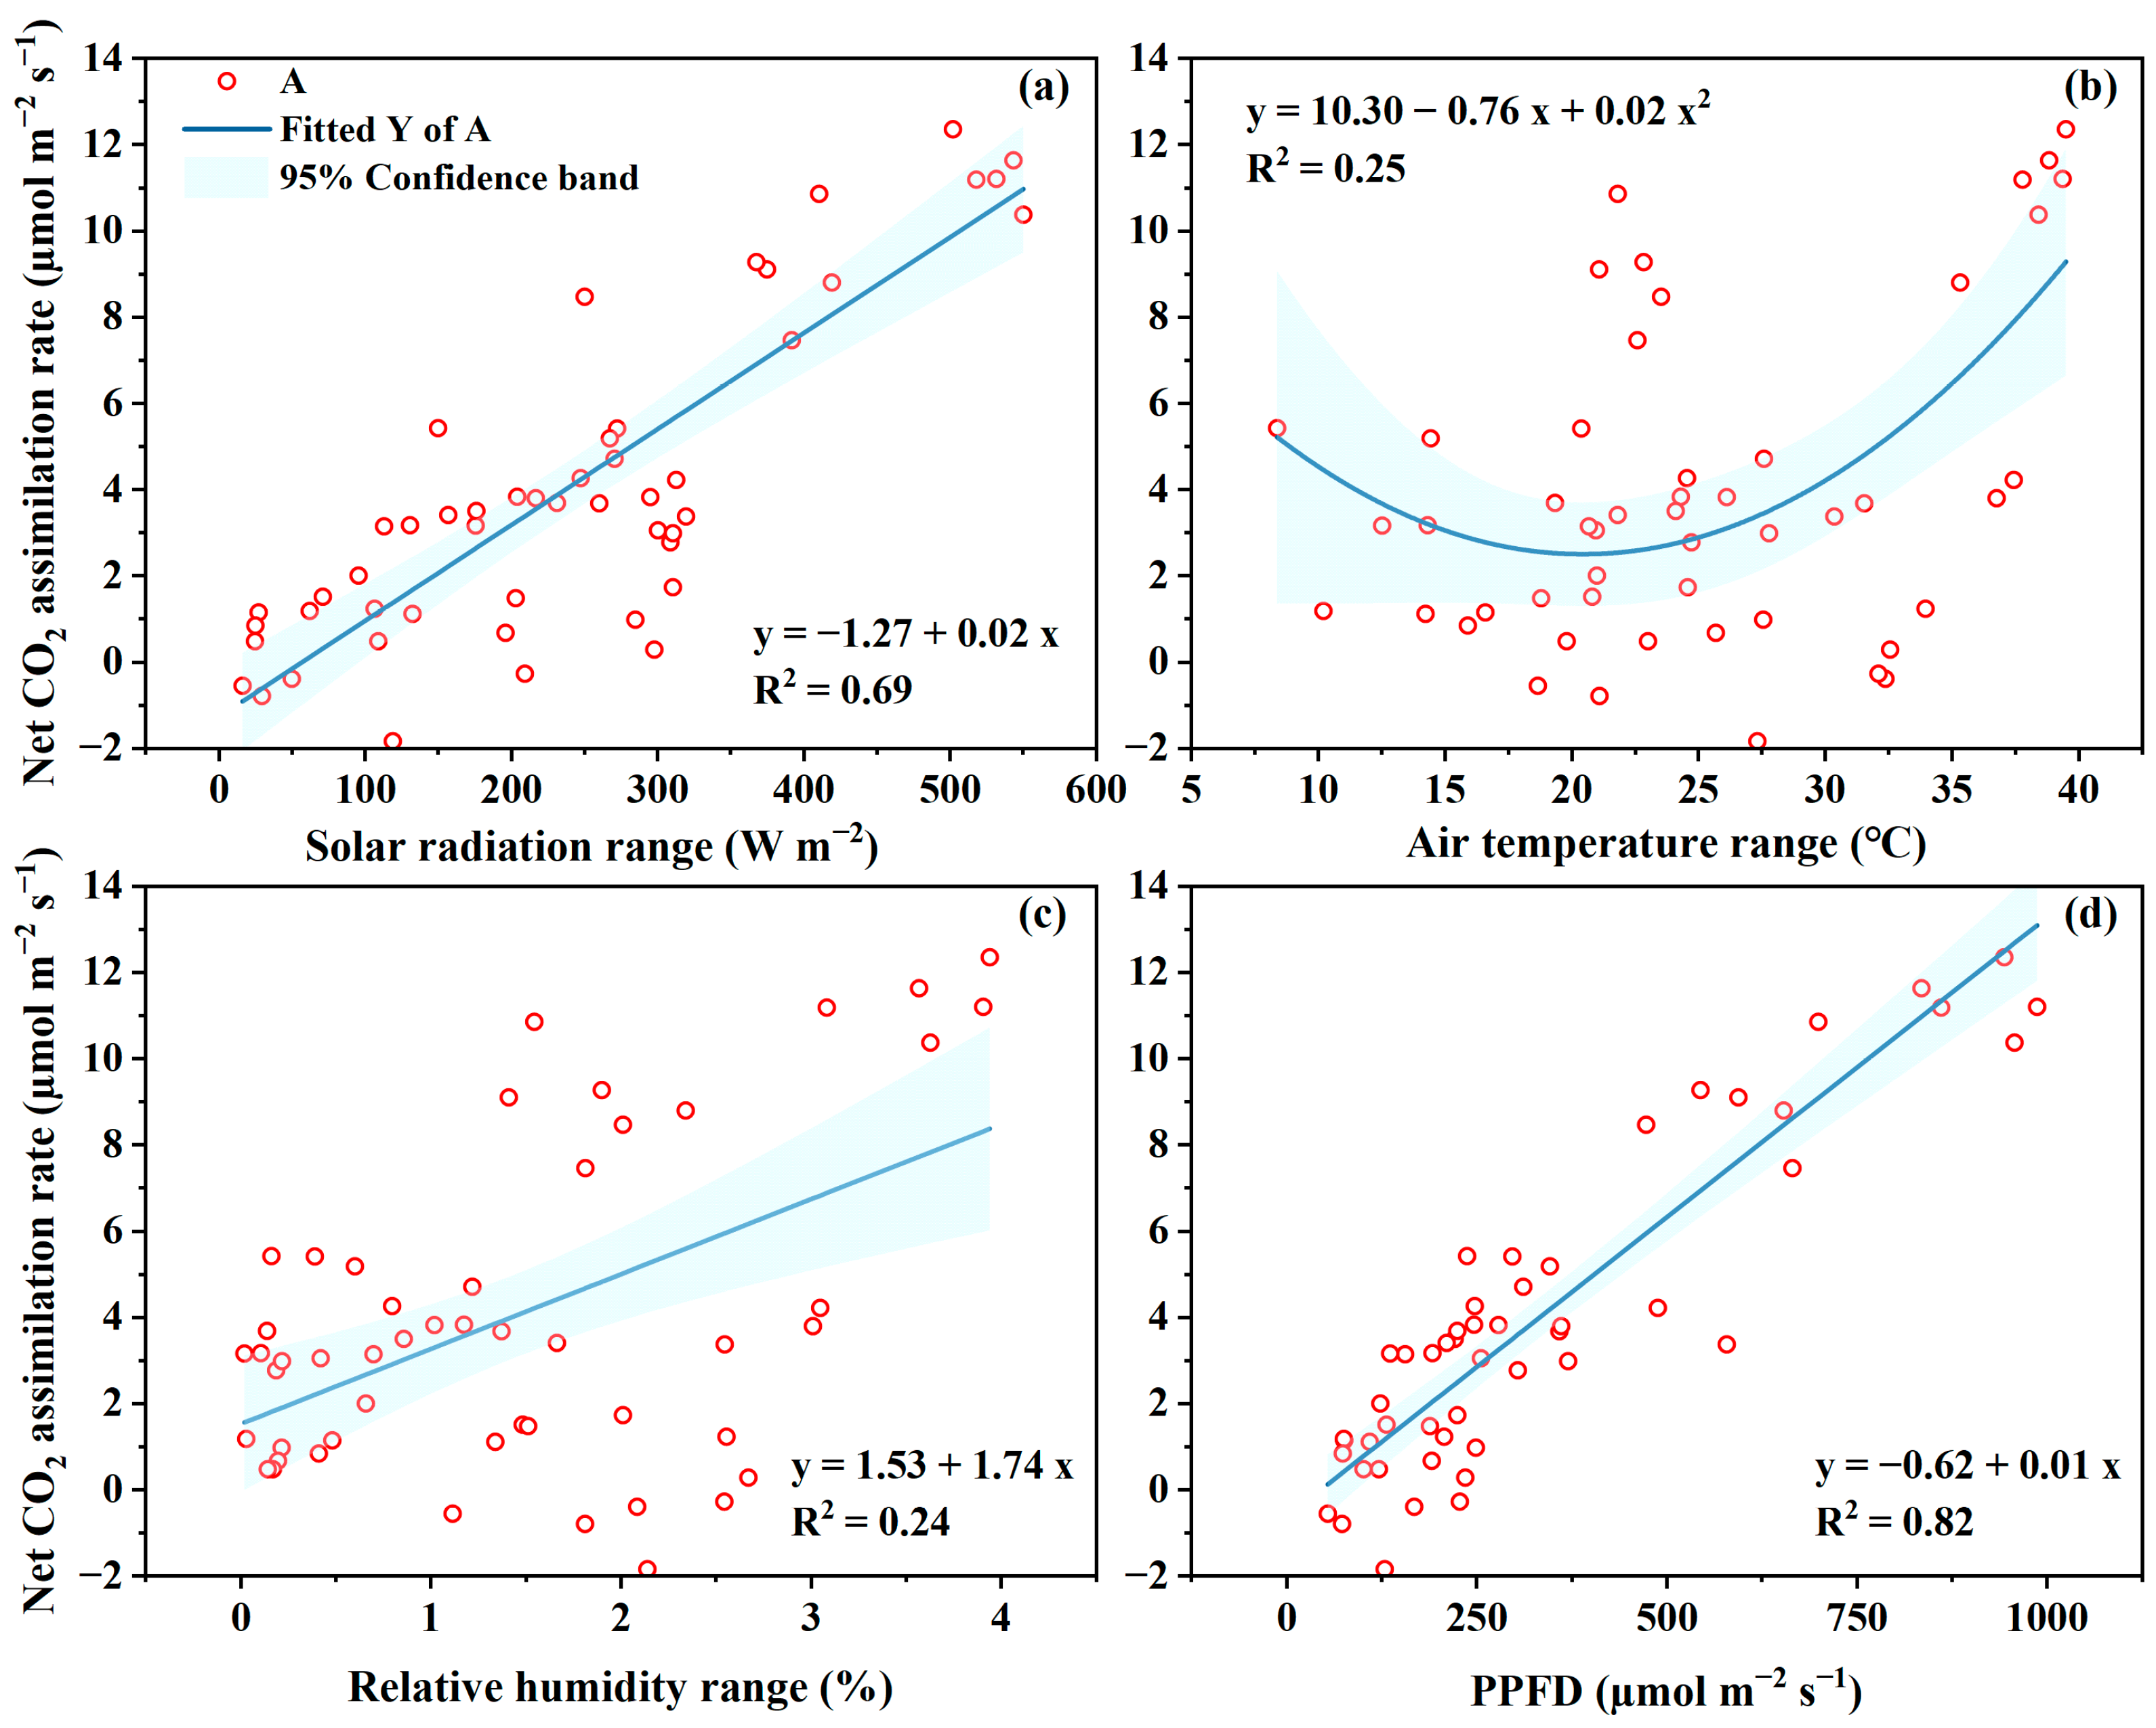
4.2. Photosynthesis Rate to Microclimate

Photosynthesis rate can be used to evaluate the accumulated CO2 assimilation product, which is the base to the plant growth and fruit production. Generally, Pn rate is positively related to the incoming radiation or light intensity reaching to leaf surface [42]. An, et al. [49] further reported that the Pn is highly related to net radiation and relative humidity with determination coefficients of 0.94 and 0.77.
In this study, the instantaneous Pn rate was linearly related to the solar radiation and the light intensity (Figure 6a,d). The determination coefficient R2 of the regression lines are 0.69 and 0.82 for solar radiation and light intensity, respectively. These indicate that the 69% and 82% variation of Pn are attributed to variation of radiation and light intensity, respectively.
The Pn rate ranged from 0 to 6 µmol m−2 s−1 when air temperature was lower than 30 °C. After that, the Pn rate increased to 11.6 µmol m−2 s−1 in July. The lower Pn were mostly measured in winter period in which solar radiation was low and the temperature was also low compared to that in July. However, the inside temperature was approximately 9–10 °C higher than those outside, indicating greatly enhanced temperature in GH in winter. The Pn rate was also linearly related to VPD, indicating the water vapor deficit could enhance both the E and Pn. However, the higher R2 in the regression expression of E to VPD (Figure 5c) compared to that in Pn to VPD (Figure 6c) shows that leaf E is closer related to VPD than Pn.

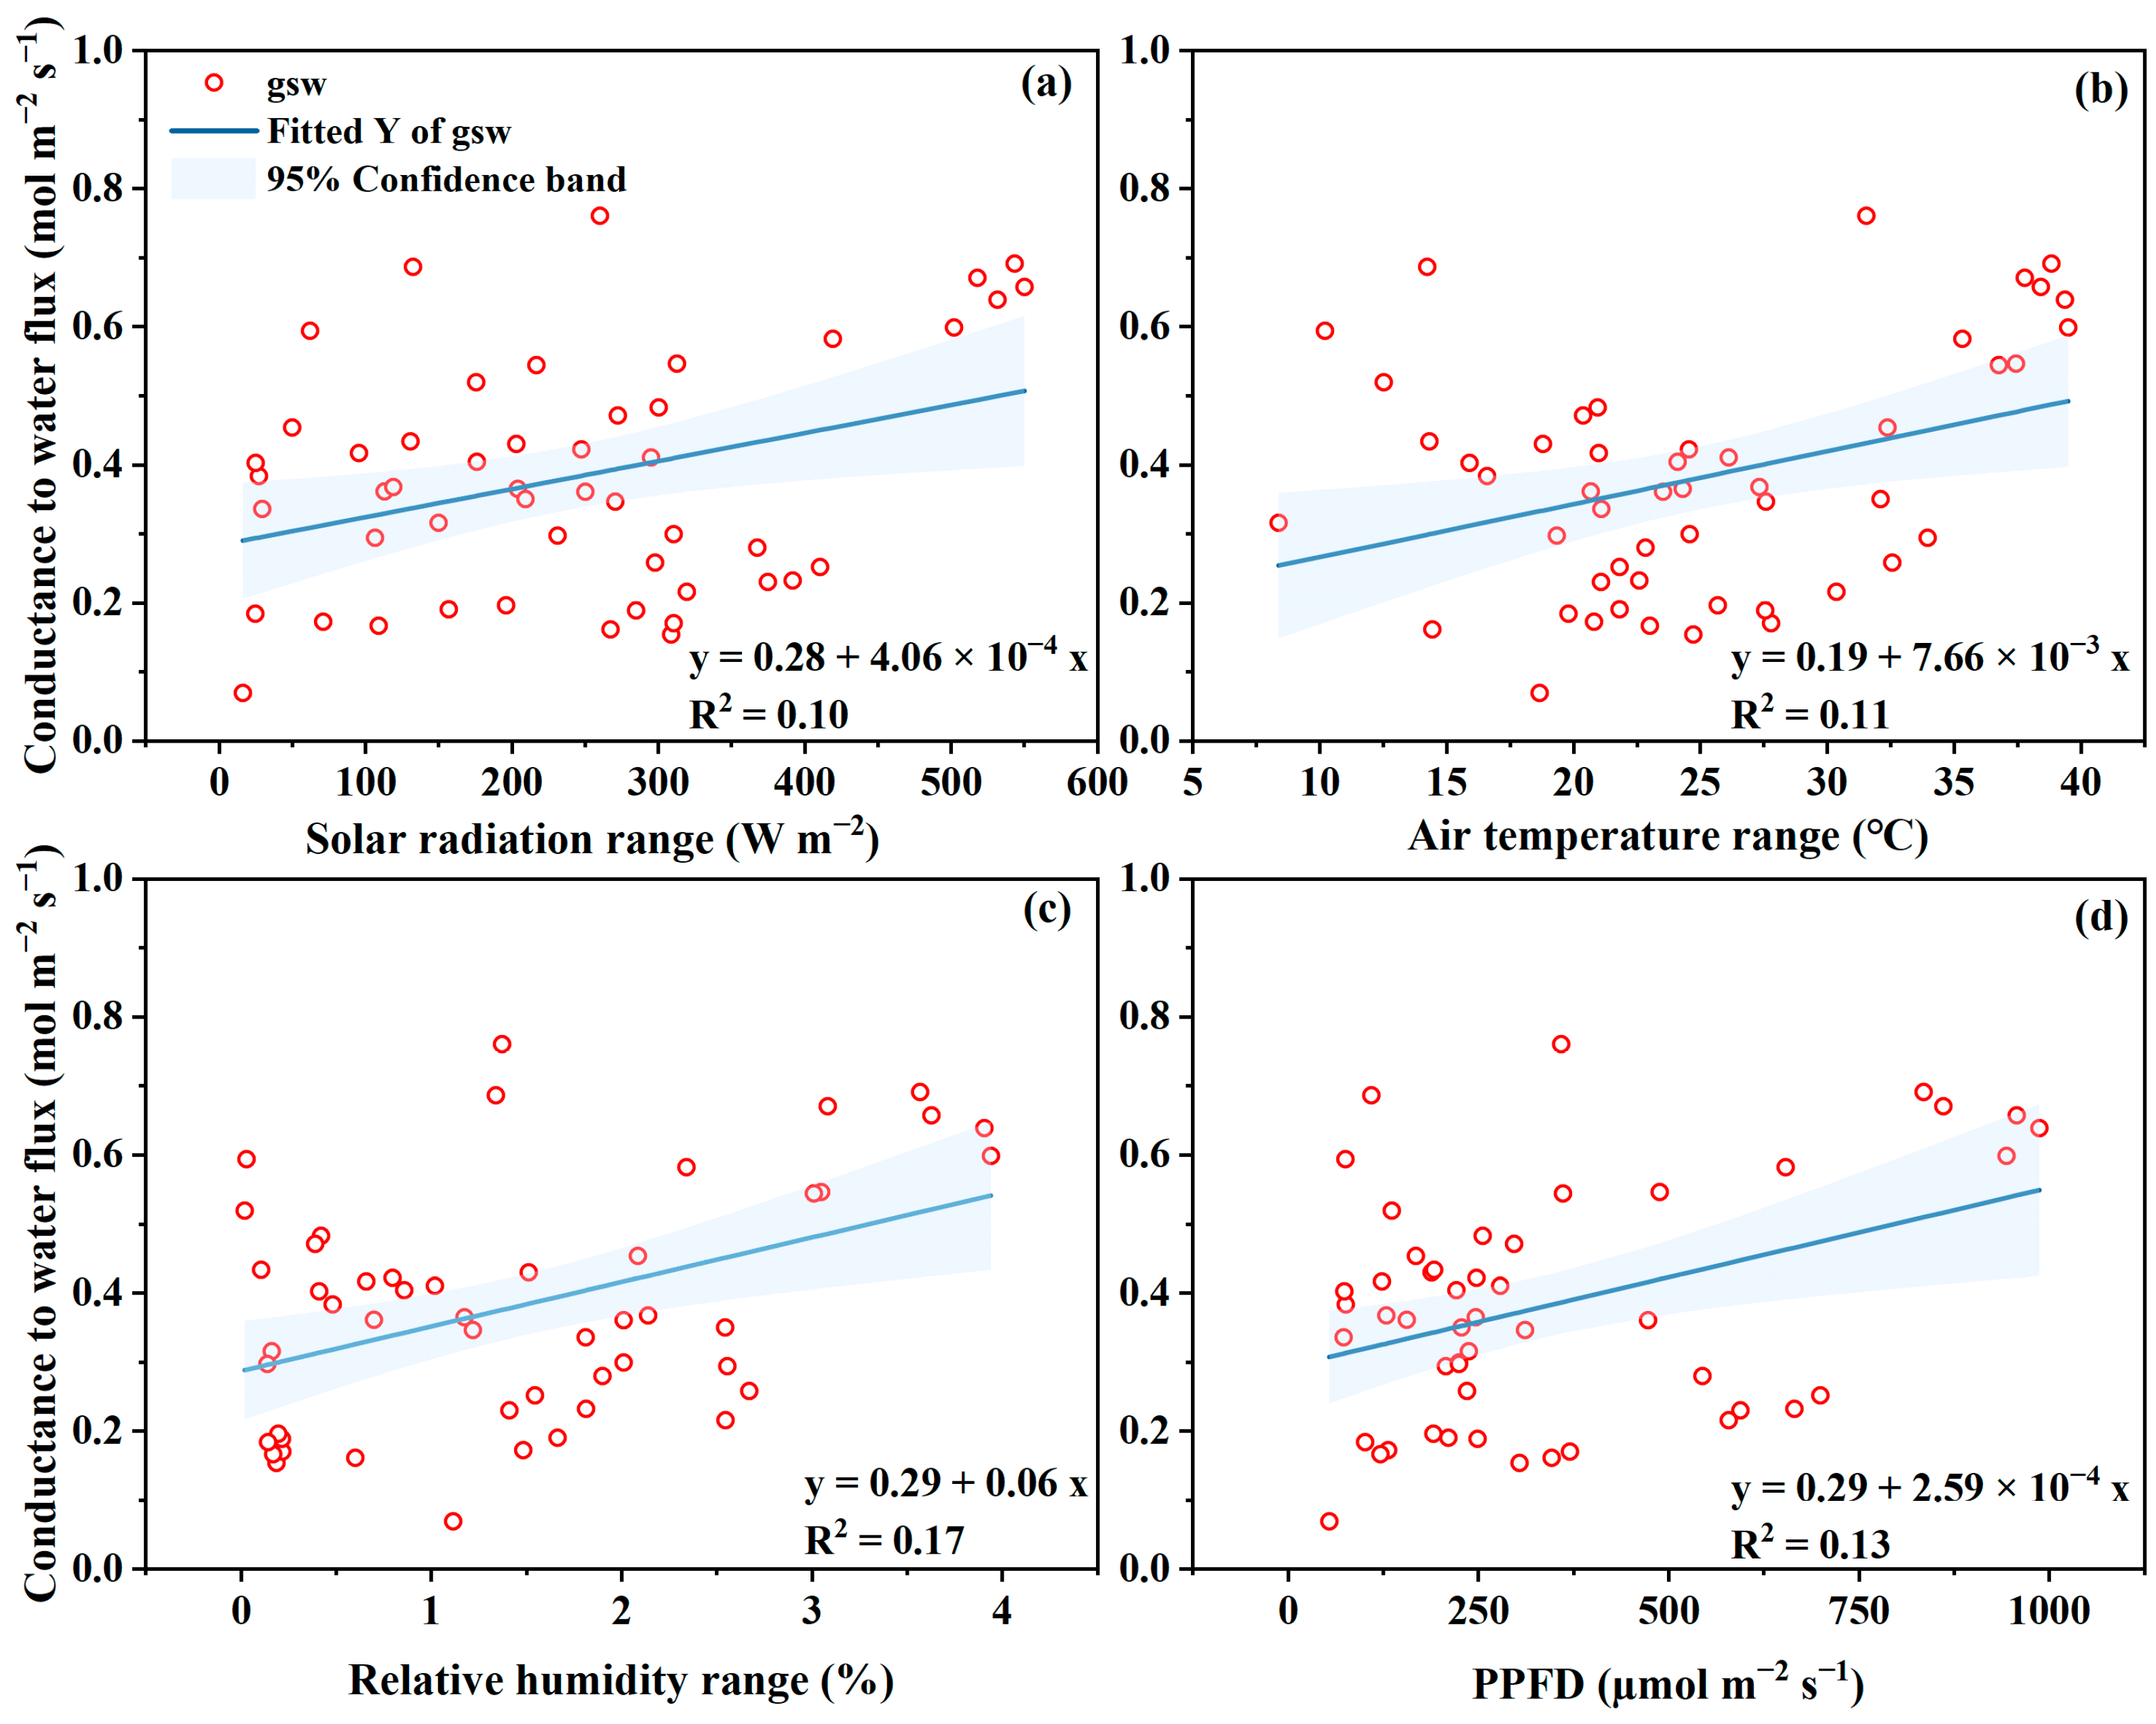
4.3. Conductance of gsw and gtc to Microclimate

The leaf transpiration rate is linearly related to the stomatal conductance (gsw) and the water concentration deficit from leaf to environment [50]. Similarly, the Pn rate is linearly related to the conductance (gtc) to CO2 assimilation and CO2 concentration difference between in environment and stomata [51]. Now the characteristics of gsw and gtc and related factors have been widely studied. Generally, it was reported that the gsw and gtc are closely related to solar radiation, CO2 concentration, VPD, air temperature and soil water status [46,52,53,54,55,56].
In this study, there were slight changes for gsw and gtc during daytime though weak declined trends of gsw and gtc were found in most measurement days (Figure 4). Similarly in the previous studies, Li, Liu, Tian, Liang, Li, Li, Wei and Zhang [16] reported that the stomatal conductance and mesophyll conductance to photosynthetic CO2 transport on the top canopy did not increased significantly though the light density was increased by using supplementary light source, whereas, both conductances` were increasing with the supplementary light on the middle and lower canopy because of the deficit light density.
The relationship between gsw to microclimate variables (i.e., solar radiation, air temperature, VPD, and light intensity) are illustrated in Figure 7. Similar results were found for gtc and therefore, the data were not shown in the text. Generally, both gsw and gtc were positively related to solar radiation, temperature, and VPD, while their correlation coefficient is weak with a value of less than 0.4 (Figure 7). High temperature/heat stress and high VPD generally induce stomata closure, thus reducing stomatal conductance, and finally causing low transpiration and photosynthesis rates [38]. Therefore misting the leaf surface reduced the leaf temperature and VPD from air to leaf and finally resulted in a higher canopy conductance and photosynthesis rate of greenhouse tomatoes when temperatures ranged from 30–35 °C and VPD from 3–3.5 kPa [38]. Camejo, Rodríguez, Angeles Morales, Miguel Dell’Amico, Torrecillas and Alarcón [17] reported that increased gsw were found when tomato plant suffered heat stress (45 °C for 2 h), whereas, Pn rate decreased by approximately 40%. They explained that the decrease in Pn was not controlled by stomatal closure, but depended on the activity of Rubisco and on the capacity of photosynthetic electron transport to regenerate Rubisco. Shaheen, Ayyub, Amjad and Waraich [15] investigated morpho-physiological factors for 191 tomato genotypes under heat shock conditions, and reported that, the stomatal conductance was genotype-dependent and varied greatly from 5 to 41 umol m−2 s−1, and highly positively related to Pn. It can be concluded that, the mechanism of stomata control and the related gsw and gtc performance for tomato crops are much more complicated. The results and regressed expression reported in a certain environment should be reconsidered when used in other different situations.

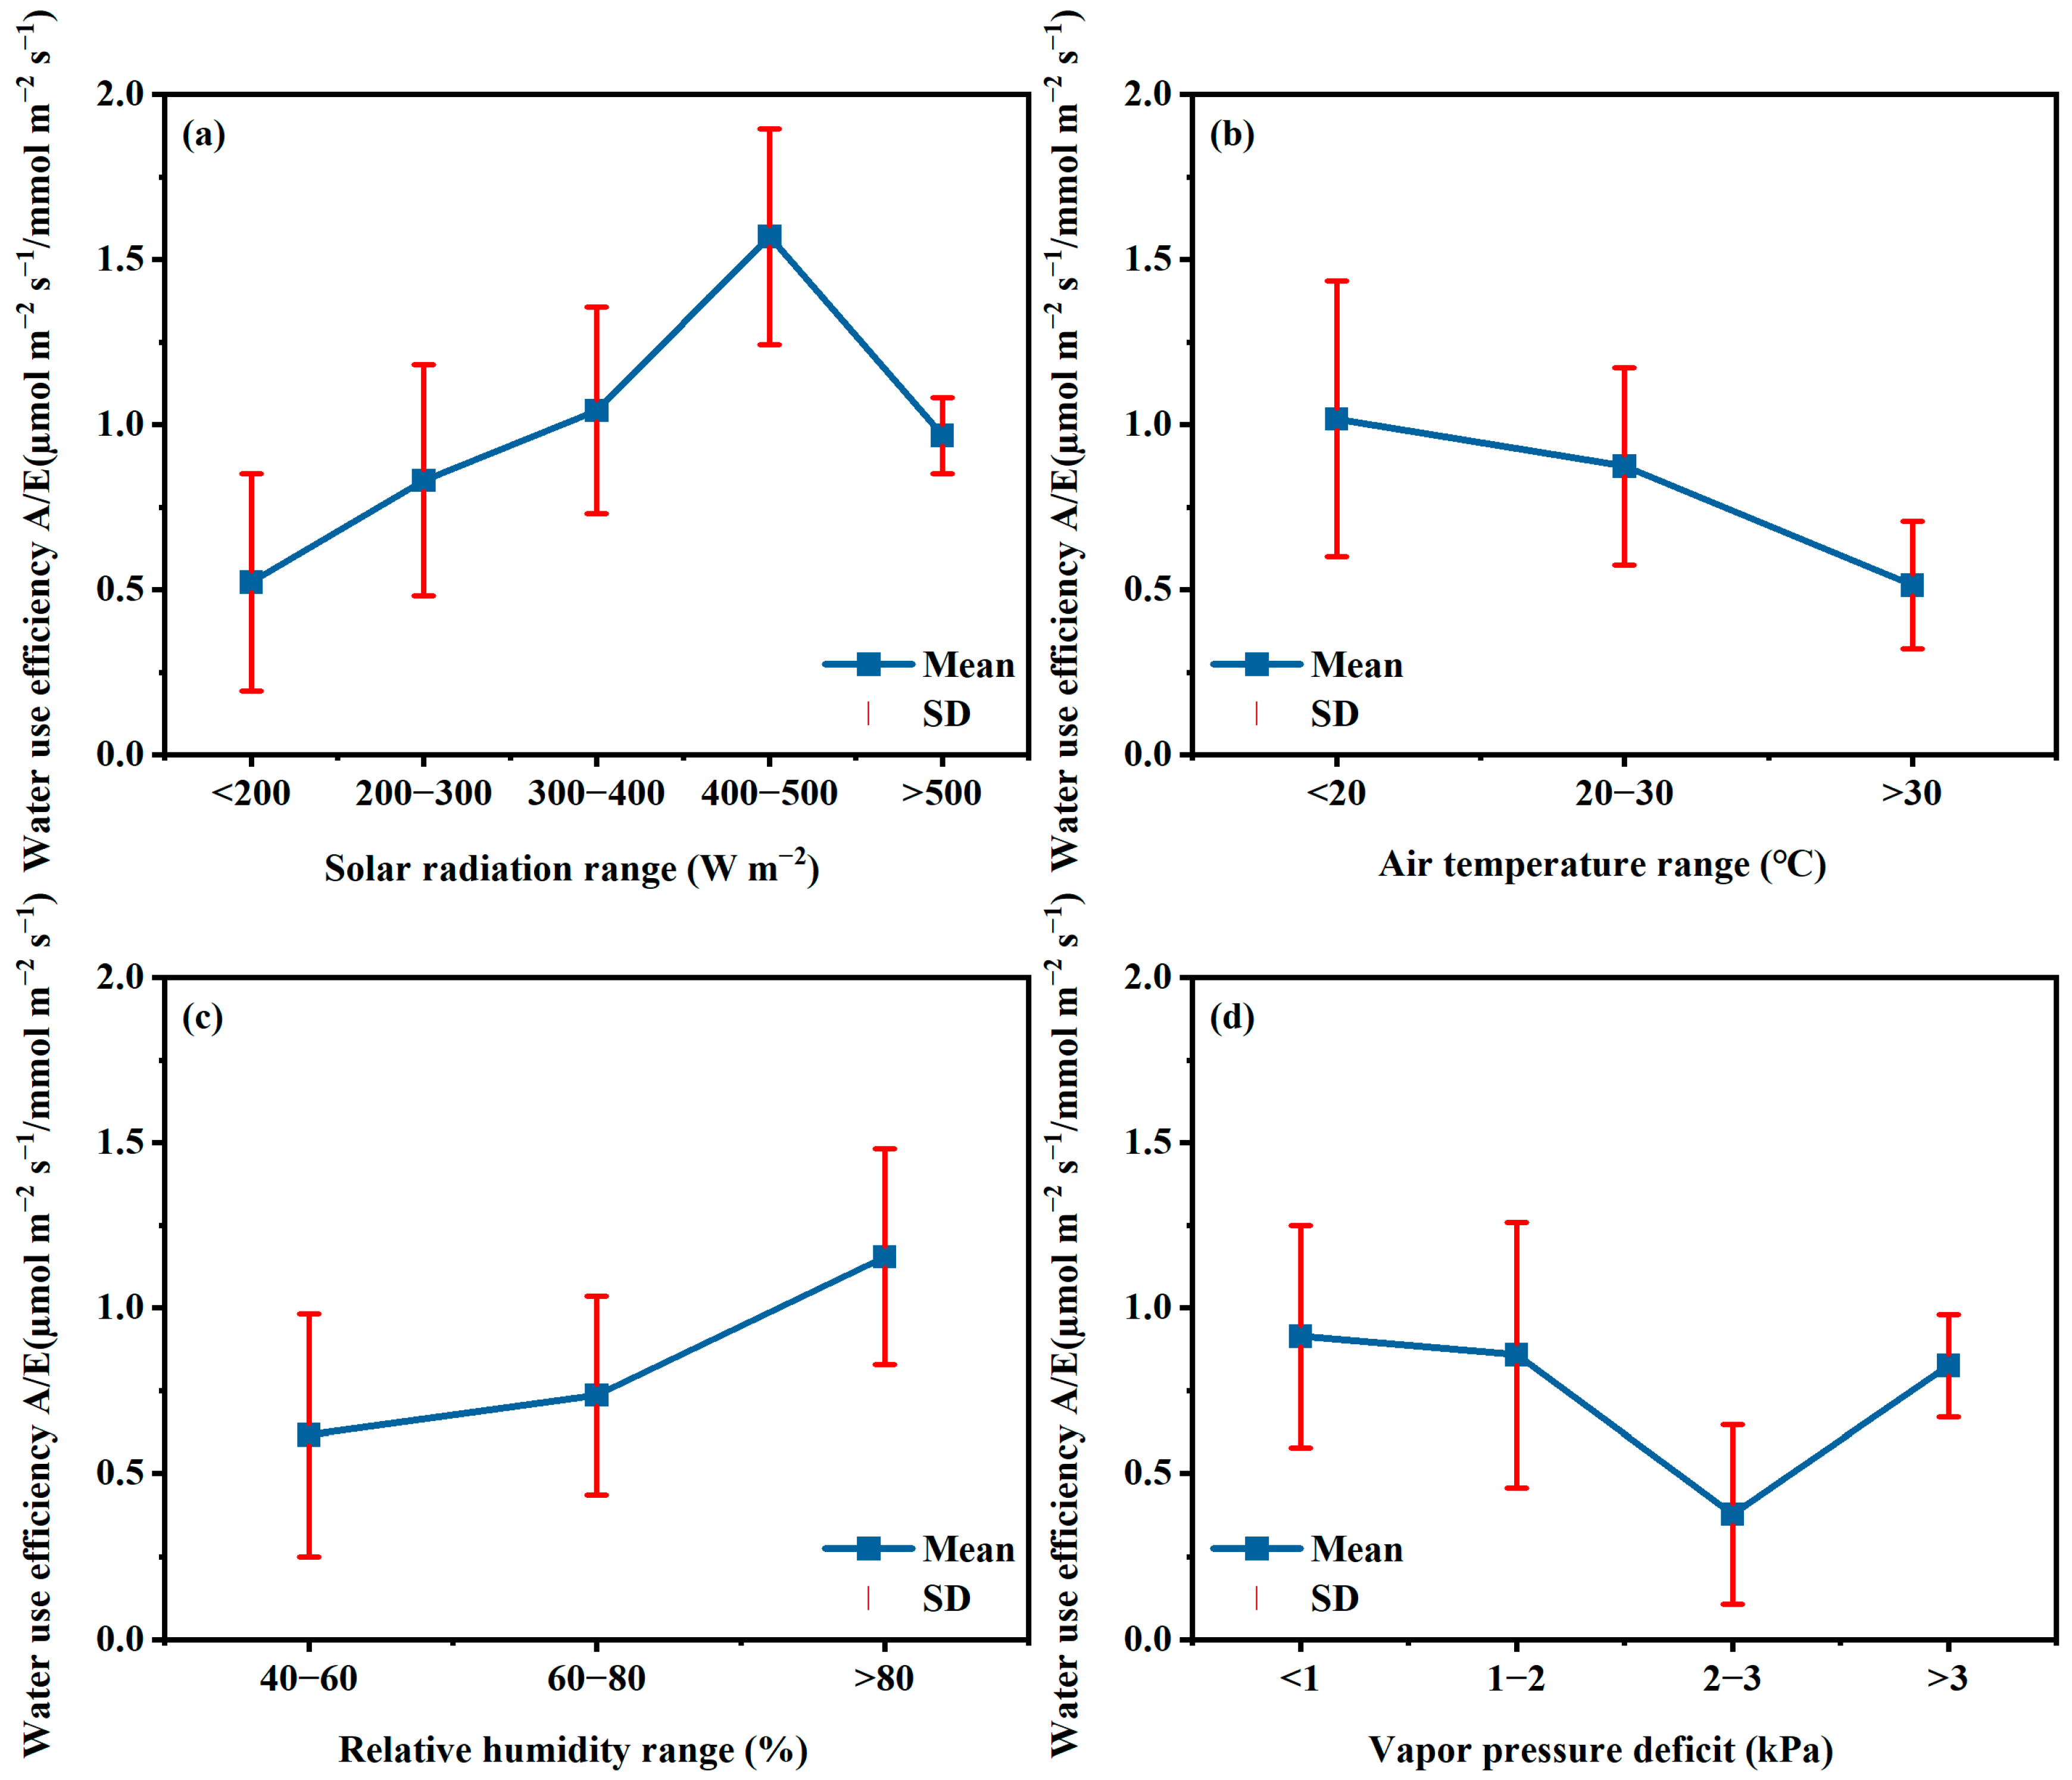
4.4. Microclimate Management for High Water Productivity in GH

Achieving the goals of high fruit production and water use efficiency can be evaluated using the index of water use efficiency, the ratio of the crop production to the water used (Equation (1)). In field conditions, the crop yield and the evapotranspiration are used to calculate the water use efficiency, also called water productivity [32,57,58,59,60]. At the leaf level, photosynthesis and transpiration are mostly used to calculate water use efficiency. The higher WUEL means more CO2 assimilation product per water used. Considering that crop photosynthesis and transpiration rates are comprehensively influenced by crop status and microclimatic conditions under good soil water status, optimizing the microclimate condition in GH is useful way to obtain high WUEL.
In GH cultivation, the incoming radiation, air temperature, relative humidity, and vapor pressure deficit are the main factors that can be regulated. The relationships between WUEL to these microclimate factors in this experiment were analyzed and the results are shown in Figure 8. Generally, the WUEL increased with the solar radiation increasing and reached the highest value for radiation range of 400–500 W m−2, after that, the WUEL decreased but still was in high status. The WUEL data for radiation higher than 500 W m−2 were mostly in days in July, and those less than 500 W m−2 from October to December in winter season (Figure 2). Though the higher radiation in July caused higher Pn and E (Figure 3), while the WUEL was lower than those in winter season in which radiation was in 400–500 W m−2 and close to that in 300–400 W m−2 (Figure 8a). Therefore, increasing incoming radiation is a key way to improve the WUEL in GH in winter season. For solar GH, using high transmissivity cover materials could increase the inside radiation. In North China, the transmissivity rate of cover materials in GH ranges from 0.6 to 0.7 [12,25,26,34]. Considering the mean solar radiation amount was 210–230 W m−2 during daytime in winter in the study area, the increasing of the transmissivity rate from 0.6 in this GH to 0.8 could enhance the WUEL increasing from 0.86 to 1.06 (µmol m−2 s−1)/(mmol m−2 s−1). However, in the summer season, partial shading could decrease the incoming radiation and finally provide a reasonable radiation range for high WUEL because of the high radiation [61,62].
The WUEL for temperature range of 10–20 °C was close to that in the range of 20–30 °C, and both WUEL were higher than those for temperatures higher than 30 °C (Figure 8b), indicating higher temperatures reduce the WUEL. It is clear that higher temperature generally resulted in higher E (Figure 5b) because the higher E will consume more energy coming to leaf and thus regulate leaf temperature for normal biochemical activity. A high temperature (32 °C) was found to limit Pn for tomato [37]. In this study, the higher Pn was observed in July with a high temperature in the summer season, while the smaller Pn was found in the winter season. Therefore, most low WUEL for higher temperature (>30 °C) occurred in the winter season, and that in July was close to those in the temperature range of 20–30 °C. This great difference in Pn performance and thus WUEL in winter and summer seasons show that, controlling daytime air temperature in the range of 20–30 °C could improve the tomato crops growth in the winter season, and temperature higher than 30 °C is harmful to photosynthesis and water use efficiency.
The WUEL performance in winter in this study is in line with the findings in the literature, in which optimal temperature is 20–30 °C in day time for higher pollen germination and fruit set and finally good yield of tomato [63], whereas temperature reaching 35 °C and higher will present a major restriction on physiological and biochemical development and consequently results in fruit yield reduction [18,19]. In summer, the threshold for heat stress to tomato crops could be a little higher, mainly because tomato plants have adapted to this high-temperature condition. However, long periods of high temperatures is harmful to tomato growth. In August, 2019, the mean daily maximum temperature was 38.9 °C, which caused the tomato yellow leaf curl virus disease and small and curl leaves by heat shock (Figure 2), and consequently resulted in much low Pn and E (Figure 3b and Figure 4b). This is the reason why the tomato yield was only 10.8 ton ha−1 (Table 1) and is not planted in the summer season by most farmers in North China.
The water and CO2 assimilation flux are proportion to stomatal conductance and the gradient of water and CO2 concentrations from leaf to the environment [50,51]. The slight change patterns of gsw and gtc during daytime (Figure 4) show that the stomatal factor plays a minor role in regulating E and Pn. Then microclimatic condition could be a key factor influencing Pn and E and finally WUEL. Generally, higher VPD results in a higher transpiration rate. Whereas, high VPD just slightly influenced the conductance to CO2 flux and finally the photosynthesis rate (Figure 6c and Figure 7c). As a comprehensive result, the WUEL will be low under high VPD conditions. This conclusion is proved by the data in this study. Based on the data in Figure 8c,d, WUEL was positively related to relative humidity, and the highest WUEL was found when RH was higher than 80%. Meanwhile, the WUEL was higher when VPD was smaller than 2 kPa, then decreased by approximately 50% at 2–3 kPa (Figure 8c,d). Therefore, maintaining high RH (>80%) and low VPD (<2 kPa) could improve the water use efficiency at the leaf level, which finally will enhance the water use efficiency at the field scale.
Considering the great improvement in inside microclimate, photosynthesis characteristics, water use efficiency, and tomato yield in winter in this GH, other crops will be planted in this type of GH, then these crops’ responses to this GH in winter can be further studied. Inside extra high temperatures in summer greatly limit crop growth and fruit production (Table 1, Suppl. Figure S1b), therefore, the greenhouse structure should be optimized to reduce heat load in summer. This GH can be further evaluated in high latitude regions where winter temperature is low while radiation is acceptable.

5. Conclusions

The main conclusions drawn in this study are as followings:
Inside radiation was reduced by approximately 60%; the inside temperature, relative humidity, and vapor pressure in summer were close to that outside, and higher in winter; inside wind speed of 0.1–0.3 m s−1 was approximately 10% of that outside.
Leaf transpiration and photosynthesis rates were positively related to solar radiation, air temperature and vapor pressure deficit; both E and Pn were much small for diseased plants and cloudy days.
Conductance to transpiration and photosynthesis varied slightly during daytime, and was weakly related to all microclimate, indicating conductance is not a key factor controlling E and Pn in GH.
Water use efficiency at the leaf level is generally positively related to solar radiation and relative humidity, and negatively related to air temperature and vapor pressure deficit; Extra high radiation (>500 W m−2) and temperature (>30 °C) greatly reduce water use efficiency.
Microclimate in a greenhouse with the aim for high water use efficiency and can be optimized as solar radiation of 400–500 W m−2, temperature of 20–30 °C, relative humidity of higher than 80%, and vapor pressure of less than 2.0 kPa.

Supplementary Materials

The following supporting information can be downloaded at: https://www.mdpi.com/article/10.3390/horticulturae9020197/s1, Figure S1: Variations of daily solar radiation (Rs), mean daily air temperature (Ta), relative humidity (RH), vapor pressure deficit (VPD) and wind speed (u) inside and outside the sunken solar greenhouse during three growth periods.

Author Contributions

Conception and design of experiments, H.L.; performance of experiments and analysis of data, L.Y., H.L. and M.S.; writing—review and editing, H.L. and M.S. All authors have read and agreed to the published version of the manuscript.

Funding

This research was funded by the Science and Technology Major Project of Inner Mongolia Autonomous (NO. NMKJXM202105, NMKJXM202004), National Nature Science Foundation of China (NO. 91479004), and the 111 Project (B18006).

Institutional Review Board Statement

Not applicable.

Informed Consent Statement

Not applicable.

Data Availability Statement

Not applicable.

Acknowledgments

We greatly appreciated the support of Jiaqi Wang, the owner of the solar greenhouse.

Conflicts of Interest

The funders had no role in the design of the study; in the collection, analyses, or interpretation of data; in the writing of the manuscript; or in the decision to publish the results.

References

  1. Yeo, U.-H.; Lee, S.-Y.; Park, S.-J.; Kim, J.-G.; Choi, Y.-B.; Kim, R.-W.; Shin, J.H.; Lee, I.-B. Rooftop Greenhouse: (1) Design and Validation of a BES Model for a Plastic-Covered Greenhouse Considering the Tomato Crop Model and Natural Ventilation Characteristics. Agriculture 2022, 12, 903. [Google Scholar] [CrossRef]
  2. Bonachela, S.; Fernández, M.D.; Cabrera-Corral, F.J.; Granados, M.R. Salt and irrigation management of soil-grown Mediterranean greenhouse tomato crops drip-irrigated with moderately saline water. Agric. Water Manag. 2022, 262, 107433. [Google Scholar] [CrossRef]
  3. Sánchez-Hermosilla, J.; Pérez-Alonso, J.; Martínez-Carricondo, P.; Carvajal-Ramírez, F.; Agüera-Vega, F. Evaluation of Electrostatic Spraying Equipment in a Greenhouse Pepper Crop. Horticulturae 2022, 8, 541. [Google Scholar] [CrossRef]
  4. Hodge, C.; Rogers, M.; Handeen, D.; Schweser, G. Yield of leafy greens and microclimate in deep winter greenhouse production in Minnesota. Sustainability 2019, 11, 28. [Google Scholar] [CrossRef]
  5. Wacker, J.-D.; Verheul, M.J.; Righini, I.; Maessen, H.; Stanghellini, C. Optimisation of supplemental light systems in Norwegian tomato greenhouses—A simulation study. Biosyst. Eng. 2022, 215, 129–142. [Google Scholar] [CrossRef]
  6. Roonjho, S.J.; Kamal, R.M.; Roonjho, A.R. Modeling capillary wick irrigation system for greenhouse crop production. Agric. Water Manag. 2022, 274, 107927. [Google Scholar] [CrossRef]
  7. Ávila-Pozo, P.; Parrado, J.; Caballero, P.; Tejada, M. Use of a Biostimulant Obtained from Slaughterhouse Sludge in a Greenhouse Tomato Crop. Horticulturae 2022, 8, 622. [Google Scholar] [CrossRef]
  8. Yang, P.; Bai, J.; Yang, M.; Ma, E.; Yan, M.; Long, H.; Liu, J.; Li, L. Negative pressure irrigation for greenhouse crops in China: A review. Agric. Water Manag. 2022, 264, 107497. [Google Scholar] [CrossRef]
  9. Nikolaou, G.; Neocleous, D.; Christou, A.; Polycarpou, P.; Kitta, E.; Katsoulas, N. Energy and Water Related Parameters in Tomato and Cucumber Greenhouse Crops in Semiarid Mediterranean Regions. A Review, Part I: Increasing Energy Efficiency. Horticulturae 2021, 7, 521. [Google Scholar] [CrossRef]
  10. Nikolaou, G.; Neocleous, D.; Christou, A.; Polycarpou, P.; Kitta, E.; Katsoulas, N. Energy and Water Related Parameters in Tomato and Cucumber Greenhouse Crops in Semiarid Mediterranean Regions. A Review, Part II: Irrigation and Fertigation. Horticulturae 2021, 7, 548. [Google Scholar] [CrossRef]
  11. Liu, T.; Yuan, Q.; Wang, Y. Hierarchical optimization control based on crop growth model for greenhouse light environment. Comput. Electron. Agric. 2021, 180, 105854. [Google Scholar] [CrossRef]
  12. Liu, H.; Yin, C.; Hu, X.; Tanny, J.; Tang, X. Microclimate characteristics and evapotranspiration estimates of cucumber plants in a newly developed sunken solar greenhouse. Water 2020, 12, 2275. [Google Scholar] [CrossRef]
  13. Yang, Z.Q.; Xu, C.; Wang, M.T.; Zhao, H.L.; Zheng, Y.J.; Huang, H.J.; Vuguziga, F.; Umutoni, M.A. Enhancing the thermotolerance of tomato seedlings by heat shock treatment. Photosynthetica 2019, 57, 1184–1192. [Google Scholar] [CrossRef]
  14. Xu, D.; Du, S.; van Willigenburg, L.G. Optimal control of Chinese solar greenhouse cultivation. Biosyst. Eng. 2018, 171, 205–219. [Google Scholar] [CrossRef]
  15. Shaheen, M.R.; Ayyub, C.M.; Amjad, M.; Waraich, E.A. Morpho-physiological evaluation of tomato genotypes under high temperature stress conditions: Evaluation of tomato genotypes under high temperature stress. J. Sci. Food Agric. 2016, 96, 2698–2704. [Google Scholar] [CrossRef]
  16. Li, Q.; Liu, Y.; Tian, S.; Liang, Z.; Li, S.; Li, Y.; Wei, M.; Zhang, D. Effect of supplemental lighting on water transport, photosynthetic carbon gain and water use efficiency in greenhouse tomato. Sci. Hortic.-Amst. 2019, 256, 108630. [Google Scholar] [CrossRef]
  17. Camejo, D.; Rodríguez, P.; Angeles Morales, M.; Miguel Dell’Amico, J.; Torrecillas, A.; Alarcón, J.J. High temperature effects on photosynthetic activity of two tomato cultivars with different heat susceptibility. J. Plant Physiol. 2005, 162, 281–289. [Google Scholar] [CrossRef] [PubMed]
  18. Alsamir, M.; Mahmood, T.; Trethowan, R.; Ahmad, N. An overview of heat stress in tomato (Solanum lycopersicum L.). Saudi J. Biol. Sci. 2021, 28, 1654–1663. [Google Scholar] [CrossRef]
  19. Alsamir, M.; Ahmad, N.; Mahmood, T.; Trethowan, R. Morpho-Physiological Traits Linked to High Temperature Stress Tolerance in Tomato (S. lycopersicum L.). Am. J. Plant Sci. 2017, 8, 2681–2694. [Google Scholar] [CrossRef]
  20. Buttaro, D.; Santamaria, P.; Signore, A.; Cantore, V.; Boari, F.; Montesano, F.F.; Parente, A. Irrigation management of greenhouse tomato and cucumber using tensiometer: Effects on yield, quality and water use. Agric. Agric. Sci. Procedia 2015, 4, 440–444. [Google Scholar] [CrossRef] [Green Version]
  21. Juárez-Maldonado, A.; Benavides-Mendoza, A.; de-Alba-Romenus, K.; Morales-Díaz, A.B. Estimation of the water requirements of greenhouse tomato crop using multiple regression models. Emir. J. Food Agric. 2014, 26, 885–897. [Google Scholar] [CrossRef]
  22. Du, Y.; Cao, H.; Liu, S.; Gu, X.; Cao, Y. Response of yield, quality, water and nitrogen use efficiency of tomato to different levels of water and nitrogen under drip irrigation in Northwestern China. J. Integr. Agric. 2017, 16, 1153–1161. [Google Scholar] [CrossRef]
  23. Ntinas, G.K.; Koukounaras, A.; Kotsopoulos, T. Effect of energy saving solar sleeves on characteristics of hydroponic tomatoes grown in a greenhouse. Sci. Hortic.-Amst. 2015, 194, 126–133. [Google Scholar] [CrossRef]
  24. Gourdo, L.; Fatnassi, H.; Bouharroud, R.; Ezzaeri, K.; Bazgaou, A.; Wifaya, A.; Demrati, H.; Bekkaoui, A.; Aharoune, A.; Poncet, C.; et al. Heating canarian greenhouse with a passive solar water–sleeve system: Effect on microclimate and tomato crop yield. Sol. Energy 2019, 188, 1349–1359. [Google Scholar] [CrossRef]
  25. Ni, M.; Lan, D.; Jahan, M.; Wang, J.; Guo, S. A pilot study on the microclimate of a multi-span solar energy greenhouse. Appl. Eng. Agric. 2019, 35, 601–616. [Google Scholar] [CrossRef]
  26. Li, A.; Huang, L.; Zhang, T. Field test and analysis of microclimate in naturally ventilated single-sloped greenhouses. Energy Build. 2017, 138, 479–489. [Google Scholar] [CrossRef]
  27. Liu, H.; Yuan, B.; Hu, X.; Yin, C.; Tang, X. Cucumber production and the economic revenues under various nitrogen applications in an unheated solar greenhouse on the North China Plain. Agron. J. 2021, 113, 3444–3459. [Google Scholar] [CrossRef]
  28. Fu, G.; Li, Z.; Liu, W.; Yang, Q. Improved root zone temperature buffer capacity enhancing sweet pepper yield via soil-ridged substrate-embedded cultivation in solar greenhouse. Int. J. Agric. Biol. Eng. 2018, 11, 41–47. [Google Scholar] [CrossRef]
  29. Li, Y.; Xue, X.; Xu, F.; Guo, W.; Duan, M.; Lin, S.; Li, Y.; Wang, Z. Negative-pressure irrigation improves water and fertilizer use efficiencies and fruit yield of greenhouse tomato on the North China Plain. Irrig. Drain. 2021, 70, 1027–1038. [Google Scholar] [CrossRef]
  30. Liu, H.; Yin, C.; Gao, Z.; Hou, L. Evaluation of cucumber yield, economic benefit and water productivity under different soil matric potentials in solar greenhouses in North China. Agric. Water Manag. 2021, 243, 106442. [Google Scholar] [CrossRef]
  31. Xu, K.; Guo, X.; He, J.; Yu, B.; Tan, J.; Guo, Y. A study on temperature spatial distribution of a greenhouse under solar load with considering crop transpiration and optical effects. Energy Convers. Manag. 2022, 254, 115277. [Google Scholar] [CrossRef]
  32. Liu, H.; Li, H.; Ning, H.; Zhang, X.; Li, S.; Pang, J.; Wang, G.; Sun, J. Optimizing irrigation frequency and amount to balance yield, fruit quality and water use efficiency of greenhouse tomato. Agric. Water Manag. 2019, 226, 105787. [Google Scholar] [CrossRef]
  33. Zheng, L.; Zhang, Q.; Zheng, K.; Zhao, S.; Wang, P.; Cheng, J.; Zhang, X.; Chen, X. Effects of Diffuse Light on Microclimate of Solar Greenhouse, and Photosynthesis and Yield of Greenhouse-grown Tomatoes. HortScience 2020, 55, 1605–1613. [Google Scholar] [CrossRef]
  34. Yang, L.; Liu, H.; Cohen, S.; Gao, Z. Microclimate and Plant Transpiration of Tomato (Solanum lycopersicum L.) in a Sunken Solar Greenhouse in North China. Agriculture 2022, 12, 260. [Google Scholar] [CrossRef]
  35. Kimura, K.; Yasutake, D.; Koikawa, K.; Kitano, M. Spatiotemporal variability of leaf photosynthesis and its linkage with microclimates across an environment-controlled greenhouse. Biosyst. Eng. 2020, 195, 97–115. [Google Scholar] [CrossRef]
  36. Li, Q.; Wei, M.; Li, Y.; Feng, G.; Wang, Y.; Li, S.; Zhang, D. Effects of soil moisture on water transport, photosynthetic carbon gain and water use efficiency in tomato are influenced by evaporative demand. Agric. Water Manag. 2019, 226, 105818. [Google Scholar] [CrossRef]
  37. Islam, M.T. Effect of temperature on photosynthesis, yield attributes and yield of tomato genotypes. Int. J. Exp. Agric. 2011, 2, 8–11. [Google Scholar]
  38. Yokoyama, G.; Yasutake, D.; Tanizaki, T.; Kitano, M. Leaf wetting mitigates midday depression of photosynthesis in tomato plants. Photosynthetica 2019, 57, 740–747. [Google Scholar] [CrossRef]
  39. Shibuya, T.; Endo, R.; Yuba, T.; Kitaya, Y. The photosynthetic parameters of cucumber as affected by irradiances with different red:far-red ratios. Biol Plant 2015, 59, 198–200. [Google Scholar] [CrossRef]
  40. Shock, C.C.; Wang, F.X.; Flock, R.; Feibert, E.; Shock, C.A.; Pereira, A. Irrigation Monitoring Using Soil Water Tension; Oregon State University: Corvallis, OR, USA, 2013; pp. 1–9. [Google Scholar]
  41. Zheng, J.; Huang, G.; Jia, D.; Wang, J.; Mota, M.; Pereira, L.S.; Huang, Q.; Xu, X.; Liu, H. Responses of drip irrigated tomato (Solanum lycopersicum L.) yield, quality and water productivity to various soil matric potential thresholds in an arid region of Northwest China. Agric. Water Manag. 2013, 129, 181–193. [Google Scholar] [CrossRef]
  42. Wu, Y.S.; Gong, W.Z.; Wang, Y.M.; Yang, W.Y. Shading of mature leaves systemically regulates photosynthesis and leaf area of new developing leaves via hormones. Photosynthetica 2019, 57, 303–310. [Google Scholar] [CrossRef]
  43. Li, B.; Shi, B.; Yao, Z.; Kumar Shukla, M.; Du, T. Energy partitioning and microclimate of solar greenhouse under drip and furrow irrigation systems. Agric. Water Manag. 2020, 234, 106096. [Google Scholar] [CrossRef]
  44. Liu, F.; Cohen, Y.; Fuchs, M.; Plaut, Z.; Grava, A. The effect of vapor pressure deficit on leaf area and water transport in flower stems of soil-less culture rose. Agric. Water Manag. 2006, 81, 216–224. [Google Scholar] [CrossRef]
  45. Gong, X.; Qiu, R.; Sun, J.; Ge, J.; Li, Y.; Wang, S. Evapotranspiration and crop coefficient of tomato grown in a solar greenhouse under full and deficit irrigation. Agric. Water Manag. 2020, 235, 106154. [Google Scholar] [CrossRef]
  46. Liu, H.; Cohen, S.; Hugo, L.J.; Yair, I.; Josef, T. Sap flow, canopy conductance and microclimate in a banana screenhouse. Agric. For. Meteorol. 2015, 201, 165–175. [Google Scholar] [CrossRef]
  47. Mao, H.; Ikram, U.; Ni, J.; Qaiser, J.; Ahmad, A. Estimating tomato water consumption by sap flow measurement in response to water stress under greenhouse conditions. J. Plant Interact. 2017, 12, 402–413. [Google Scholar] [CrossRef]
  48. Li, L.; Chen, S.; Yang, C.; Meng, F.; Sigrimis, N. Prediction of plant transpiration from environmental parameters and relative leaf area index using the random forest regression algorithm. J. Clean. Prod. 2020, 261, 121136. [Google Scholar] [CrossRef]
  49. An, S.; Yang, F.; Yang, Y.; Huang, Y.; Zhangzhong, L.; Wei, X.; Yu, J. Water Demand Pattern and Irrigation Decision-Making Support Model for Drip-Irrigated Tomato Crop in a Solar Greenhouse. Agronomy 2022, 12, 1668. [Google Scholar] [CrossRef]
  50. Jarvis, P.G.; McNaughton, K.G. Stomatal Control of Transpiration: Scaling up from Leaf to Region. Adv. Ecol. Res. 1986, 15, 1–49. [Google Scholar]
  51. Farquhar, G.D.; Sharkey, T.D. Stomatal Conductance and Photosynthesis. Annu. Rev. Plant Physiol. 1982, 33, 317–345. [Google Scholar] [CrossRef]
  52. Motzo, R.; Pruneddu, G.; Giunta, F. The role of stomatal conductance for water and radiation use efficiency of durum wheat and triticale in a Mediterranean environment. Eur. J. Agron. 2013, 44, 87–97. [Google Scholar] [CrossRef]
  53. Siddiq, Z.; Chen, Y.-J.; Zhang, Y.-J.; Zhang, J.-L.; Cao, K.-F. More sensitive response of crown conductance to VPD and larger water consumption in tropical evergreen than in deciduous broadleaf timber trees. Agric. For. Meteorol. 2017, 247, 399–407. [Google Scholar] [CrossRef]
  54. Monje, O.; Bugbee, B. Radiometric Method for Determining Canopy Stomatal Conductance in Controlled Environments. Agronomy 2019, 9, 114. [Google Scholar] [CrossRef]
  55. Li, G.; Lin, L.; Dong, Y.; An, D.; Li, Y.; Luo, W.; Yin, X.; Li, W.; Shao, J.; Zhou, Y.; et al. Testing two models for the estimation of leaf stomatal conductance in four greenhouse crops cucumber, chrysanthemum, tulip and lilium. Agric. For. Meteorol. 2012, 165, 92–103. [Google Scholar] [CrossRef]
  56. Goto, K.; Yabuta, S.; Ssenyonga, P.; Tamaru, S.; Sakagami, J.-I. Response of leaf water potential, stomatal conductance and chlorophyll content under different levels of soil water, air vapor pressure deficit and solar radiation in chili pepper (Capsicum chinense). Sci. Hortic.-Amst. 2021, 281, 109943. [Google Scholar] [CrossRef]
  57. Flach, R.; Skalský, R.; Folberth, C.; Balkovič, J.; Jantke, K.; Schneider, U.A. Water productivity and footprint of major Brazilian rainfed crops—A spatially explicit analysis of crop management scenarios. Agric. Water Manag. 2020, 233, 105996. [Google Scholar] [CrossRef]
  58. Mekonnen, M.M.; Hoekstra, A.Y.; Neale, C.M.U.; Ray, C.; Yang, H.S. Water productivity benchmarks: The case of maize and soybean in Nebraska. Agric. Water Manag. 2020, 234, 106122. [Google Scholar] [CrossRef]
  59. Yaghi, T.; Arslan, A.; Naoum, F. Cucumber (Cucumis sativus, L.) water use efficiency (WUE) under plastic mulch and drip irrigation. Agric. Water Manag. 2013, 128, 149–157. [Google Scholar] [CrossRef]
  60. Liu, H.; Yuan, B.; Hu, X.; Yin, C. Drip irrigation enhances water use efficiency without losses in cucumber yield and economic benefits in greenhouses in North China. Irrig. Sci. 2022, 40, 135–149. [Google Scholar] [CrossRef]
  61. Jifon, J.L.; Syvertsen, J.P. Moderate shade can increase net gas exchange and reduce photoinhibition in citrus leaves. Tree Physiol. 2003, 23, 119–127. [Google Scholar] [CrossRef]
  62. Jutamanee, K.; Onnom, S. Improving photosynthetic performance and some fruit quality traits in mango trees by shading. Photosynthetica 2016, 54, 542–550. [Google Scholar] [CrossRef]
  63. Abdul-Baki, A.A.; Stommel, J.R. Pollen Viability and Fruit Set of Tomato Genotypes under Optimumand High-temperature Regimes. HortScience 1995, 30, 115–117. [Google Scholar] [CrossRef]
Figure 1. Combined photos of the sunken solar greenhouse and sensors’ deployment. (a) Outside view of the greenhouse in winter, with front plastic cover facing south and the rolled straw cushion placing on the top of the roof, (b) Inside view with tomato growth, (c) Photosynthetic parameters measurement by the LI-6800 portable photosynthesis system, (d) A view of the meteorological station inside the greenhouse, (e) Soil matric potential measurement using a dial-type tensiometer.
Horticulturae 09 00197 g001
Figure 2. Comparison of diseased leaves (a,b) in the 2019SU season and normal growth leaves (c) in the 2019AW season.
Horticulturae 09 00197 g002
Figure 3. Daily courses of transpiration and photosynthesis rates in July (a), October (c), November (d) and December (e) for healthy plants on sunny days, in August (b) for diseased plants on sunny days and in cloudy days with healthy plants (f).
Horticulturae 09 00197 g003
Figure 4. Daily courses of stomatal conductance for transpiration and photosynthesis rates in July (a), October (c), November (d) and December (e) for healthy plants on sunny days, in August (b) for diseased plants on sunny days and in cloudy days with healthy plants (f).
Horticulturae 09 00197 g004
Figure 5. The relationships between leaf transpiration rate to solar radiation (a), air temperature (b), vapor pressure deficit (c) and the photosynthetic photon flux density (PPFD) reaching to leaf (d).
Horticulturae 09 00197 g005
Figure 6. The relationships between photosynthesis rate to solar radiation (a), air temperature (b), vapor pressure deficit (c) and the photosynthetic photon flux density (PPFD) reaching to leaf (d).
Horticulturae 09 00197 g006
Figure 7. The relationships between stomatal conductance to leaf transpiration to solar radiation (a), air temperature (b), vapor pressure deficit (c) and the photosynthetic photon flux density (PPFD) reaching to leaf (d).
Horticulturae 09 00197 g007
Figure 8. The relationships between water use efficiency at leaf level to solar radiation (a), air temperature (b), relative humidity (c), and vapor pressure deficit (d).
Horticulturae 09 00197 g008
Table 1. Leaf area index (LAI), plant height, and total marketable fresh yield in each tomato growth season.
Planting SeasonsDateLAIPlant Height
(m)
Seasonal Yield
(ton ha−1)
2019SU27 June 20191.41 ± 0.061.02 ± 0.0610.8
15 July 20192.07 ± 0.081.42 ± 0.10
26 July 20192.19 ± 0.131.50 ± 0.09
06 August 20192.27 ± 0.191.60 ± 0.09
16 August 20192.34 ± 0.231.70 ± 0.12
2019AW04 October 20190.92 ± 0.010.81 ± 0.0256.3
26 October 20191.62 ± 0.211.19 ± 0.05
23 November 20191.55 ± 0.441.25 ± 0.06
21 December 20191.68 ± 0.381.23 ± 0.08
2020AW05 October 20202.19 ± 0.021.12 ± 0.0283.6
10 November 20203.31 ± 0.461.54 ± 0.03
26 December 20202.19 ± 0.631.52 ± 0.04
Note: terms ‘SU’ and ‘AW’ in ‘Planting seasons’ column represented the tomato growth season in summer (from May to August) and autumn-winter (from September to January in the following year), respectively.
Table 2. Microclimate parameters inside and outside the sunken solar greenhouse in each tomato growth season.
Planting SeasonsMonthRs
(MJ m−2 d−1)
Ta
(°C)
RH
(%)
VPD
(kPa)
U
(m s−1)
2019SUInside10.93 ± 3.6028.63 ± 2.5077.07 ± 11.251.07 ± 0.470.39 ± 0.07
Outside19.47 ± 6.2327.36 ± 2.1869.36 ± 16.480.97 ± 0.631.49 ± 0.98
2019AWInside6.94 ± 3.6017.84 ± 4.0282.57 ± 9.020.57 ± 0.420.26 ± 0.06
Outside9.95 ± 5.109.04 ± 8.6373.16 ± 14.390.38 ± 0.280.93 ± 0.78
2020AWInside6.49 ± 3.0117.17 ± 2.1982.70 ± 7.380.51 ± 0.230.15 ± 0.04
Outside9.21 ± 3.736.50 ± 6.8468.14 ± 14.740.38 ± 0.261.32 ± 0.80
Disclaimer/Publisher’s Note: The statements, opinions and data contained in all publications are solely those of the individual author(s) and contributor(s) and not of MDPI and/or the editor(s). MDPI and/or the editor(s) disclaim responsibility for any injury to people or property resulting from any ideas, methods, instructions or products referred to in the content.

