Article

Adsorption/Desorption on Macroporous Resins of Okicamelliaside in the Extract of Camellia nitidissima Chi Leaves

1
College of Food and Health, Zhejiang A & F University, Linan 311300, China
2
Tea Research Institute Chinese Academy of Agricultural Sciences, Hangzhou 310008, China
*
Authors to whom correspondence should be addressed.
Horticulturae 2023, 9(2), 166; https://doi.org/10.3390/horticulturae9020166
Submission received: 22 December 2022 / Revised: 23 January 2023 / Accepted: 24 January 2023 / Published: 27 January 2023

Abstract

:
Okicamelliaside (OCS) from Camellia nitidissima Chi (C. nitidissima) leaves can be used in therapeutic drugs or nutritional foods. However, which resin is the best for separating OCS and the underlying mechanism for its superiority remains unclear. In this study, the differences in the adsorption/desorption effectiveness and adsorption kinetics of OCS on five resins were compared. AB-8 was found to be an effective resin for the separation of OCS and the adsorption kinetics followed a pseudo-first order model (R2 > 0.99). In order to optimize the separation of OCS by the resin AB-8, the adsorption time, OCS sample concentration, eluent solvent and volume were tested using a 7 mL column with a diameter of 2 cm. The results showed that the optimum adsorption time was 30 min and the optimum sample concentration was 2.5 mg/mL, while the optimum desorption was achieved by using 2.1 times column volume of 60% ethanol solution. The separation yielded a purified extract with OCS of 290.82 (±2.17) mg/g, which was 6.0 times more than the crude extract (E1, 48.51 (±0.56) mg/g of OCS). This study highlights the use of AB-8 resin for the separation of OCS as an effective technique on the basis of the adsorption/desorption of OCS on the resin. The method has the potential for obtaining green OCS extract with a high OCS content from the crude extract of the leaves of C. nitidissima.

1. Introduction

C. nitidissima is a precious plant species and is widely sought after for its high ornamental value and beneficial health activities [1,2]. Similar to other members in the Camellia genus, C. nitidissima has abundant phenolic components, saponins, polysaccharides and other substances. Pharmacological studies have shown that C. nitidissima exhibits antioxidant, anti-cancer and anti-hyperglycemic effects [3]. Currently, the utilization of C. nitidissima is focused on the flowers, while the research and development of the leaves has gradually become a hot topic in the field of C. nitidissima in recent years since the leaves (Figure 1a) production is much higher than that of the flowers [4].
OCS (Figure 1b) is present in C. nitidissima leaves and its structure was elucidated as 3,4-dioxoloellagic acid 4′-O-β-D-glucopyranoside [5]. OCS showed a 12,000 times higher anti-degranulation activity than that of the anti-histaminic drug, ketotifen fumarate, tested on RBL-2H3 cells [6], and it significantly inhibited the vascular hyperpermeability in a passive cutaneous anaphylaxis mouse model [7]. The experimental results demonstrated that OCS possesses superior anti-allergic properties. Moreover, OCS has been found as a heat shock protein 90 inhibitor, exerting high antitumor activity and low toxicity in vitro [8] and in vivo [9]. The content of OCS in C. nitidissima leaves ranges from 0.51 (±0.04)% to 1.33 (±0.06)% [8], implying that C. nitidissima leaves are a good source of OCS for health products, a possible way to utilize C. nitidissima leaves. However, studies on the green separation of OCS from C. nitidissima leaves are limited [6,8].
Macroporous resins, as a recyclable and environmentally friendly material [10], are characterised by fast adsorption rates [11] and good adsorption effects. They have been widely used in the food and medicine industry [12]. In addition, previous studies have shown that different adsorption/desorption conditions greatly influence the situation [13]. Therefore, it would be better to optimize the separation conditions to further improve performance [14,15].
In this study, the adsorption/desorption of OCS on different resins were compared and the separation condition with AB-8 resin was optimized to obtain a green OCS extract with high OCS content.

2. Materials and Methods

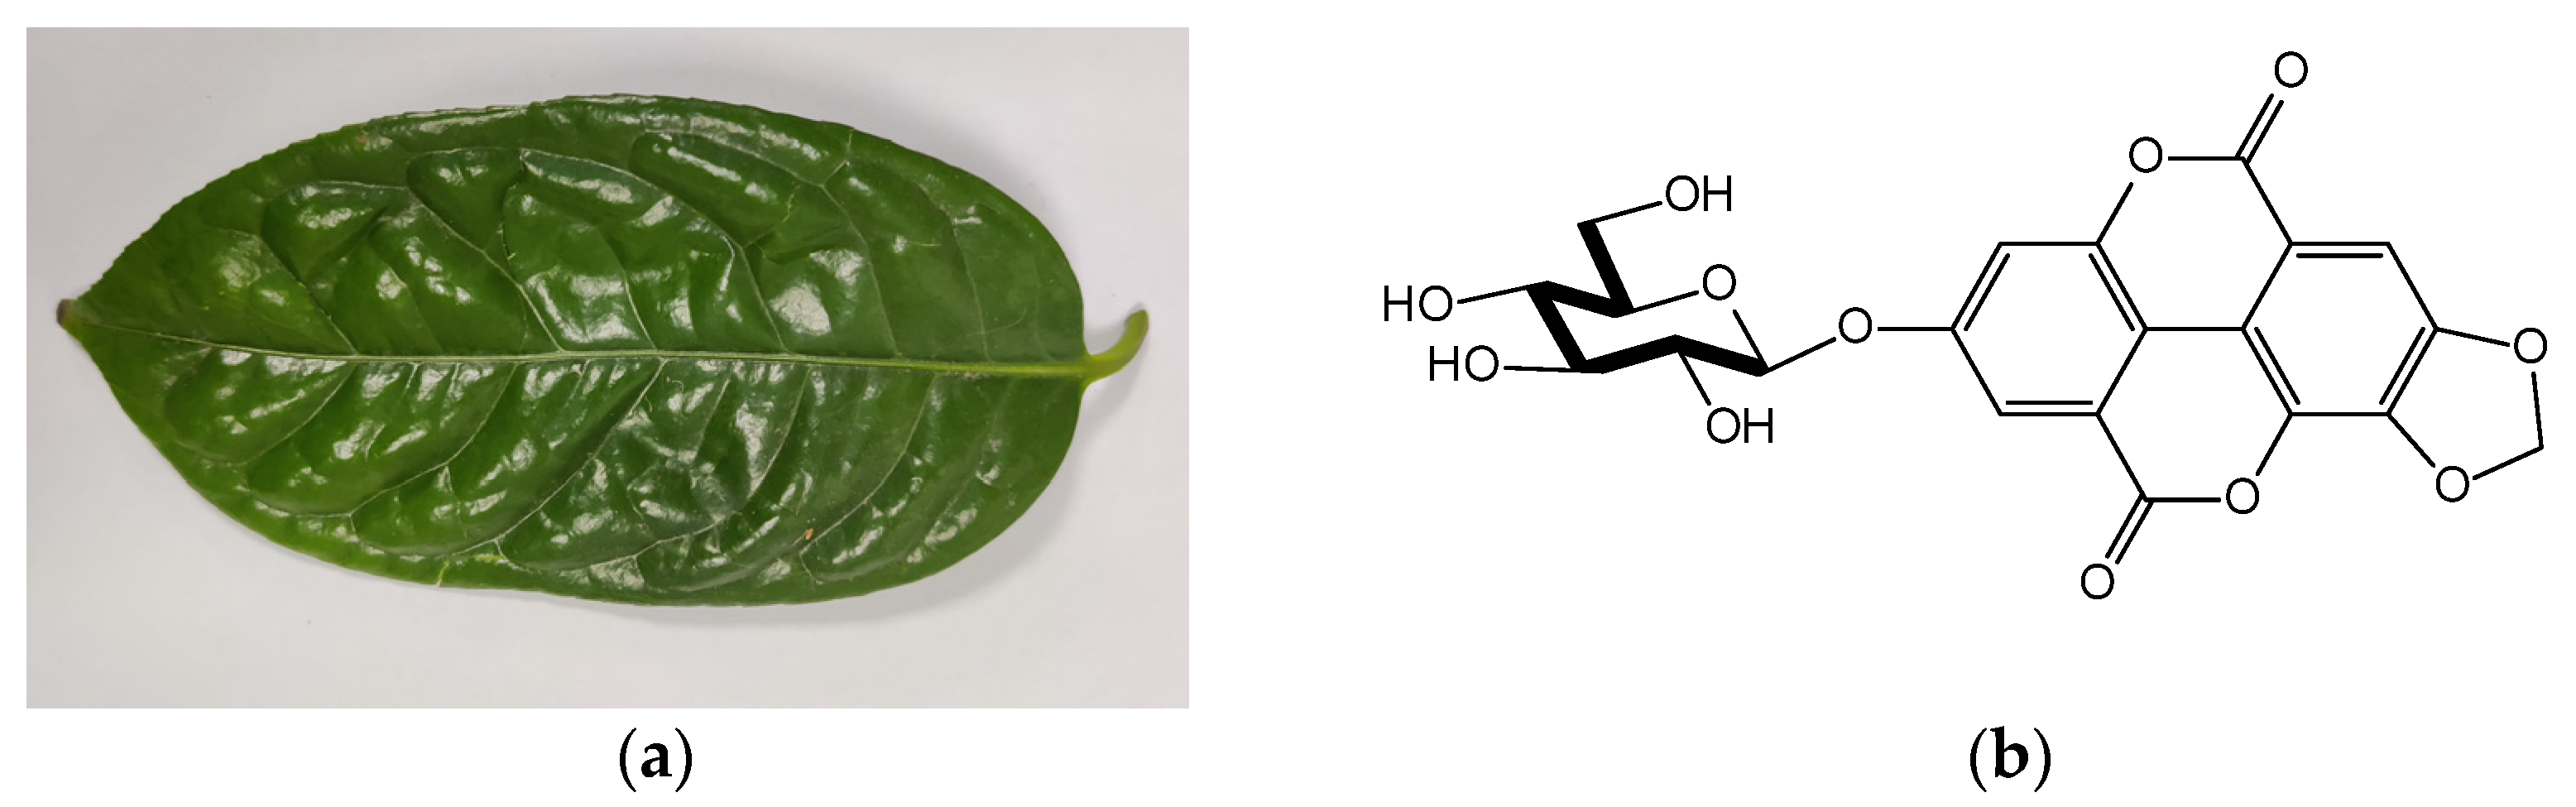
2.1. Plant Materials

Freeze-dried C. nitidissima leaves were provided by Fujian Century C. nitidissima Technology Co., Ltd., Longyan, China. They were powdered using a mechanical pulveriser (Xichu 800Y, Jinhua, China). The powder (moisture content of 8.87 (±0.10)%) is then manually shaken through a 60-mesh sieve to remove oversized particles ensuring that the powder is well homogenised and in full contact with the extraction solution for full extraction. The leaf powder was stored in a foil bag at −20 °C until use.

2.2. Preparation of Crude OCS Extract E1

A total of 1.00 g of dried leaves powder and 30 mL of ethanol: water (60:40 v/v) were mixed in a beaker and the beaker was placed in an electric thermostatic water bath (Jinghong DK-S26, Shanghai, China) at 80 °C for 10 min to extraction. After completion of the water bath, the extracts were centrifuged (Eppendorf 5810R, Hamburg, Germany) at 8000 rpm for 10 min at 20 °C. The anhydrous ethanol was added to the supernatant to reach a final concentration of 70%. The mixture was precipitated overnight. The supernatant was then concentrated in a rotary evaporator (BUCHI Labortechnik AG V-850 vacuum controller and R-215 rotavapor, Flawil, Switzerland) until all the ethanol in the solution was removed and the rotary evaporation ended. The concentrate was then freeze-dried to give the final crude extract E1. E1 is powdered and yellow-brown in color.

2.3. Reagents

OCS standard was purchased from Yuanye Bio-Technology Co., Ltd. (Shanghai, China). AB-8 and D101 macroporous resins were purchased from Macklin Biochemical Co., Ltd. (Shanghai, China). DM130, HPD100 and NKA-9 macroporous resins were purchased from Solarbio Science & Technology Co., Ltd. (Beijing, China). Pure water was purchased from Wahaha Group Co., Ltd. (Hangzhou, China). Ethanol was purchased from Yonghua Chemical Technology Co., Ltd. (AR, Suzhou, China).

2.4. Analysis of OCS Using the UHPLC-Q Exactive Orbitrap-MS Method

The ultrahigh-performance liquid chromatography-Q Exactive Orbitrap-mass spectrometry (UHPLC-Q Exactive Orbitrap-MS) analysis method was an adaptation based on previous work in our group [16,17]. Infusions were filtered through a 0.45 µm Millipore filter before injection to an UHPLC-Q Exactive-MS system (Thermo Fisher Scientific, Rockford, IL, USA). The injection volume was 3 μL. The separation was carried out, using an ACQUITY UPLC HSS T3 column (1.8 μm, 2.1 mm × 100 mm, Waters, Milford, MA, USA) and the temperature was maintained at 40 °C. Mobile phase A was H2O with 0.1% FA and mobile phase B was acetonitrile. The elution gradient started with 5% phase B and was linearly increased to 10% B at 2 min, then continued to increase to 35% B at 6 min to 100% B at 8.5 min and maintained for 1 min, finally decreased to 5% B at 10 min and maintained for 2 min. The total analysis time was 12 min and the flow rate was 0.3 mL/min.
The MS condition was set at the negative ion mode as follows: the scan range was mass-to-charge ratio (m/z) 66.7–1000, the spray voltage was 3.1 kV, the normalized collision energy was 30%, and the flow rate of sheath gas and auxiliary gas was 45 and 10 (in arbitrary units). The temperatures of capillary and auxiliary gas heater were set at 320 °C and 300 °C, respectively. The m/z of OCS is 475.0513. Under these conditions, the conversion formula for peak area to content was calculated as: OCS (mg/mL) = area/(4 × 10−7).

2.5. Optimization of the Separation Conditions of OCS

2.5.1. Selection of Macroporous Resin

Five macroporous resins (Table 1), including HPD100, D101, DM130, AB-8 and NKA-9, with different polarities were employed to evaluate their suitability in separating OCS. The adsorption/desorption capacity, adsorption/desorption rate and the fitting model for the adsorption kinetics of each resin were investigated.
The resins were soaked in 95% ethanol for 24 h, the pH of HPD100, D101, DM130, AB-8 and NKA-9 resins at equilibrium are 8.33 (±0.13), 7.45 (±0.67), 9.14 (±0.17), 7.35 (±0.34) and 8.80 (±0.33), respectively. After washing with pure water, resins were dried with a water-circulation multifunction vacuum pump (Great Wall Scientific Industry and Trade SHB-Ⅲ, Zhengzhou, China).
To define the adsorption capacity for OCS, 5.0 g of each dried resin was weighed into a beaker and then 50 mL of 10 mg/mL crude extract E1 solution was added. The beaker was shaken for 10 h using an orbital shaker (Qilinbeier KB-900, Haimen, China) at 120 r/min until static adsorption equilibrium was reached. The content of OCS in the solution was analyzed every 30 min for the first 5 h and then every 60 min for the other 5 h. The adsorption capacity (1) and adsorption rate (2) were calculated using the following equations:
Qe = C 0 C 1 M 1 × V 1
A = C 0 C 1 C 0 × 100 %
where Qe is the adsorption capacity at adsorption equilibrium (mg/g); C0 and C1 are the initial concentration and adsorption equilibrium concentration of OCS in solution (mg/mL), respectively; V1 is the volume of crude extract E1 solution (mL); M1 is the weight of resin (g); and A is the adsorption rate at adsorption equilibrium (%).
After adsorption, 3.0 g of adsorption-saturated resin was mixed with 100 mL of 90% ethanol solution and then shaken for 12 h at 120 r/min until static desorption equilibrium was reached. The desorption capacity (3) and desorption rate (4) were calculated using the following equations:
Qe = C 2 V 2 M 2
D = C 2 V 2 ( C 0 C 1 ) V 1 × 100 %
where Qe’ is the desorption capacity at desorption equilibrium (mg/g); D is the desorption rate at desorption equilibrium (%); C2 is the concentration of OCS in desorption solution (mg/mL); V2 is the volume of desorption solution (mL); and M2 is the weight of resin (g).
In order to evaluate the adsorption kinetics, the obtained results were fitted using two widely used kinetic models, the pseudo-first-order (5) and pseudo-second-order models (6):
Ln (Qe − Qt) = −k1t + lnQe
t Qt = 1 k 2 Q e 2 + t Qe
where Qt is the adsorption capacities at time (mg/g); t is time (min); k1 is the rate constants of the pseudo-first-order models (min−1); k2 is the rate constants of the pseudo-second-order models (g/(mg·min)) [18].
The fit of each model to the experimental data was estimated using the linear regression correlation coefficient (R2) [19].

2.5.2. Measurement of the Dynamic Adsorption of the Optimal Resin

Dynamic breakthrough curve experiment was carried out as follows: the column (20 × 100 mm) was wet packed with 5.0 g of the optimal macroporous resin (AB-8), and 1–2 bed volume (BV) was eluted with pure water to eliminate bubbles in the column [20,21]. A 5 mg/mL crude extract E1 solution was uniformly added with a peristaltic pump (Lead Fluid BT103S-YZ15, Baoding, China) at a flow rate of 2 mL/min until the macroporous resin was adsorbed and saturated; the content of OCS in the effluent was analyzed every 5 min. The leakage point and saturation point were defined as the point when the content of OCS in the effluent reaches 10% and 100% of that in the initial solution, respectively.
To investigate the effect of adsorption time and sample concentration on the adsorption performance of AB-8, the pre-treatment was the same as above. A 5 mg/mL crude extract E1 was adsorbed for different time (10, 20, 30, 40 and 50 min), and 60 mL of crude extract E1 with different concentrations (2.5, 5, 7.5, 10 and 12.5 mg/mL) were adsorbed for 30 min. The content of OCS in each eluted solution was determined.

2.5.3. Measurement of the Dynamic Desorption of the Optimal Resin

Dynamic desorption was performed after dynamic adsorption equilibrium. To investigate the effect of ethanol content on the desorption performance of AB-8, the column (20 × 100 mm, 7 mL) was eluted with five different ethanol solutions (30, 40, 50, 60 and 70%) at a flow rate of 2 mL/min to recover the adsorbate; the elution volume of each column was constant by being maintained at 15 mL. To investigate the effect of elute volume, different volume of 60% ethanol (5, 10, 15, 20 and 25 mL) were utilized to desorb the OCS at the same rate as above. The content of OCS in each eluted solution was determined.
To obtain the elution curve, after adsorptive equilibrium, the column was eluted with 60% ethanol at a speed of 2 mL/min. The effluent was collected in the same tube every 3 mins. The collection was stopped when the effluent was colorless. The content of OCS in each collected tube was measured.

2.6. Validation Experiment

According to the method and experimental results in 2.5., 5.0 g of the pretreatment of AB-8 resin was weighed into a column (20 × 100 mm, 7 mL) and eluted with pure water until no air bubbles were present. A total of 10 mL of crude extract E1 solution (2.5 mg/mL) was added uniformly at a flow rate of 2 mL/min. The column was desorbed with 60% ethanol solution at a flow rate of 2 mL/min for 15 mL. The eluate was concentrated in a rotary evaporator to remove all the ethanol from the solution and then freeze-dried to obtain a further refined extract E2 and the content of OCS was determined.

2.7. Statistical Analysis

All the data are presented as mean ± standard deviation. Figures were plotted using GraphPad Prism 8.0.2. The parameters of the adsorption kinetic model were calculated by Origin 2022b.

3. Results and Discussion

3.1. Screening of Optimal Resin

The adsorption/desorption capacity and rate are regarded as the main benchmarks for selecting resins [19]. Here, the OCS adsorption/desorption capacity and rate of five resins, including HPD100, D101, DM130, AB-8 and NKA-9, were investigated.

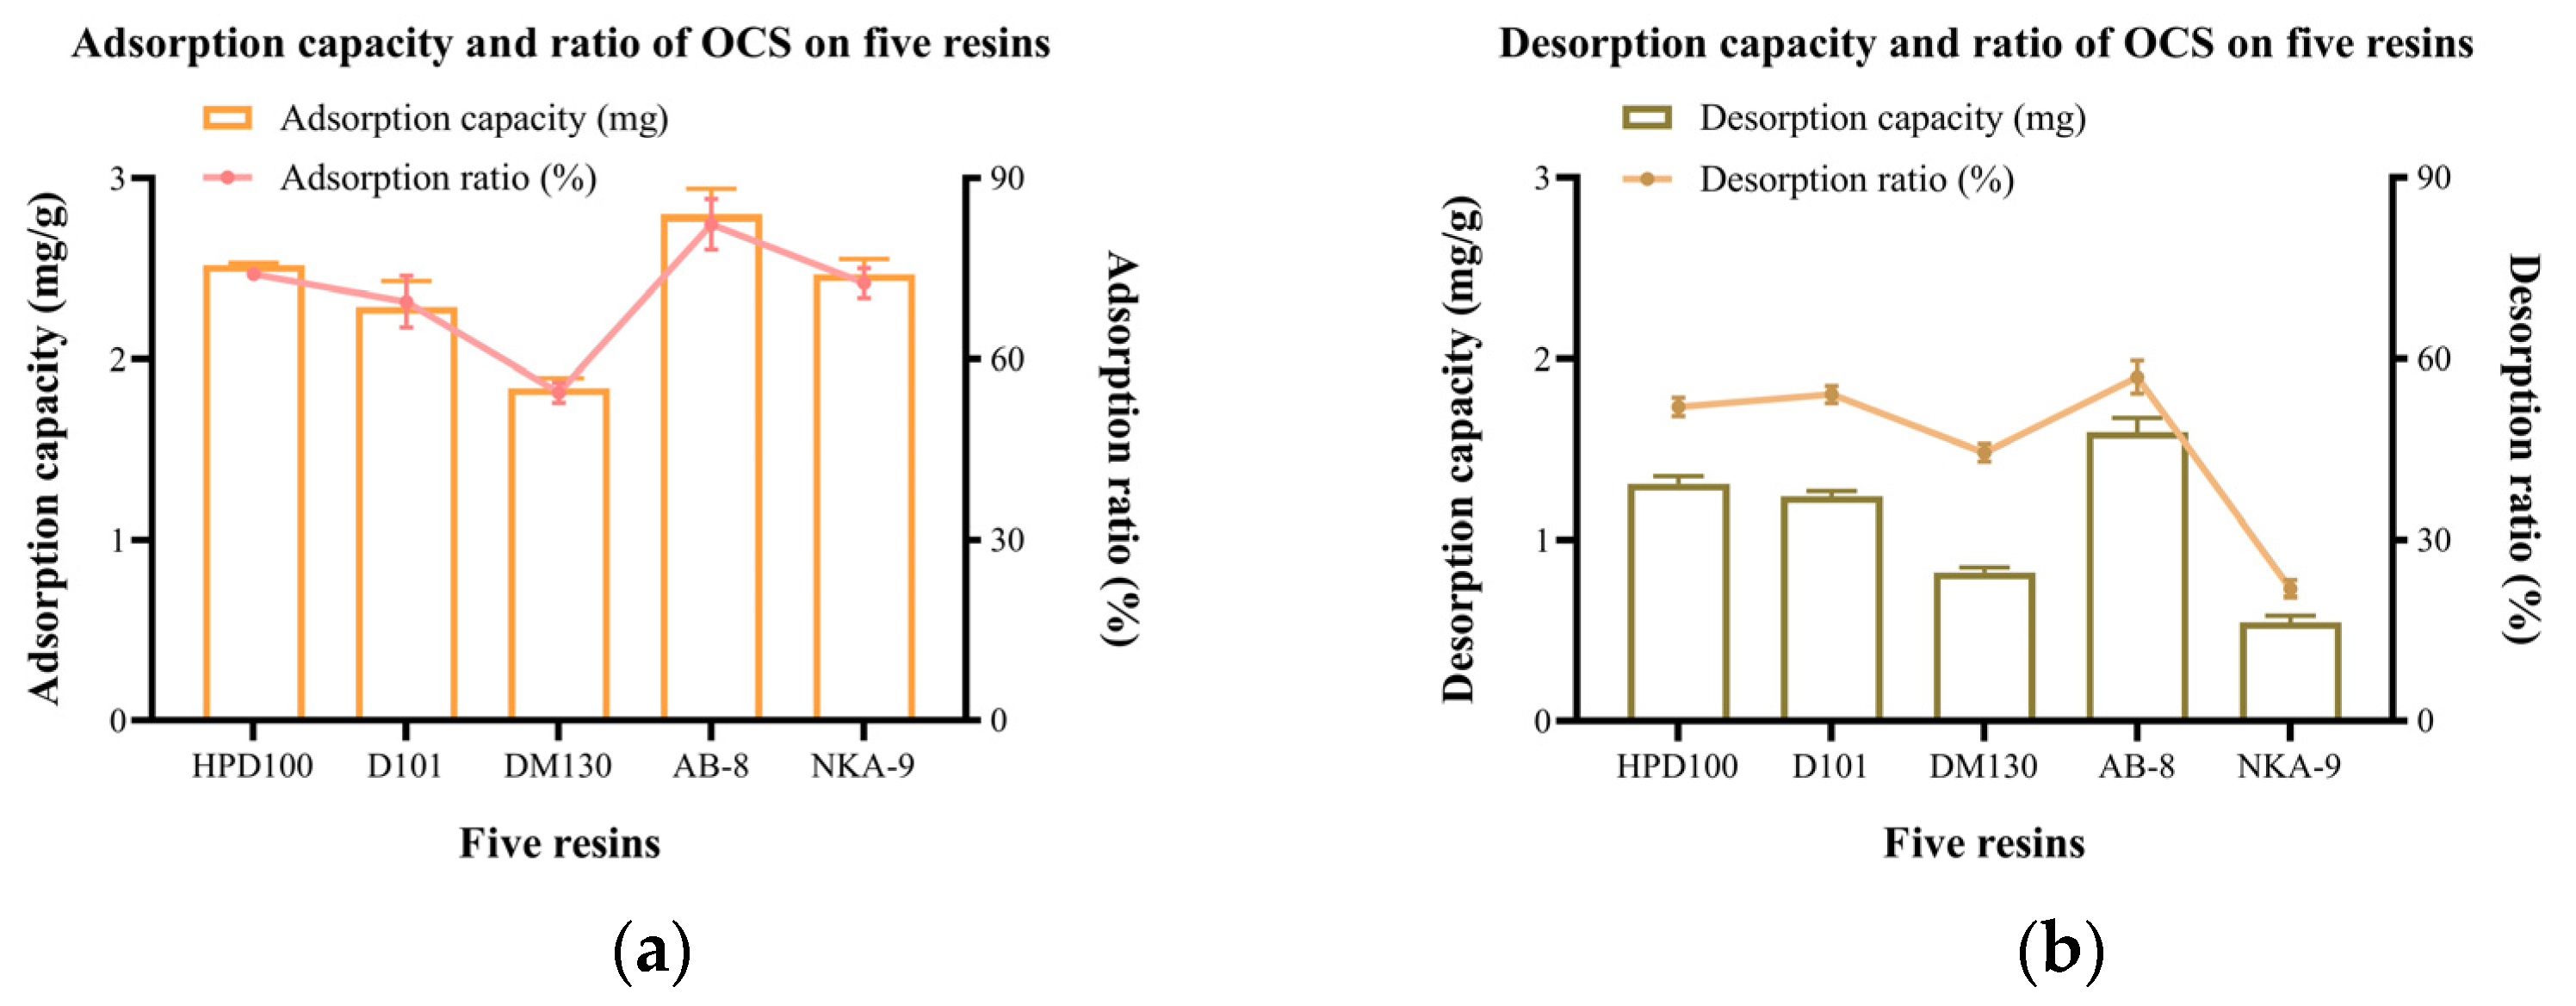
3.1.1. The Adsorption Capacity and Rate of Five Resins

Adsorption capacity describes the amount of OCS adsorbed on each gram of resin. Adsorption rate is the percentage of OCS adsorbed by the resin from the extraction [22]. Figure 2a shows that the adsorption capacity of the five resins was in descending order: AB-8 > HPD100 > NKA-9 > D101 > DM130. AB-8 had the highest adsorption capacity and rate of 2.80 (±0.14) mg/g and 82.39 (±4.16)%, respectively. HPD100, NKA-9 and D101 followed closely; their adsorption capacities ranged from 2.29 to 2.52 mg/g and adsorption rates were all above 70%. Overall, the adsorption of these four resins was relatively good. The DM130 resin had an adsorption capacity of less than 2.00 mg and were significantly less effective than the remaining four.
The interactions of the solute and resin is a physical process, in which van der Waals forces, hydrogen bonding, and π-π conjugation are involved [21,23]. Since polyphenols are polar macromolecules with hydrogen donors and functional groups (phenolic hydroxyl, carbonyl, methoxy groups etc.) [24], weak polar and polar resins have better adsorption characteristics on polyphenols than non-polar resins [25]. The adsorption capabilities of resins are also related to the pore diameter and specific surface area of the resins [22]. The large specific surface area facilitates adsorption, which explains why the adsorption of NKA-9 is lower than the other four resins. The large mean pore size facilitates the passage of molecules [26]. The mean pore size shows a positive correlation with the adsorption/desorption capacity. Although HPD100 and D101 have similar polarities, HPD100 provides a higher mean pore size leading to a better adsorption capacity of OCS. Similar phenomena was also observed for AB-8 and DM130.

3.1.2. The Desorption Capacity and Rate of Five Resins

Desorption capacity describes the amount of OCS desorbed on each gram of OCS-saturated resin. Desorption rate is the percentage of OCS desorbed from the resins by the desorbing solvent [22]. Figure 2b shows the desorption capacity and rate of the five resins. Among the five resins, the highest desorption capacity and rate was AB-8, which were 1.60 (±0.08) mg/g and 56.99 (±2.69)%, respectively. It may be attributed to the large mean pore size. The polarity of the resin may also affect the desorption capacity. NKA-9, which had a larger mean pore size than AB-8, did not have a stronger desorption capacity of OCS. This is likely due to the fact that NKA-9 was a polar resin and had a strong interaction with the hydroxyl groups in the OCS molecules, making it difficult to desorb. HPD100 and D101 were second only to AB-8 in terms of desorption capacity. The resin with the highest desorption capacity did not assure a high desorption rate because the five resins had different adsorption capacities, i.e., different C1 in Equation (4). It explains why HPD100 had a higher desorption capacity but a lower rate than D101. The desorption capacity of DM130 was less than 1.00 mg/g but the rate was 44.42 (±1.44)% due to the low adsorption capacity of the resin.

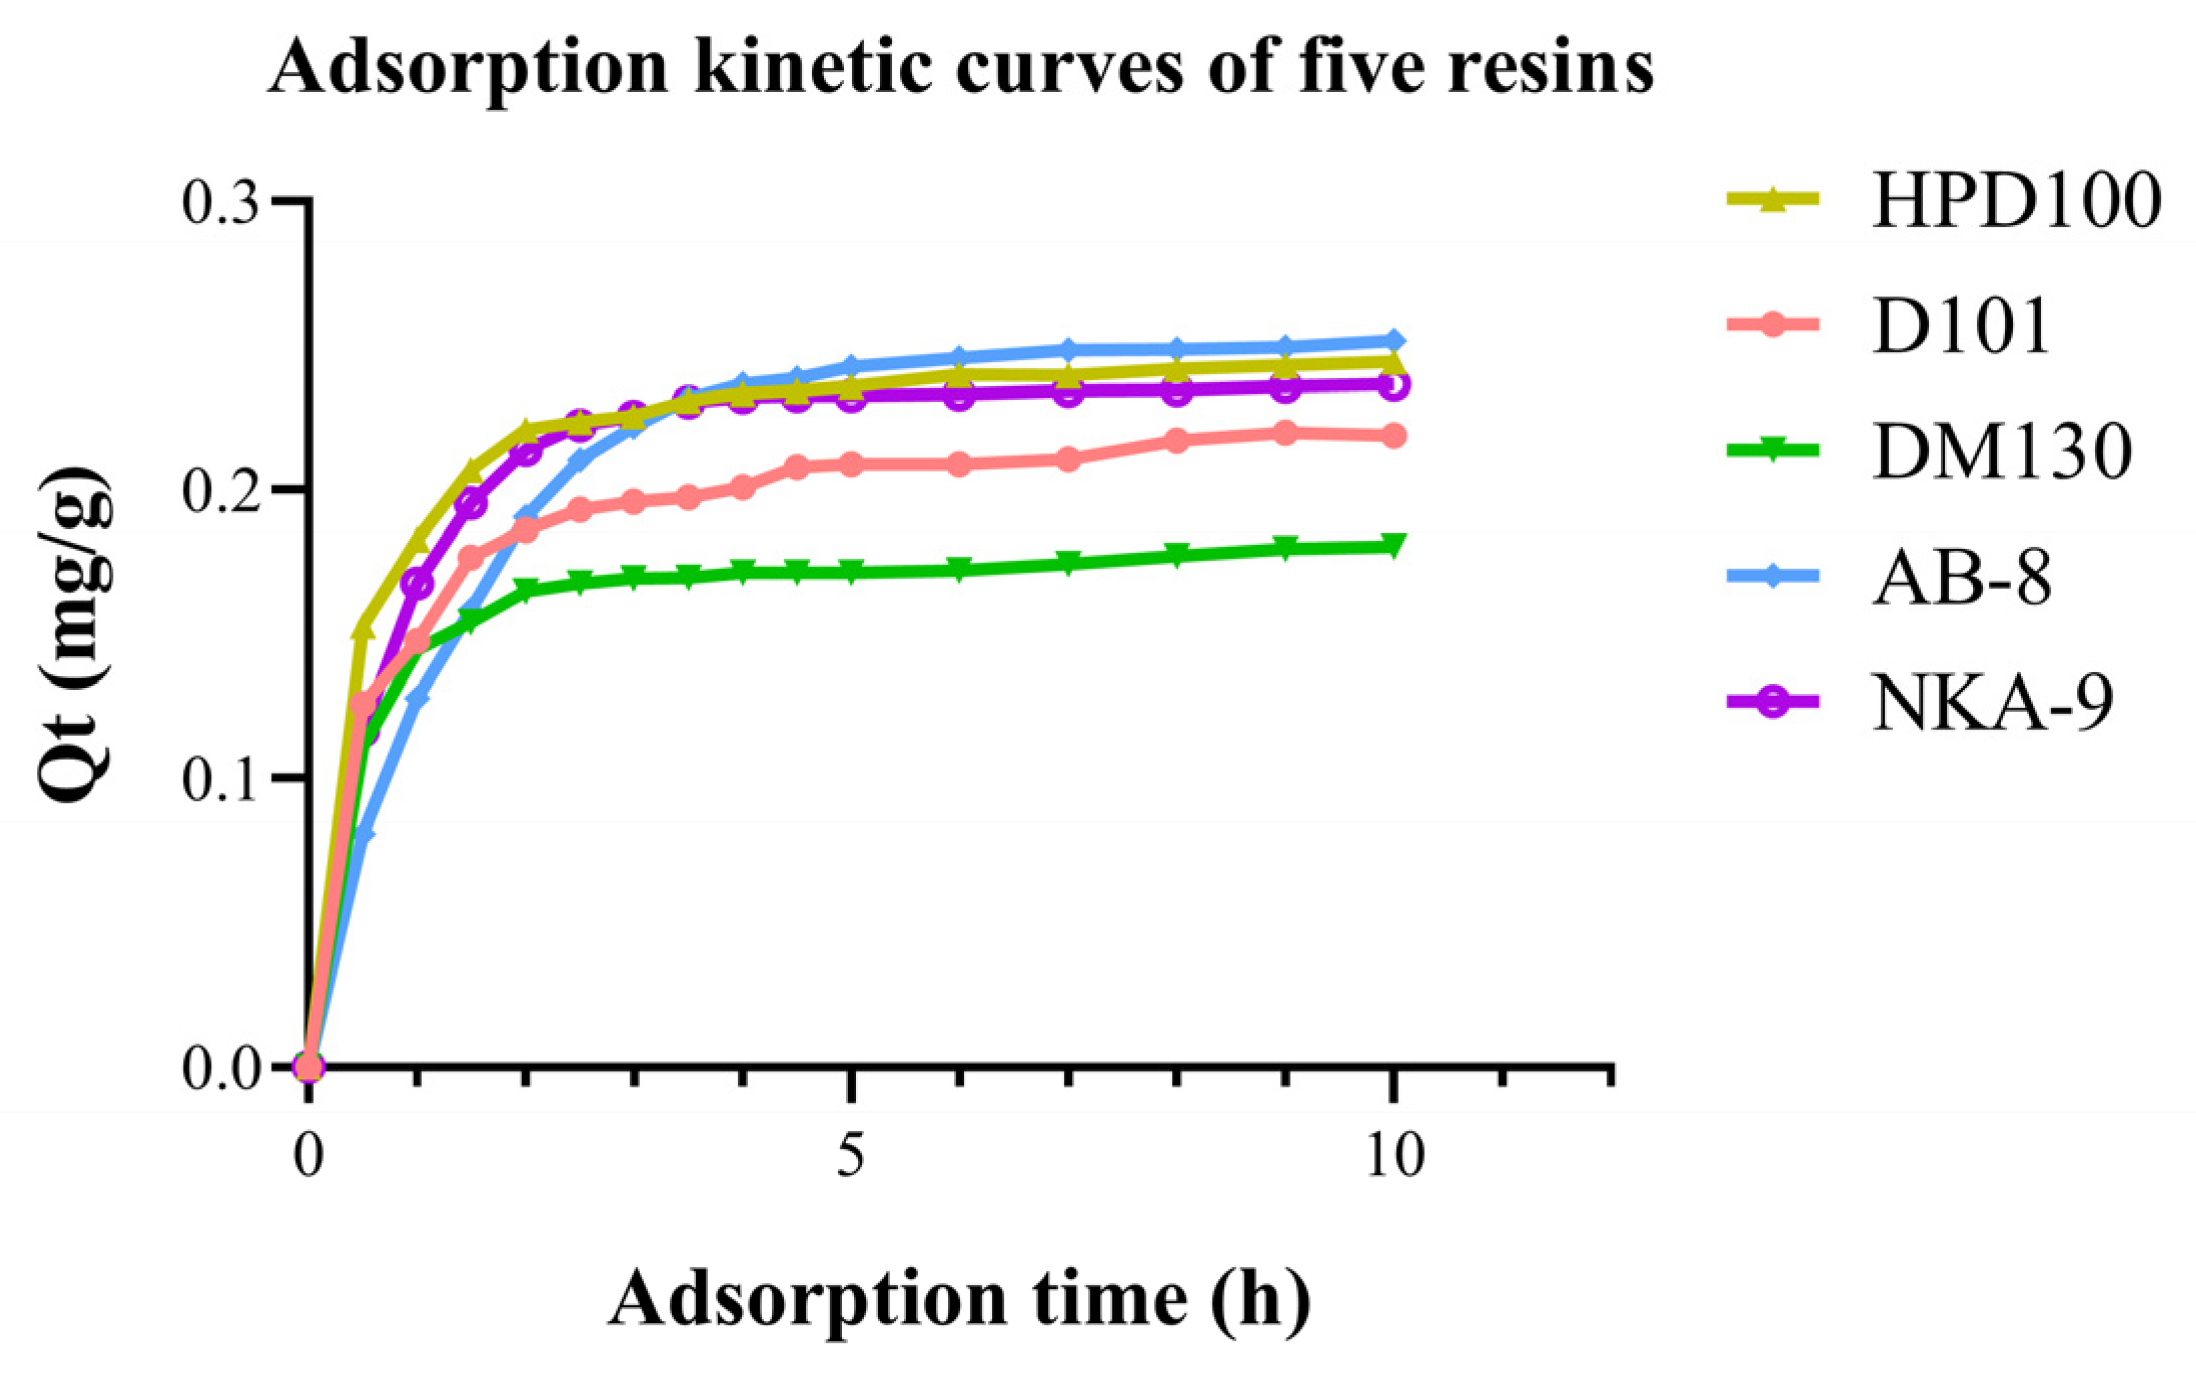
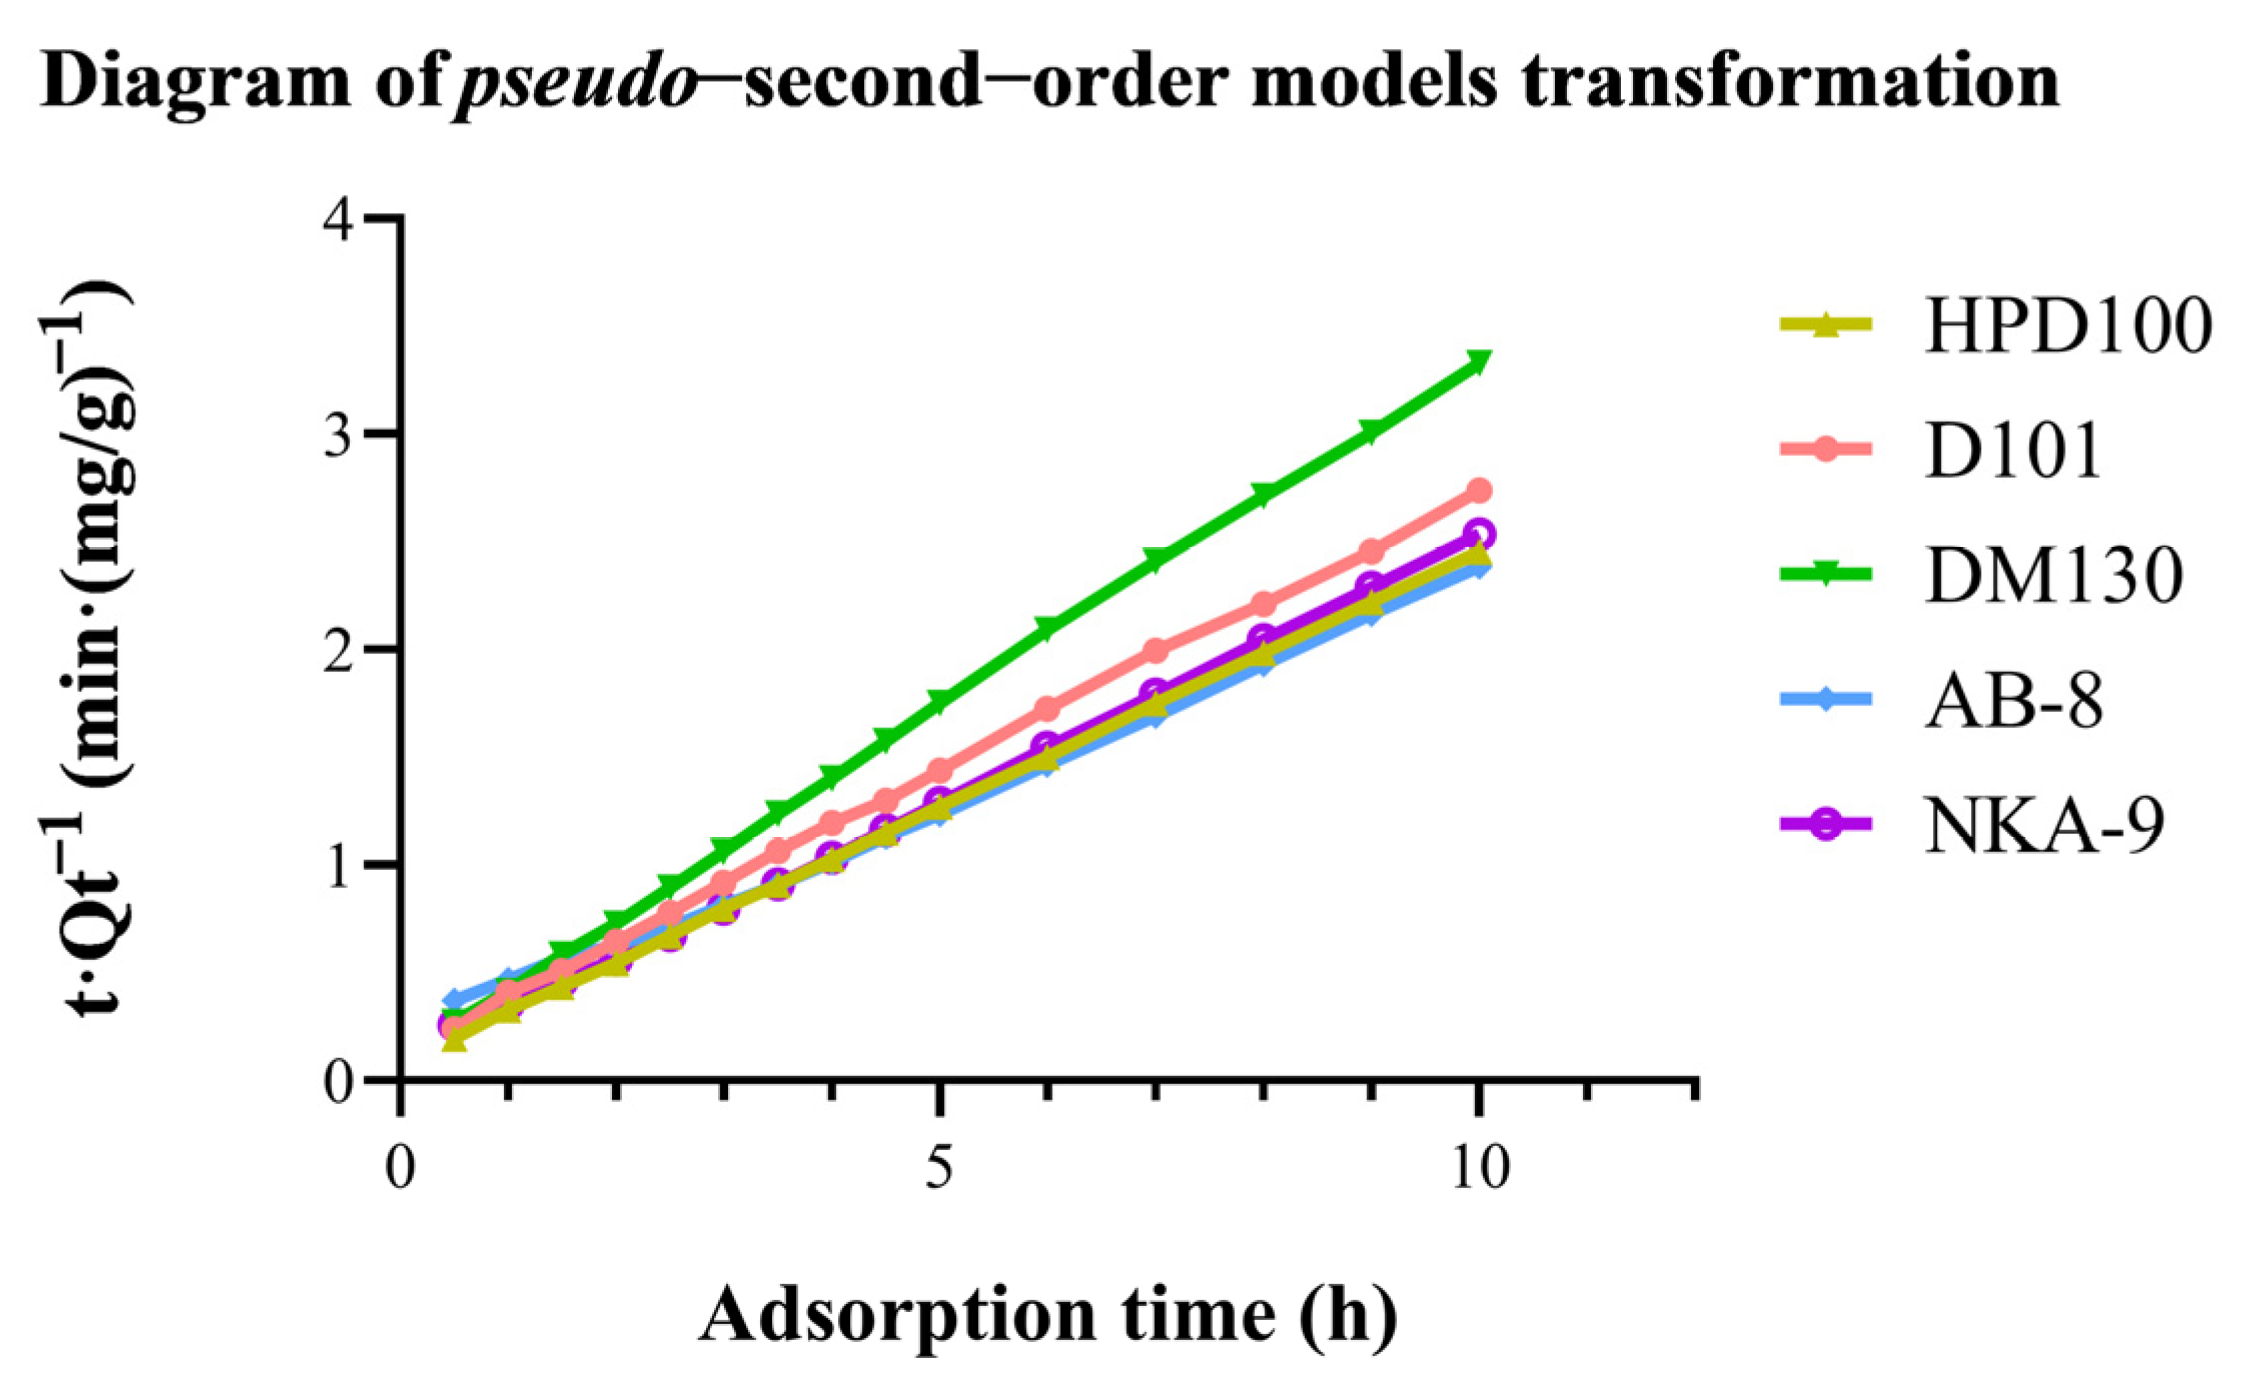
3.1.3. Adsorption Kinetics of OCS

The adsorption capacity and rate reflect the adsorption characteristics of resins at equilibrium. The adsorption of a substance by the resin is a dynamic process, which is usually non-linear and consists of different stages. In general, due to mass transfer in the boundary layer, molecules are diffused into the pores of the adsorbent and/or are adsorbed by the surface-active sites of the adsorbent [27]. In order to clarify the diffusion process of particles in macroporous resins, Lagergren first proposed the PFO model in 1898 [28], which is divided into pseudo-first-order and pseudo-second-order models [29]. The pseudo-first order model is generally more applicable to the initial adsorption process, whereas the pseudo-second order model is able to predict the state of the entire adsorption process and considers chemisorption to be important in the adsorption process [30].
The adsorption kinetics of OCS from crude extract E1 with five resins are shown in Figure 3. The adsorption quantity increased with time but the rate of adsorption tends to increase and then slow down with time. The AB-8 resin had the highest adsorption capacity but the slowest increase in OCS adsorbed in the first 90 min. It also took the longest to reach equilibrium, which was approximately 300 min. The HPD100 resin showed the fastest adsorption rate in the early stages, followed by NKA-9. After 150 min, only a minor change was observed because the surface binding sites of the macroporous resin were mostly saturated. This meant that the HPD100 and NKA-9 resins basically reached equilibrium after 150 min. The early adsorption rates of D101 and DM130 resins were higher than those of AB-8 but the adsorption equilibriums were reached more quickly and the adsorption was almost completed after 120 min, so the overall adsorption capacities were slightly lower than AB-8.
The experimental data were fitted to both models to test which model better described the adsorption process of OCS. The diagram of the pseudo-second-order model transformation is in Figure 4. The equations of kinetics models and dynamic parameters are in Table 2. A higher correlation coefficient represents a higher degree of agreement between the experimental and calculated values, which means that the resin is more similar to whichever class of model it fits. Clearly, AB-8 resin is more suitable for a pseudo-first order model. However, the correlation coefficients of AB-8 resin for both models were close to 1 (R2 > 0.99), indicating that both models were good predictors of the kinetics of OCS adsorption by AB-8 macroporous resin. For the other four resins, the pseudo-second-order model seems to be a better fit. This suggests that the adsorption process of OCS on the resins may be a chemisorption process. Previous studies indicated that the absorption kinetics of polyphenols by resins tended to fit the pseudo-second-order model. Wang et al. [31] found that the adsorption process of AB-8 and HPD100 resins in the separation of total flavonoids of Acanthopanax senticosus was in accordance with the pseudo-second-order model. Additionally, Si et al. [32] considered that the kinetics of the adsorption of D101 macroporous adsorbent resin from aqueous solution on the phloridzin was in accordance with the pseudo-second-order model. Our results provided more evidence of the perspective.
Both the adsorption/desorption characteristics and adsorption kinetic results indicated that AB-8 was the best choice for the purification of OCS among the five tested resins. The pseudo-first-order model accurately described the adsorption process (R2 > 0.99), which further explained and supported the kinetic mechanism of OCS purification by AB-8 from a theoretical perspective.

3.2. Dynamic Adsorption/Desorption of AB-8 Resin

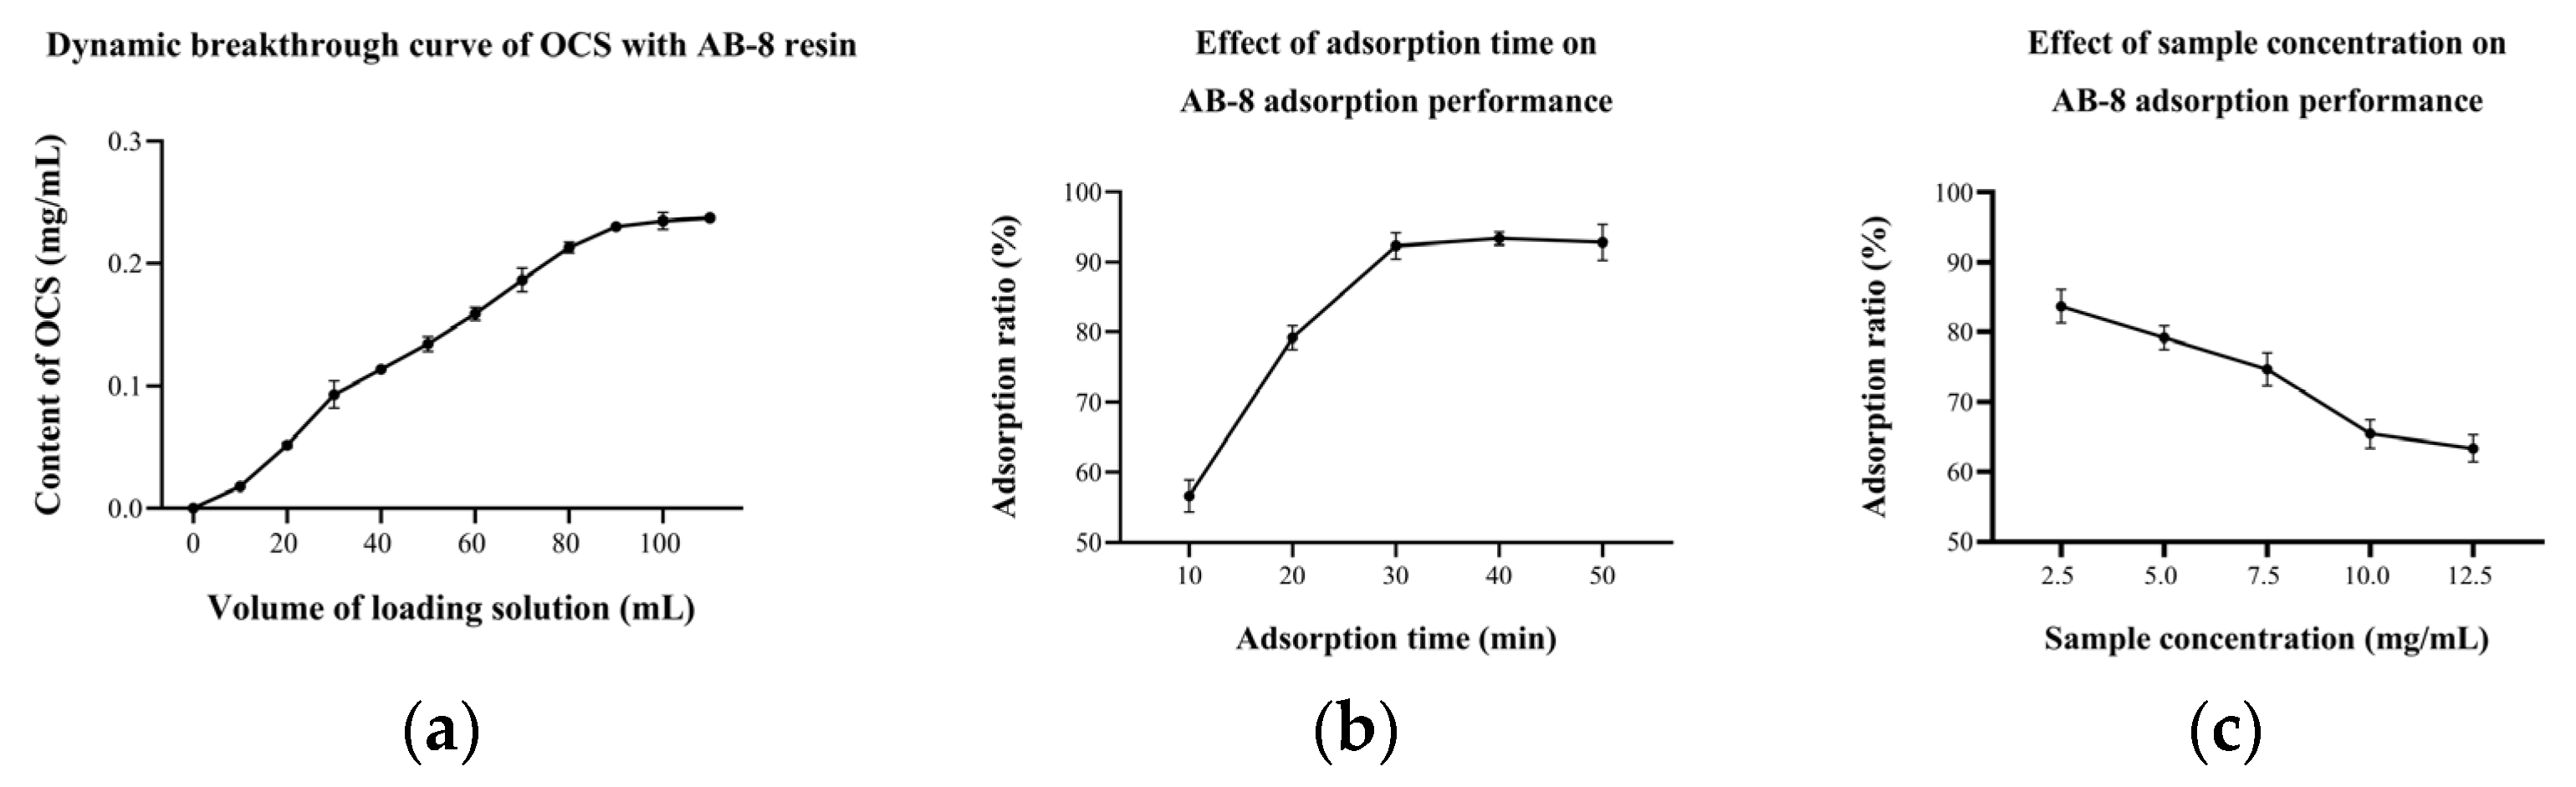
3.2.1. Dynamic Adsorption of AB-8 Resin

The above experiments were carried out under static adsorption/desorption conditions. However, the actual separation of OCS using the column chromatography takes place under dynamic adsorption/desorption conditions. At the beginning, molecules are easily adsorbed by the resin, due to its large surface area and highly porous structure, but as the adsorption continues, the adsorption capacity of the resin starts to decrease and gradually it cannot hold all the target molecules and the solute starts to leak [22]. The OCS concentration in the initial E1 solution (5 mg/mL) was 0.24 mg/mL. The concentration of OCS in the leaking solution reached 10% of the original solution as the leakage point and 100% as the saturation point in this study, i.e., the leakage point and saturation point were reached at 10 and 100 min, respectively (Figure 5a). This meant that the adsorption capacity of AB-8 kept at the first 10 min and then gradually decreased. The dynamic equilibrium of adsorption and desorption of OCS occurred at 100 min, after which it was meaningless to extend the adsorption time even further.
Previous studies suggested that the dynamic adsorption rate was affected by the adsorption time and sample concentration [13,33]. Results demonstrated that increasing the adsorption time led to higher adsorption rate to some extent (Figure 5b). When the adsorption time was 10 min, the adsorption rate was only 56.61 (±2.28)%. The rate reached 92.31 (±1.85)% when the time was increased to 30 min, which was about 1.6 times higher than the former. As the adsorption time increased, the substance was given more opportunity to interact with the resin and consequently increased the adsorption rate. However, the adsorption capacity was limited, so the adsorption rate no longer increased after 30 min. In contrast to adsorption time, the sample concentration was negatively correlated to the adsorption rate (Figure 5c). At a sample concentration of 2.5 mg/mL, the adsorption rate was approximately 83.70 (±2.40)%. While the sample concentration was 12.5 mg/mL, the adsorption rate dropped to only 63.35 (±1.91)%. A high sample concentration meant that more adsorbent molecules interacted with the active center of the resin at the same time [34]. However, if the sample concentration was too high, in which the condition of the number of molecules exceeded the adsorption capacity of the resin, a negative relationship between the sample concentration and the adsorption rate could be drawn.

3.2.2. Dynamic Desorption of AB-8 Resin

The dynamic desorption rate depends on the eluent, elution volume and others [35,36]. The results showed that the ethanol content of the eluent had a strong influence on the desorption of OCS (Figure 6a). When the ethanol content was 30%, the desorption rate was only 31.16 (±1.64)%. As the ethanol content continued to increase, the desorption rate also increased, reaching 79.94 (±2.74)% when the ethanol content of the eluent was 60%. The resin elution is in fact a contest of forces between the substance to be separated, the macroporous resin and the elution solvent. When the ethanol content increases, the solubility of the target organic increases on the one hand, and the swelling of the macroporous resin increases on the other, so that the target organic is easily dissolved in the elution solvent and eluted. The effect of the elution volume on the desorption performance of AB-8 showed an increase followed by a plateau (Figure 6b), with the desorption rate above 80% when the elution volume exceeded 15 mL, achieving a relatively good desorption. The increase in elution volume represented an increase in elution time and more opportunity for the resin to interact with the eluate, thus increasing the resolution rate. However, the residual amount of OCS in the resin gradually decreased, so the desorption no longer increased significantly after elution volumes above 15 mL.
After the adsorption phase, dynamic desorption was carried out using a 60% ethanol solution at a flow rate of 2 mL/min. The desorption curve of OCS with AB-8 resin (Figure 6c) suggested that the amount of desorbed OCS reached the maximum when the elution volume was 18 mL and then began to decrease, indicating that OCS desorbed fast in the early stages. The desorption ended when the elution volume was 78 mL. It was notable that when the elution volume was bigger than 48 mL, the OCS content in the effluent was already lower than 0.05 mg/mL because the content of remaining OCS in the resin was limited and, therefore, desorption is considered to be essentially complete at this point.
After optimization of the column separation conditions for E1, the results of the study showed that the optimum adsorption time and sample concentration were 30 min and 2.5 mg/mL for the 7 mL of column, respectively. The best desorption was achieved by an elution with 15 mL of 60% ethanol solution.

3.2.3. Validation Experiment Results

Based on the above experimental results, a column model with the same experimental conditions as above was developed to pass the 2.5 mg/mL of E1 solution through the column using optimal adsorption/desorption conditions. The collected 15 mL of eluate was concentrated in a rotary evaporator to remove all the ethanol from the solution and then freeze-dried to obtain a further refined extract E2. E2 is powdered, yellow in color and contains 290.82 (±2.17) mg/g of OCS, which was 6.0 times higher than E1 (48.51 (±0.56) mg/g of OCS). All the above figures showed the effectiveness of the optimization.
In addition to this, in contrast to the first OCS extraction by Japanese scholars, who used toxic reagents and three fillers (Diaion HP-20, Wakogel 50C18 and Toyopearl HW40F) to isolate OCS from Camellia japonica [5], the method proposed in this study is greener, simpler and faster. Currently, the available literature on the purification of OCS from C. nitidissima leaves is very limited and there is a lack of theory and understanding of the kinetics of OCS adsorption on resins. This study describes the rationale for the selection of AB-8 and systematically investigates the various adsorption/desorption characteristics of AB-8 on OCS and attempts to determine the optimum conditions. In conclusion, this study provides a theoretical basis for the application of OCS in food and pharmaceuticals.

4. Conclusions

In this study, the adsorption/desorption characteristics of OCS on five resins were investigated based on the adsorption/desorption equilibrium and adsorption kinetics. AB-8 resin was found to be an effective resin to adsorb OCS, which followed a pseudo-first-order kinetic model (R2 > 0.99). On this basis, the optimum adsorption/desorption conditions were further determined; it was found that the optimum adsorption time and sample concentration were 30 min and 2.5 mg/mL, respectively, while the optimum desorption was achieved by using 2.1 times the column volume of 60% ethanol solution. The separation by using AB-8 resin could increase the OCS content of the extract from 48.51 (±0.56) mg/g to 290.82 (±2.17) mg/g. This has the potential to prepare a green OCS extract with high content from the leaves of C. nitidissima for health products, providing some theoretical basis for the application of OCS in food and pharmaceuticals. It likewise suggests new ideas for the utilization of C. nitidissima leaves.

Author Contributions

Conceptualization, H.Z. and Y.G.; methodology, H.Z. and J.Z.; validation, X.M.; data curation, H.Z.; writing—original draft preparation, H.Z.; writing—review and editing, Y.G., J.Z., Q.D. and J.Y.; project administration, Y.G. and Q.D.; funding acquisition, J.Y. All authors have read and agreed to the published version of the manuscript.

Funding

This research was funded by the Innovation Project for the Chinese Academy of Agricultural Sciences and the China Agriculture Research System of MOF and MARA (CARS-19).

Institutional Review Board Statement

Not applicable.

Informed Consent Statement

Not applicable.

Data Availability Statement

All data is contained within text.

Acknowledgments

The authors thank the Fujian Century C. nitidissima Technology Co., Ltd. (Longyan 361000, China) for the C. nitidissima leaves.

Conflicts of Interest

The authors declare no conflict of interest.

Sample Availability

Samples of the compounds are not available from the authors.

References

  1. Zhou, X.W.; Fan, Z.Q.; Chen, Y.; Zhu, Y.L.; Li, J.Y.; Yin, H.F. Functional Analyses of a Flavonol Synthase-like Gene from Camellia nitidissima Reveal Its Roles in Flavonoid Metabolism During Floral Pigmentation. J. Biosci. 2013, 38, 593–604. [Google Scholar] [CrossRef] [PubMed]
  2. Wang, W.X.; Liu, H.Y.; Wang, Z.N.; Qi, J.; Yuan, S.T.; Zhang, W.J.; Chen, H.J.; Finley, J.W.; Gu, L.W.; Jia, A.Q. Phytochemicals from Camellia nitidissima Chi Inhibited the Formation of Advanced Glycation End-products by Scavenging Methylglyoxal. Food Chem. 2016, 205, 204–211. [Google Scholar] [CrossRef]
  3. Zheng, H.Y.; Du, Q.Z.; Yin, J.F.; Gao, Y. A Narrative Review on the Main Chemical Constituents and Bioactivity of Camellia nitidissima Chi. Longhua Chin. Med. 2022, 5, 29. [Google Scholar] [CrossRef]
  4. Chen, J.H.; Wu, X.H.; Zhou, Y.; He, J.H. Camellia nitidissima Chi Leaf as Pancreatic Lipase Inhibitors: Inhibition Potentials and Mechanism. J. Food Biochem. 2021, 9, e13837. [Google Scholar] [CrossRef]
  5. Ken-Ichi, O.; Keiko, T.; Mina, Y.H.; Kazuyo, T.; Kaoru, H.; Hideo, N.; Takeshi, Y. Okicamelliaside, an Extraordinarily Potent Anti-Degranulation Glucoside. Biosci. Biotechnol. Biochem. 2010, 74, 2532–2534. [Google Scholar]
  6. Kuba-Miyara, M.; Agarie, K.; Sakima, R.; Imamura, S.; Tsuha, K.; Yasumoto, T.; Gima, S.; Matsuzaki, G.; Ikehara, T. Inhibitory Effects of an Ellagic Acid Glucoside, Okicamelliaside, on Antigen-Mediated Degranulation in Rat Basophilic Leukemia RBL-2H3 Cells and Passive Cutaneous Anaphylaxis Reaction in Mice. Int. Immunopharmacol. 2012, 12, 675–681. [Google Scholar] [CrossRef] [PubMed]
  7. Kuba, M.; Tsuha, K.; Tsuha, K.; Matsuzaki, G.; Yasumoto, T. In Vivo Analysis of the Anti-allergic Activities of Camellia japonica Extract and Okicamelliaside, a Degranulation Inhibitor. J. Health Sci. 2008, 54, 584–588. [Google Scholar] [CrossRef] [Green Version]
  8. Cheng, C.J.; Cong, L.F.; Li, Z.Q.; Hao, E.W.; Hou, X.T.; Hou, Y.Y.; Bai, G.; Deng, J.G. Screening, Preparation and Investigation of the Antitumor Activity of Punch Camptothecin in Camellia nitidissima Chi Leaves. Tianjin J. Tradit. Chin. Med. 2020, 37, 1425–1430. [Google Scholar]
  9. Cheng, C.J.; Liu, K.X.; Zhang, M.; Shen, F.K.; Ye, L.L.; Wu, W.B.; Hou, X.T.; Hao, E.W.; Hou, Y.Y.; Bai, G. Okicamelliaside Targets the N-terminal Chaperone Pocket of HSP90 Disrupts the Chaperone Protein Interaction of HSP90-CDC37 and Exerts Antitumor Activity. Acta Pharmacol. Sin. 2022, 43, 1046–1058. [Google Scholar] [CrossRef]
  10. Wang, N.N.; Chen, T.; Yang, X.; Shen, C.; Li, H.M.; Wang, S.; Zhao, J.Y.; Chen, J.L.; Chen, Z.; Li, Y.L. A Practicable Strategy for Enrichment and Separation of Four Minor Flavonoids Including Two Isomers from Barley Seedlings by Macroporous Resin Column Chromatography, Medium-pressure LC, and High-speed Countercurrent Chromatography. J. Sep. Sci. 2019, 42, 1717–1724. [Google Scholar] [CrossRef]
  11. Li, H.J.; Shi, J.L.; Li, Y.Y.; Wang, C.H.; Hou, G.G.; Cong, W.; Zhao, F. Purification of Spinosin from Ziziphi Spinosae Semen Using Macroporous Resins Followed by Preparative High-performance Liquid Chromatography. J. Sep. Sci. 2019, 42, 3134–3140. [Google Scholar] [CrossRef]
  12. Zhang, J.Y.; Cui, H.C.; Xue, J.J.; Wang, W.; Wang, W.W.; Le, T.; Chen, L.; Engelhardt, U.; Jiang, H.Y. Adsorption Equilibrium and Thermodynamics of Tea Theasinensins on HP20-A High-Efficiency Macroporous Adsorption Resin. Foods 2021, 10, 2971. [Google Scholar] [CrossRef] [PubMed]
  13. Limwachiranon, J. Extraction, Recovery and Bioaccessibility Enhancement of Phenolics from Lotus (Nelumbo nucifera Gaertn.) Seedpods and Seed Kernels. Ph.D. Thesis, Zhengjiang University, Hangzhou, China, 2019. [Google Scholar]
  14. Manaa, M.B.; Issaoui, N.; Bouaziz, N.; Lamine, A.B. Combined Statistical Physics Models and DFT Theory to Study the Adsorption Process of Paprika Dye on TiO2 for Dye Sensitized Solar Cells. J. Mater. Res. Technol. 2019, 2, 1175–1188. [Google Scholar] [CrossRef]
  15. Manaa, M.B.; Issaoui, N.; Al-Ghamdi, Y.O.; Belmabrouk, H.; Lamine, A.B. A Microscopic and Macroscopic Investigation of the Adsorption of N719 Dye on ZnONanopowders (ZNP) and ZnONanorods (ZNR) for Dye Sensitized Solar Cells Using Statistical Physics Treatment and DFT Simulation. RSC Adv. 2020, 10, 27615. [Google Scholar] [CrossRef] [PubMed]
  16. Fu, Y.Q.; Wang, J.Q.; Chen, J.X.; Wang, F.; Yin, J.F.; Zeng, L.; Shi, J.; Xu, Y.Q. Effect of Baking on the Flavor Stability of Green Tea Beverages. Food Chem. 2020, 331, 127258. [Google Scholar] [CrossRef]
  17. Wang, J.Q.; Fu, Y.Q.; Chen, J.X.; Wang, F.; Feng, Z.H.; Yin, J.F.; Zeng, L.; Shi, J.; Xu, Y.Q. Effects of Baking Treatment on the Sensory Quality and Physicochemical Properties of Green Tea with Different Processing Methods. Food Chem. 2022, 380, 132217. [Google Scholar] [CrossRef] [PubMed]
  18. Yu, Q.; Fan, L.P.; Li, J.W. A Novel Process for Asparagus Polyphenols Utilization by Ultrasound Assisted Adsorption and Desorption Using Resins. Ultrason. Sonochem. 2020, 63, 104920. [Google Scholar] [CrossRef] [PubMed]
  19. Seif, Z.N.; Zeppa, G. Recovery and Concentration of Polyphenols from Roasted Hazelnut Skin Extract Using Macroporous Resins. Foods 2022, 11, 1969. [Google Scholar] [CrossRef]
  20. Zheng, X.Z.; Zhang, Z.G.; Jin, C.J.; Mu, Y.Q.; Liu, C.H.; Chen, Z.Y.; Liu, H.J.; Lin, Z. Purification Characteristics and Parameters Optimization of Anthocyanin Extracted from Blueberry. Int. J. Agric. Biol. Eng. 2015, 8, 135–144. [Google Scholar]
  21. Liu, Y.X.; Zhao, Y.H.; Zhuo, Y.; Li, Y.W.; Meng, J.X.; Wang, Y.L.; Li, H.H. Ultrasound-Assisted Extraction of Anthocyanins from Malus ‘Royalty’ Fruits: Optimization, Separation, and Antitumor Activity. Molecules 2022, 27, 4299. [Google Scholar] [CrossRef] [PubMed]
  22. Sandhu, A.K.; Gu, L. Adsorption/desorption Characteristics and Separation of Anthocyanins from Muscadine (Vitis Rotundifolia) Juice Pomace by Use of Macroporous Adsorbent Resins. J. Agric. Food Chem. 2013, 61, 1441–1448. [Google Scholar] [CrossRef] [PubMed]
  23. Yang, Q.Y.; Zhao, M.M.; Lin, L.Z. Adsorption and Desorption Characteristics of Adlay Bran Free Phenolics on Macroporous Resins. Food Chem. 2016, 194, 900–907. [Google Scholar] [CrossRef] [PubMed]
  24. Lin, L.Z.; Zhao, H.F.; Dong, Y.; Yang, B.; Zhao, M.M. Macroporous Resin Purification Behavior of Phenolics and Rosmarinic Acid from Rabdosia serra (MAXIM.) HARA Leaf. Food Chem. 2012, 130, 417–424. [Google Scholar] [CrossRef]
  25. Chen, S.D.; Qiao, J.J.; Lu, G.Y.; Xie, G.Y.; Qin, M.J. Research Progress on Separation and Purification of Flavonoids by Macroporous Resin. Guangzhou Chem. Ind. 2021, 49, 9–13. [Google Scholar]
  26. Xu, Z.Y.; Zhang, Q.X.; Chen, J.L.; Wang, L.S.; Anderson, G.K. Adsorption of Napthalene Derivatives on Hypercrosslinked Polymeric Adsorbents. Chemosphere 1999, 38, 2003–2011. [Google Scholar] [CrossRef]
  27. Wang, J.L.; Guo, X. Adsorption Kinetic Models: Physical Meanings, Applications, and Solving Methods. J. Hazard. Mater. 2020, 390, 122156. [Google Scholar] [CrossRef] [PubMed]
  28. Guo, X.; Wang, J.L. Comparison of Linearization Methods for Modeling the Langmuir Adsorption Isotherm. J. Mol. Liq. 2019, 296, 111850. [Google Scholar] [CrossRef]
  29. Rudzinski, W.; Plazinski, W. Kinetics of Dyes Adsorption at the Solid-Solution Interfaces: A Theoretical Description Based on the Two-Step Kinetic Model. Environ. Sci. Technol. 2008, 42, 2470–2475. [Google Scholar] [CrossRef] [PubMed]
  30. Duran, C.; Ozdes, D.; Gundogdu, A.; Senturk, H.B. Kinetics and Isotherm Analysis of Basic Dyes Adsorption onto Almond Shell (Prunus dulcis) as a Low Cost Adsorbent. J. Chem. Eng. Data 2011, 56, 2136–2147. [Google Scholar] [CrossRef]
  31. Wang, X.Y.; Su, J.Q.; Chu, X.L.; Zhang, X.Y.; Kan, Q.B.; Liu, R.X.; Fu, X. Adsorption and Desorption Characteristics of Total Flavonoids from Acanthopanax senticosus on Macroporous Adsorption Resins. Molecules 2021, 26, 4162. [Google Scholar] [CrossRef]
  32. Si, C.Y.; Hu, H.; Cheng, J.R.; Tian, M.M.; Dai, S.Y.; Li, R.X.; Fan, R.F.; Yang, C.L.; Pi, Z.P.; Xu, K.J. Adsorption Behavior of D-101 Macroporous Resins for Phloridzin. Ion Exch. Adsorpt. 2020, 36, 541–553. [Google Scholar]
  33. Iqbal, M.; Datta, D. Improved Sono-assisted Adsorption of a Binary Dye Mixture Using Bis (2-ethylhexyl) Phosphate Modified Amberlite XAD-2 Resin and Response Optimization. J. Indian Chem. Soc. 2022, 99, 100740. [Google Scholar] [CrossRef]
  34. Chang, X.L.; Wang, D.; Chen, B.Y.; Feng, Y.M.; Wen, S.H.; Zhan, P.Y. Adsorption and Desorption Properties of Macroporous Resins for Anthocyanins from the Calyx Extract of Roselle (Hibiscus sabdariffa L.). J. Agric. Food Chem. 2012, 60, 2368–2376. [Google Scholar] [CrossRef] [PubMed]
  35. Chen, X.M.; Wang, H.; Huang, X.J.; Xia, S.K.; Chen, C.H.; Nie, Q.X.; Nie, S.P. Efficient Enrichment of Total Flavonoids from Lale (Brassica oleracea L. var. acephala L.) Extracts by NKA-9 Resin and Antioxidant Activities of Flavonoids Extract in vitro. Food Chem. 2022, 374, 131508. [Google Scholar] [CrossRef] [PubMed]
  36. Fan, Q.B.; Li, Y. Enrichment of Rosmarinic Acid from Salvia Przewalskii Maxim. Leaves Using Macroporous Resin: Adsorption/desorption Behavior, Process Optimization Followed by Scale-up. Ind. Crop. Prod. 2023, 191, 115931. [Google Scholar] [CrossRef]
Figure 1. (a) Camellia nitidissima Chi leaf; (b) Okicamelliaside structure diagram.
Horticulturae 09 00166 g001
Figure 2. (a) Adsorption and (b) desorption capacity and rate on 5 resins.
Horticulturae 09 00166 g002
Figure 3. Adsorption kinetic curve of OCS from extraction of C. nitidissima Leaves with 5 resins.
Horticulturae 09 00166 g003
Figure 4. Diagram of pseudo−second−order models transformation.
Horticulturae 09 00166 g004
Figure 5. (a) Dynamic breakthrough curve of OCS with AB-8 resin; effect of (b) adsorption time and (c) sample concentration on AB-8 adsorption performance.
Horticulturae 09 00166 g005
Figure 6. Effect of (a) eluent concentration and (b) eluent volume on AB-8 desorption performance; and (c) dynamic desorption curve of OCS with AB-8 resin.
Horticulturae 09 00166 g006
Table 1. Physical properties of the tested resins in this study.
Trade NameSpecific Surface
Area (m2/g)
Particle Size (mm)Mean Pore Size (nm)Polarity Type
HPD100400–6000.30–1.2010.0–12.0Non-polarity
D101650–7000.30–1.258.5–9.0Non-polarity
DM130500–5500.30–1.259.0–10.0Weak polarity
AB-8480–5200.30–1.2513.0–14.0Weak polarity
NKA-9250–2900.30–1.2515.5–16.5Polarity
Table 2. Pseudo-first-order and pseudo-second-order model equations and dynamic parameters.
ResinsDynamic EquationTransforming FormulasR2Dynamic Parameters
HPD100Ln(Qe − Qt) = −k1t + lnQey = 235.00760 × (1 − exp(−0.02849 × x))0.89576k1 = 0.02849
k2 = 0.00020
t Qt = 1 k 2 Q e 2 + t Qe y = 0.07866 + 0.00397x0.99994
D101Ln(Qe − Qt) = −k1t + lnQey = 207.69370 × (1 − exp(−0.02315 × x))0.87176k1 = 0.02315
k2 = 0.00020
t Qt = 1 k 2 Q e 2 + t Qe y = 0.13072 + 0.00436x0.99947
DM130Ln(Qe − Qt) = −k1t + lnQey = 172.60070 × (1 − exp(−0.03116 × x))0.93574k1 = 0.03116
k2 = 0.00030
t Qt = 1 k 2 Q e 2 + t Qe y = 0.09759 + 0.00543x0.99956
AB-8Ln(Qe − Qt) = −k1t + lnQey = 250.03747 × (1 − exp(−0.01195 × x))0.99766k1 = 0.01195
k2 = 0.00006
t Qt = 1 k 2 Q e 2 + t Qe y=0.20347+0.00357x0.99633
NKA-9Ln(Qe − Qt) = −k1t + lnQey = 233.43601 × (1 − exp(−0.02133 × x))0.99423k1 = 0.02133
k2 = 0.00019
t Qt = 1 k 2 Q e 2 + t Qe y = 0.08610 + 0.00405x0.99909
Disclaimer/Publisher’s Note: The statements, opinions and data contained in all publications are solely those of the individual author(s) and contributor(s) and not of MDPI and/or the editor(s). MDPI and/or the editor(s) disclaim responsibility for any injury to people or property resulting from any ideas, methods, instructions or products referred to in the content.

