Article

Effects of Rootstock on Water Stress, Physiological Parameters, and Growth of the Pistachio Tree

by
Eduardo Fernández-Suela
1,2,*,
Pablo Garcia-Estringana
1,
E. Francisco de Andrés
3,
Noelia Ramírez-Martín
1 and
Jesus Alegre
1
1
Agroenvironmental Department, IMIDRA, Finca ‘El Encín’, Autovía A2, Km. 38,2, Alcalá de Henares, 28800 Madrid, Spain
2
Departamento de Producción Agraria, ETSIAAB, Universidad Politécnica de Madrid (UPM), Ciudad Universitaria s.n., 28040 Madrid, Spain
3
Servicio de Conservación Genética, Centro de Recursos Fitogenéticos, Instituto Nacional de Investigación y Tecnología Agraria y Alimentaria (INIA-CSIC), Autovia A2, Km. 36,2, 28805 Alcala de Henares, Spain
*
Author to whom correspondence should be addressed.
Horticulturae 2023, 9(12), 1305; https://doi.org/10.3390/horticulturae9121305
Submission received: 24 October 2023 / Revised: 22 November 2023 / Accepted: 27 November 2023 / Published: 5 December 2023
(This article belongs to the Section Biotic and Abiotic Stress)

Abstract

:
In Spain, almost all pistachios are grown under water-stress conditions. Pistachio plants have sophisticated mechanisms to avoid or tolerate stress. It is known that the rootstock affects responses to water stress in the cultivar grafted onto it. The traditional belief is that Pistacia terebinthus L. is the rootstock best adapted to rainfed conditions. This study examined the effect of rootstock on stress traits, photosynthetic rate, transpiration, stomatal conductance, chlorophyll, polyphenol concentrations, and growth in plants of Pistacia vera L. cv. Kerman grafted onto P. terebinthus, P. atlantica, and UCB-1. These responses were classified into constituent traits and characteristics of the plant’s adaptation to water stress. The latter was induced by adding PEG 6000 to the nutrient solution. Plants grafted onto P. terebinthus showed more constituent traits, while plants grafted onto UCB-1 showed a greater number of drought-responsive traits. Plants grafted onto P. atlantica showed similar adaptative traits to those observed in UCB-1 but lower values of transpiration and net photosynthesis. Although it is likely that plants grafted onto P. terebinthus survive longer under extreme drought conditions, under moderate stress conditions, their yield is probably lower than that of plants grafted onto UCB-1 under the same moderate stress conditions.

1. Introduction

Pistachios are one of the crops that best tolerate water and saline stress [1,2]. They are able to survive under extreme drought conditions. In trials run by [3] in Avdat, in the Negev desert, it was found that pistachios can even produce a certain amount of fruit in highly adverse conditions, in which all soil horizons fell below the wilting point and soil water potential reached −12 atm. The pistachio’s resistance was related to a powerful root system that reached a depth of 2.40 m and extracted water from very deep horizons. Under these extreme drought conditions, its root activity can cease completely for a period of 4–5 weeks.
The pistachio is often considered a xerophyte species, but in reality, it does not have the morphological characteristics of this kind of plant. Rather, it has high values of net photosynthesis (A) and stomatal conductance (gs). This is why some authors suggest that pistachios’ tolerance to drought depends mainly on avoiding water stress due to their ability to extract water from very deep layers of soil with low potential [4,5]. However, ref. [6] showed that the activity of the pistachio root system varies with the availability of water and is limited to shallower zones of soil when the intervals between irrigations are reduced. In reality, pistachio plants subject to water restrictions have, in addition to their ability to develop a powerful root system, sophisticated mechanisms for avoiding or tolerating water stress. For example, they are able to maintain photosynthesis activity at leaf water potential values below —5 MPa and, depending on their phenological status, modify photosynthesis and stomatal conductance responses [2].
It may appear contradictory that, while it is a crop capable of surviving in semi-desert conditions and of producing fruit when water resources are very limited, it also produces very well when there is a lot of water available. Irrigation increases both quantity and quality of yield and reduces alternance [6,7,8,9]. This is why, in the main producing countries (Iran and the United States), pistachios are usually grown in irrigated areas. If irrigation is in line with evapotranspiration (ET) values, a very large amount of water is needed for pistachio crops. In summer, pistachio plants transpire large amounts of water, with ET values higher than for most deciduous plants [10,11]. Its evaporative demand may reach 8.1 mm d−1 [8]. The crop coefficient value (Kc) given for pistachio in mid-summer varies greatly between authors. Ref. [6] calculated it at 0.8, ref. [12] at 1.19, and ref. [8] at 1.36. As such, there is some degree of uncertainty as to pistachios’ real irrigation requirements, with recommendations ranging between 550–600 mm·ha−1 [13,14] and 850–1000 mm·ha−1 [12,15]. In California, new orchards based on rootstock and more vigorous and productive cultivars are being established, with the expectation of irrigating with 1150 mm·ha−1·year−1 to obtain a mean annual yield of 2500 kg of commercial pistachio per hectare [9].
In Spain, the surface area of pistachio crops is growing at a rate of 8000 ha per year−1. In 2020, the surface area for pistachios was 49,534 ha [16], which rose to 66,466 ha in 2022 [17]. As not enough water is available to cover the high evaporative demand in the summer, pistachios are mainly cultivated under rainy conditions. In Spain, 62% of the crop’s surface area is rainfed, and 38% is irrigated. However, orchards defined as irrigated generally receive very little water, often not exceeding 150 mm·ha−1·year−1, similar to other regions in the Mediterranean Basin [9]. In reality, they can be considered rainfed orchards that receive supplementary irrigation. Thus, most pistachio orchards in Spain, whether rainfed or irrigated, are subject to periods of considerable water stress [18].
There are numerous studies of the effects of water and saline stress on species of the Pistacia genus, including P. vera, used as rootstock or cultivar. Many of these were conducted on seedlings in a controlled environment, in which photosynthesis responses and other physiological, biochemical, and morphological parameters were examined [1,19,20,21,22,23,24]. There are also several publications tackling the effects of water stress on physiological and yield parameters in on-field conditions in adult orchards [10,11,25,26]. Few studies have assessed the effects of rootstock-cultivar interaction on tolerance to water stress. However, pistachio orchards, as is the case in most fruit species, are in reality formed by ‘mixed organisms’ in which the rootstock constitutes the root system and the cultivar, the aerial part.
The rootstock usually determines the vigor of the cultivar and its responses to water stress [27]. In general, rootstocks with little vigor mean the cultivar grows less because they modify auxin transport and hydraulic conductivity in both root and stem systems [28,29,30]. Moreover, the effects of the rootstock on water stress responses change with the cultivar grafted on [31]. The influence of the rootstock on pistachio has been described as follows: ref. [5] found that the Nostrale cultivar grafted onto P. atlantica transpired more and had greater photosynthetic activity than when it was grafted onto P. terebinthus. A field-based study [32] found that the Mateur and Kerman cultivars were more vigorous and had greater chlorophyll and sugar content in leaf when grafted onto P. atlantica than onto P. vera. In more recent studies of plants in pots [18,33,34] and in field conditions [13,35], the highly significant effects of the three rootstocks most commonly used in Spain (P. terebinthus, P. atlantica, and UCB-1) on the growth and water relationships of the Kerman cultivar were described. However, the findings were contradictory. Ref. [34] concluded that, of these three rootstocks, UCB-1 produced Kerman plants that adapted worst to water stress. Ref. [18] found that the Kerman plants grafted onto UCB-1 were those that had greater vegetation growth under stress conditions, which could be taken as better adaptation. However, taking into account the volume pressure curves, the Kerman plants grafted on P. atlantica responded best to water stress. Then again, including reductions in stomatal conductance and its greater sensitivity to defoliation, P. terebinthus could well be a rootstock more sensitive to water stress than P. atlantica [13,35], although ref. [33] concluded the opposite.
These contradictions may originate in the design of the experiments. Effects of the rootstock on water relationships are often confused with effects of the rootstock on the plant’s overall vigor [27]. As plants that grow more and are more vigorous tend to use more water, they dry out the soil or substrate sooner than less vigorous ones. This may mean that greater vigor or greater size is interpreted as a worse response to water stress, whereas in reality, invigorating rootstocks may give the plant greater drought tolerance because they extract more water from the soil [36]. In plant-pot trials, ref. [33] noted a possible effect of the size of plants used. Those grafted onto P. atlantica were smaller than those grafted onto P. terebinthus, which could condition the findings.
One way to avoid the effects of plant vigor and size is to cultivate in a solution with high osmotic potential such that the level of water stress is the same, regardless of the plants vigor or size. Many models of stress caused by drought are based on the use of presumably inert, high-molecular-weight polyethylene glycol (PEG) [37], which limits water entering the root system and causes uniform water stress over time [38,39,40].
The aim of this study was to assess the responses of the Kerman pistachio cultivar (Pistacia vera cv. Kerman) when subjected to the most commonly used pistachio rootstock in Spain (Pistacia terebinthus, Pistacia atlantica, and UCB-1) and when subjected to water stress caused by PEG 6000.

2. Materials and Methods

2.1. Plant Material

This study was conducted between 1 July 2020 and 14 August 2020 in a greenhouse on IMIDRAs experimental farm ‘El Encin’ at Alcalá de Henares, Madrid, Spain. Seeds of P. terebinthus, P. atlantica, and UCB-1 rootstocks were germinated and planted in 5 L polyethylene plant pots. In 2019, P. vera cv. Kerman was grafted onto them. In 2020, 8 plants grafted onto each of the three rootstocks were selected and transplanted to 18 L plant-pots with medium-grain perlite (B-12 perlite). These plants were kept under controlled greenhouse conditions in a hydroponic system with Hoagland solution for two months [41]. Temperature and relative humidity in the greenhouse (day/night) ranged between 27/22 °C and 49/71%, respectively. The mean light intensity was 1212.4 μmol m−2s−1 PAR, with a maximum daily intensity of 1350 μmol m−2s−1 and a minimum daily intensity of 895 μmol m−2s−1. The plants were watered eight times a day for a period of five minutes per irrigation. The first watering was carried out at dawn and the last at sunset, irrigating every two hours. A total of 2.5 L plant−1 day−1 was applied.
The trial started in July 2020. Four plants grafted onto each rootstock, randomly selected and well irrigated, were kept as controls, while four plants of each rootstock were subjected to osmotic potential in a ferti-irrigation solution of Ψs = −2.5 MPa applying PEG 6000 at a concentration following [42]. The stress level was maintained for two weeks (stress period), after which all the plants subjected to stress had PEG 6000 withdrawn from their nutrient solution and were irrigated for a further 14 days solely with Hoagland solution (recovery period). The Hoagland solution was replenished weekly, and the irrigation system was cleaned at the same time. During the stress period, the PEG concentration was replenished every time the nutrient solution was changed, once a week.

2.2. Stem Water Potential

The stem water potential was measured at solar midday with a PMS 600 pressure chamber (PMS Instrument Company, Albany, OR, USA) using nitrogen gas for pressurization [43,44]. A completely open leaf on each plant was covered with aluminum foil one hour before measurement, thus halting transpiration and allowing the leaf to reach equilibrium with the stem water potential [45]. Due to the difficulty of determining stem water potential in the pistachio plant because of turpentine exudation, a piece of paper was placed just above the cut in the petiole to assist measurement, as paper does not moisten with turpentine, whereas it does with xylem solution. Water potential was measured at the start of the stress period (24 h after the start), at the end of the stress period (14 days), and at the end of the recovery period (14 days after the end of the stress period).

2.3. Photosynthesis Measurements

Photosynthesis was measured by an infrared CO2 and H2O gas analyzer (LI-COR 6400, LI-COR Inc., Lincoln, NE, USA) in four repetitions of each rootstock under control and under stress conditions. The photosynthesis rate (A), the stomatal conductance (gs), the substomatal concentration of CO2 (Ci), and leaf transpiration (E) were measured at 24 h from the start of stress, after 14 days of stress, and after 14 days of recovery from stress. The data measured enabled us to calculate carboxylation efficiency (A/Ci), intrinsic efficiency of water use (A/gs), and Water Use Efficiency (WUE), calculated as a quotient of A by E.

2.4. Determination of Chlorophyll and Other Pigments

Chlorophyll (Chl), flavonols (Flav), and anthocyanins (Anth) were measured in 4 leaves of each plant with a portable chlorophyll meter (Dualex 4 Scientific Clip, FORCE-A, Orsay, France). Measurements were taken on the adaxial surface of the leaves’ terminal leaflets.

2.5. Biomass Weight and Plant Growth

At the end of the trial, all plant biomass growth was cut. The fresh weight of total biomass was measured. Then, branches and leaves were separated, and the total fresh weight of biomass for each was measured. Leaf area was measured in each plant. Biomass was placed in a stove at 72 °C until it reached a constant weight. Dry weights of leaves, branches, and total dry biomass were measured.

2.6. Statistical Analysis

The experiment was designed in a factorial way with two stress levels and three units per rootstock. A two-way variance analysis examined the effects of the stress treatment and rootstocks. Means were compared with the Duncan test (p = 0.05). The analysis used SPSS 22 (IBM Corporation, Armonk, NY, USA).

3. Results

3.1. Stem Water Potential (MPa)

The lowest stem water potential values (−4.50 MPa) were found at the end of the stress period in plants grafted onto PT that were subjected to water stress, and the highest (−1.05 MPa) in plants grafted onto UCB-1 and PA in the control treatment at the end of the recovery period (Figure 1). Significant differences were found between the start and end of the stress period, due to irrigation treatment. At the end of the stress period, significant differences were found due to the rootstock. The plants grafted onto PT had a significantly lower water potential than those grafted onto UCB-1. At the end of the recovery period, there were significant differences caused by the rootstock, with the water potentials of the plants grafted onto PT significantly lower than those in plants grafted onto PA or UCB. The kind of rootstock used caused major differences in cultivars’ water potential. These differences appeared both in the absence of stress and when the plants were subjected to high water stress (Figure 1). At the end of the stress period, water potentials reached −4.50 MPa in plants grafted onto PT (against −4.10 and −3.60 MPa in those grafted onto PA and UCB-1, respectively).

3.2. Gas Exchange and Photosynthesis

Table 1 shows the results for gas exchange and photosynthesis. At the start of the stress period, plants subjected to stress had a Ci value (212 µmol CO2 mol−1) significantly lower than unstressed plants (226 µmol CO2 mol−1). This reduction did not occur for UCB-1, with the interaction Rootstock × Stress level being significant. The different rootstocks had a significant effect on E: UCB-1 had the highest E (7.5 mmol H2O m−2 s−1), followed by PA (6.0 mmol H2O m−2 s−1) and PT (5.2 mmol H2O m−2 s−1). Plants subjected to stress had a significantly lower E (5.9 mmol H2O m−2 s−1) than control plants (6.7 mmol H2O m−2 s−1).
Plants grafted onto UCB-1 had stomatal conductance (0.2 mol CO2 m−2 s−1) that was significantly greater than those grafted onto PT (0.17 mol CO2 m−2 s−1) and PA (0.15 mol CO2 m−2 s−1). Plants subjected to stress had significantly lower E (0.15 mol CO2 m−2 s−1) than control plants (0.19 mol CO2 m−2 s−1). No significant effect of the rootstock or PEG treatment on A was found at the start of the stress period (Table 1). At the end of the recovery period, the effect of PT had a Ci (227) that was significantly higher than UCB-1 (207) or PA (196). The plants subjected to stress had significantly lower Ci (195) than the control ones (225). UCB-1 plants had E (3.8 mmol H2O m−2 s−1) significantly greater than those grafted on PA (3.0 mmol H2O m−2 s−1) or PT (2.6 mmol H2O m−2 s−1). The plants subjected to stress had E (2.0 mmol H2O m−2 s−1) significantly lower than the control ones (4.3 mmol H2O m−2 s−1). The plants subjected to stress had a gs (0.06 mol CO2 m−2 s−1) significantly lower than the control ones (0.21 mol CO2 m−2 s−1). The plants grafted onto UCB-1 had A (13.0 µmol CO2 m−2 s−1) significantly greater than those grafted onto PA (11.5 µmol CO2 m−2 s−1) or PT (10.1 µmol CO2 m−2 s−1). The plants subjected to stress had A (7.9 µmol CO2 m−2 s−1) significantly lower than control plants (15.8 µmol CO2 m−2 s−1). After the period of recovery, the plants subjected to stress had Ci (218) significantly lower than control ones (252). The plants grafted onto UCB-1 had E (4.2 mmol H2O m−2 s−1) significantly greater than those grafted onto PA (3.1 mmol H2O m−2 s−1) or PT (2.7 mmol H2O m−2 s−1). The plants subjected to stress had gs (0.12 mol CO2 m−2 s−1) significantly less than control plants (0.19 mol CO2 m−2 s−1). The plants grafted onto UCB-1 had an A (15.6 µmol CO2 m−2 s−1) significantly greater than those grafted onto PT (13.0 µmol CO2 m−2 s−1) or PA (10.7 µmol CO2 m−2 s−1).

3.3. Efficiency of Carboxylation and Water Use

Table 2 shows the values found for carboxylation efficiency (A/Ci), intrinsic water use efficiency (A/gs), instantaneous water use efficiency (WUE), and Fv/Fm. At the start of the stress period, the rootstock had a significant effect on A/gs. Also, at the start of the stress period, the stress level had a significant effect on intrinsic water use efficiency (A/gs). The rootstock had a significant effect on (A/gs) and WUE. PA caused the most A/gs (92.9), followed by PT (83.3) and UCB-1 (76.7). The rootstock had a significant effect on WUE, showing PT greater WUE values (2.6) than those on PA (2.2) and UCB-1 (2.1). A significant interaction was observed between the rootstock and the stress treatment. The WUE of the plants grafted onto PT increased in relation to control plants, whereas the WUE of stressed plants grafted onto UCB-1 was lower than that of control ones. At the end of the stress period, there was a significant effect of both the rootstock and the stress treatment on A/Ci. UCB-1 (0.06) and PA (0.06) had greater A/Ci than those of PT (0.04). Stress treatment had significant effects on A/Ci, A/gs, and Fv/Fm. After the recovery period, plants grafted onto UCB-1 had A/Ci (0.07) significantly greater than those grafted onto PT (0.06) and PA (0.04). At the end of this period, plants grafted onto PT had significantly better WUE (4.9) than those grafted onto UCB-1 (3.9) or PA (3.7).

3.4. Chlorophyll and Other Pigments

At the start of the stress period, significant differences due to the rootstock were observed in the concentrations of chlorophyll, flavonols, and anthocyanin. PA and UCB-1 had higher concentrations of chlorophyll (47.70 and 45.20 mg · cm−2, respectively) than PT (41.32 mg cm−2). In a significant rise, PT had the highest concentration of flavonol (3.18 µg · cm−2), followed by PA (2.85 µg · cm−2) and UCB-1 (2.85 µg · cm−2). Plants grafted onto PT had more anthocyanins (0.096 µg · cm−2) than those grafted onto PA (0.078 µg · cm−2) or UCB-1 (0.072 µg · cm−2).
At the end of the stress period, stressed treatment decreased chlorophyl concentrations and increased flavonol and anthocyanin concentrations significantly. PA and UCB-1 induced significantly higher chlorophyll concentrations (49.22 and 49.15 µg · cm−2, respectively, Figure 2) than PT (43.74 µg · cm−2). Flavonol concentration was significantly higher in plants grafted onto PT (3.09 µg · cm−2) than in those grafted onto PA (2.93 µg · cm−2) or UCB-1 (2.73 µg · cm−2, Figure 3). Anthocyanin concentrations were higher in plants grafted onto PT (0.123 µg · cm−2) than in those grafted onto PA (0.104 µg · cm−2) or UCB-1 (0.100 µg · cm−2, Figure 4).
After the recovery period, a significant effect of stress treatment was observed in chlorophyll, flavonols, and anthocyanin concentrations. There was a significant interaction between the rootstock and the stress level. Of the three rootstocks, UCB-1 stimulated the highest flavonol synthesis under water stress treatment in relation to control plants (Figure 3).

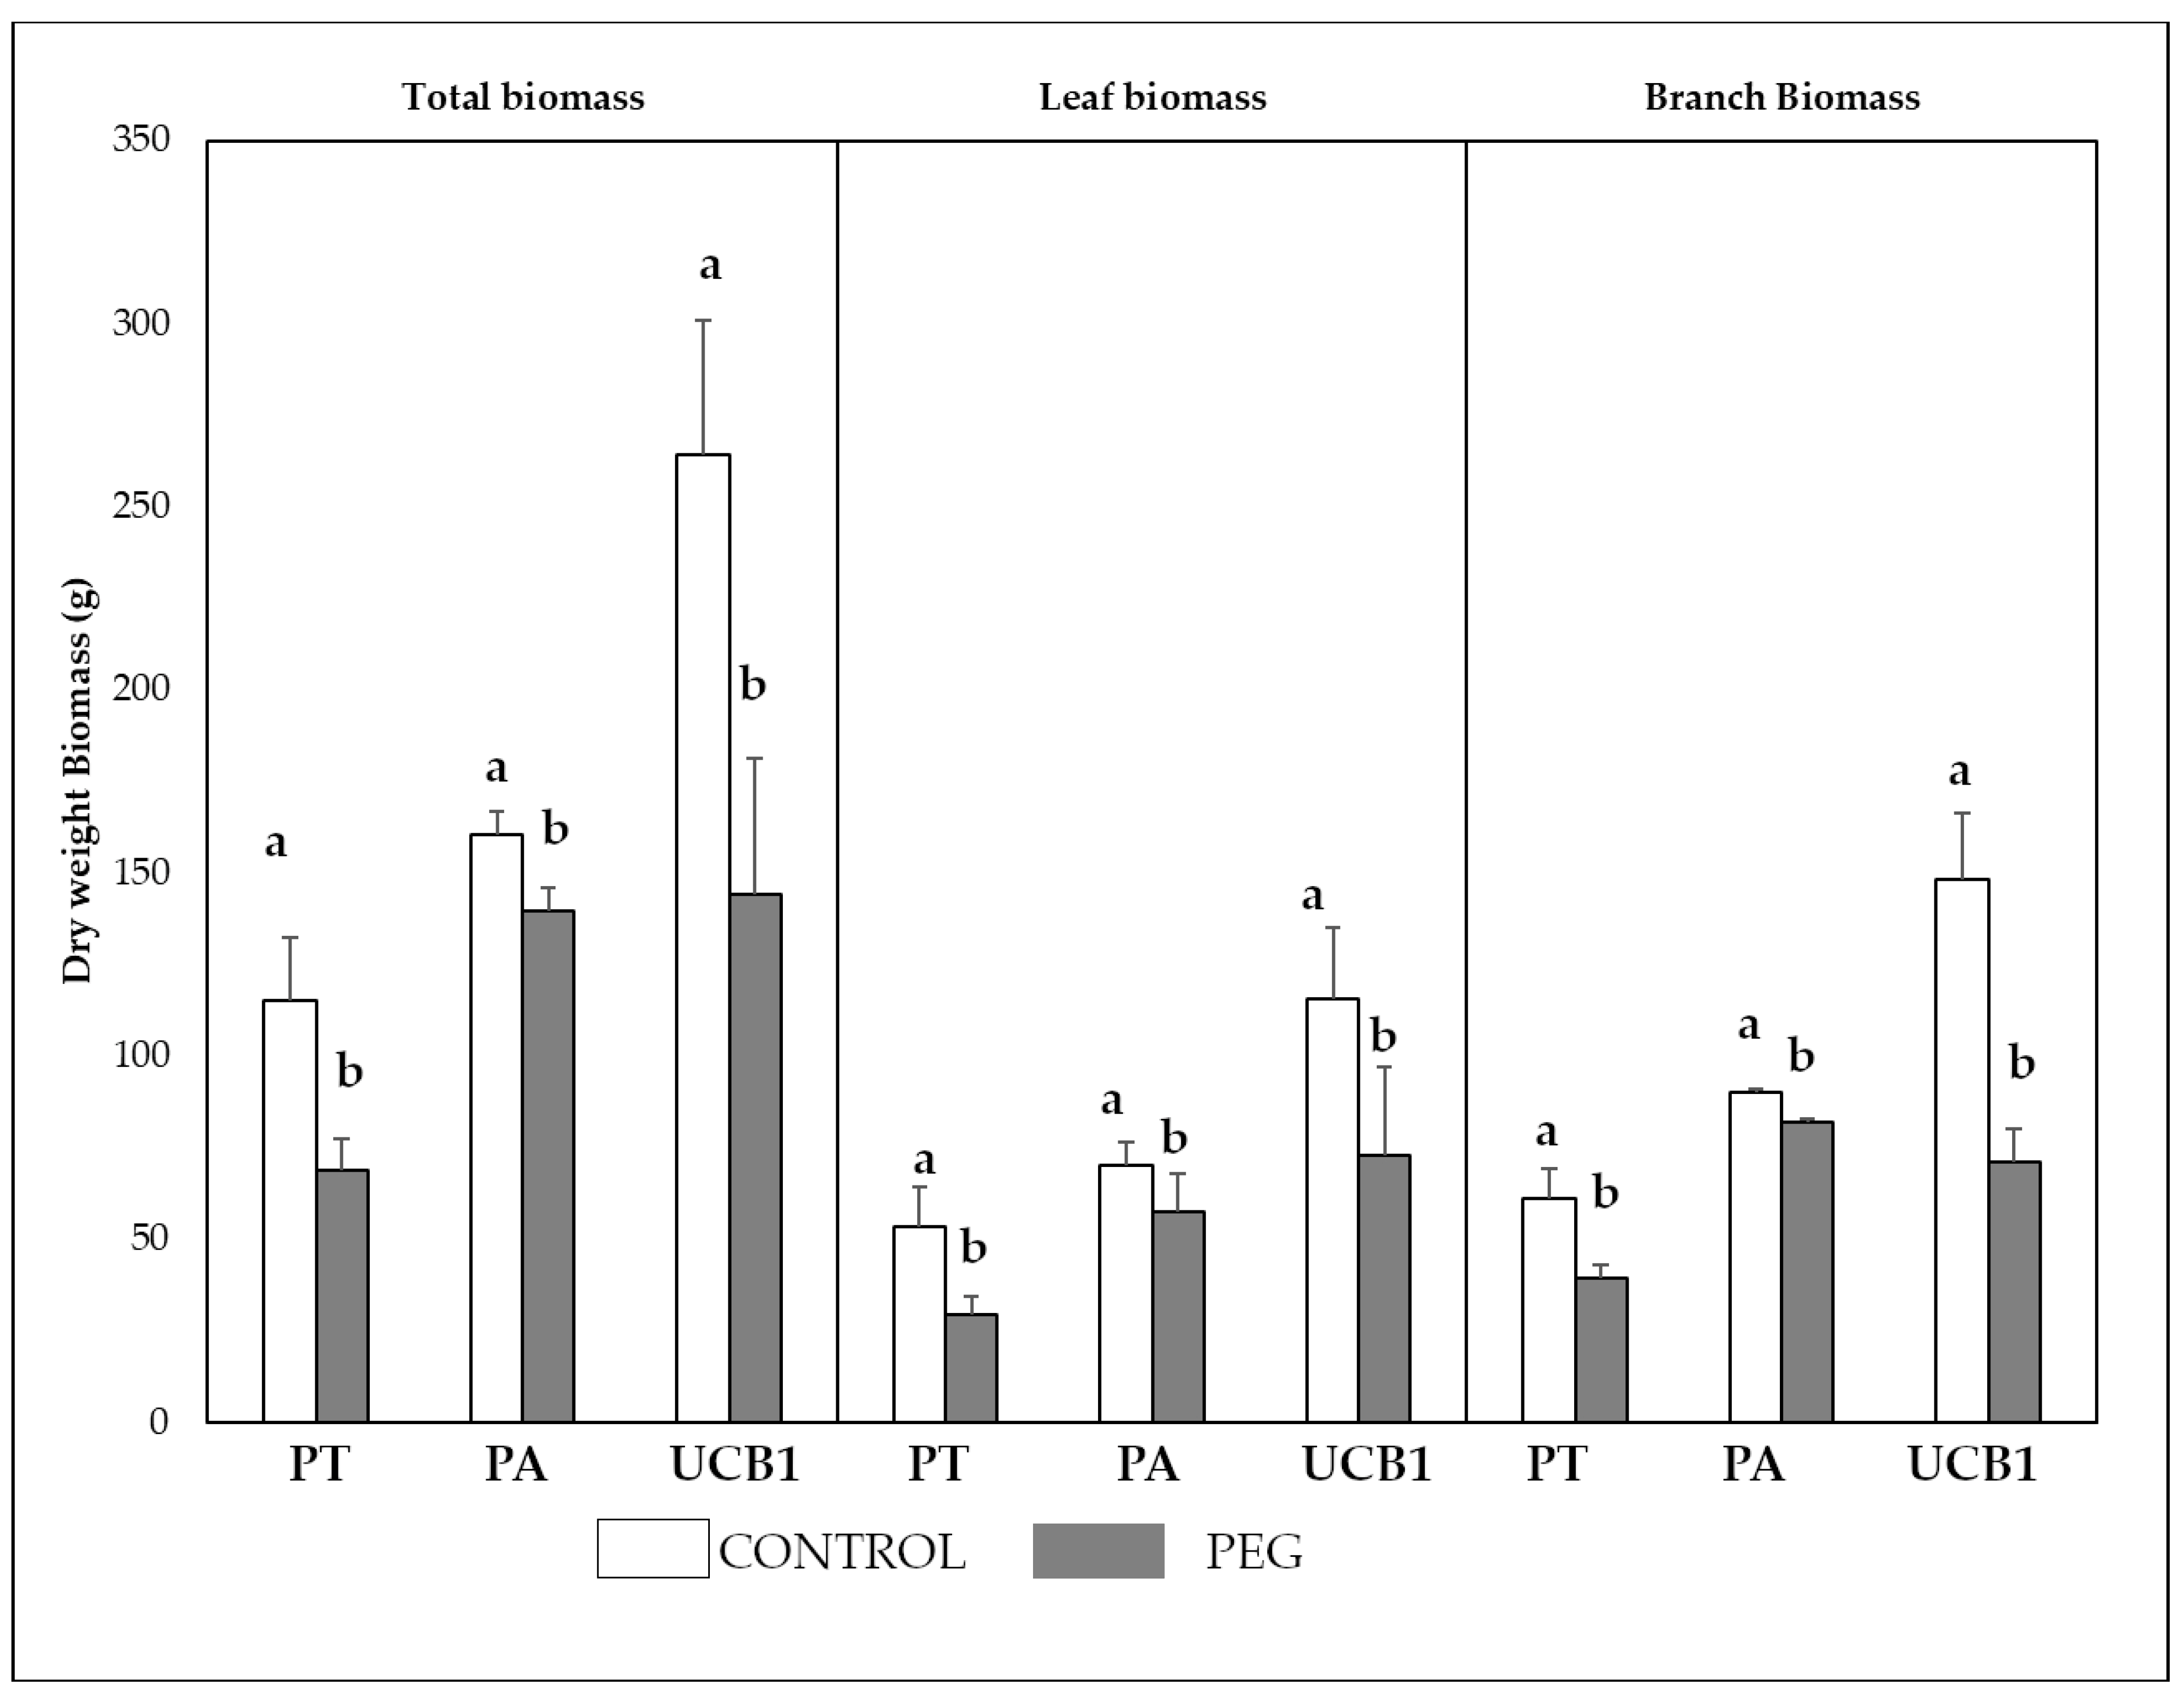
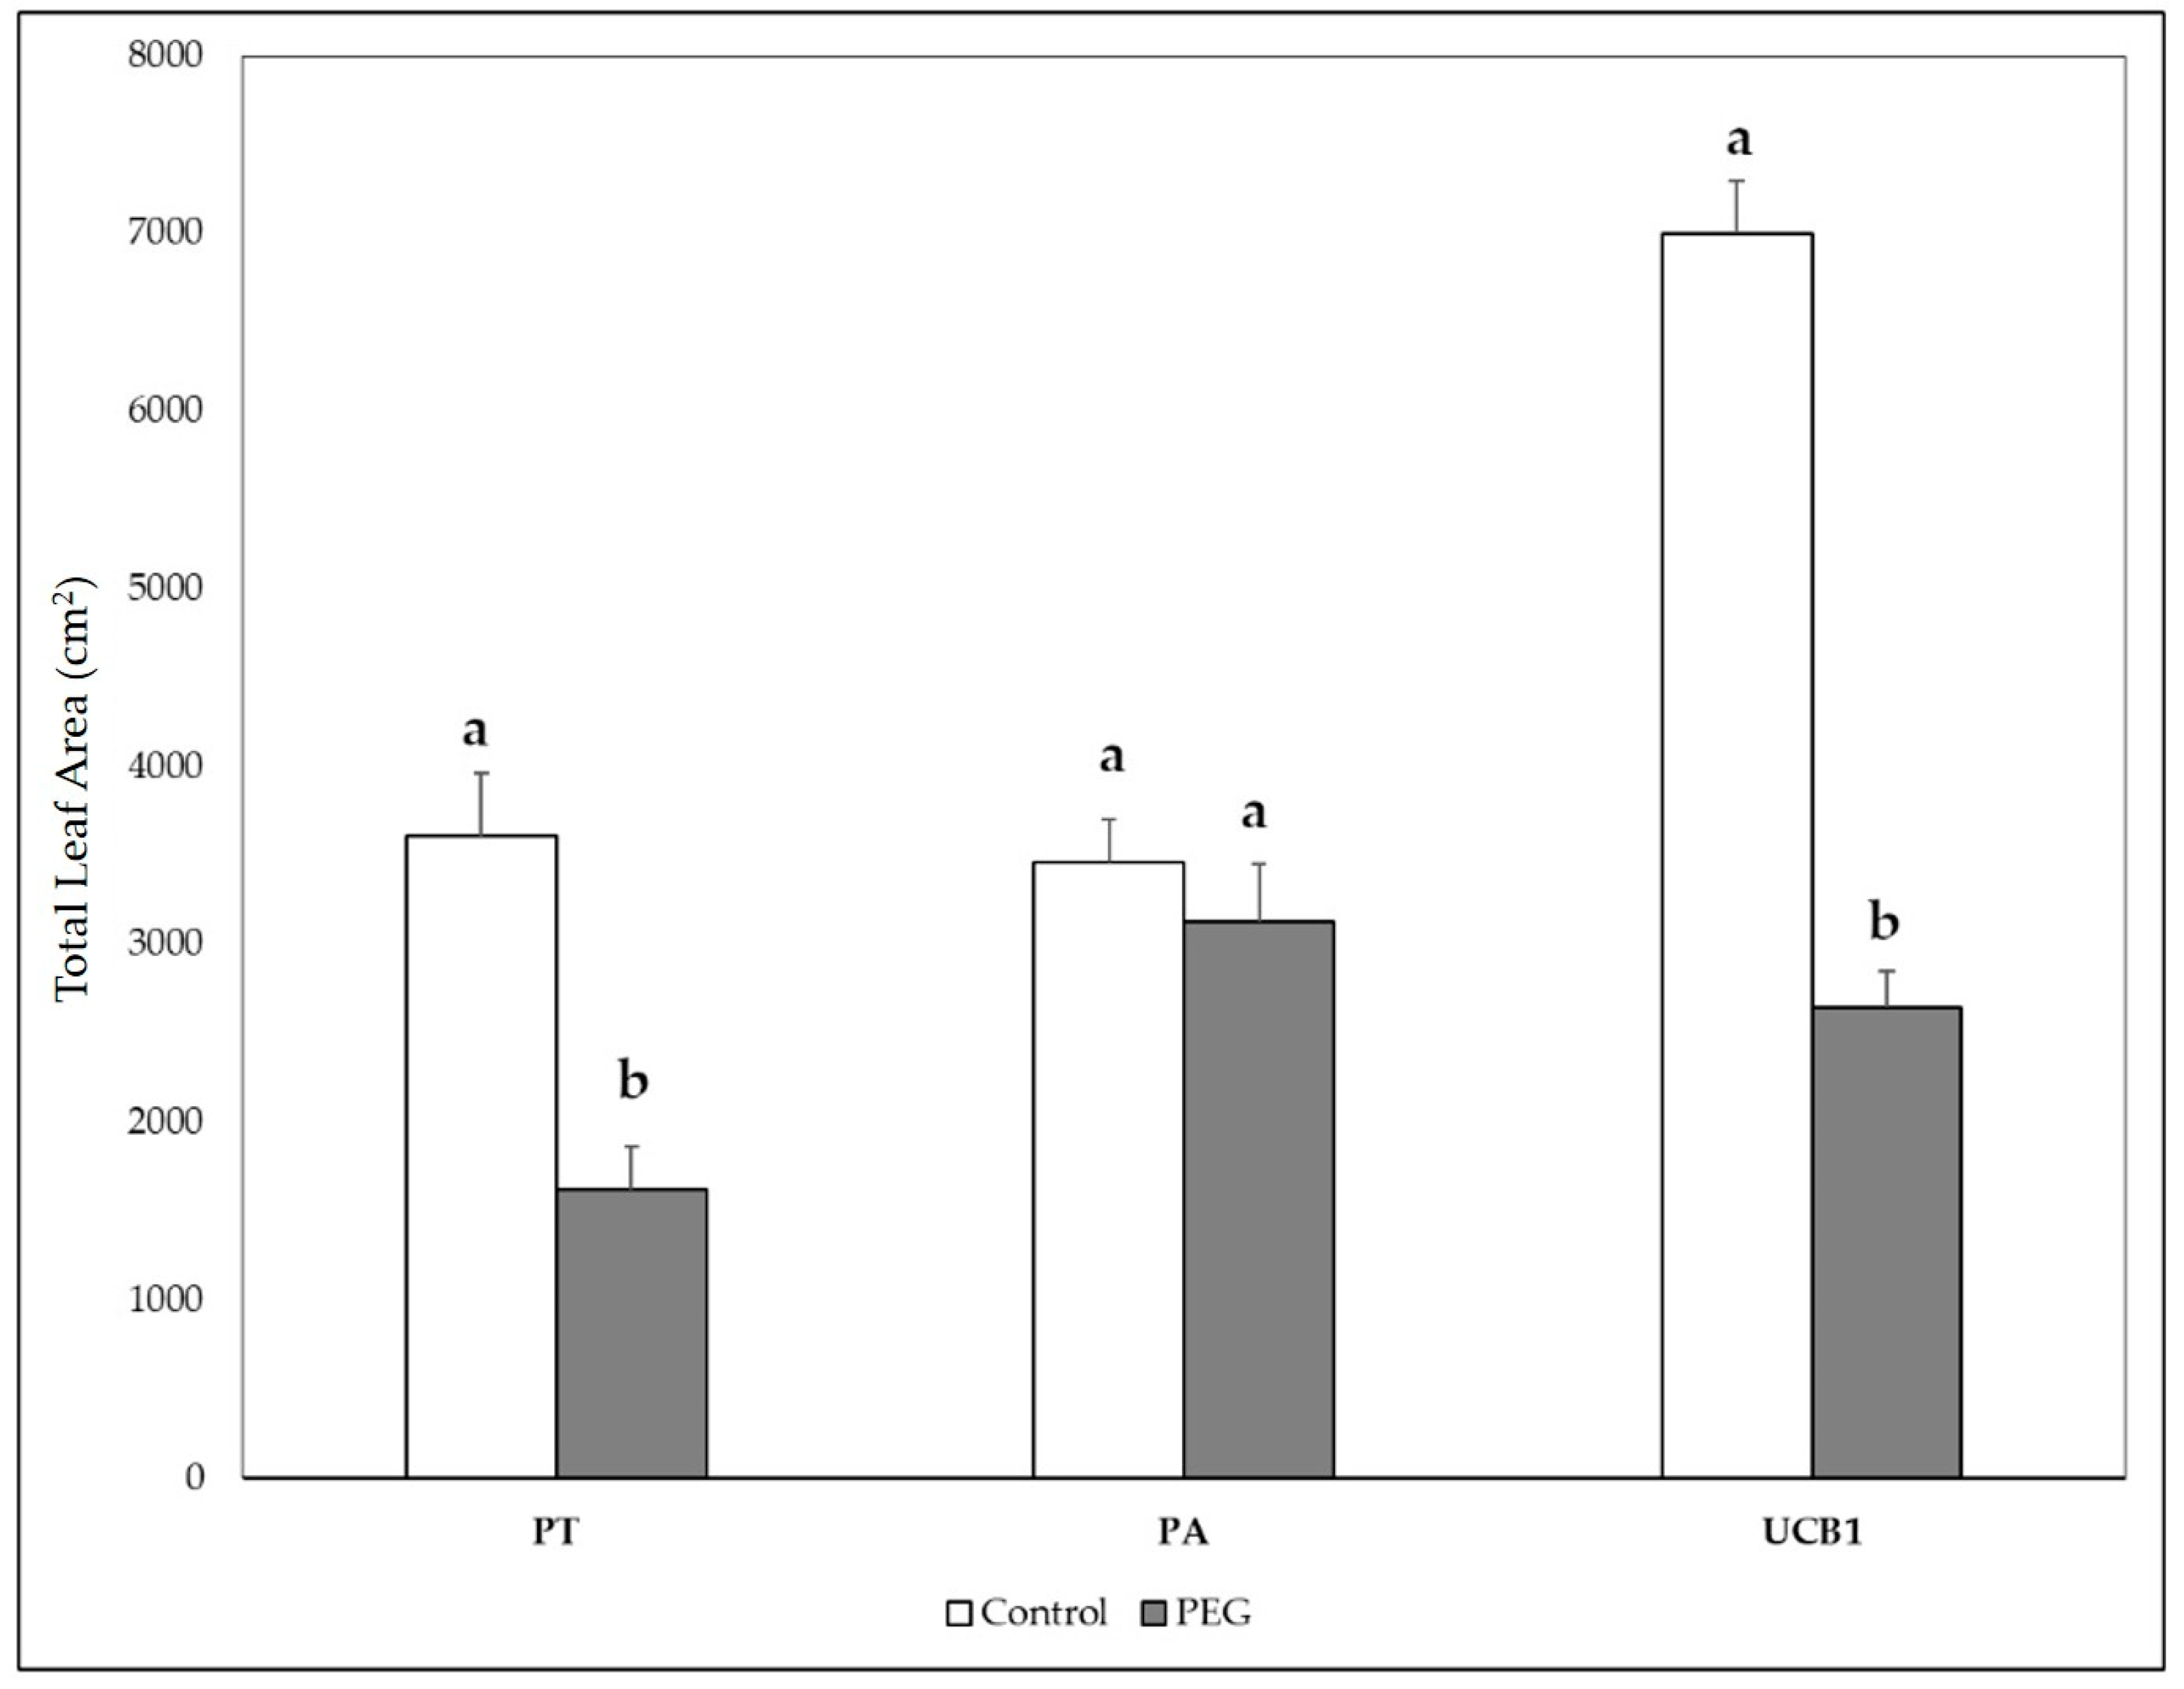
3.5. Biomass Weight and Plant Growth

Figure 5 shows the values of total dry biomass (g), leaf dry biomass (g), and branch dry biomass (g) in both control and stressed plants grafted onto PT, PA, and UCB-1. The rootstock selected for the grafts had a significant effect on the production of biomass. Plants grafted onto UCB-1 produced more biomass (204.5 g) than those grafted onto PA (150.01 g) and PT (92.08 g). Stress treatment had a significant effect on biomass production: plants subjected to stress produced less total biomass (117.73 g) than control plants (179.84 g). Plants grafted onto UCB-1 produced significantly greater leaf biomass (94.45 g) than those grafted onto PA (63.92 g) or PT (41.66 g). Stress treatment affected leaf biomass significantly: plants subjected to stress produced less leaf biomass (53.47 g) than control plants did (79.89 g). Plants grafted onto UCB-1 had significantly greater branch biomass (109.8 g) than those grafted onto PA (86.09 g) or PT (50.42 g). Stress treatment produced significantly less branch biomass (64.26 g) than that in control plants (99.95 g). There was significant interaction between rootstock and stress level: plants grafted onto PA and subjected to stress were those that least reduced their branch biomass from control plants (82.11 vs. 90.08 g) when compared with UCB-1 (71.32 vs. 148.28 g) or PT (39.36 vs. 61.48 g).
Figure 6 and Figure 7 show the values of the number of leaves, unitary leaf area (cm2), and total leaf area of the plants grafted onto PT, PA, and UCB-1 subjected to stress and of the control plants. UCB-1 had significantly more leaves (108) than those grafted onto PA (81) or PT (59). The number of leaves fell significantly under stress treatment (69 vs. 96). There was no significant effect on the unitary leaf area caused by different rootstocks or stress levels. The rootstock influenced the total leaf area (cm2) significantly. Plants grafted onto UCB-1 had a total leaf area of 4825 cm2, those grafted onto PA, 3292.7 cm2, and those onto PT, 2619.5 cm2. Plants subjected to stress had their total leaf area (2468.4 cm2) significantly lower than non-stressed plants (4689.8 cm2).

4. Discussion

In the absence of stress (control treatment), PT rootstock led to lower water potentials than PA and, even more, UCB-1. These effects of the rootstock on control plants were more evident at the end of the stress period and at the end of the recovery period. PT caused a constitutive response that reduced the water potential of the cultivar that was not subjected to water stress. The Kerman cultivar is expected, when stress is absent or moderate, to be more productive on PA and UCB-1 rootstocks than on PT. In general, adaptive response traits affect yield under pronounced stress conditions, whereas constitutive traits like the ones observed in this study affect yield when the plant is under low or moderate stress [31,45,46]. When plants were subjected to stress, they showed, regardless of the rootstock used, significantly lower water potentials than control plants at both the start and the end of the stress period.
The water potentials reached were lower than what might be expected for a concentration of 200 g L−1 of PEG 6000 in the nutrient solution, which would give an osmotic potential in distilled water of Ψs, near to −2.5 MPa. The water used had an EC of 1 dS m−2, attaining, with the addition of Hoagland solution salts, a final EC of 3.5 dS m−2. This affected water potential values. In any case, the water potential values reached were sufficient for studying the responses of a species like pistachio, which tolerates potentials of up to −5 or −6 MPa [1].
When the plants grafted onto PT were subjected to stress, they had water potentials significantly lower than those grafted onto PA and UCB-1. This was seen both at the end of the stress period and after the recovery period (Figure 1). Other authors [18,33] also found that, under stress conditions, the PT rootstock had lower potentials than PA and UCB-1. These low water potentials can be considered a feature of tolerance to water stress [21]. The recovery period was relatively rapid—less than the 40 days reported by [13]. After 14 days of the recovery period, there were no differences between the water potential of the plants subjected to stress and control plants, while differences between the rootstocks were maintained.
The PT rootstock is the least vigorous of the three, with a certain size-reducing character [47,48]. Plants grafted onto rootstock with these traits usually have lower water potential values than those grafted onto vigorous rootstocks [29,30].
Plants grafted onto UCB-1 had greater gas exchange capacity, even under stress conditions (Table 1), which is related to greater plant growth (Figure 5). Bigger plants have more potential production [33]. When under stress, plants grafted onto UCB-1 were those that least reduced their A from control values (Table 1). Plants able to maintain photosynthetic capacity under stressful conditions resist stress better [19].
Plants grafted onto UCB-1 had significantly more efficient carboxylation (Table 2). This greater capacity of the Rubisco enzyme to convert CO2 into glucids, combined with greater A and gs, suggests that UCB-1 gives its cultivars increased net photosynthesis potential [49,50]. Plants grafted onto PT increased their WUE under stress conditions (Table 2). This could be due to the reduction of E (Table 1), which is a constituent trait conferred on the cultivar [51]. Increased WUE under stress conditions due to the reduction of E in the plants grafted onto PT could be due to this rootstock’s size-reducing character. Reduced E causes a directly proportional reduction in growth [52].
The plants grafted onto PT had lower stress-induced concentrations of chlorophyll (Figure 2). Chlorophyll plays a major role in maintaining photosynthetic capacity and is one of the principal mechanisms for reducing the effects of water stress [21,51]. PT-grafted plants had higher flavonol concentrations even under control conditions, which implies a constitutive adaptation to water stress [31]. When plants were subjected to stress, the ones grafted onto UCB-1 were those that increased most of their leaf flavonol concentrations over control values (Figure 3). This increased synthesis of phenolic compounds, stimulated by biotic and abiotic stresses, is a drought-responsive trait conferred on the cultivar by the rootstock [31,53]. These phenolic compounds act as scavengers of reactive oxygen species (ROS) caused by stress [54]. Some authors [55,56] found that wheat and tomato cultivars previously classified as resistant to water stress were those that had the highest concentrations of these compounds under stress conditions. Similarly, the plants subjected to stress and grafted onto PA and UCB-1 were those that most increased their anthocyanin concentrations over control (Figure 3). Anthocyanins, which are also phenolic compounds, act as scavengers of ROS, thus protecting the photosynthesis mechanism [31,57]. The rootstocks causing greater synthesis of these compounds under stress conditions confer on the cultivar an adaptation in response to stress [31,51].
Plants grafted onto UCB-1 grew most, whether with unlimited irrigation or with restricted irrigation (Figure 5). This rootstock is probably the one that gives the cultivar the greatest productive potential under light or moderate stress, as well as a more stable yield under control conditions [21,33]. Plants grafted onto UCB-1 were those that reduced their leaf area the most when suffering from water stress (Figure 6). Inhibition of leaf growth when only limited water is available is a drought-responsive morphological trait that reduces the plant’s area for evaporation and so lowers water loss per surface unit [31,58].

5. Conclusions

PT rootstock is considered very tolerant of drought. Under our trial conditions, the plants grafted onto PT showed constitutive traits of tolerance that were expressed even when unlimited water was available. Under stress conditions, PT is the rootstock that most reduces the stomatal conductance, photosynthesis, and growth of the cultivar. Of the three rootstocks, PT is probably the best suited to surviving in highly adverse conditions, but this facet penalizes its yield when water limitation is not extreme. The plants grafted onto UCB-1 had drought-responsive traits in response to water stress. Under the same conditions of stress, the cultivar had greater gas exchange, more photosynthesis, more efficient carboxylation, better synthesis of phenolic compounds, and better growth. PA rootstock led to drought-responsive traits that were similar, but inferior, to those caused by UCB-1. PA caused greater anthocyanin leaf concentration in response to stress, maintained higher chlorophyll levels than PT, and had gas exchange and net photosynthesis values that lay between PT and UCB-1. Given the sensitivity of PA and PT to Verticillium wilt, UCB-1 seems to be the better option under supplementary irrigation conditions when the plant is suffering moderate stress.
Under field conditions, these responses will be greatly nuanced by the ability of the rootstocks to develop a powerful root system. In our trial, root development was limited by hydroponics and pot volume. On the other hand, the stress caused by PEG-6000 is immediate and intense, whereas in the field, stress occurs gradually, and it is known that this can cause stress adaptation mechanisms to have a very different expression. We believe that further studies are needed to better understand the responses observed in the field.

Author Contributions

Conceptualization, E.F.-S. and J.A.; methodology, E.F.-S., P.G.-E., E.F.d.A. and N.R.-M.; software, E.F.-S. and P.G.-E., Validation, E.F.-S. and J.A.; formal analysis and investigation, E.F.-S. and J.A.; writing—original draft preparation, E.F.-S., P.G.-E. and J.A.; writing—review and editing, E.F.-S. and P.G.-E.; supervision, E.F.-S. and J.A.; project administration, N.R.-M., P.G.-E. and J.A.; writing—review and editing, E.F.-S. and P.G.-E.; supervision, E.F.-S.; funding acquisition, J.A. All authors have read and agreed to the published version of the manuscript.

Funding

E. Fernández-Suela has a predoctoral grant BES-2017-082165, funded by MCIN/AEI/10.13039/501100011033 and by ESF Investing in your future. This work was supported by GO-IMPLANTAVERA “El pistachero en la Comunidad de Madrid: desarrollando una estrategia de implantación de un cultivo alternativo, rentable y respetuoso con el Medio Ambiente” funded by the European agricultural fund for rural development (EAFRD), the Ministerio de Agricultura, Pesca y Alimentación, and IMIDRA in the context of the Rural Development Programme of Comunidad de Madrid 2014–2020.

Data Availability Statement

Data are contained within the article.

Acknowledgments

Special thanks are given to Daniel Gil-Horvat, Donato Plaza, José María Cristóbal, Lucas Fernández, Laura Salcedo, Genoveva Pastor, Elena Romero, Javier Cascajero, Carmen Garrido, Eva Moya, and Teresa Belver for their fieldwork support.

Conflicts of Interest

The authors declare no conflict of interest. The funders had no role in the design of this study, in the collection, analysis, or interpretation of data, in the writing of this manuscript, or in the decision to publish this results.

References

  1. Behboudian, M.H.; Walker, R.R.; Törökfalvy, E. Effects of water stress and salinity on photosynthesis on pistachio. Sci. Hortic. 1986, 29, 251–261. [Google Scholar] [CrossRef]
  2. Galindo, A.; Collado-González, J.; Griñán, I.; Corell, M.; Centeno, A.; Martín-Palomo, M.J.; Girón, P.; Rodríguez, Z.N.; Cruz, H.; Memmi, A.A.; et al. Deficit irrigation and emerging fruit crops as a strategy to save water in Mediterranean semiarid agrosystems. Agric. Water Manag. 2018, 202, 311–324. [Google Scholar] [CrossRef]
  3. Spiegel-Roy, P.; Mazigh, D.; Evenari, M. Response of Pistachio to Low Soil Moisture Conditions. J. Am. Soc. Hortic. Sci. 1977, 102, 470–473. [Google Scholar] [CrossRef]
  4. Lin, T.S.; Crane, J.C.; Ryugo, K.; Polito, V.S.; DeJong, T.M. Comparative study of leaf morphology, photosynthesis, and leaf conductance in selected Pistacia species. J. Am. Soc. Hortic. Sci. 1984, 109, 325–330. [Google Scholar] [CrossRef]
  5. Germana, C. The response of pistachio trees to water stress as affected by two different rootstocks. In Proceedings of the II International Symposium on Irrigation of Horticultural Crops, Chania (Crete), Greece, 9–13 September 1996. [Google Scholar]
  6. Kanber, R.; Yazar, A.; Önder, S.; Köksal, H. Irrigation response of pistachio (Pistacia vera L.). Irrig. Sci. 1993, 14, 7–14. [Google Scholar] [CrossRef]
  7. Goldhamer, D.A. Tree water requirements and regulated deficit irrigation. In Pistachio Production Manual, 4th ed.; Ferguson, L., Ed.; University of California: Davis, CA, USA, 2005; pp. 103–116. [Google Scholar]
  8. Iniesta, F.; Testi, L.; Goldhamer, D.A.; Fereres, E. Quantifying reductions in consumptive water use under regulated deficit irrigation in pistachio (Pistacia vera L.). Agric. Water Manag. 2008, 95, 877–886. [Google Scholar] [CrossRef]
  9. Marino, G.; Di Martino, S.; Roxas, A.A.; Caruso, T.; Ferguson, L.; Barone, E.; Marra, F.P. Sustainability of pistachio production (Pistacia vera L.) under supplemental irrigation in a Mediterranean climate. Sci. Hortic. 2018, 241, 260–266. [Google Scholar] [CrossRef]
  10. Goldhamer, D.A.; Beede, R.; Moore, J.M.; Weinberger, G.; Menezes, J., Jr. Water use requirements and physiological response to water stress in pistachio. In Annual Report of the California Pistachio Commission, Crop Year 1982–1983; University of California: Davis, CA, USA, 1983; pp. 53–57. [Google Scholar]
  11. Goldhamer, D.A.; Kjelgren, R.; Beede, R.; Williams, L.; Moore, M.J.; Lane, J.; Weinberger, G.; Menezes, J. Water use requirements of pistachio trees and response to water stress. In Annual Report of the California Pistachio Commission, Crop Year 1984–1985; University of California: Davis, CA, USA, 1985; pp. 85–92. [Google Scholar]
  12. Goldhamer, D.A. Irrigation management. In Pistachio Production; Ferguson, L., Ed.; Center for Fruit and Nut Research and Information: Davis, CA, USA, 1995; pp. 71–81. [Google Scholar]
  13. Memmi, H.; Gijón, M.C.; Couceiro, J.F.; Pérez-López, D. Water stress thresholds for regulated deficit irrigation in pistachio trees: Rootstock influence and effects on yield quality. Agric. Water Manag. 2016, 164, 58–72. [Google Scholar] [CrossRef]
  14. Kermani, M.M.; Salehi, F. Determination of pistachio crop evapotranspiratation (ETc). In Proceedings of the IV International Symposium on Pistachios and Almonds, Teheran, Iran, 22 May 2005. [Google Scholar]
  15. Testi, L.; Goldhamer, D.A.; Iniesta, F.; Salinas, M. Crop water stress index is a sensitive water stress indicator in pistachio trees. Irrig. Sci. 2008, 26, 395–405. [Google Scholar] [CrossRef]
  16. Anuario estadistica. Ministerio de Agricultura, Pesca y Alimentación. MAPA. 2022. Available online: https://www.mapa.gob.es/es/estadistica/temas/publicaciones/anuario-de-estadistica/default.aspx (accessed on 23 October 2023).
  17. Encuesta sobre Superficie y Rendimientos Cultivos. Ministerio de Agricultura, Pesca y Alimentación. 2022. Available online: https://www.mapa.gob.es/es/estadistica/temas/estadisticas-agrarias/agricultura/esyrce/ (accessed on 23 October 2023).
  18. Moriana, A.; Memmi, H.; Centeno, A.; Martín-Palomo, M.J.; Corell, M.; Torrecillas, A.; Pérez-López, D. Influence of rootstock on pistachio (Pistacia vera L. cv Kerman) water relations. Agric. Water Manag. 2018, 202, 263–270. [Google Scholar] [CrossRef]
  19. Ranjbarfordoei, A.; Samson, R.; Van Damme, P.; Lemeur, R. Effects of drought stress induced by polyethylene glycol on pigment content and photosynthetic gas exchange of Pistacia khinjuk and P. mutica. Photosynthetica 2000, 38, 443–447. [Google Scholar] [CrossRef]
  20. Arzani, K.; Ghasemi, M.; Yadollahi, A.; Hokmabadi, H. Study of foliar epidermal anatomy of four pistachio rootstocks under water stress. Idesia 2013, 31, 101–107. [Google Scholar] [CrossRef]
  21. Esmaeilpour, A.; Van Labeke, M.C.; Samson, R.; Van Damme, P. Osmotic stress affects physiological responses and growth characteristics of three pistachio cultivars. Acta Physiol. Plant. 2015, 37, 123. [Google Scholar] [CrossRef]
  22. Esmaeilpour, A.; Van Labeke, M.C.; Samson, R.; Boeckx, P.; Van Damme, P. Variation in biochemical characteristics, water status, stomata features, leaf carbon isotope composition and its relationship to water use efficiency in pistachio (Pistacia vera L.) cultivars under drought stress condition. Sci. Hortic. 2016, 211, 158–166. [Google Scholar] [CrossRef]
  23. Khoyerdi, F.F.; Shamshiri, M.H.; Estaji, A. Changes in some physiological and osmotic parameters of several pistachio genotypes under drought stress. Sci. Hortic. 2016, 198, 44–51. [Google Scholar] [CrossRef]
  24. Rahneshan, Z.; Nasibi, F.; Moghadam, A.A. Effects of salinity stress on some growth, physiological, biochemical parameters and nutrients in two pistachio (Pistacia vera L.) rootstocks. J. Plant Interact. 2018, 13, 73–82. [Google Scholar] [CrossRef]
  25. De Palma, L.; Novello, V. Effect of drip irrigation on leaf gas exchanges and stem water potential in pistachio cv. Larnaka. In Proceedings of the II International Symposium on Pistachios and Almonds, Davis, CA, USA, 1 August 1998. [Google Scholar]
  26. Sedaghati, N.; Hokmabadi, H. Optimizing pistachio irrigation management using the relationship between echo-physiological characteristics and water stress. J. Agric. Sci. Technol. 2015, 17, 189–200. [Google Scholar]
  27. Jones, H.G. How do rootstocks control shoot water relations? New Phytol. 2012, 194, 301–303. [Google Scholar] [CrossRef]
  28. Ezzahouani, A.; Williams, L.E. The influence of rootstock on leaf water potential, yield, and berry composition of Ruby Seedless grapevines. Am. J. Enol. Vitic. 1995, 46, 559–563. [Google Scholar] [CrossRef]
  29. Atkinson, C.J.; Else, M.A.; Taylor, L.; Dover, C.J. Root and stem hydraulic conductivity as determinants of growth potential in grafted trees of apple (Malus pumila Mill.). J. Exp. Bot. 2003, 54, 1221–1229. [Google Scholar] [CrossRef]
  30. Motisi, A.; Caruso, T.; Grutta, I.; Marra, F.P.; Pernice, F. Canopy architecture appraisal by fractal dimension of ‘Flordastar’ peach trees grafted onto different rootstocks. In Proceedings of the VIII International Symposium on Canopy, Rootstocks and Environmental Physiology in Orchard Systems, Budapest, Hungary, 13–18 June 2004. [Google Scholar]
  31. Kumar, P.; Rouphael, Y.; Cardarelli, M.; Colla, G. Vegetable grafting as a tool to improve drought resistance and water use efficiency. Front. Plant Sci. 2017, 8, 1130. [Google Scholar] [CrossRef] [PubMed]
  32. Ghrab, M.; Ben Mimoun, M.; Triki, H.; Gouta, H. Evaluation of the Performance of Seventeen Male Pistachio-Three Specimens. In Proceedings of the III International Symposium on Pistachios and Almonds, Zaragoza, Spain, 20–24 May 2001. [Google Scholar]
  33. Gijón, M.C.; Gimenez, C.; Perez-López, D.; Guerrero, J.; Couceiro, J.F.; Moriana, A. Rootstock influences the response of pistachio (Pistacia vera L. cv. Kerman) to water stress and rehydration. Sci. Hortic. 2010, 125, 666–671. [Google Scholar] [CrossRef]
  34. Memmi, H.; Centeno, A.; Moriana, A.; Corell, M.; Torrecillas, A.; Pérez, D. Influence of rootstocks on pistachio (Pistacia vera L.) water relations. In Proceedings of the XIII Simposio Hispano-Portugués de Relaciones Hídricas en las Plantas, Pamplona, Spain, 18–20 October 2016. [Google Scholar]
  35. Memmi, H.; Couceiro, J.F.; Gijón, M.C.; Pérez-López, D. Impact of wáter stress, environment and rootstock on the diurnal behavior of stem wáter potential and leaf conductance in pistachio (Pistacia vera L.). Span. J. Agric. Res. 2016, 14, 0804. [Google Scholar] [CrossRef]
  36. Preston, A.P. Apples for amateurs. GC HTJ 1980, 187, 15–17. [Google Scholar]
  37. Osmolovskaya, N.; Shumilina, J.; Kim, A.; Didio, A.; Grishina, T.; Bilova, T.; Keltsieva, O.A.; Zhukov, V.; Tikhonovich, I.; Tarakhovskaya, E.; et al. Methodology of drought stress research: Experimental setup and physiological characterization. Int. J. Mol. Sci. 2018, 19, 4089. [Google Scholar] [CrossRef] [PubMed]
  38. Bressan, R.A.; Handa, A.K.; Handa, S.; Hasegawa, P.M. Growth and water relations of cultured tomato cells after adjustment to low external water potentials. Plant Physiol. 1982, 70, 1303–1309. [Google Scholar] [CrossRef] [PubMed]
  39. Hohl, M.; Schöpfer, P. Growth at reduced turgor: Irreversible and reversible cell-wall extension of maize coleoptiles and its implications for the theory of cell growth. Planta 1982, 187, 209–217. [Google Scholar] [CrossRef]
  40. Lu, Z.; Neumann, P.M. Water-stressed maize, barley and rice seedlings show species diversity in mechanisms of leaf growth inhibition. J. Exp. Bot. 1998, 49, 1945–1952. [Google Scholar] [CrossRef]
  41. Hoagland, D.R.; Arnon, D.I. The water-culture method for growing plants without soil. Circ. Calif. Agric. Exp. Stn. 1950, 347, 32. [Google Scholar]
  42. Michel, B.E.; Kaufmann, M.R. The osmotic potential of polyethylene glycol 6000. Plant Physiol. 1973, 51, 914–916. [Google Scholar] [CrossRef]
  43. Kramer, P.J.; Boyer, J.S. Water Relations of Plants and Soils, 1st ed.; Academic press: San Diego, CA, USA, 1995; pp. 167–199. [Google Scholar]
  44. Begg, J.E.; Turner, N.C. Water potential gradients in field tobacco. Plant Physiol. 1970, 46, 343–346. [Google Scholar] [CrossRef] [PubMed]
  45. Tuberosa, R. Phenotyping for drought tolerance of crops in the genomics era. Front. Physiol. 2012, 3, 347. [Google Scholar] [CrossRef] [PubMed]
  46. Boopathi, N.M.; Swapnashri, G.; Kavitha, P.; Sathish, S.; Nithya, R.; Ratnam, W.; Kumar, A. Introgression, evaluation and bulked segregant analysis of major yield QTL under water stress into indigenous elite line for low water. Rice Sci. 2012, 19, 1–6. [Google Scholar]
  47. Guerrero, J.; Couceiro, J.F.; Moriana, A. Selection of terebinth (Pistacia terebinthus L.) trees as seed producers for pistachio (Pistacia vera L.) rootstocks in the Castilla La Mancha (Spain). FAO-Nucis Newsl. 2002, 11, 25–29. [Google Scholar]
  48. Arpaci, S.; Acar, S.; Karadag, H.S.; Atli, H.S.; Ak, B.E.; Sarpkaya, K. Comparison of growing of pistachio rooststocks on different planting intervals. In ISHS Acta Horticulturae 1028; VI International Symposium on Almonds and Pistachios; International Society For Horticultural Science: Korbeek-Lo, Belgium, 2013. [Google Scholar]
  49. Taiz, L.; Zeiger, E. Photosynthesis. In Plant Physiology, 5th ed.; Sinauer Associates Inc.: Sunderland, MA, USA, 2010. [Google Scholar]
  50. Iacono, F.; Bucella, A.; Peterlunger, E. Water stress and rootstock influence on leaf gas exchange of grafted and ungrafted grapevines. Sci. Hortic. 1998, 75, 27–39. [Google Scholar] [CrossRef]
  51. Nezami, S.R.; Yadollahi, A.; Hokmabadi, H.; Tajabadipour, A. Changes in Drought Tolerance Mechanism at Different Times of Stress and Re-hydration in Hybrid Pistachio Rootstock. J. Nuts 2021, 12, 333–360. [Google Scholar]
  52. Blum, A. Effective use of water (EUW) and not water-use efficiency (WUE) is the target of crop yield improvement under drought stress. Field Crops Res. 2009, 112, 119–123. [Google Scholar] [CrossRef]
  53. Parida, A.K.; Das, A.B.; Sanada, Y.; Mohanty, P. Effects of salinity on biochemical components of the mangrove, Aegiceras corniculatum. Aquat. Bot. 2004, 80, 77–87. [Google Scholar] [CrossRef]
  54. Grace, S.C.; Logan, B.A. Energy dissipation and radical scavenging by the plant phenylpropanoid pathway. Trans. R. Soc. Lond. Ser. B Biol. Sci. 2000, 355, 1499–1510. [Google Scholar] [CrossRef]
  55. Sánchez-Rodríguez, E.; Moreno, D.A.; Ferreres, F.; del Mar Rubio-Wilhelmi, M.; Ruiz, J.M. Differential responses of five cherry tomato varieties to water stress: Changes on phenolic metabolites and related enzymes. Phytochemistry 2011, 72, 723–729. [Google Scholar] [CrossRef]
  56. Bürling, K.; Cerovic, Z.G.; Cornic, G.; Ducruet, J.M.; Noga, G.; Hunsche, M. Fluorescence-based sensing of drought-induced stress in the vegetative phase of four contrasting wheat genotypes. Environ. Exp. Bot. 2013, 89, 51–59. [Google Scholar] [CrossRef]
  57. Chalker-Scott, L. Environmental significance of anthocyanins in plant stress responses. Photochem. Photobiol. 1999, 70, 1–9. [Google Scholar] [CrossRef]
  58. Álvarez, S.; Rodríguez, P.; Broetto, F.; Sánchez-Blanco, M.J. Long term responses and adaptive strategies of Pistacia lentiscus under moderate and severe deficit irrigation and salinity: Osmotic and elastic adjustment, growth, ion uptake and photosynthetic activity. Agric. Water Manag. 2018, 202, 253–262. [Google Scholar] [CrossRef]
Figure 1. Stem water potential (MPa) measured at solar midday in P. vera cv. Kerman plants grafted onto P. terebinthus (PT), P. atlantica (PA), and UCB−1 were subjected to water stress (PEG) and control treatment (Control). Letters marked significant differences in the same period, and bars marked the standard error of the average.
Horticulturae 09 01305 g001
Figure 2. Chlorophyll (Chl) concentrations in mg cm−2 at the end of the recovery period in P. vera cv. Kerman plants grafted onto P. terebinthus (PT), P. atlantica (PA), and UCB−1 were subjected to water stress (PEG) and control treatment (Control). Letters show significant differences between the values, and bars show the standard error of each average.
Horticulturae 09 01305 g002
Figure 3. Flavonol (Flav) concentrations in µg cm−2 at the end of the recovery period in P. vera cv. Kerman plants grafted onto P. terebinthus (PT), P. atlantica (PA), and UCB−1, subjected to water stress (PEG) and control treatment (Control). Letters show significant differences between the values, and bars show the standard error of each average.
Horticulturae 09 01305 g003
Figure 4. Leaf anthocyanin concentrations in µg cm−2 at the end of the recovery period in P. vera cv. Kerman plants grafted onto P. terebinthus (PT), P. atlantica (PA), and UCB−1 were subjected to water stress (PEG) and control treatment (Control). Letters show significant differences between the values, and bars show the standard error of each average.
Horticulturae 09 01305 g004
Figure 5. Dry biomass of P. vera cv. Kerman plants grafted onto P. terebinthus, P. atlantica, or UCB-1, divided into total dry biomass (g), dry leaf biomass (g), and dry branch biomass (g), was subjected to water stress (PEG) and control treatment (Control). Letters show significant differences between the values, and bars show the standard error of each average.
Horticulturae 09 01305 g005
Figure 6. Number of leaves per plant of P. vera cv. Kerman plants grafted onto P. terebinthus, P. atlantica, or UCB-1 subjected to water stress (PEG) and control treatment (Control). Letters show significant differences between the values, and bars show the standard error of each average.
Horticulturae 09 01305 g006
Figure 7. Total leaf area of P. vera cv. Kerman plants grafted onto P. terebinthus, P. atlantica, or UCB−1 subjected to water stress (PEG) and control treatment (Control) Letters show significant differences between the values, and bars show the standard error of each average.
Horticulturae 09 01305 g007
Table 1. Photosynthesis parameters, substomatal CO2 concentration (Ci) (µmol CO2 mol−1), transpiration (E) (mmol H2O m−2 s−1), stomatal conductance (gs) (mol CO2 m−2 s−1), and net photosynthesis (A) (µmol CO2 m−2 s−1), all measured in P. vera L. cv. Kerman plants grafted onto P. terebinthus (PT), P. atlantica (PA), or UCB-1 were subjected to two stress treatments (control and stress, PEG). Measurements were taken at the start of the stress period, at the end of it, and at the end of the recovery period.
Start of StressEnd of StressRecovery
RootstockTraitCiEgsACiEGsACiEgsA
P. terebinthusControl240 ± 55.4 ± 0.80.18 ± 0.0412.9 ± 2.0231 ± 183.6 ± 0.50.2 ± 0.0414.2 ± 1.4266 ± 243.0 ± 0.10.19 ± 0.0114.6 ± 1.5
PEG184 ± 154.5 ± 0.50.12 ± 0.0213.7 ± 1.0223 ± 171.7 ± 0.00.06 ± 0.015.9 ± 0.8201 ± 282.4 ± 0.70.12 ± 0.0511.5 ± 2.8
P. atlanticaControl219 ± 46.7 ± 0.40.18 ± 0.0214.9 ± 1.5228 ± 84.2 ± 0.10.21 ± 0.0115.7 ± 0.9256 ± 73.6 ± 0.20.17 ± 0.0212.8 ± 0.7
PEG200 ± 115.3 ± 0.70.12 ± 0.0211.7 ± 1.1164 ± 21.8 ± 0.00.06 ± 0.017.3 ± 0.3248 ± 32.6 ± 0.50.10 ± 0.058.5 ± 2.1
UCB-1Control219 ± 77.9 ± 0.10.22 ± 0.0117.4 ± 0.9217 ± 75.1 ± 0.10.23 ± 0.0117.6 ± 0.8231 ± 124.3 ± 0.20.20 ± 0.0116.0 ± 1.1
PEG233 ± 247.1 ± 0.20.18 ± 0.0113.5 ± 1.8198 ± 72.6 ± 0.20.08 ± 0.018.4 ± 0.5207 ± 64.2 ± 0.20.14 ± 0.0215.2 ± 0.1
Rootstock effectP. terebinthus226 ± 145.2 ± 0.60.17 ± 0.0313.1 ± 1.4227 ± 112.6 ± 0.50.13 ± 0.0410.1 ± 2.0233 ± 222.7 ± 0.40.16 ± 0.0313.0 ± 1.4
P. atlantica209 ± 76.0 ± 0.50.15 ± 0.0213.3 ± 1.1196 ± 153.0 ± 0.50.13 ± 0.0411.5 ± 1.9252 ± 43.1 ± 0.30.14 ± 0.0310.7 ± 1.4
UCB-1226 ± 127.5 ± 0.20.20 ± 0.0115.4 ± 1.2207 ± 63.8 ± 0.60.15 ± 0.0413.0 ± 2.1219 ± 84.2 ± 0.10.17 ± 0.0215.6 ± 0.5
Trait effectControl226 ± 46.7 ± 0.40.19 ± 0.0215.1 ± 1.0225 ± 64.3 ± 0.30.21 ± 0.0115.8 ± 0.7252 ± 103.6 ± 0.20.19 ± 0.0114.4 ± 0.7
PEG212 ± 135.9 ± 0.50.15 ± 0.0112.8 ± 0.9195 ± 102.0 ± 0.20.06 ± 0.017.2 ± 0.5218 ± 113.1 ± 0.40.12 ± 0.0211.7 ± 1.4
ANOVARootstockNs 10.0070.04ns0.050.001Ns0.02ns0.007ns0.035
Treatment0.050.020.03ns0.0070.0010.0010.0010.03ns0.02ns
P × T0.03nsnsnsnsNsNsnsnsnsnsns
In the same column, the average value ± standard is shown as an error. 1 ns: no significant differences (p ≥ 0.05).
Table 2. Carboxylation efficiency (A/Ci), intrinsic water use efficiency (A/gs), instantaneous water use efficiency (WUE), and Fv/Fm (Chlorophyll fluorescence) were measured when PEG was applied (start of stress), after the stress period (end of stress), and after 14 days of plant irrigation solely with Hoagland solution (Recovery).
Start of StressEnd of StressRecovery
RootstockTraitA/CiA/gsWUEFv/FmA/CiA/gsWUEFv/FmA/CiA/gsWUEFv/Fm
P. terebinthusControl0.05 ± 0.00873.1 ± 6.92.4 ± 0.10.81 ± 0.010.06 ± 0.00676.9 ± 14.34.0 ± 0.40.83 ± 0.0010.06 ± 0.01175.8 ± 10.04.8 ± 0.60.79 ± 0.02
PEG0.07 ± 0.001113.7 ± 9.13.0 ± 0.20.79 ± 0.010.03 ± 0.006106.7 ± 8.33.5 ± 0.40.82 ± 0.0020.06 ± 0.007109.0 ± 28.75.0 ± 0.40.80 ± 0.01
P. atlanticaControl0.07 ± 0.00884.8 ± 0.42.2 ± 0.10.80 ± 0.020.07 ± 0.00774.2 ± 4.13.8 ± 0.20.83 ± 0.0040.05 ± 0.00374.4 ± 2.83.6 ± 0.00.81 ± 0.01
PEG0.06 ± 0.003101.0 ± 9.82.2 ± 0.10.80 ± 0.020.04 ± 0.002132.4 ± 1.24.1 ± 0.10.81 ± 0.0040.03 ± 0.00989.3 ± 5.23.3 ± 0.10.78 ± 0.02
UCB-1Control0.08 ± 0.00777.5 ± 2.42.2 ± 0.10.82 ± 0.010.08 ± 0.00677.2 ± 1.63.5 ± 0.10.84 ± 0.0020.07 ± 0.00980.6 ± 1.83.7 ± 0.10.79 ± 0.02
PEG0.06 ± 0.01375.9 ± 11.01.9 ± 0.30.81 ± 0.010.04 ± 0.001112.9 ± 6.13.2 ± 0.10.82 ± 0.0040.07 ± 0.00293.0 ± 4.63.7 ± 0.10.78 ± 0.01
Rootstock effectP. terebinthus0.06 ± 0.00783.3 ± 11.32.6 ± 0.20.81 ± 0.010.04 ± 0.00991.8 ± 9.93.8 ± 0.30.82 ± 0.0020.06 ± 0.00692.4 ± 15.54.9 ± 0.30.80 ± 0.01
P. atlantica0.06 ± 0.00492.9 ± 5.72.2 ± 0.10.80 ± 0.010.06 ± 0.006103.3 ± 13.14.0 ± 0.10.82 ± 0.0050.04 ± 0.00581.9 ± 4.23.4 ± 0.10.80 ± 0.01
UCB-10.07 ± 0.00876.7 ± 5.02.1 ± 0.20.82 ± 0.010.06 ± 0.00995.0 ± 8.53.4 ± 0.10.83 ± 0.0040.07 ± 0.00486.8 ± 3.53.7 ± 0.10.79 ± 0.01
Trait effectControl0.07 ± 0.00578.4 ± 2.72.3 ± 0.10.81 ± 0.010.07 ± 0.00476.1 ± 4.33.8 ± 0.20.83 ± 0.0020.06 ± 0.00577.0 ± 3.24.0 ± 0.30.80 ± 0.01
PEG0.06 ± 0.00692.1 ± 8.22.2 ± 0.20.80 ± 0.010.04 ± 0.003117.3 ± 4.93.6 ± 0.20.82 ± 0.0020.05 ± 0.00697.1 ± 9.14.0 ± 0.30.79 ± 0.01
ANOVARootstockNs 10.050.02ns0.02nsNsns0.007ns0.001ns
Treatmentns0.01Nsns0.0010.001Ns0.001nsnsnsns
P × Tns0.030.02nsnsnsNsnsnsnsnsns
In the same column, the average value ± standard error is shown. 1 ns: no sognoficant differences (p ≥ 0.05).
Disclaimer/Publisher’s Note: The statements, opinions and data contained in all publications are solely those of the individual author(s) and contributor(s) and not of MDPI and/or the editor(s). MDPI and/or the editor(s) disclaim responsibility for any injury to people or property resulting from any ideas, methods, instructions or products referred to in the content.

