Article

Physicochemical Properties of Geographical Indication (GI) Sweet Cherries in China and Their Influencing Factors of Cultivar, Climate Type, and Soil Condition

Institute of Food and Nutrition Development, Ministry of Agriculture and Rural Affairs, Beijing 100081, China
*
Authors to whom correspondence should be addressed.
Horticulturae 2023, 9(10), 1118; https://doi.org/10.3390/horticulturae9101118
Submission received: 1 September 2023 / Revised: 27 September 2023 / Accepted: 3 October 2023 / Published: 10 October 2023
(This article belongs to the Special Issue Fruits Quality and Sensory Analysis)

Abstract

:
As one of the fruits widely planted in China, the quality of sweet cherries is affected by various factors. This study aims to investigate the characteristics of geographical indication (GI) sweet cherries grown in China and to analyze the effects of cultivars, climate types, and soil conditions on their quality traits. Twenty-two parameters of nine cherry samples and their planted soil properties were analyzed through a descriptive analysis and correlation analysis. There were significant differences in the physiochemical traits. Notable positive correlations between the fruit weight and its size, rate of edibility, and flavonoid content were shown. The Univariate-General Line Model exhibited that weight, soluble solids content (SSC), titratable acidity (TA), and total phenolic content (TPC) were mainly influenced by both the cultivar and climate type, while only the cultivar affected the maturity index (MI). Soil condition parameters were significantly different for each sample. Based on the established linear regression models, it was found that soil P had a positive impact on SSC and TA, but a negative effect on TPC (p < 0.05). On the other hand, soil K had a negative effect on TA but a positive impact on TPC (p < 0.05).

1. Introduction

Sweet cherry (Prunus avium L.) is a commercially valuable fruit in the global market, due to its appealing appearance, delicious taste, and nutritional traits [1,2]. Large fruit size is considered to be a priority aim for breeding programs and is highly associated with commercial value [3]. The size-related parameters of width and weight are widely applied as grading indexes in North American, European, and Asian countries [4,5,6]. The levels of soluble solids, total sugar, and titratable acidity affect cherries’ taste, both sweetness and sourness. These factors impact the overall perception of the taste of cherries and can determine whether consumers enjoy them or not [7,8]. Cherries are rich in polyphenolics that offer functional benefits to our health, making them a remarkable supplement to our diet. Anthocyanins, flavonoids, and hydroxycinnamic acids are dominant compounds for polyphenolics in cherry fruits [9]. Studies have shown that cherries contain phenolic compounds that can protect the nervous system, alleviate diabetes, inhibit chronic inflammation, and reduce serum uric acid levels. These benefits are attributed to the strong antioxidant properties of the compounds found in cherries [10,11,12,13].
The quality of cherries is influenced by various factors such as their genotypes, ripening stage, soil conditions, agronomic practices, and how they are treated after being harvested [14,15,16]. Sweet cherries grown in the same region exhibited noticeable variances in size, weight, SSC, TA, and phenolic composition [7,17]. When the same sweet cherry cultivars were introduced to separate experiment sites with different climate conditions, they showed varying levels of adaptability in terms of tree growth and fruit size [18,19]. With the soil amendment of sweet cherry trees, the changes in soil nutrition indicators have had an influence on their yielding and fruit characterizations [20,21]. Potassium plays an important role in carbon assimilation and transportation; metabolism regulation; affecting fruit size, color, soluble solids, and titratable acidity [22,23]; and increasing the ability of plants to resist diseases, and cold [24]. Phosphorus is one of the vital constitutional elements for cell membranes, primarily participating in energy transfer, enzyme activation/inactivation, and photosynthesis. It significantly contributes to fruit yield and modulating the production of metabolites and soluble solids [25].
The sweet cherry (P. avium) was first introduced in China more than 150 years ago and has become the dominant species with popular cultivars, such as Tieton, Hondeng, Brooks, Summit, Russia NO.8, Van, and Santina [26,27]. According to the USDA’s annual report, China has emerged as the top consumer of sweet cherries in recent times. Cherry production in China was 650,000 tons in 2022/2023, followed by Turkey (980,000 tons) and the European Union (727,000 tons). By 2022, cherry planting areas in China reached about 170,000 hectares, ranking first in the world [27]. With greatly increasing demand in the Chinese market, sweet cherries are not only grown in the originally introduced place Bohai Bay but also widely expanded in various provinces in the northwestern and southwestern parts of China. Since there is a lack of reasonable evaluation for growers, the newly introduced varieties cannot fully reflect the high quality in the new planting area as in the original places.
A geographical indication (GI) identifies a good that originated in a specific region, where given quality, reputation, or characteristics are essentially attributed to its geographical origin [28]. By 2022, there were 39 pieces of cherry GIs (mostly belonging to sweet cherries) registered in the Ministry of Agriculture and Rural Affairs of the People’s Republic of China (PRC). Each GI cherry product has unique characteristics due to its variations in cultivar and planting conditions. With regard to GI products (cherries included), researchers paid more attention to establishing traceability models to distinguish the authenticity of agricultural products by detecting multiple mineral elements and volatile compounds [29,30,31], rather than analyzing differences in product quality traits contributing to their cultivar and unique planting conditions [32,33].
Though many researchers have studied the impact of growing conditions (weather, fertilization, and irrigation) on sweet cherries in major producing countries [34,35,36], most of them were more likely to focus on vegetative growth and to study the effects of the specific soil nutrients on growth [37,38]; the influencing factors on fruit quality parameters have also been rarely involved. Also, a few surveys focused on cherry fruit characteristics in China—an emerging producer. In order to make suggestions for growers to select suitable sweet cherry cultivars in the appropriate planting environment and to manage orchards effectively, it is necessary to investigate the physicochemical properties of GI cherries in different regions and identify the factors (cultivar, climate type, and soil conditions) that affect them.

2. Materials and Methods

2.1. Fruit and Soil Materials

Nine cherry samples were obtained from nine GI products registered in the Ministry of Agriculture and Rural Affairs of the PRC (Table 1). For each GI product, one presentative commercial mature sweet cherry cultivar was selected. Three orchards located relatively scattered were chosen within the protective range for a GI product. The same weight of cherry fruits (500 g) was randomly picked and collected in an orchard. Cherries from three orchards were fully mixed as a whole, regarded as one GI cherry sample (about 1.5 kg for each). The samples were immediately packed with ice bags and transported to the laboratory within 24 h. All parameters of fresh fruits, including weight, size, juice yield, edible rate, soluble solids content, titratable acidity, maturity index, sugar composition, total sugar, total phenolics, total anthocyanins, total flavonoids, procyanidin, β-carotene, ascorbic acid, and minerals (potassium, magnesium, calcium, and iron), were analyzed immediately.
Taking the trunk as a circular dot and extending outward to the edge of the crown projection for soil collection, each tree took two points symmetrically, and 0–40 cm of soil was drilled with stainless steel soil. The soil samples collected from the three planting areas were thoroughly blended to ensure homogeneity. In each orchard, 300 g of a soil sample was collected, and for each GI product, a total of 900 g of a soil sample was obtained.

2.2. Chemicals and Reagents

All chemicals applied were an analytical grade, and the mobile phase ingredient and solution for the determination of sugar composition, total anthocyanins, β-carotene, and ascorbic acid were of an HPLC grade. Sugar standards included glucose (≥99.5%), fructose (≥99.0%), lactose (≥98.0%), sucrose (≥99.5%), and maltose (≥99.0%), as well as L (+)-ascorbic acid (≥99.0%), all purchased from Sigma (St. Louis, MO, USA). Gallic acid (≥99.0%), cyanidin-3-O-rutinoside (≥95.0%), procyanidin (≥95.0%), β-carotene (≥98.0%), delphinidin (≥97.0%), cyanidin-O-glucoside (≥95.0%), petunidin chloride (≥95.0%), pelargonium chloride (≥96.0%), peonidin (≥97.0%), and malvidin (≥97.0%) were from Yuanye Bio-Technology (Shanghai, China). The purities of potassium, magnesium, calcium, and iron standards were all 1000 μg/mL, all of which were purchased from the National Nonferrous Metals and Electronic Materials Analysis and Testing Center (Beijing, China).

2.3. Weight and Size Measurements

Twenty-five cherries of each GI sample were randomly chosen for each batch. Their weights were measured with the ME204/02 digital weight scale (METTLER TOLEDO, Shanghai, China). The width and length of fruits were determined using a digital vernier caliper (GELIXI, Hangzhou, China). The shape index was calculated as
shape index = length/width
The results were expressed as average values of 25 cherry fruits.

2.4. Juice Yield and Edible Rate Measurements

Fruit juice was obtained from 500 g of cherry flesh pulped with an electronic juicer. The juice sample was then centrifuged at 6149× g for 5 min using a high-speed centrifuge and the supernatant was collected and weighed [39]. The edible rate was calculated by randomly selecting 15 cherries, then weighing the whole fruit, stone, and stalk, respectively. These two parameters were measured in triplicate.
e d i b l e   r a t e = M ( w h o l e   f r u i t ) M s t o n e M ( s t a l k ) M ( w h o l e   f r u i t ) × 100 %

2.5. Soluble Solids Content, Titratable Acidity, Maturity Index, Sugar Composition, and Total Sugar

These parameters were detected with an independent homogenate (n = 2), extracted from 25 pitted cherries. Soluble solids content (SSC) was measured with a digital refractometer (MDS-R500, Shanghai, China) and the result was expressed as Brix°. Titratable acidity (TA) was determined with an FE28 pH meter (METTLER TOLEDO, Shanghai, China), titrating the sample with 0.1 M NaOH up to pH 8.2. The result was expressed as g malic acid 100 g−1 fresh weight (FW). The maturity index (MI) was the ratio of SSC and TA. Sugar composition was determined with a CM5400 HPLC system (HITACHI, Tokyo, Japan) equipped with a ZOBRAX NH2 column (4.6 mm × 250 mm × 5 μm) and Chromaster 5430 refractive index detector (HITACHI, Tokyo, Japan). Each sample was injected twice. Total sugar values were calculated with the sum of individual sugar contents [40].

2.6. Total Phenolics, Total Anthocyanins, Total Flavonoids, and Procyanidin

Total phenolic content (TPC) was assayed according to the Folin–Ciocalteu method [41] with a T6 UV spectrophotometer (PERSEE, Beijing, China). Gallic acid was used as a standard for quantification. The results were expressed as gallic acid mg 100 g−1 FW. Total anthocyanins content (TAC) was determined with an HPLC system equipped with a ZORBAX SB C18 column (4.6 mm × 250 mm × 5μm) and chromaster 5100 UV detector (HITACHI, Japan), measured at 530 nm. The column was eluted with the mobile phase (A: 1% formic acid solution; B: 1% formic-acid–acetonitrile solution). Anthocyanins were ultrasonically extracted from the cherry homogenate combined with the ethanol-water-HCl solution (v:v:v = 2:1:1) for 30 min, and then hydrolyzed with boiling water for 1 h [42]. Quantification was carried out by comparing the peak area of the sample solution with that of the mixed standard solution, which was dissolved with a HCl-methanol solution (v:v = 10:90). The anthocyanin content was the sum of six anthocyanins, and expressed as mg kg−1 FW. According to Marinella De Leo [1], total flavonoid content (TFC) was measured with the aluminum chloride colorimetric method. The solution mixture was measured with a T6 UV spectrophotometer (PERSEE, Beijing, China) at 510 nm. The results were expressed as quercetin (mg100 g−1 FW). Procyanidin content was determined using Monika with a few modifications [43]. A T6 UV spectrophotometer (PERSEE, Beijing, China) was applied to detect anthocyanidin ions generated by being treated with a 5% (v/v) HCl-n-butanol solution and a 2% (w/v) NH4Fe(SO4)2 solution (prepared with 2 M HCl) in boiling water for 40 min. The absorbance was measured at 546 nm. The results were expressed as mg 100 g−1 FW.

2.7. β-Carotene and Ascorbic Acid

The β-carotene content was measured with an a1260 HPLC system (Agilent, Santa Clara, CA, USA) equipped with an Ultimate XB-C18 column (4.6 mm × 250 mm × 5 μm) and G1315D VL DAD detector (Agilent, Santa Clara, CA, USA). Homogenized samples were saponified to release carotene into a free state, and dichloromethane was extracted with petroleum ether to constant volume, and then separated using reversed-phase chromatography with quantification using an external standard method. Mobile phase A and B were methanol–acetonitrile–water (v:v:v = 73.5:24.5:2) and methyl tert-butyl ether (MTBE), respectively. The results were expressed as ug100 g−1 FW [44]. The mixture of cherry flesh and metaphosphoric acid dissolution was homogenized as tested samples for measuring ascorbic acid [45], which was evaluated with a CM5110 HPLC system (HITACHI, Japan) equipped with an Ultimate XB-C18 column (4.6 mm × 250 mm × 5 μm) and G1315D VL DAD detector (Agilent, Santa Clara, CA, USA). The column was diluted with the mobile phase (A: KH₂PO₄-Cetyltrimethylammonium bromide water solution; B: 100% methanol). The results were reported as mg100 g−1 FW.

2.8. Mineral Content of Cherry Fruits

The mineral content was detected with an iCAP6300 inductively coupled plasma emission spectrometer (Thermo, MA, USA) with homogenized samples, prepared with the wet digestion method according to Matos-Reyes [46]. The sample was added with a 10 mL mixture solution of nitric acid and perchloric acid (v:v = 10:1). Then, the mixture was heated at a high temperature until white smoke appeared and the digestion solution was transparent and colorless. The solution was cooled down and water was added to 25 mL for measuring. The results were expressed as mg kg−1 FW.

2.9. Parameters of Planted Soil

All soil samples were dried and passed through a 2 mm sieve before measurements. Soil pH was measured with a PHS-3C pH meter (JINGHONG, Shanghai, China) with an electrode immersed in standard buffers of pH 4.01, pH 6.87, and pH 9.18 in turn for calibration. The soil–water suspension samples (w:v = 1:2.5) were prepared with water removing CO2. The electrode should be washed with clean water, and be absorbed using filter paper strips after each test [47]. Soil organic matter was evaluated with an excessive 0.4 M potassium-dichromate–sulfuric-acid solution to oxidize organic carbon in the air-dried soil sample, and the excess potassium dichromate was titrated with a ferrous sulfate standard solution. The amount of organic carbon was calculated according to the oxidation correction coefficient from the consumed amount of potassium dichromate and then multiplied by the constant of 1.724, which was the content of soil organic matter [47]. Available phosphorus was determined with a UV-1800 spectrophotometer (SHIMADZU, Kyoto, Japan) with the tested sample, prepared with a hydrochloric acid and sulfuric acid solution to dissolve and release iron phosphate and aluminum salt. The phosphorus standard series chromogenic solution was made with a 5.0 mL aluminum ladder anti-developer at 20 °C (30 min) and then measured at 700 nm [47]. Available potassium was detected with a 5800 ICP-OES inductively coupled plasma optical emission spectrometer (Agilent, Santa Clara, CA, USA) with 1 M acetic acid extraction [48]. Available calcium and available iron were measured with ammonium-hydrogen-carbonate–diethylene-triaminepentaacetic-acid (AB-DTPA) extraction and DTPA extraction, respectively. Then, the prepared samples were detected with a 5800 ICP-OES inductively coupled plasma optical emission spectrometer (Agilent, Santa Clara, CA, USA) [49].

2.10. Statistics Analysis

All experiment data were detected twice and expressed as the mean ± SD using Microsoft Excel 2019 (Microsoft, Redmond, WA, USA), except for fruit weight, length, width, and shape index, which were expressed as the mean ± SD of 25 determinations. An analysis of variance (ANOVA) was performed on all the physicochemical parameters. A significant difference analysis of all parameters between groups was performed with Duncan’s test and p < 0.05 was regarded as the significant level. A correlation analysis of physiochemical and soil parameters was determined with Pearson’s correlation coefficient at a significant level for p < 0.05, p < 0.01, and p < 0.001, respectively. The correlation analysis of physiochemical parameters was completed with the Omicshare online platform (https://www.omicshare.com/tools/Home/Task/taskdetail?tasknum=reporticawg5e8d0d, accessed on 10 August 2023). The univariate general linear model was applied to analyze the influencing factors of main quality traits. The relationship between quality and soil condition was established with the multiple linear regression model after a collinearity analysis. All these analysis methods were completed with SPSS Statistics V17.0 (IBM Inc., Chicago, IL, USA).

3. Results and Discussions

3.1. Variability in Physicochemical Properties of GI Cherries

The external properties of GI cherries are shown in Table 2. The size and weight of cherry fruits are important commercial attributes for market acceptance [3,50]. The width and length of cherry samples varied from 21.61 mm to 34.78 mm, and 20.33 mm to 31.15 mm, respectively. The fruit weight ranged from 5.00 g to 17.92 g. Both the size and weight of cherries exhibited significant differences (p < 0.05). Dalian showed significantly bigger size and weight than the others, while Tianbao was the smallest among all samples. The result of fruit weight exhibited as higher than that of Italian cherries (3.85~12.97 g) and Portuguese cherries (4.87~11.75 g) [7,51]. The shape index of GI cherries ranged from 0.79 to 0.99, and the average value was 0.89. Although Tongzhou had the same variety as Baqiao and Wenchuan, it had a distinct shape that set it apart from the others. Both juice yield and edible rate are important factors influencing the taste of commercial cherries. The edible rates of cherry samples ranged from 90.73 ± 0.15% to 96.23 ± 0.25% with a CV of 1.92%. However, the juice yield had a wider range, varying from 39.70 ± 0.61% to 71.10 ± 0.82% with a CV of 16.61%. This result is in accord with Jia et al. [39], as the juice yield is comprehensively affected by genotype, planting patterns, and maturity [52,53].
Soluble solids content (SSC) and titratable acidity (TA) represent the cherry composition of soluble content (vitamin, mineral, amino acids, sugar, etc.) and organic acids, respectively [54]. SSC and TA are also essential parameters reflecting cherry flavor with sweetness and sourness, and their levels gradually increase during the ripening process for cherries. Ultimately, MI as a maturity index is often analyzed to evaluate the optimum harvest date and to determine consumer preference [52,54,55]. From Table 3, the average SSC was 16.54 ± 3.15 Brix°, ranging from 12.64 ± 0.10 Brix° to 23.67 ± 1.00 Brix°. Significant differences among samples were exhibited in terms of TA, which varied widely from 0.33 ± 0.01% to 0.99 ± 0.01%. Both the ranges of SSC and TA were in general accordance with the worldwide level (SSC: 13.5 to 24.5 Brix°; TA: 0.5% to 1.3%) [54]. Previous studies reported that SSC values above 15~18 Brix° could be regarded as commercially ideal [56,57]. Tianbao (12.64 ± 0.10 Brix°) and Qinzhou (15.69 ± 0.06 Brix°) have lower soluble solid content compared to others. However, their MI values are significantly higher, with Tianbao at 38.56 ± 1.82 and Qinzhou at 35.22 ± 0.30, which can be attributed to their lower titratable acidity. A series of studies confirmed that the SSC and TA of cherries mainly depend on cultivars [58,59]. Therefore, it can be seen that taking SSC, TA, and MI into account is more comprehensive and reasonable than only detecting the SSC of cherries to measure the fruit’s degree of ripening. Compared to SSC, total sugar can be more exact to confirm the sugar content of fruits and to reflect the sweet flavor of cherries. Table 3 exhibits that the average total sugar was 13.81 ± 3.65 g/100 g, varying greatly from 9.09 ± 0.16 g/100 g (Baqiao) to 19.70 ± 0.22 g/100 g (Tongzhou). With regard to sugar composition, the results are similar to the previous report that glucose and fructose are the two main sugars found in GI cherries, and the glucose content is bigger than that of fructose [60,61]. For fructose, it ranged from 4.20 ± 0.01 g/100 g FW (Baqiao) to 6.37 ± 0.41 g/100 g FW (Wenchuan), in accordance with the sweet cherries grown in Canada and Italy (4.4 g/100 g FW to 6.7 g/100 g FW) [9,62]. Meanwhile, glucose of GI cherries owned a broader range (4.89 ± 0.09 g/100 g FW to 13.79 ± 0.50 g/100 g FW) than that of cherries in other countries (5.2 g/100 g FW to 10 g/100 g FW).
The nutritional properties of GI cherries showed a significant difference (p < 0.05) in this study (Table 4). Polyphenols including anthocyanins, flavonoids, and phenolic acids [54] are the dominant phytochemicals for sweet cherries with strong antioxidant activity in vitro and in vivo [63,64,65]. The formation and accumulation of total phenolic compounds are influenced by various factors, such as cultivars, agronomic conditions, maturity degree, and postharvest preservation [7,50,66]. Regarding TPC, the highest value was 197.72 ± 3.94 mg/100 g FW for Dalian, while the lowest value of 100.04 ± 3.88 mg/100 g FW was observed in Wenchuan. The TPC range of GI cherries in this study is higher than that of twenty-four sweet cherry cultivars planted in Italy and Turkey (84.96 ± 3.37 mg/100 g FW to 156 ± 1.30 mg/100 g FW; 58.31 ± 10.56 mg/100 g FW to 115.41 ± 7.98 mg/100 g FW) [60,67]. During the ripening stages of sweet cherries, phenolic compounds, particularly anthocyanins, play a significant role in producing the red color [2]. TPC and TAC of Dalian exhibited as significantly higher than others (197.72 ± 3.94 mg/100 g FW and 53.82 ± 2.31 mg/kg FW, respectively) as the Dalian cherry sample owned a dark red color mainly due to genotype and ripening stage [2]. Flavonoids also contribute to the biological activities of sweet cherries. TFC of GI cherries ranged from 7.86 ± 0.49 mg/100 g FW (Tianbao) to 35.64 ± 2.22 mg/100 g FW (Dalian), which generally represented the total flavonoids content of sweet cherries grown in China (7.79 ± 0.26 mg/100 g FW to 25.03 ± 0.26 mg/100 g FW) [68]. However, the result is lower than that of cherry fruits planted in Poland and Spain [64,65]. Procyanidin is a type of colorless chemical compound that is not present in all cherry cultivars [7]. However, most sour cherry cultivars contain high levels of procyanidin, which is known to have strong antioxidant properties and can effectively scavenge free radicals [69]. The content of procyanidin greatly varied from 2.98 ± 1.34 mg/100 g FW (Xiehu) to 61.77 ± 1.85 mg/100 g FW (Dalian). Carotenoids are a group of pigment compounds primarily composed of β-carotene. This yellow lipophilic pigment is responsible for converting into vitamin A in the human body [70]. Baqiao was significantly the highest (followed by Tianbao), while Jiangxian, Ledu, Qinzhou, and Wenchuan were under 50 μg/100 g. The β-carotene levels of Baqiao, Wenchuan, and Tongzhou, despite belonging to the same cultivar, displayed noteworthy differences (p < 0.05). This result could also be explained with their growing conditions [70,71]. Ascorbic acid is one of the metabolites with antioxidant activity, besides phenolic compounds and carotenoids [8]. Generally, the ascorbic acid of sweet cherries and sour cherries ranged from 6~10 mg/100 g FW and 5~22 mg/100 g FW, respectively [9,69]. The content of ascorbic acid in the samples varied, with Qinzhou showing the highest at 7.61 ± 0.42 mg/100 g FW and Dalian exhibiting the lowest at 3.69 ± 0.24 mg/100 g FW. The mean value was 6.09 ± 1.80 mg/100 g FW, which was higher than Van, Noir De Guben, and 0–900 Ziraat grown in Turkey [72]. The mineral properties of GI cherries varied significantly (p < 0.05). The mineral composition of cherries not only depends on fruit cultivars but also on soil conditions [69,73]. When it comes to potassium levels, Tongzhou (3090.44 ± 114.08 mg/kg FW) was significantly the highest while Baqiao (1840.91 ± 77.73 mg/kg FW) was the lowest. The mean value for all samples was 2268.84 ± 402.47 mg/kg FW. Cherries are considered to be a supplemental intake source of potassium [7,9]. The 100 g of GI cherries analyzed in this study could provide 9.20~15.45% for AI (2000 mg/d) of potassium. Compared to the abundant content of potassium, lower concentrations of magnesium (92.31 ± 0.85~184.10 ± 2.91 mg/kg FW), calcium (70.13 ± 4.89~155.01 ± 5.40 mg/kg FW), and iron (3.01 ± 0.14~9.14 ± 0.38 mg/kg FW) were also found [9].
A variance analysis of physiochemical parameters in Table 2, Table 3 and Table 4 suggests that high variability existed for most of the characteristics in cherry fruits due to various influencing factors. Dalian is characterized as a big size with high fruit weight, and phenolics enrichment. Wenchuan is outstanding for its high values of soluble solids content, while presenting a low value of total phenolic compounds. Qinzhou owned high values of juice yield and maturity index. Tongzhou is notable for mineral enrichment (K, Mg, and Ca) with a high content of titratable acidity, total sugar, and glucose. Baqiao was enriched in β-carotene with a low value regarding soluble solids content. Though Baqiao, Wenchuan, and Tongzhou belonged to the same cultivar (Hongdeng), these samples exhibited different quality characterizations, which maybe contributed to planting environment conditions. Moreover, 8 out of 22 parameters showed smaller CVs than 20% [74,75], which indicated low variability among GI cherries for width, length, shape index, juice yield, edible rate, fructose, and potassium. Breeding programs focus on several important characteristics that are desirable to consumers, including fruit size, juice yield, edible rate, and soluble solids content. These traits can be easily noticed and appreciated by consumers [50,76,77]. All nutritional trait parameters had a coefficient of variation (CV) greater than 20% (except for K) with values ranging from 21.16% for TPC to 113.46% for β-carotene. In recent times, consumers have come to recognize the importance of the health benefits associated with the nutrient-rich properties of cherries, in addition to their appearance and taste. As a result, breeding efforts should also aim to improve nutritional parameters alongside size and taste.

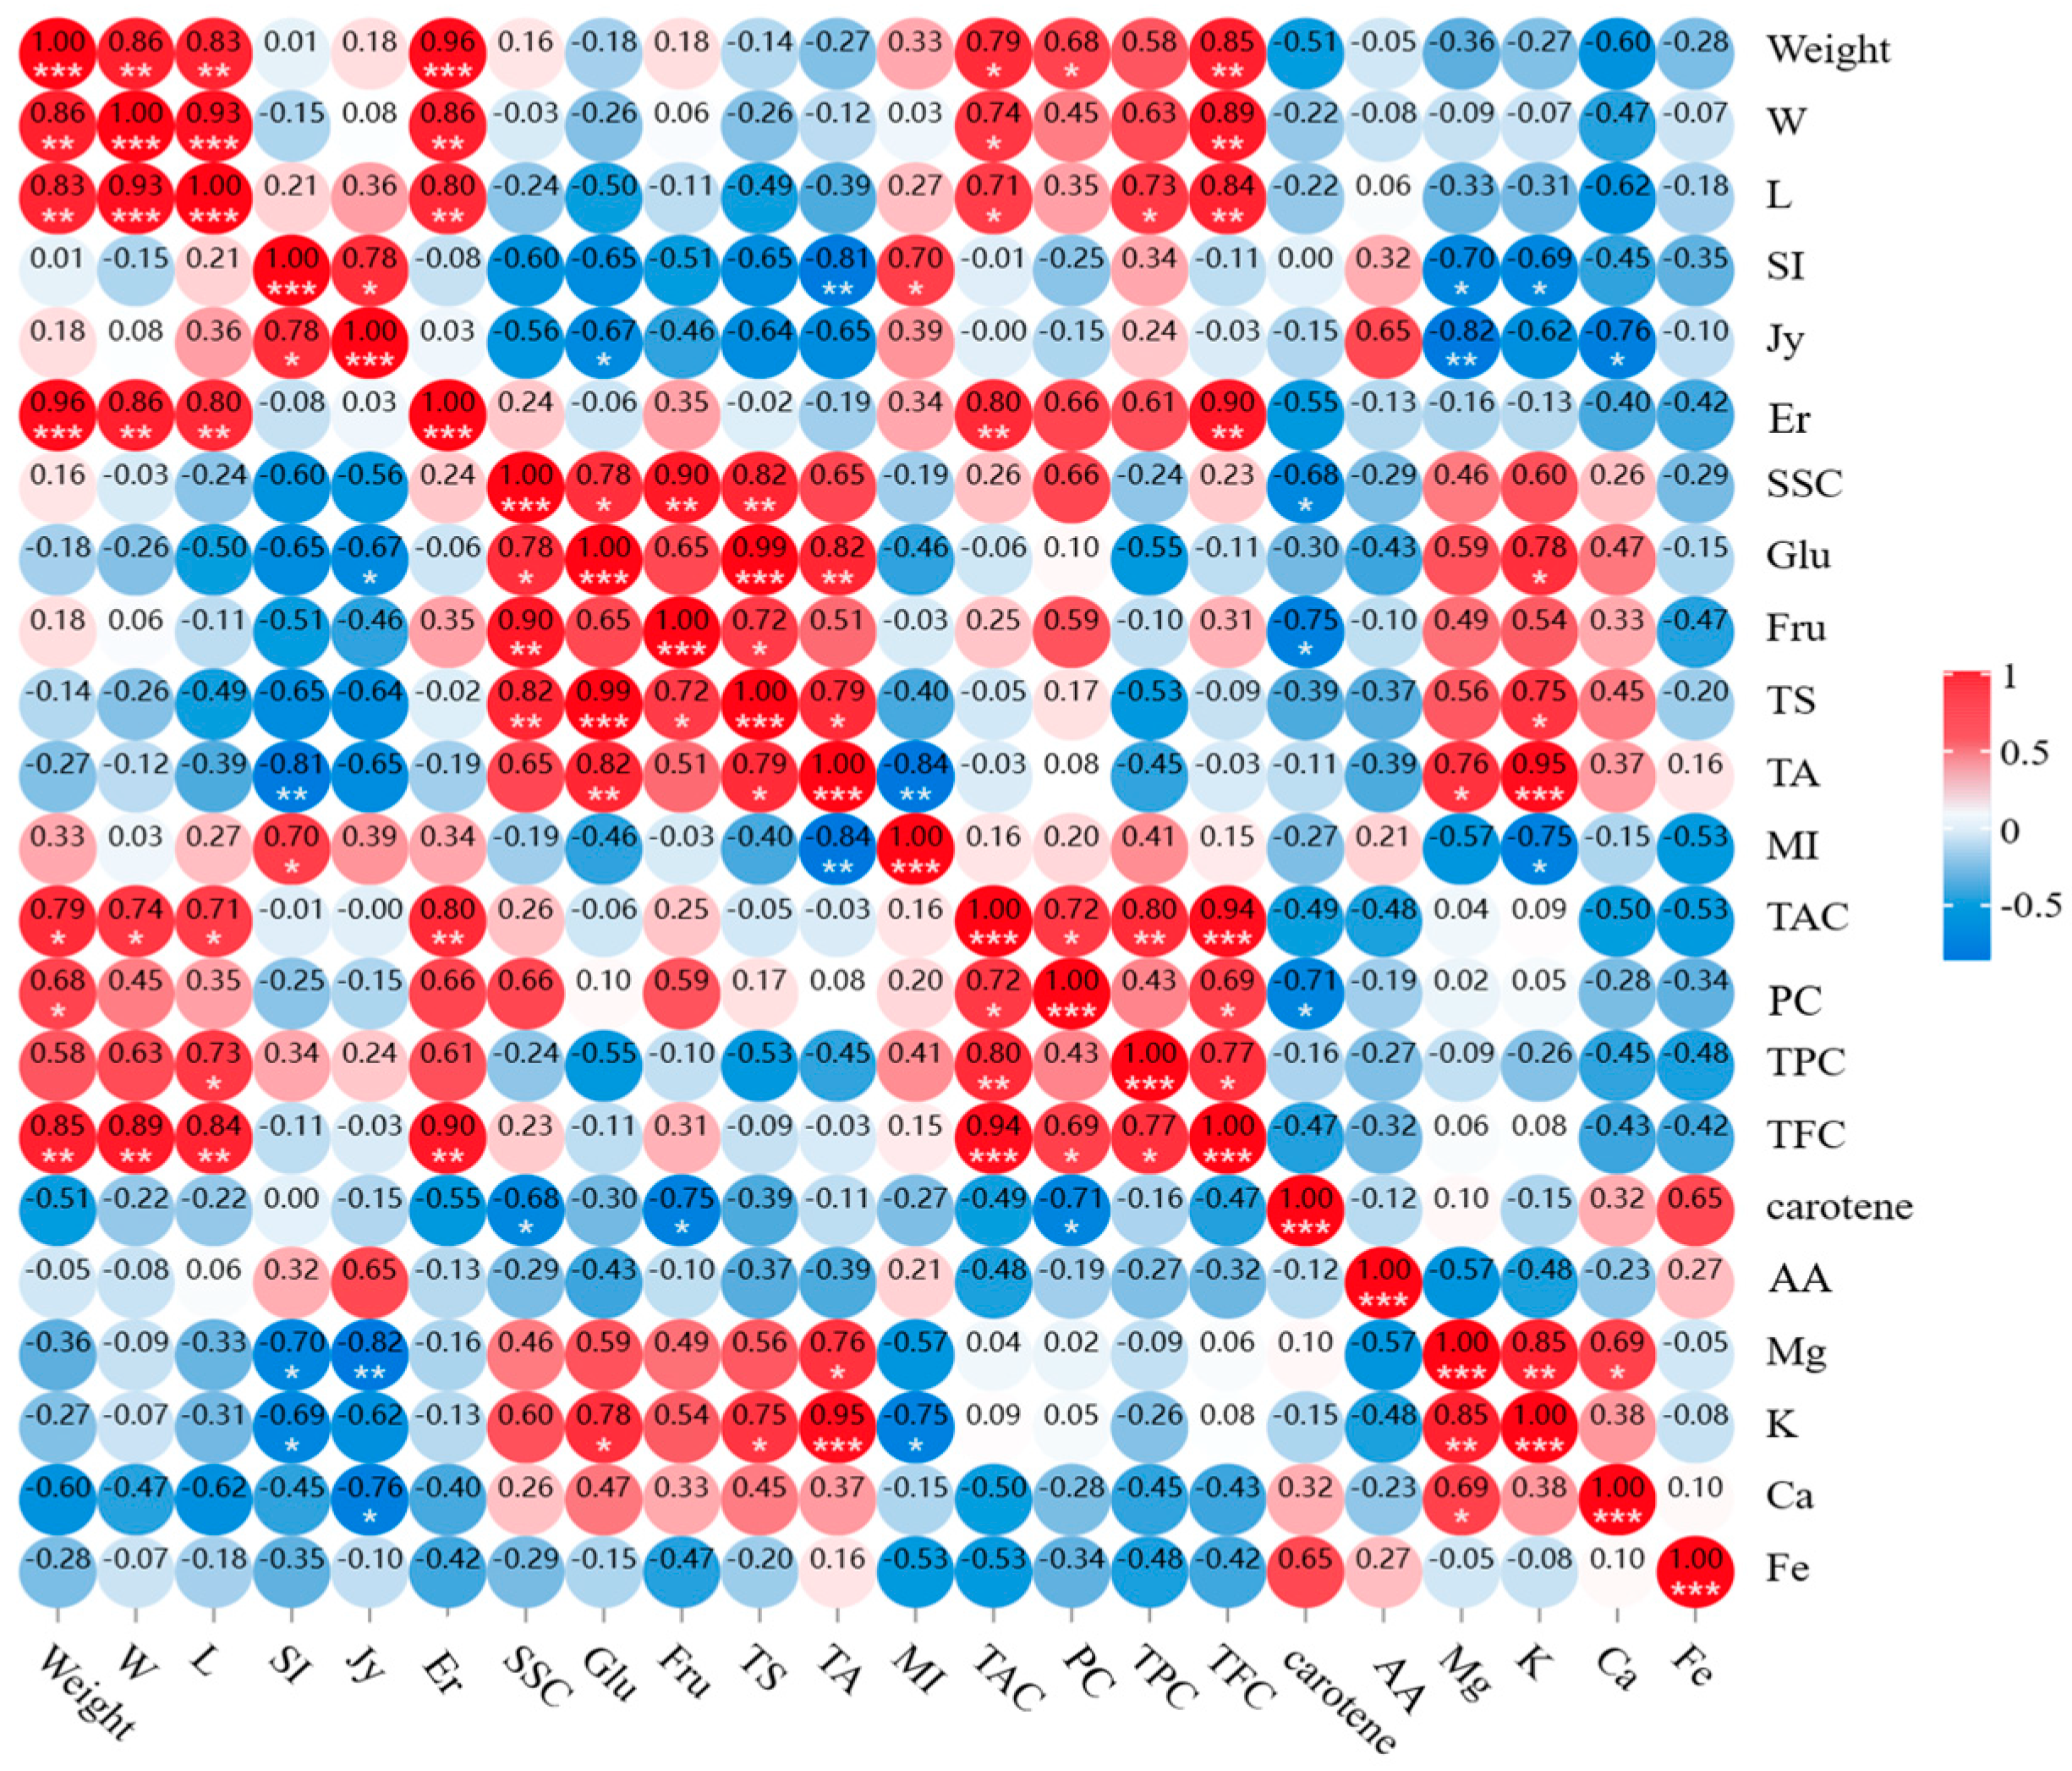
3.2. Correlation Analysis of Quality Parameters for GI Cherries

Correlations of physicochemical properties exhibited at significant levels (Figure 1). Cherry fruit weight showed remarkably positive correlations with width (r = 0.856 **), length (r = 0.834 **), and edible rate (r = 0.956 **), which were supported with the previous literature studying sweet cherries [55,59,74]. Additionally, fruit weight showed noticeably high correlation with total flavonoids content (r = 0.855 **). Edible rate showed a positive correlation with flavonoids (r = 0.897 **) and anthocyanin (r = 0.805 **). It can be explained that the weight of the fruit increases as phenolic compounds accumulate during the maturation of sweet cherries [78,79,80]. The content of soluble solids in fruits is closely linked to both total sugar and fructose content, with strong positive correlations (r = 0.824 ** and r = 0.896 **, respectively). Soluble solids content is a key indicator of fruit maturity and sweetness, making them important parameters to consider [79,80]. The amount of sugar in the sweet cherries was mostly made up of total sugar and had a strong correlation with glucose (r = 0.993 **). According to Figure 1, there was a strong positive correlation (r = 0.945 **) between anthocyanin and total flavonoid content. It has been reported that pre-synthesis genes of anthocyanin play a dominant role in the biosynthesis of flavonoids during sweet cherries’ development [79]. Titratable acidity showed positive correlations with glucose (r = 0.821 **) and potassium (r = 0.949 **). Accumulation of organic acids happened in the same ripening stage as the synthesis of sugar. Both the content of organic acids and sugar increased to a summit point at harvest time for sweet cherries [81,82]. Previous literature found that the titratable acidity of sweet cherries enhanced with increasing doses of potassium fertilization [38,83], simultaneously exerting positive effects on the content of potassium in cherry fruits [8]. A significantly positive correlation between potassium and magnesium (r = 0.851 **) was also detected in this study. Currently, there is insufficient data on the correlation between mineral composition in cherries. Only a few researchers have found that applying potassium fertilization led to a decrease in magnesium levels in sweet cherry fruits and leaves [84,85]. The result from Figure 1 shows the negative correlation between Ca and juice yield (r = −0.765 *); however, no current literature reported a direct relationship between them. It is possible to explain that Ca in fruit determines the functionality of sweet cherry xylem development. This contributes to increasing fruit firmness, reducing fruit water absorption, and avoiding cracking [35,86,87].
The cherry properties can be described with external parameters (width, length, shape index, fruit weight, juice yield, and edible rate), taste parameters (soluble solids content, titratable acidity, maturity index, total sugar, glucose, and fructose), and nutrition parameters (total phenolics, total flavonoids, total anthocyanins, procyanidin, β-carotene, ascorbic acid, potassium, magnesium, calcium, and iron). After taking into account the connections between various external factors and ease of detection, the fruit weight was selected as a representation of the exterior qualities of cherries [3,5,74]. When evaluating the taste of cherries, the balance of sweet and sour flavors is considered the most important factor. The flavor is influenced by factors such as the soluble solids content, titratable acidity, and maturity index, which are also helpful for measuring the maturity of the fruit. Polyphenol compounds are the dominant bioactive constituents. Both anthocyanins and flavonoids belong to phenolic compound groups. Total phenols, anthocyanins, and flavonoids show significant positive correlations, as seen in Figure 1. Therefore, fruit weight, soluble solids content, titratable acidity, maturity index, and total phenols are regarded as typical quality parameters of GI cherries to study their influencing factors.

3.3. Effect of Cultivar and Climate Type on the Properties of GI Cherries

The Univariate-General Line Model presents the average values of quality parameters and the effects of variety and climate types in Table 5. Significant effects of variety and climate on fruit weight, acidity, and phenols exist (p < 0.01). Russia NO.8 had significantly higher fruit weight than other cultivars. Cherries grown in temperate monsoon climates were also heavier than those in subtropical monsoon and plateau mountain climates. Different cultivars exhibit a range of fruit weights due to the correlation between fruit weight and cell numbers as determined with the quantitative trait locus (QTL) [3,88]. Also, cherry fruit weight was significantly influenced by precipitation, evapotranspiration, and insolation [89]. The difference in soluble solids content between cultivars was significant (p < 0.05), but it was more sensitive to climate types (p < 0.01). Researchers have confirmed that the same cherry fruit cultivars exhibit diverse ranges of soluble solids content depending on weather parameters in different planting sites [90,91,92]. The soluble solids content of cherries was dominantly influenced by weather conditions, compared with the cultivar factor. Iryna et al. [93] already mathematically substantiated that weather condition parameters (especially the humidity and temperature) greatly affect the accumulation of SSC for cherry fruits. Titratable acidity was determined with the cultivar and climate type, as supported with previous studies [89,94]. Table 5 shows significant differences in titratable acidity among the three climate types, which can be attributed to the dilution effect of precipitation conditions. The maturity index of Russia NO.8 was significantly higher (35.64 ± 2.33) than that of other cultivars. The maturity index was highly related to soluble solids content and titratable acidity, which was influenced by both factors of genotype and ripening stage [81] to present various sensory characteristics. However, there was no significant effect of climate type on the maturity index (calculated from SSC and TA) (p > 0.05). Previous studies have shown that different cherry cultivars have varying levels of total phenol content. Russia NO.8 had the highest, while Tieton had the lowest. The total phenol content of GI cherries grown in different climate types was also significantly different from each other (p < 0.01). Table 2, Table 3 and Table 4 shows no significant difference in TPC between Jiangxian and Qinzhou, both grown in temperate monsoon climates with the same cultivar (Tieton) (p > 0.05). However, their TPC levels were noticeably lower than that of Ledu (Tieton) planted in the climate of a plateau mountain (p < 0.05).

3.4. The Relationship between Soil Conditions and Properties of GI Cherries

The results of soil conditions for GI cherries are presented in Table 6. Besides the factors of cultivar and climate type, pollination success, reproductive maximization, and high-quality cherry fruits are related to proper soil conditions [95,96]. The average pH value of the soil was 7.53 ± 0.59 (pH 6.0~7.0 was recommended), ranging from 6.61 ± 0.01 (Xiehu) to 8.26 ± 0.01 (Ledu) [97]. According to Cristóbal and Melakeberhan, improper pH would lead to inhibiting plant growth by disturbing mineral absorption [97,98]. Soil organic matter is comprised of multiple fractions from well-decomposed living organisms that can provide nutrients for plant growth. It is often used to assess soil quality measurements [99]. The mean organic matter value was 24.14 ± 12.84 g/kg, shown in Table 6. The levels of soil organic matter from Tongzhou (35.60 ± 0.21 g/kg), Dalian (42.00 ± 0.35 g/kg), and Wenchuan (44.10 ± 0.49 g/kg) are similar to Watsona’s report; however, the others are significantly lower than previous studies [20,100]. Both P and K of soil samples varied significantly (p < 0.05), and the coefficients of variation were 120.62% and 97.07%, respectively. The SSC level of Wenchuan was the highest, which may be explained with that P supply is a crucial factor that affects SSC modulation for cherries during the preharvest time, and biosynthesis of sugar is negatively influenced by P deficiency [97,101]. Soil K of samples ranged from 128.00 ± 0.71 mg/kg (Tianbao) to 1760.00 ± 3.54 (Dalian). According to AĞLAR and Bustamante, higher values of fruit weight and size were obtained with potassium fertilization treatment [83,102], which can illustrate the phenomenon of Dalian cherry fruit with the biggest weight and size, while Tianbao is with the smallest among all samples. Though soil K of Dalian was the highest, the lowest content of Ca was found in the fruit sample (70.13 ± 4.89 mg/kg) from Table 2, Table 3 and Table 4. It was supported with a previous report that high-dose K application promotes the decrease in the fruit Ca level [84]. Soil Fe and soil Ca are also necessary for sweet cherry growth and fruit quality promotion [103,104]. Previous researchers discovered that soil pH determined both the levels of Fe and Ca in planted soil. Soil Ca enrichment and soil Fe reduction are related to elevated soil pH [105], which are in accordance with the results in this study (Table 6). However, the adverse result was also found that enrichment for soil Fe was stimulated with higher soil pH [106]. That may be attributed to different cultivars of fruits [95,106].
The correlation analysis of soil condition parameters was performed before the establishment of multiple linear regression models (Table 7). Organic matter exhibited significantly positive correlations with available P (r = 0.939) and available K (r = 0.849), respectively (not shown). A collinearity diagnosis was carried out based on the correlation result. Regression models characterizing the dependence of cherry quality traits on soil condition factors are exhibited in Table 7. SSC was only significantly impacted by soil P (R2 = 0.648, p < 0.05), and the regression equation was YSSC = 0.016X1 + 14.488. The equation between SSC and soil available P substantiated that phosphorus played an important role in accumulating the sugar of cherry fruits [68,98]. The highest SSC value of Wenchuan was related to its high level of soil P (Table 6). Researchers have also found that phosphorus fertilization could improve SSC levels in the Rosaceae family [107,108]. The phenomenon may be caused by two reasons: (1) higher P content caused in leaf tissue by phosphorus fertilization helps to enhance the photosynthetic rate [109], and then to improve the accumulation of carbohydrates, and (2) sugar transportation and allocation from roots and shoots are affected by P content in the plant [99,110]. High P content in cherries is obtained by improving sugar transportation from leaf to fruit [111]. The regression equation for TA with soil parameters was YTA = 0.008X1 − 0.008X2 + 0.455X3 + 0.081X4 + 5.709X5 − 76.980 (R2 = 0.861). From Table 7, TA was positively influenced by soil P, Fe, Ca, and pH; however, a significantly negative influence was exerted with soil K (p < 0.05). Researchers also found that TA change was caused by phosphorus and potassium fertilization, while little literature discovered the effects of soil Fe and Ca on TA [112,113]. Phosphorus serves as a vital constituent of nucleic acid, adenosine triphosphate, and cell membrane structures [114]. High P content in the fruit increased with P fertilization enhances the requirement of carbohydrates (like TA) for modulating important processes related to energy transfer and membrane synthesis [115]. Previous literature reported that potassium supply to fruits has a positive impact on their TA levels [115,116], but negative effects [38,117] or non-significant effects on TA and organic acids were also found [118,119]. There are two explanations for the relationship between potassium and TA change. (1) In most cases, additional potassium takes part in the upregulation of the tricarboxylic acid pathway to promote the synthesis of organic acids. (2) Potassium also affects tonoplastic transport regulation, and is essential for organic acids to vacuole storage or release by modulating cell membrane permeability [22,120]. This process cannot have an effect on the TA level, as no protons are formed to affect it. However, a definite illustration of the negative effect of potassium on TA has not been studied at present. The role of potassium in TA change depends on the kinds of fruit, fertilization dose, and physiological status of fruits [22,116,119]. A specific relationship between TPC and soil factors was also obtained in this study. The regression model was YTPC = −0.009X3 − 0.002X1 + 0.001X2 + 1.409 (R2 = 0.917). A significantly positive impact on TPC was shown with soil Fe and K, while it was significantly negatively influenced by soil P (p < 0.05). The TPC positively affected by soil K may contribute to the enhancement of the carbohydrates. Potassium plays a vital role in promoting photosynthesis activity and stimulating carbohydrate translocation [118], which indirectly increases the TPC content in the plant with potassium fertilization [121]. The result of positive correlations between the carbohydrates and total phenolics under high K application has already been studied in previous research [121,122]. It is noteworthy that though P supply is a critical factor in improving cherry quality during preharvest periods, P deficiency promotes total phenol compound accumulation and flesh-browning inhibition in fruit cells [97,113].

4. Conclusions

The present work studied the physicochemical properties of GI cherries grown in China and investigated the factors affecting fruit quality. Peculiar quality traits of cherry samples exhibited significant differences in each physicochemical parameter, attributed to their cultivars and specific environmental conditions. Dalian presented the largest size and weight with the highest content of bioactive compounds. The highest SSC was found in Wenchuan, and Baqiao presented the highest content of β-carotene. Tongzhou was rich in minerals (K, Mg, and Ca). Moreover, the influencing factors of both cultivars and climate types presented the main effects on weight, SSC, TA, and TPC (p < 0.05 and p < 0.01). However, MI was only influenced by cultivars. Significant differences in soil conditions for GI cherries were achieved. This would help make suggestions for growers and breeding scientists to select cultivars planted in places with appropriate climate types. The multiple linear regressions showed that soil P positively affected SSC and TA, while exerting a negative influence on TPC. The soil K showed a negative effect on TA, with a positive effect on TPC. This would help orchard operators improve cherry fruit quality by modulating fertilization plans. Even so, further research should be carried out by investigating the influence mechanisms of the specific climatical parameters (like humidity and precipitation) or the combined soil nutrients on fruit quality traits, in order to help growers specifically determine suitable growing environments for different cultivars, and to obtain optimum fertilization formulas.

Author Contributions

Conceptualization and writing—original draft, Y.N.; methodology, Y.N. and J.H.; project administration and supervision, J.H. and J.S.; software, R.L. and P.W.; validation, J.H., R.L. and P.L.; data curation and formal analysis, P.W. and M.L. All authors have read and agreed to the published version of the manuscript.

Funding

This research was funded by the Government Procurement Service Program of the Department of Agricultural Products Quality and Safety Supervision, Ministry of Agriculture and Rural Affairs in China (Grant Number: 14225045).

Data Availability Statement

The data of this article can be available from the corresponding author.

Acknowledgments

Thanks to nine cherry geographical indication product management departments for providing samples and sample information in time. Thanks to the Geographical Indications Management Office of China Green Food Development Center for the support of sampling coordination.

Conflicts of Interest

The authors declare no conflict of interest.

References

  1. Marinella, D.L.; Anna, M.I.; Maria, P.G.; Valeria, D.; Fabiano, C.; Filippo, S.; Gianfranco, D.; Nunziatina, D.T.; Alessandra, B. Comparative chemical analysis of six ancient Italian sweet cherry (Prunus avium L.) varieties showing antiangiogenic activity. Food Chem. 2021, 360, 129999. [Google Scholar]
  2. Manuel, J.S.; Alberto, M.; Santiago, R.M.; Alejandro, H.; Margarita, L.C.; María, G.C. Physicochemical and sensorial characterisation of four sweet cherry cultivars grown in Jerte Valley (Spain). Food Chem. 2012, 133, 1551–1559. [Google Scholar]
  3. Szilágyi, S.; Horváth-Kupi, T.; Desiderio, F.; Bekefi, Z. Evaluation of sweet cherry (Prunus avium L.) cultivars for fruit size by FW_G2a QTL analysis and phenotypic characterization. Sci. Hortic. 2022, 292, 110656. [Google Scholar] [CrossRef]
  4. 07-1537; United States Standards for Grades of Sweet Cherries. Agricultural Marketing Service. United States Department of Agriculture: Washington, DC, USA, 2007.
  5. GB/T 26901-2011; Grades of Cherries. State Administration for Market Regulation. Standardization Administration: Beijing, China, 2011.
  6. Recommended Quality Guide for Export Cherries. Chilean Cherry Committee: Chile, 2021. Available online: https://fructidor.com/newsdetail.aspx?idn=58303 (accessed on 23 August 2023).
  7. Ana, C.G.; Gonçalo, C.; Gilberto, A.; Cristina, G.V.; Diego, A.M.; Luís, R.S. Physical and phytochemical composition of 23 Portuguese sweet cherries as conditioned by variety (or genotype). Food Chem. 2021, 335, 127637. [Google Scholar]
  8. Kubilay, V.; Hasim, K.; Serkan, S. A study on some chemical and physico-mechanic properties of three sweet cherry varieties (Prunus avium L.) in Turkey. J. Food. Eng. 2006, 74, 568–575. [Google Scholar]
  9. Federica, B.; Oomah, B.D. Sweet and sour cherries: Origin, distribution, nutritional composition and health benefits. Trends Food Sci. Technol. 2019, 86, 517–529. [Google Scholar]
  10. Kim, D.O.; Heo, H.J.; Kim, Y.J.; Hyun, S.Y.; Chang, Y.L. Sweet and Sour Cherry Phenolics and Their Protective Effects on Neuronal Cells. J. Agric. Food Chem. 2005, 53, 9921–9927. [Google Scholar] [CrossRef]
  11. Guillermo, C.; Francisco, L.; Maria, P.G.; Carine, S.; Víctor, L. Bioactive and functional properties of sour cherry juice (Prunus cerasus). Food Funct. 2016, 7, 4675–4682. [Google Scholar]
  12. Fatih, M.Y. Sour Cherry By-products: Compositions, Functional Properties and Recovery Potentials. Crit. Rev. Food Sci. Nutr. 2019, 59, 3549–3563. [Google Scholar]
  13. Pissard, A.; Lateur, M.; Baeten, V.; Magein, H.; Dupont, P.; Tabart, J.; Pincemail, J.; Kevers, C. Determination of total phenolic compound content and antioxidant activity in cherry species and cultivars. J. Berry Res. 2016, 6, 81–91. [Google Scholar] [CrossRef]
  14. Ewa, S.; Tomasz, K.; Karolina, M.K.; Sebastian, P. Fruit quality and contents of some bioactive compounds in selected Czech sweet cherry (Prunus avium L.) cultivars under conditions of Central Poland. Agriculture 2022, 12, 1859. [Google Scholar]
  15. Sofia, C.; Filipa, Q.; Carlos, R.; Alice, V.; Alfredo, A.; Ana, I.B.; Rob, S.; Ana, P.S.; Berta, G. Effects of calcium and growth regulators on sweet cherry (Prunus avium L.) quality and sensory attributes at harvest. Sci. Hortic. 2019, 248, 231–240. [Google Scholar]
  16. Giménez, M.J.; María, S.; Juan, M.V.; Domingo, M.R.; Salvador, C.; Daniel, V.; Fabián, G. Preharvest salicylic acid and acetylsalicylic acid treatments preserve quality and enhance antioxidant systems during postharvest storage of sweet cherry cultivars. J. Sci. Food Agric. 2017, 97, 1220–1228. [Google Scholar] [CrossRef] [PubMed]
  17. Mehmet, A.O.; Yusuf, C.G.; Husnu, D.; Leyla, D.; Idris, M.; Gul, C.O. Comparative evaluation of phenolic profile and antioxidant activity of new sweet cherry (Prunus avium L.) genotypes in Turkey. Phytochem. Anal. 2022, 33, 564–576. [Google Scholar]
  18. Thouraya, A.G.; Tahar, S.; Youssef, A. Behavior and morphometric characterization of local and introduced cultivars of sweet cherries (Prunus avium), tested in a multi-site trial in Tunisia. Sci. Hortic. 2020, 270, 109455. [Google Scholar]
  19. Li, B.; Xie, Z.; Zhang, A.; Xu, W.; Zhang, C.; Liu, Q.; Liu, C.; Wang, S. Tree growth characteristics and flower bud differentiation of sweet cherry (Prunus avium L.) under different climate conditions in China. Hortic. Sci. 2010, 37, 6–13. [Google Scholar] [CrossRef]
  20. Tristan, T.W.; Louise, M.N.; Denise, N.; Gerry, H.N.; Tom, A.F. Soil amendments influence Pratylenchus penetrans populations, beneficial rhizosphere microorganisms, and growth of newly planted sweet cherry. Appl. Soil Ecol. 2017, 117, 212–220. [Google Scholar]
  21. Anna, B.; Zdzisław, K.; Jan, K.; Jerzy, Z. Yielding and fruit quality of Lithuanian sweet cherry cultivars grown under the climatic and soil conditions of Warmia. Folia Hortic. 2011, 23, 101–106. [Google Scholar]
  22. Mohd, H.I.; Hawa, Z.E.J.; Ehsan, K.; Ali, G. Primary, secondary metabolites, photosynthetic capacity and antioxidant activity of the malaysian herb kacip fatimah (Labisia Pumila Benth) exposed to potassium fertilization under greenhouse conditions. Int. J. Mol. Sci. 2012, 13, 15321–15342. [Google Scholar]
  23. McGuire, R.G. Reporting of objective color measurements. HortScience 1992, 27, 1254–1255. [Google Scholar] [CrossRef]
  24. Christian, Z.; Mehmet, S.; Edgar, P. Potassium in agriculture—Status and perspectives. J. Plant Physiol. 2014, 171, 656–669. [Google Scholar]
  25. Bai, Q.; Shen, Y.; Huang, Y. Advances in mineral nutrition transport and signal transduction in Rosaceae fruit quality and postharvest storage. Front. Plant Sci. 2021, 12, 620018. [Google Scholar] [CrossRef] [PubMed]
  26. Zhang, K.; Yan, G.; Zhang, X.; Wang, J.; Duan, X. Sweet cherry growing in China. Acta Hortic. 2019, 1235, 133–140. [Google Scholar] [CrossRef]
  27. FAS Beijing. Stone Fruit Annual (Report No. CH2022-0078). USDA Foreign Agriculture Service. 2022. Available online: https://www.fas.usda.gov/data/china-stone-fruit-annual-6 (accessed on 23 August 2023).
  28. World Trade Organization. Uruguay Round Agreement: Trips. 2016. Available online: https://www.wto.org/english/docs_e/legal_e/27-trips_04b_e.htm#3 (accessed on 23 August 2023).
  29. Angela, G.P.; Antonio, F.M.; Maria, R.F.; Giuseppe, S.; Giacomo, D.; Vincenzo, L.T.; Rosaria, C.F.C.; Marcella, D.B.; Giuseppa, D.B. Multielement and chemometric analysis for the traceability of the Pachino Protected Geographical Indication (PGI) cherry tomatoes. Food Chem. 2022, 386, 132746. [Google Scholar]
  30. Longobardi, F.; Ventrella, A.; Bianco, A.; Catucci, L.; Cafagna, I.; Gallo, V.; Mastrorilli, P.; Agostiano, A. Non-targeted 1H NMR fingerprinting and multivariate statistical analyses for the characterization of the geographical origin of Italian sweet cherries. Food Chem. 2013, 141, 3028–3033. [Google Scholar] [CrossRef] [PubMed]
  31. Fu, J.; Liu, R.R.; Chen, Y.F.; Xing, J.G. Discrimination of geographical indication of Chinese green teas using an electronic nose combined with quantum neural networks: A portable strategy. Sens. Actuators B-Chem. 2023, 375, 132946. [Google Scholar] [CrossRef]
  32. Shi, Q.Q.; Han, G.; Liu, Y.; Jiang, J.J.; Jia, Y.Y.; Li, X.G. Nutrient composition and quality traits of dried jujube fruits in seven producing areas based on metabolomics analysis. Food Chem. 2022, 385, 132627. [Google Scholar] [CrossRef]
  33. Su, S.; Wu, J.; Peng, X.Y.; Li, B.; Li, Z.J.; Wang, W.; Ni, J.W.; Xu, X.Q. Genetic and agro-climatic variability in seed fatty acid profiles of Akebia trifoliata (Lardizabalaceae) in China. J. Food Compos. Anal. 2021, 102, 104064. [Google Scholar] [CrossRef]
  34. Palma, M.; Sepúlveda, Á.; Yuri, J.A. Effect of plastic roof and high tunnel on microclimate, physiology, vegetative growth and fruit characteristics of ’Santina’ sweet cherry. Sci. Hortic. 2023, 317, 112037. [Google Scholar] [CrossRef]
  35. Rutkowski, K.; Łysiak, G.P. Weather conditions, orchard age and nitrogen fertilization influences yield and quality of ‘Łutówka’ sour cherry fruit. Agriculture 2022, 12, 2008. [Google Scholar] [CrossRef]
  36. Victor, B.; Pedro, J.B.R.; Roque, T.S.; Rafael, D. Influence of regulated deficit irrigation and environmental conditions on reproductive response of sweet cherry trees. Plants 2020, 9, 94. [Google Scholar]
  37. Uçgun, K. Effects of nitrogen and potassium fertilization on nutrient content and quality attributes of sweet cherry fruits. Not. Bot. Horti Agrobot. 2019, 47, 114–118. [Google Scholar] [CrossRef]
  38. Hüseyin, Y.; Ömer, A. Effects of potassium fertilization on leaf nutrient content and quality attributes of sweet cherry fruits (Prunus avium L.). J. Plant Nutr. 2020, 44, 946–957. [Google Scholar]
  39. Jia, C.S.; Geoffrey, I.N.; Sun, D.X.; Sun, Y.G.; Wu, P. Variety compound quality relationship of 12 sweet cherry varieties by HPLC-chemometric analysis. Int. J. Food Sci. Technol. 2019, 54, 2897–2914. [Google Scholar] [CrossRef]
  40. Elena, C.C.; Mireia, C.; Alfonso, M.; Dolores, H.; Carla, M.S.; Paula, M.B.; Antonio, J.M.M. Effect of regulated deficit irrigation on commercial quality parameters, carotenoids, phenolics and sugars of the black cherry tomato (Solanum lycopersicum L.) ‘Sunchocola’. J. Food Compos. Anal. 2022, 105, 104220. [Google Scholar]
  41. Singleton, V.L.; Orthofer, R.; Lamuela–Raventos, R.M. Analysis of total phenols and other oxidation substrates and antioxidants by means of Folin–Ciocalteau reagent. Methods Enzymol. 1999, 299, 152–178. [Google Scholar]
  42. Kim, M.K.; Kim, H.; Kim, H.S.; Youngsang, L.; Yongho, K. Identification and quantification of anthocyanin pigments in colored rice. Nutr. Res. Pract. 2008, 2, 46–49. [Google Scholar] [CrossRef]
  43. Olszewska, M.A. Variation in the phenolic content and in vitro antioxidant activity of Sorbus aucuparia leaf extracts during vegetation. Acta Pol. Pharm. 2011, 68, 937–944. [Google Scholar]
  44. GB 5099.83-2016; National Food Safety Standards, Determination of Carotene in Food China. Food and Drug Administration, National Health and Family Planning Commission of the PRC: Beijing, China, 2017.
  45. GB 5099.86-2016; National Food Safety Standards, Determination of Ascorbic Acid in Food. China Food and Drug Administration, National Health and Family Planning Commission of the PRC: Beijing, China, 2017.
  46. Matos-Reyes, M.N.; Simonot, J.; Lopez-Salazar, O.; Cervera, M.L.; Guardia, M. Authentication of Alicante’s mountain cherries protected designation of origin by their mineral profile. Food Chem. 2013, 141, 2191–2197. [Google Scholar] [CrossRef]
  47. Yu, Y.; Yang, J.; Zeng, S.; Wu, D.; Jacobs, D.F.; Sloan, J.L. Soil pH, organic matter, and nutrient content change with the continuous cropping of Cunninghamia lanceolata plantations in South China. J. Soils Sediments 2017, 17, 2230–2238. [Google Scholar] [CrossRef]
  48. Skjemstad, J.O.; Krull, E.S.; Swift, R.S.; Szarvas, S. Mechanisms of protection of soil organic matter under pasture following clearing of rainforest on an Oxisol. Geoderma 2008, 143, 231–242. [Google Scholar] [CrossRef]
  49. Tekalign, M.; Ritcher, C.; Heiligtag, B. Comparison of extractants for the determination of available phosphorus, potassium, calcium, magnesium and sodium in some Ethiopian and German soils. Commun. Soil Sci. Plant Anal. 1996, 27, 2197–2212. [Google Scholar]
  50. Ballistreri, G.; Continella, A.; Gentile, A.; Amenta, M.; Fabroni, S.; Rapisarda, P. Fruit quality and bioactive compounds relevant to human health of sweet cherry (Prunus avium L.) cultivars grown in Italy. Food Chem. 2013, 140, 630–638. [Google Scholar] [CrossRef] [PubMed]
  51. Kalyoncu, I.H.; Ersoy, N.; Yilmaz, M. Contents of sweet cherry (Prunus avium L.) type grown in Konya. Afr. J. Biotechnol. 2009, 8, 2744–2749. [Google Scholar]
  52. Marlon, J.R.S.; Ana, P.M.P.; Adilson, P.J.; Camilo, A.P.C.; Daniel, C.; Mara, F.M.; Sarita, L.; Marco, A.T. Yield performance of new juice grape varieties grafted onto different rootstocks under tropical conditions. Sci. Hortic. 2018, 241, 194–200. [Google Scholar]
  53. Suwimol, C.; John, B.G.; Quan, V.V.; Konstantinos, P.; Costas, E.S. Sweet cherry: Composition, postharvest preservation, processing and trends for its future use. Trends Food Sci. Technol. 2016, 55, 72–83. [Google Scholar] [CrossRef]
  54. Ozgur, C.; Cemile, E.O.; Atakan, G.; İsa, E.; İsmail, D. Determination of optimum harvest date of sweet cherry cv. Lapins grown in Isparta. Turk. J. Agric. For. 2014, 2, 1905–1910. [Google Scholar]
  55. Wani, A.A.; Singh, P.; Gul, K.; Wani, M.H.; Langowski, H.C. Sweet cherry (Prunus avium): Critical factors affecting the composition and shelf life. Food Packag. Shelf Life 2014, 1, 86–99. [Google Scholar] [CrossRef]
  56. Kappel, F.; Granger, A.; Hrotkó, K.; Schuster, M. Fruit Breeding; Springer: Berlin, Germany, 2011; pp. 459–504. [Google Scholar]
  57. Ooraikul, B.; Stiles, M.E. Modified Atmosphere Packaging of Food; Ellis Horwood Ltd.: Chichester, UK, 1991; pp. 169–242. [Google Scholar]
  58. Sakshi, P.; Rachel, A.I.; Carlos, R.C.; Luis, F.L.; Veronica, C.S.; Juan, C.C.; Dario, J.C. Fruit Characterization of Prunus serotina subsp. capuli. Horticulturae 2022, 8, 838. [Google Scholar] [CrossRef]
  59. Valentina, U.; Jerneja, F.; Franci, Š. Sugars, organic acids, phenolic composition and antioxidant activity of sweet cherry (Prunus avium L.). Food Chem. 2008, 107, 185–192. [Google Scholar]
  60. Ali, A.H.; Nurullah, D. Physicochemical characteristics, antioxidant activity, organic acid and sugar contents of 12 sweet cherry (Prunus avium L.) cultivars grown in Turkey. J. Food Sci. 2015, 80, 564–570. [Google Scholar]
  61. Girard, B.; Kopp, T.G. Physicochemical Characteristics of Selected Sweet Cherry Cultivars. J. Agric. Food Chem. 1998, 46, 471–476. [Google Scholar] [CrossRef]
  62. Gloria, D.R.; Daniel, R.V.; Patricia, M.; Merichel, P.; Maria, L.M. Composition of nonextractable polyphenols from sweet cherry pomace determined by dart-orbitrap-hrms and their in vitro and in vivo potential antioxidant, antiaging, and neuroprotective activities. J. Agric. Food Chem. 2002, 70, 7993–8009. [Google Scholar]
  63. Nuria, A.; Ana, G.; Marta, B.; Antonia, G.; Dolores, M.M. Comparison of phenolic compounds profile and antioxidant properties of different sweet cherry (Prunus avium L.) varieties. Food Chem. 2019, 279, 260–271. [Google Scholar]
  64. Dominika, Ś.T.; Alicja, P.; Ewelina, H.; Agnieszka, G.; Elżbieta, R. The profile and content of polyphenols and carotenoids in local and commercial sweet cherry fruits (Prunus avium L.) and their antioxidant activity in vitro. Antioxidants 2019, 8, 534. [Google Scholar]
  65. Chaovanalikit, A.; Wrolstad, R.E. Anthocyanin and phenolic composition of fresh and processed cherries. J. Food Sci. 2004, 69, 173–183. [Google Scholar]
  66. Tahir, M.; Farooq, A.; Ijaz, A.B.; Tahira, I. Effect of maturity on proximate composition, phenolics and antioxidant attributes of cherry fruit. Pak. J. Bot. 2013, 45, 909–914. [Google Scholar]
  67. Cao, J.P.; Jiang, Q.; Lin, J.Y. Physicochemical characterization of four cherry species (Prunus spp.) grown in China. Food Chem. 2015, 173, 855–863. [Google Scholar] [CrossRef]
  68. Aneta, W.; Paulina, N.; Piotr, L.; Jan, O. Evaluation of Sour Cherry (Prunus cerasus L.) Fruits for Their Polyphenol Content, Antioxidant Properties, and Nutritional Components. J. Agric. Food Chem. 2014, 62, 12332–12345. [Google Scholar]
  69. Sílvia, A.; Ivo, V.O.; Anne, S.M.; Alfredo, A.; Maria, J.S.; Berta, G. Phenolic Profile and Bioactive Potential of Stems and Seed Kernels of Sweet Cherry Fruit. Antioxidants 2020, 9, 1295. [Google Scholar]
  70. Taki, D. Determination of carotenoid, organic acid and sugar content in some sweet cherry cultivars grown in Sakarva, Turkey. J. Food. Agric. Environ. 2013, 11, 73–75. [Google Scholar]
  71. Mauro, C.; Martino, B.; Flavia, D.C.; Stefania, P.; Alessandra, B.; Francesca, M.; Stefano, N.; Matteo, S.; Stefania, C.; Linda, A.; et al. Multi-approach metabolomics analysis and artificial simplified phytocomplexes reveal cultivar-dependent synergy between polyphenols and ascorbic acid in fruits of the sweet cherry (Prunus avium L.). PLoS ONE 2017, 12, e0180889. [Google Scholar] [CrossRef]
  72. Zan, S.Y.; Wang, R.; Zhang, F.; Zhang, D.Y.; Liu, B.J.; Meng, X.H. Composition analysis of rootstock cherry (Prunus mahaleb L.), a potential source of human nutrition and dietary supplements. Eur. Food Res. Technol. 2022, 248, 1421–1435. [Google Scholar] [CrossRef]
  73. Ali, K.; Mahsa, M.; Kimiya, A. Morphological and pomological characterizations of sweet cherry (Prunus avium L.), sour cherry (Prunus cerasus L.) and duke cherry (Prunus ×gondouinii Rehd.) to choose the promising selections. Sci. Hortic. 2019, 257, 108719. [Google Scholar]
  74. Mirko, S.; Grafe, C.; Wolfram, B.; Schmidt, H. Cultivars resulting from cherry breeding in Germany. Erwerbs-obstbau 2014, 56, 67–72. [Google Scholar]
  75. Julia, P.; Craig, H.; Cai, L.C.; Zhao, Y.Y.; Amy, I.; Cameron, P. Genomic heritability estimates in sweet cherry reveal non-additive genetic variance is relevant for industry-prioritized traits. BMC Genet. 2018, 19, 23. [Google Scholar]
  76. Erdal, A.; Onur, S.; Orhan, K.; Burhan, O.; Sefa, G. The relationship between fruit color and fruit quality of sweet cherry (Prunus avium L. cv. ‘0900 Ziraat’). Turk. J. Food Agric. Sci. 2019, 1, 1–5. [Google Scholar]
  77. Chen, C.Q.; Chen, H.X.; Yang, W.L.; Li, J.; Tang, W.J.; Gong, R.G. Transcriptomic and metabolomic analysis of quality changes during sweet cherry fruit development and mining of related genes. Int. J. Mol. Sci. 2022, 23, 7402. [Google Scholar] [CrossRef]
  78. Verena, O.; Michaela, S.; Michael, B. Non-destructive sensor-based prediction of maturity and optimum harvest date of sweet cherry fruit. Sensors 2017, 17, 277. [Google Scholar]
  79. Tahir, M.; Farooq, A.; Mateen37 Mary, C.B.; Nazamid, S. Compositional variation in sugars and organic acids at different maturity stages in selected small fruits from Pakistan. Int. J. Mol. Sci. 2012, 13, 1380–1392. [Google Scholar]
  80. María, S.; Fabián, G.; Domingo, M.R.; Salvador, C.; Daniel, V. Chemical constituents and antioxidant activity of sweet cherry at different ripening stages. J. Agric. Food Chem. 2005, 53, 2741–2745. [Google Scholar]
  81. Marco, B.; Ariel, M. Impact of potassium pre-harvest applications on fruit quality and condition of sweet cherry (Prunus avium L.) cultivated under plastic covers in southern Chile orchards. Plants 2021, 10, 2778. [Google Scholar]
  82. Özgür, A.; Volkan, A.; Ece, T.; Gülser, Y. Effects of potassium fertilization on sweet cherry fruit (Prunus avium L.) quality and mineral content. Commun. Soil Sci. Plant Anal. 2022, 53, 1777–1782. [Google Scholar]
  83. Kadir, U.; Mesut, A. Effects of increasing doses of nitrogen, phosphorus, and potassium on the uptake of other nutrients in sweet cherry trees. Commun. Soil Sci. Plant Anal. 2021, 52, 1248–1255. [Google Scholar]
  84. Deniz, E. Effect of Preharvest Calcium Treatments on Sweet Cherry Fruit Quality. Not. Bot. Horti Agrobot. 2014, 42, 150–153. [Google Scholar]
  85. Andreas, W.; Bennet, F.; Moritz, K. Calcium physiology of sweet cherry fruits. Trees 2020, 34, 1157–1167. [Google Scholar]
  86. Felicia, C.; Sina, N.C. Morphological and biochemical characteristics of fruits of different cornelian cherry (Cornus mas L.) genotypes from spontaneous flora. Not. Sci. Biol. 2017, 9, 577–581. [Google Scholar]
  87. James, W.O.; Amy, F.I.; Matthew, D.W. Genotypic differences in sweet cherry fruit size are primarily a function of cell number. J. Am. Soc. Hortic. Sci. 2007, 132, 697–703. [Google Scholar]
  88. Sansavini, S.; Lugli, S. Sweet cherry breeding programs in Europe and Asia. Acta Hortic. 2008, 795, 41–58. [Google Scholar] [CrossRef]
  89. Chen, L. A new middle ripening sweet cherry cultivar “Linglongcui”. Acta Hortic. Sin. 2018, 45, 1419–1420. [Google Scholar]
  90. Diana, N.; Rim, M.; Walid, E.K. Quality and phytochemical composition of sweet cherry cultivars can be influenced by altitude. Plants 2023, 12, 2254. [Google Scholar]
  91. Danilo, C.; Francesca, A.; Carolina, T.; Corrado, C.; Emilia, C.; Roberto, C. Can environment and genotype influence sweet cherry qualitative parameters? Plant Biosyst. 2022, 156, 581–589. [Google Scholar]
  92. Iryna, I.; Maryna, S.; Vira, M.; Iryna, B.; Ihor, K.; Tetiana, T.; Oksana, T.; Oleksandr, T.; Mikhailo, M.; Alina, O. The study of soluble solids content accumulation dynamics under the influence of weather factors in the fruits of cherries. Slovak J. Food Sci. 2021, 15, 350–359. [Google Scholar]
  93. Legua1, P.; Domenech, A.; Martínez, J.J.; Sánchez-Rodríguez, L.; Hernández, F.; Carbonell-Barrachina, A.A.; Melgarejo, P. Bioactive and volatile compounds in sweet cherry cultivars. J. Food Nutr. Res. 2017, 5, 844–851. [Google Scholar] [CrossRef]
  94. Zhang, C.X.; Matthew, W. The occurrence of protruding pistil in sweet cherry (Prunus avium L.) and its consequence on fertilization. Sci. Hortic. 2012, 140, 149–156. [Google Scholar] [CrossRef]
  95. Cristóbal, P.P.; Marjorie, R.D.; Jorge, G.V.; Alejandra, R.F. The potential roles of the N and P supplies on the internal browning incidence in sweet cherries in the Southern Chile. Horticulturae 2022, 8, 1209. [Google Scholar]
  96. Valentinuzzi, F.; Mason, M.; Scampicchio, M.; Andreotti, C.; Cesco, S.; Mimmo, T. Enhancement of the bioactive compound content in strawberry fruits grown under iron and phosphorus deficiency. J. Sci. Food Agric. 2015, 95, 2088–2094. [Google Scholar] [CrossRef]
  97. William, E.C. Organic matter in the agricultural soils of Tasmania, Australia—A review. Geoderma 2018, 312, 170–182. [Google Scholar]
  98. Tirhas, G.; Paige, M.; Tom, A.F.; Melanie, D.J.; Louise, M.N. Mulching improved soil fertility, plant growth and productivity, and postharvest deficit irrigation reduced water use in sweet cherry orchards in a semi-arid region. Arch. Agron. Soil Sci. 2022, 69, 1419–1436. [Google Scholar]
  99. Cao, F.; Guan, C.; Dai, H.; Li, X.; Zhang, Z. Soluble solids content is positively correlated with phosphorus content in ripening strawberry fruits. Sci. Hortic. 2015, 195, 183–187. [Google Scholar] [CrossRef]
  100. Erdal, A.; Onur, S. Role of the foliar fertilization treatments on quality attributes of sweet cherry fruits (Prunus avium). Akad. Ziraat Derg. 2018, 7, 131–136. [Google Scholar]
  101. Andreas, W.; Moritz, K. Calcium and the physiology of sweet cherries: A review. Sci. Hortic. 2019, 245, 107–115. [Google Scholar]
  102. Tingzhen, M.; Renaud, R.; Franz, D.O.; Robert, T.; Sylvain, C. A nature-based negative emissions technology able to remove atmospheric methane and other greenhouse gases. Atmos. Pollut. Res. 2021, 12, 101035. [Google Scholar]
  103. Zhou, B.B.; Zhang, Q.; Sun, J.; Li, X.L.; Wei, Q.P. Study and application of partial least squares regression on relationship between soil nutrient and fruit quality. J. Agric. Sci. Technol. 2016, 17, 362–366. [Google Scholar]
  104. Liu, Z.B.; Huang, Y.; Tan, F.J.; Chen, W.C.; Ou, L.J. Effect of soil type on trace element absorption and fruit quality of pepper. Front. Plant Sci. 2021, 12, 698796. [Google Scholar] [CrossRef]
  105. Xu, M.G.; Zeng, X.B.; Li, J.M. Effect of pH on adsorption and desorption of Cu2+ in latersol and yellow brown earth. Chin. J. Soil Sci. 2005, 36, 349–351. [Google Scholar]
  106. Cassiano, N.L.; Geovani, S.L.; Evandro, M.S.; Reginaldo, G.N.; Hans, R.G.; Lauriane, A.A.S. Fruit quality of West Indian cherry under saline water irrigation and nitrogen-potassium fertilization. Braz. J. Agric. Environ. Eng. 2021, 25, 741–749. [Google Scholar]
  107. Yogaratnam, N.; Sharples, R.O. Supplementing the nutrition of bramley’s seedling apple with phosphorus sprays ii. effects on fruit composition and storage quality. J. Hortic. Sci. Biotech. 1982, 57, 53–59. [Google Scholar] [CrossRef]
  108. Johnson, C.R. Phosphorus nutrition on mycorrhizal colonization, photosynthesis, growth and nutrient composition of Citrus aurantium. Plant Soil 1984, 80, 35–42. [Google Scholar] [CrossRef]
  109. Fredeen, A.L.; Rao, I.M.; Terry, N. Influence of phosphorus nutrition on growth and carbon partitioning in Glycine max. Plant Physiol. 1989, 89, 225–230. [Google Scholar] [CrossRef]
  110. López-Arredondo, D.L.; Leyva-González, M.A.; González-Morales, S.I.; López-Bucio, J.; Herrera-Estrella, L. Phosphate nutrition: Improving low-phosphate tolerance in crops. Annu. Rev. Plant Biol. 2014, 65, 95–123. [Google Scholar] [CrossRef] [PubMed]
  111. Guo, K.; Peng, L.; Hong, Y.; Qiao, G. Optimizing Nitrogen, Phosphorus, and Potassium Fertilization Rates for Fruit Performance of Chinese Cherry (Prunus pseudocerasus Lindl.). Int. J. Fruit Sci. 2022, 22, 769–778. [Google Scholar] [CrossRef]
  112. Olivos, A.; Johnson, S.; Xiaoqiong, Q.; Crisosto, C.H. Fruit phosphorous and nitrogen deficiencies affect ‘Grand Pearl’ nectarine flesh browning. Horstscience 2012, 47, 391–394. [Google Scholar] [CrossRef]
  113. Hina, M.; Vandana Sandeep, D.; Renu, P. Phosphorus nutrition: Plant growth in response to deficiency and excess. In Plant Nutrients and Abiotic Stress Tolerance; Hasanuzzaman, M., Fujita, M., Oku, H., Nahar, K., Hawrylak-Nowak, B., Eds.; Springer: Singapore, 2018. [Google Scholar] [CrossRef]
  114. Karl, K.; Hanne, L.P. Effects of potassium, phosphorus and nitrogen fertilization on endogenous ethylene and quality characteristics of apples (Malus domestica L.). J. Plant Nutr. 2014, 37, 1148–1155. [Google Scholar]
  115. Changwei, S.; Ding, Y.; Lei, X.; Zhao, P.; Wang, S.; Xu, Y.; Dong, C. Effects of foliar potassium fertilization on fruit growth rate, potassium accumulation, yield, and quality of ‘kousui’ Japanese pear. J. Am. Soc. Hortic. Sci. 2016, 26, 270–277. [Google Scholar]
  116. Santos, M.; Ferreira, H.; Egea-Cortines, M.; Sousa, J.R.; Raimundo, F.; Matos, M.; Gonçalves, B. Evaluation of fruit quality, chromatic parameters and anthocyanin’s content under foliar application of magnesium and potassium on sweet cherry (Prunusavium L.) cv. Burlat. Biol. Life Sci. Forum 2021, 3, 47. [Google Scholar]
  117. Pant, R.C.; Singh, B. Potassium Level and Physiological Response and Fruit Quality in Hydroponically Grown Tomato. Int. J. Veg. Sci. 2009, 16, 85–99. [Google Scholar]
  118. Liu, J.; Hu, T.; Feng, P.; Yao, D.; Gao, F.; Hong, X. Effect of potassium fertilization during fruit development on tomato quality, potassium uptake, water and potassium use efficiency under deficit irrigation regime. Agric. Water Manag. 2021, 250, 106831. [Google Scholar] [CrossRef]
  119. Perkins-Veazie, P.; Roberts, W. Can potassium application affect the mineral and antioxidant content of horticultural crops? In Proceedings of the Symposium on Fertilizing Crops for Functional Food, Indianapolis, IN, USA, 11 November 2002. [Google Scholar]
  120. José, G.V.; Sonia, O. Postharvest Physiology and Biochemistry of Fruits and Vegetables; Elsevier: Amsterdam, The Netherlands, 2019; pp. 207–244. [Google Scholar]
  121. Ghasemzadeh, A.; Jaafar, H.Z.E.; Rahmat, A. Elevated Carbon Dioxide Increases Contents of flavonoids and Phenolic Compounds, and Antioxidant Activities in Malaysian Young Ginger (Zingiber officinale Roscoe.) Varieties. Molecules 2010, 15, 7907–7922. [Google Scholar] [CrossRef]
  122. Wei, H.; Tye, L.; Bresnick, E.; Birt, D.F. Inhibitory effect of epigenin, a plant flavonoid, on epidermal ornithine decarboxylase and skin tumor promotion in mice. Cancer Res. 1990, 50, 499–502. [Google Scholar]
Figure 1. Pearson’s correlation coefficients of physiochemical parameters for GI cherries. Note: ***, **, * Correlation is significant, respectively. W, weight; L, length; SI, shape index; Jy, juice yield; Er, edible rate; SSC, soluble solids content; Glu, glucose; Fru, fructose; TS, total sugar; TA, titratable acidity; MI, maturity index; TAC, total anthocyanins content; PC, procyanidins; TPC, total phenolic content; TFC, total flavonoid content. AA, ascorbic acids; Mg, magnesium; K, potassium; Ca, calcium; Fe, iron.
Horticulturae 09 01118 g001
Table 1. Name, origin, variety, climate type, and maturation time for GI cherries in this study.
GI NameOriginVarietyClimate TypePicking Time
BaqiaoXi’an, ShanxiHongdengTemperate monsoonMid May
TianbaoTaian, ShandongHuangmiTemperate monsoonMid May
JiangxianYuncheng, ShanxiTietonTemperate monsoonMid May
WenchuanAba Tibetan and Qiang Autonomous Prefecture, SichuanHongdengSubtropical monsoonMid May
XiehuLianyungang, JiangsuBrooksSubtropical monsoonMid May~Early June
TongzhouTongzhou, BeijingHongdengTemperate monsoonEarly June
QinzhouTianshui, GansuTietonTemperate monsoonMid June
LeduHaidong, QinghaiTietonPlateau mountainMid June
DalianDalian, LiaoningRussian NO.8Temperate monsoonLate June
Table 2. External properties of GI cherry samples.
SampleWidth (mm)Length (mm)Shape IndexWeight (g)Juice Yield (%)Edible Rate (%)
Baqiao28.66 ± 0.98 d24.53 ± 0.83 c0.86 ± 0.03 bc10.24 ± 0.09 d60.47 ± 1.29 c92.50 ± 0.36 b
Tianbao21.61 ± 1.65 a21.38 ± 0.95 ab0.99 ± 0.04 e5.00 ± 0.23 a63.63 ± 1.10 d90.93 ± 0.75 a
Jiangxian24.08 ± 1.24 b21.05 ± 5.67 ab0.91 ± 0.18 bcd11.00 ± 0.04 e66.08 ± 1.63 e93.37 ± 0.31 c
Wenchuan24.23 ± 1.35 b20.33 ± 1.20 a0.84 ± 0.04 ab10.40 ± 0.01 d49.09 ± 1.30 b92.93 ± 0.54 bc
Xiehu24.41 ± 0.68 b22.23 ± 0.67 b0.91 ± 0.04 d6.71 ± 0.11 b68.20 ± 0.23 f90.73 ± 0.15 a
Tongzhou26.93 ± 2.68 c21.27 ± 1.48 ab0.79 ± 0.04 a6.97 ± 0.21 b39.70 ± 0.61 a92.67 ± 0.42 bc
Qinzhou31.77 ± 1.34 e29.45 ± 1.05 d0.93 ± 0.03 d14.76 ± 0.24 f71.10 ± 0.82 g95.20 ± 0.27 d
Ledu26.80 ± 1.43 c23.60 ± 0.90 c0.88 ± 0.03 bcd8.22 ± 0.25 c66.17 ± 0.35 e92.50 ± 0.36 b
Dalian34.78 ± 1.26 f31.15 ± 1.24 e0.90 ± 0.03 cd17.92 ± 0.10 g59.97 ± 0.35 c96.23 ± 0.25 e
Mean27.0323.890.8910.1460.4993.01
Std.4.153.880.064.1010.051.78
CV%15.3716.276.4140.4716.611.92
Note: Std. and CV represent standard deviation and coefficient of variation, respectively. Different letters in each column stand for mean values significantly different according to Duncan’s test at p < 0.05.
Table 3. Taste properties of GI cherry samples.
SampleSoluble Solids (Brix°)Titratable Acidity (g/kg)Maturity IndexTotal Sugar (g/100 g)Glucose (g/100 g)Fructose (g/100 g)
Baqiao12.65 ± 0.49 a4.9 ± 0.00 c25.65 ± 1.10 b9.09 ± 0.16 a4.89 ± 0.09 a4.20 ± 0.01 a
Tianbao12.64 ± 0.10 a3.3 ± 0.01 a38.56 ± 1.82 e9.83 ± 0.01 a5.33 ± 0.26 a4.50 ± 0.01 a
Jiangxian17.47 ± 1.15 c5.4 ± 0.00 c32.59 ± 2.16 d15.69 ± 0.05 e10.30 ± 0.45 d5.39 ± 0.11 b
Wenchuan23.67 ± 1.00 e8.0 ± 0.00 e29.52 ± 0.96 c18.75 ± 0.36 f12.38 ± 0.64 e6.37 ± 0.41 d
Xiehu15.29 ± 0.17 b8.1 ± 0.00 e18.82 ± 0.10 a13.85 ± 0.79 d9.42 ± 0.40 c4.43 ± 0.18 a
Tongzhou19.08 ± 0.61 d9.9 ± 0.01 f19.21 ± 0.84 a19.70 ± 0.22 g13.79 ± 0.50 f5.91 ± 0.27 c
Qinzhou15.69 ± 0.06 b4.5 ± 0.00 b35.22 ± 0.30 e12.79 ± 0.13 c7.28 ± 0.34 b5.51 ± 0.18 bc
Ledu17.72 ± 0.28 c6.9 ± 0.02 d25.72 ± 0.37 b12.73 ± 0.02 c6.83 ± 0.08 b5.90 ± 0.08 c
Dalian17.22 ± 0.28 c5.5 ± 0.01 c31.13 ± 0.78 cd11.86 ± 0.06 b6.67 ± 0.09 b5.19 ± 0.11 b
Mean16.546.1028.4913.818.115.24
Std.3.152.006.773.653.080.68
CV%19.01%32.94%23.77%26.45%37.93%12.93%
Notes: Std. and CV represent standard deviation and coefficient of variation, respectively. Different letters in each column stand for mean values significantly different according to Duncan’s test at p < 0.05.
Table 4. Nutritional properties of GI cherry samples.
SampleTPC (mg/100 g)TAC (mg/kg)TFC (mg/100 g)Procyanidin (mg/100 g)β-Carotene (ug/100 g)Ascorbic Acids (mg/100 g)Potassium (mg/kg)Magnesium (mg/kg)Calcium (mg/kg)Iron (mg/kg)
Baqiao123.04 ± 2.23 bc5.79 ± 0.27 a11.59 ± 0.67 bc16.35 ± 0.86 c187.86 ± 4.93 f6.62 ± 0.13 c1840.91 ± 77.73 a104.22 ± 4.41 b105.66 ± 3.01 d9.14 ± 0.38 f
Tianbao143.10 ± 0.60 d6.78 ± 0.42 a7.86 ± 0.49 a2.98 ± 1.34 a147.85 ± 9.44 e5.48 ± 0.13 b1883.01 ± 117.06 a114.47 ± 1.89 c126.93 ± 3.90 e3.66 ± 0.10 ab
Jiangxian125.65 ± 1.44 c17.60 ± 0.57 de12.23 ± 0.56 c28.70 ± 1.74 e42.94 ± 2.91 bc5.59 ± 0.17 b2144.99 ± 65.46 bc100.27 ± 1.56 b91.85 ± 2.51 c3.01 ± 0.14 a
Wenchuan100.04 ± 3.88 a15.76 ± 1.06 cd14.54 ± 0.11 d57.91 ± 1.67 g17.00 ± 0.95 a5.55 ± 0.17 b2459.53 ± 33.57 d128.82 ± 1.48 e125.23 ± 2.04 e5.05 ± 0.34 d
Xiehu104.71 ± 5.68 a10.75 ± 0.36 b9.54 ± 0.08 ab4.31 ± 0.06 a115.07 ± 7.86 d5.74 ± 0.23 b2591.51 ± 47.16 d112.76 ± 1.46 c79.10 ± 2.96 b6.50 ± 0.30 e
Tongzhou115.10 ± 7.18 b14.74 ± 0.06 c16.06 ± 0.44 de11.36 ± 0.28 b127.26 ± 8.60 d3.81 ± 0.04 a3090.44 ± 114.08 e184.10 ± 2.91 g155.01 ± 5.40 f4.82 ± 0.33 d
Qinzhou132.65 ± 0.14 c18.81 ± 1.00 e21.80 ± 0.90 f22.28 ± 1.46 d30.94 ± 1.06 b7.61 ± 0.42 d2016.18 ± 31.19 ab92.31 ± 0.85 a89.83 ± 0.39 c3.89 ± 0.27 bc
Ledu149.06 ± 6.31 d19.04 ± 0.95 e17.82 ± 0.76 e39.69 ± 2.24 f40.00 ± 1.59 bc6.96 ± 0.26 c2529.14 ± 0.81 d138.92 ± 2.21 f100.93 ± 0.82 d4.25 ± 0.11 cd
Dalian197.72 ± 3.94 e53.82 ± 2.31 f35.64 ± 2.22 g61.77 ± 1.85 h52.12 ± 2.42 c3.69 ± 0.24 a2268.05 ± 131.92 c120.96 ± 3.83 d70.13 ± 4.89 a3.03 ± 0.02 a
Mean131.518.4418.6925.43125.946.092268.84123.77108.324.82
Std.27.8313.4910.8621.35142.891.8402.4726.5227.311.95
CV%21.16%73.15%58.10%83.97%113.46%29.56%17.74%21.42%25.21%40.57%
Notes: Std. and CV represent standard deviation and coefficient of variation, respectively. Different letters in each column stand for mean values significantly different according to Duncan’s test at p < 0.05. TPC, total phenolic content; TAC, total anthocyanins content; TFC, total flavonoid content.
Table 5. Effects (mean ± SE) of cultivars and climate types on typical quality parameters of GI cherries.
FactorsFruit WeightSoluble Solids ContentTitratable AcidityMaturity IndexTotal Phenols
Cultivars
Honegdeng9.50 ± 0.49 b19.77 0.90 b19.06 ± 0.30 b14.18 ± 1.43 ab112.72 ± 11.11 a
Huangmi5.00 ± 0.793 a12.64 ± 1.47 a27.50 ± 0.49 d7.86 ± 2.33 a143.10 ± 0.60 b
Tieton10.55 ± 0.49 c17.15 ± 0.90 b21.34 ± 0.30 c17.42 ± 1.43 b135.79 ± 5.68 b
Brooks6.71 ± 0.79 a15.29 ± 1.47 ab15.64 ± 0.49 a9.55 ± 2.33 a104.71 ± 3.94 a
Russia NO.817.93 ± 0.79 d17.22 ± 1.47 b18.86 ± 0.49 b35.64 ± 2.33 c197.72 ± 28.67 c
Climate types
Temperate monsoon11.10 ± 0.34 b15.58 ± 0.64 a22.55 ± 0.21 c18.58 ± 1.01 b147.26 ± 1.53 b
Subtropical monsoon8.56 ± 0.56 a19.48 ± 1.04 b18.15 ± 0.35 b12.04 ± 1.65 a102.37 ± 2.94 a
Plateau Mountain8.22 ± 0.79 a17.72 ± 1.47 ab16.29 ± 0.49 a17.82 ± 2.33 b149.06 ± 3.53 c
ANOVA p-value Main Effects
Cultivars0.000 ***0.011 **0.000 ***0.000 ***0.000 ***
Climate types0.000 ***0.004 ***0.000 ***NS0.000 ***
Note: *** and ** represent the significance levels at p < 0.01 and p < 0.05, respectively. NS means non-significant. Means followed by the same letters within each column represent no significant difference (with Duncan’s test, α < 0.05).
Table 6. Parameters of soil conditions for GI cherries.
SamplespHOrganic Matter
g/kg
Available P
mg/kg
Available K
mg/kg
Available Fe
mg/kg
Available Ca
mg/kg
Baqiao7.85 ± 0.01 f14.50 ± 0.14 c13.90 ± 0.42 a237.00 ± 0.00 d20.90 ± 0.00 b335.00 ± 1.41 b
Tianbao6.65 ± 0.00 b18.50 ± 0.57 d40.00 ± 0.85 b128.00 ± 0.71 a28.10 ± 0.00 e392.00 ± 0.71 e
Jiangxian7.98 ± 0.00 g19.30 ± 0.06 e71.60 ± 0.90 c419.00 ± 1.41 f29.70 ± 0.21 f333.00 ± 2.12 b
Wenchuan7.21 ± 0.01 c44.10 ± 0.49 h542.00 ± 22.63 f837.00 ± 2.12 h25.50 ± 0.00 d427.00 ± 2.83 f
Xiehu6.61 ± 0.01 a13.40 ± 0.14 b49.90 ± 2.55 b187.00 ± 1.41 c54.60 ± 0.07 i291.00 ± 1.41 a
Tongzhou7.77 ± 0.00 e35.60 ± 0.21 f248.00 ± 4.95 d752.00 ± 9.19 g34.40 ± 0.00 h371.0 ± 02.12 d
Qinzhou7.98 ± 0.00 g19.30 ± 0.07 e60.84 ± 2.31 bc358.00 ± 0.00 e23.00 ± 0.00 c344.00 ± 1.41 c
Ledu8.26 ± 0.01 h10.60 ± 0.14 a14.35 ± 0.52 a173.00 ± 2.12 b5.37 ± 0.01 a438.00 ± 2.83 g
Dalian7.43 ± 0.01 d42.00 ± 0.35 g308.50 ± 13.44 e1760.00 ± 3.54 i31.80 ± 0.35 g461.00 ± 2.12 h
Mean7.5324.14149.90539.0028.15376.89
Std.0.5912.84180.81523.2313.0456.70
CV (%)7.90%53.18%120.62%97.07%46.30%15.05%
Note: Std. and CV represent standard deviation and coefficient of variation, respectively. Different letters in each column stand for mean values significantly different according to Duncan’s test at p < 0.05.
Table 7. Multiple linear regression equations of typical quality properties dependent on soil condition parameters.
Quality ParametersInfluencing FactorsRegression EquationFSig.Modified R2
SSCavailable PYSSC = 0.016X1 + 14.48815.7310.0050.648
TAavailable P, available K, available Fe, available Ca, pHYTA = 0.008X1 − 0.008X2 + 0.455X3 + 0.081X4 + 5.709X5 − 76.98010.8820.0390.861
TPCavailable Fe, available P, available KYTPC = −0.009X3 − 0.002X1 + 0.001X2 + 1.40930.5420.0010.917
Note: X1, available P; X2, available K; X3, available Fe; X4, available Ca; X5, pH.
Disclaimer/Publisher’s Note: The statements, opinions and data contained in all publications are solely those of the individual author(s) and contributor(s) and not of MDPI and/or the editor(s). MDPI and/or the editor(s) disclaim responsibility for any injury to people or property resulting from any ideas, methods, instructions or products referred to in the content.

