Article

Transcriptome Analysis of Berries of Spine Grape (Vitis davidii Föex) Infected by Colletotrichum viniferum during Symptom Development

1
Fruit Research Institute, Fujian Academy of Agricultural Sciences, Fuzhou 350013, China
2
College of Horticulture, Fujian Agriculture and Forestry University, Fuzhou 350002, China
3
College of Horticulture, Northwest A&F University, Yangling 712100, China
*
Author to whom correspondence should be addressed.
These authors contributed equally to this work.
Horticulturae 2022, 8(9), 843; https://doi.org/10.3390/horticulturae8090843
Submission received: 12 August 2022 / Revised: 8 September 2022 / Accepted: 8 September 2022 / Published: 14 September 2022
(This article belongs to the Special Issue Stress Biology of Horticultural Plants)

Abstract

:
Grape ripe rot (Colletotrichum viniferum) causes huge losses in grape production in vineyards in southern China. However, the molecular mechanism against ripe rot in grape species and the responsive genes implicated in these processes are relatively unknown. Here, we present the transcriptome analysis of berries from a C. viniferum-resistant species (Vitis davidii Föex). Uninfected berries at day zero were used as control samples (CK), an inoculation was made at day zero, and the berries were subsequently analyzed at 1 day, 3 days, and 7 days post inoculation (dpi), which exhibited a sequential disease-progression stage. There were a total of 1810 differentially expressed genes, including 1315 up-regulated and 495 down-regulated transcripts. At 7 dpi, these differentially expressed genes (DEGs) were predominantly enriched in berries. In addition, in C. viniferum-infected grape fruits at 7 dpi, considerable changes in gene expression were induced, and those up-regulated genes involved in MAPK cascade, calcium ion binding, and serine/threonine kinase activity were enriched. According to our KEGG pathway analysis, numerous enriched biological processes, such as plant–pathogen interaction, phenylpropanoid biosynthesis, and metabolism, were implicated in grape–fungus interactions. Our research also revealed alterations in the expression pattern of phenylalanine-pathway-related transcription factors (TFs) and genes. We proposed a model in which C. viniferum invasion produces intracellular and extracellular Ca2+ deregulation to stimulate the MAPK pathway to activate TFs’ (WRKY, ERF, and MYB) up-regulation, thus initiating disease-resistant responses in the tolerant Vitis species. Our results offer comprehensive transcriptomic data about molecular responses in C. viniferum-infected grape, and these data will aid in understanding of processes underlying plant responses to C. viniferum.

1. Introduction

Grapevine (Vitis L.) is an economically significant fruit crop that is extensively used to produce wine, grape juice, and table grapes. However, the majority of cultivars derived from V. vinifera are highly susceptible to various pathogens [1]. Among these, grape ripe rot, caused by Colletotrichum viniferum, a notorious disease, causes fruit rot and is one of the most economically significant diseases worldwide, resulting in considerable losses in the quality of grape production [2]. Potentially, it causes losses with severities up to 67% or 37% in the Mid-Atlantic U.S. and northeast China, respectively [3]. This fungus predominantly infects mature fruits [4,5]. Moreover, the impact of Colletotrichum on the chemical properties of fruits and wine is well-documented [6]. The typical symptoms are lesions, which are found on berries, stalks, and leaves in warm and wet conditions [2,7].
Currently, this fungal disease is largely controlled using fungicides in viticulture. However, the use of synthetic fungicides is detrimental to both the environment and human health and may enhance the resistance of diseases to fungicides. Therefore, breeding grapes so that they gain resistance to ripe rot might be an ecologically friendly and efficient preventative method in the current agriculture. The unfavorable impact of fungicides in the prevention of the spread of this disease in ripe-rot-susceptible grape cultivars has increased the interest in breeding ripe-rot-resistant table grapes through interspecific cross breeding between American and European hybrids [8]. Two hundred and thirty-five Vitis and six Muscadinia grapevine cultivars and selections were evaluated for ripe rot resistance, and fifty cultivars or selections were classified as highly resistant [8]. Accordingly, it was recently reported that a grape-ripe-rot-resistance locus (Cgr1) has been identified from V. amurensis [9]. However, the molecular mechanism of grapevines in C. viniferum infection is largely unknown.
As one of the centers of grape production, China is home to a number of native ripe-rot-resistant grape genotypes. V. davidii, for instance, has a relatively high tolerance to rot, making it a desirable source of material in ripe-rot-resistance investigation into classical cross breeding or molecular mechanisms. In the present study, a ripe-rot-tolerant Vitis species, V. davidii, was inoculated with C. viniferum, and then, the transcriptomic analysis of the differentially expressed genes and pathways was carried out, thereby providing ripe-rot-resistant gene resources for the molecular improvement of susceptible cultivars.

2. Materials and Methods

2.1. Plant Materials and Treatments

Well-cultivated V. davidii (accession FuAn) grapevines were planted in XiTa village (27°04′55.61″ N/119°31′29.11″ E), MuYun town, FuAn city, Fujian Province, China. Three biological repeats were conducted. For one biological repeat per treatment, forty-two healthy, ripe grape berries (130 days after anthesis) were plucked from three grape plants (fourteen berries per plant). A C. viniferum isolate was collected and purified from diseased grapevine berries and cultured on potato dextrose agar medium (PDA). Four-millimeter-diameter disks of C. viniferum PDA were removed with a puncher and were then placed on scratched grapevine berries using a needle. Uninfected berries at day zero were used as control samples (CK), an inoculation was made at day zero, and the berries were subsequently analyzed at 1 day, 3 days, and 7 days post inoculation (dpi). All the samples (CK, 1 dpi, 3 dpi, and 7 dpi) were collected for further transcriptome analysis. The infected pericarps from 42 berries in one biological repeat per treatment were mixed as one sample and stored at −80 °C.

2.2. RNA Extraction and Transcriptome Analysis

Three biological replicates of grape berries in each infection stage were used for the transcriptome analysis. Total RNA was extracted using lithium chloride precipitation [10], and the quality of the RNA was determined using an Agilent 2100 Bioanalyzer (Agilent, Santa Clara, CA, USA). mRNA was enriched using oligo (dT) magnetic beads and fragmented with endonuclease. Then, fragments were ligated with unique adaptors, which was followed by PCR amplification to generate libraries for RNA-seq. Libraries were sequenced with an Illumina HiseqTM 2000 System by Genedenovo Co., Ltd. (Guangzhou, China). Clean data filtered from raw sequencing data were used for assembly and RPKM value calculation. First, we mapped transcriptome data with Tophat [11] to the reference genome of “Pinot Noir” [12]. The expression value of genes was calculated using the reads per kb per million reads method [13]. We used expressed genes to blastx search against the NCBI Non-redundant Protein database, the SwissProt database, the KEGG database, and the COG/KOG database with an E-value of 0.00001. The functional annotations of the expressed genes were definite, and the gene ontologies of the expressed genes were annotated using Blast 2 GO [14].

2.3. Functional Annotation of Differentially Expressed Genes (DEGs)

EdgeR was used to identify DEGs with raw count data [15]. Raw p-values were tested with the false-discovery rate (FDR) [16,17]. Genes with fold change >2.0 and FDR < 0.05 were considered to be DEGs. Gene ontology (GO) enrichment was conducted with web-based agriGO [18], and corrected p-values < 0.05 were regarded as significant GO terms. DEGs were mapped to the KEGG database [19] to identify significant KEGG pathways. In addition, a Q-value was used to multi-test the p-value, and a Q-value < 0.05 was set as the threshold for a significant KEGG pathway.

2.4. Co-Expression Analysis

The WGCNA package (Los Angeles, CA, USA) was used for the weighted correlation network analysis of the identified genes [20]. Genes were clustered into different blocks based on their correlation coefficient. Then, we filtered genes that belonged to specific categories using a self-written Perl script. Finally, the co-expression network was constructed using Cytoscape v3.5.1 (Seattle, WA, USA) [21].

2.5. Quantitative RT-PCR (qRT-PCR) Analysis

Total RNA was extracted from samples in the same way that it was extracted for RNA-seq. RNA samples (2 μg) were treated with RNase-free DNase I to remove residual genomic DNA, and then, they were used for cDNA synthesis with a PrimeScript™ RT reagent Kit with a gDNA Eraser (TaKaRa). Reaction mixtures were diluted 1:40 with distilled water and used as templates for qRT-PCR. Information regarding primers is listed in Supplementary Table S1. Quantitative assays were performed in a Bio-Rad iQ5 system (Bio-Rad, Hercules, CA, USA) in triplicate on each cDNA sample, and the transcript levels were calculated relative to the level of grapevine GAPDH (CB973647) using the 2−ΔΔCt method [22]. All data are presented as mean ± SD (n = 3).

3. Results

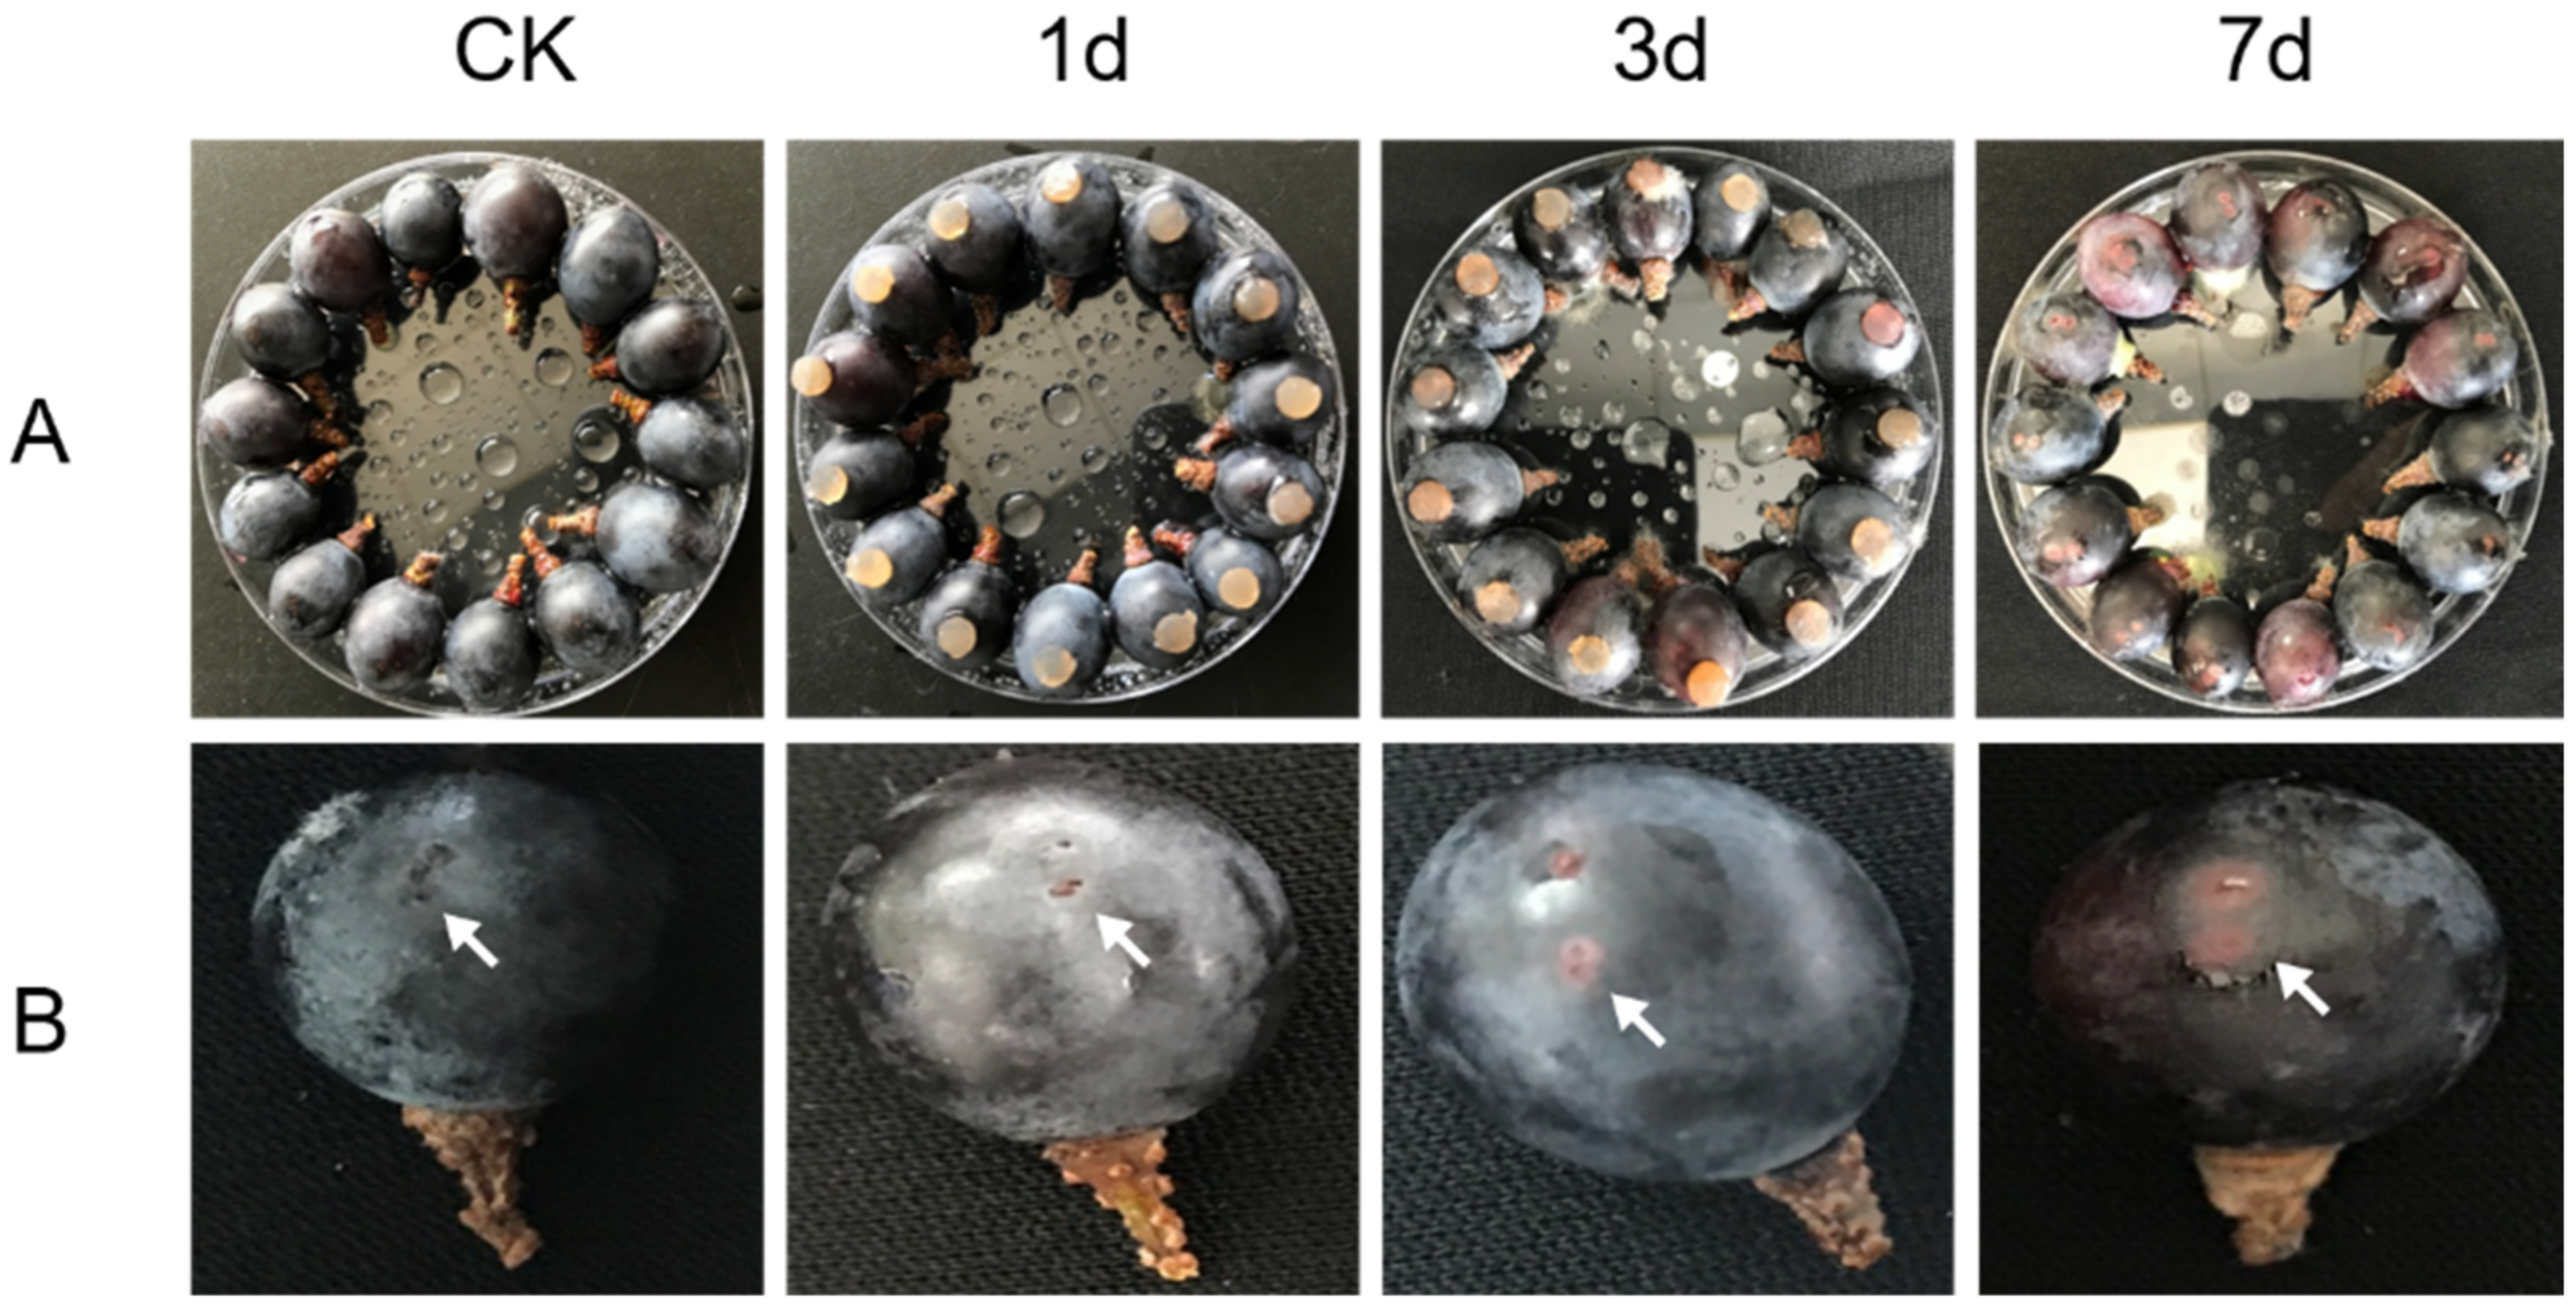
3.1. Statistics of Infected Berries Inoculated with Colletotrichum Viniferum

Healthy, ripe grape berries (susceptible: V. vinifera × V. labrusca, cv. Kyoho; resistant: V. davidii accession FuAn) were washed with sterile water several times before microbial infection was carried out. Each berry was scratched with a needle, and sclerotium was then applied to the wound. The rates of infection were examined at 1 dpi, 3 dpi, and 7 dpi. At 1 dpi, there were no lesions at the wound site; however, at 3 dpi, there were slight lesions at the wound site; and at 7 dpi, the lesions were larger than those at 3 dpi (Figure 1 and Figure S1). We chose V. davidii samples (CK, 1 dpi, 3 dpi, and 7 dpi) for transcriptome analysis in an effort to understand the dynamic changes from the gene response to the disease-resistant gene expression.

3.2. Transcriptome Sequencing and Data Statistics

RNA-seq was performed on an Illumina Hiseq2000, and each sample had at least 20 million filtered pair-end reads (Table 1). We mapped transcriptome data to the genome reference [12]. The total mapped reads, uniquely mapped reads, and mapping ratio were examined (Table 1). The max and min total mapped reads were 23,577,067 and 17,292,774, respectively. Moreover, the maximum and minimum uniquely mapped reads were 21,660,483 and 15,925,781, respectively. The lowest mapping ratio was 75.81% (infected samples at 7 dpi), while the highest mapping ratio was 87.13% (infected samples at 3 dpi).

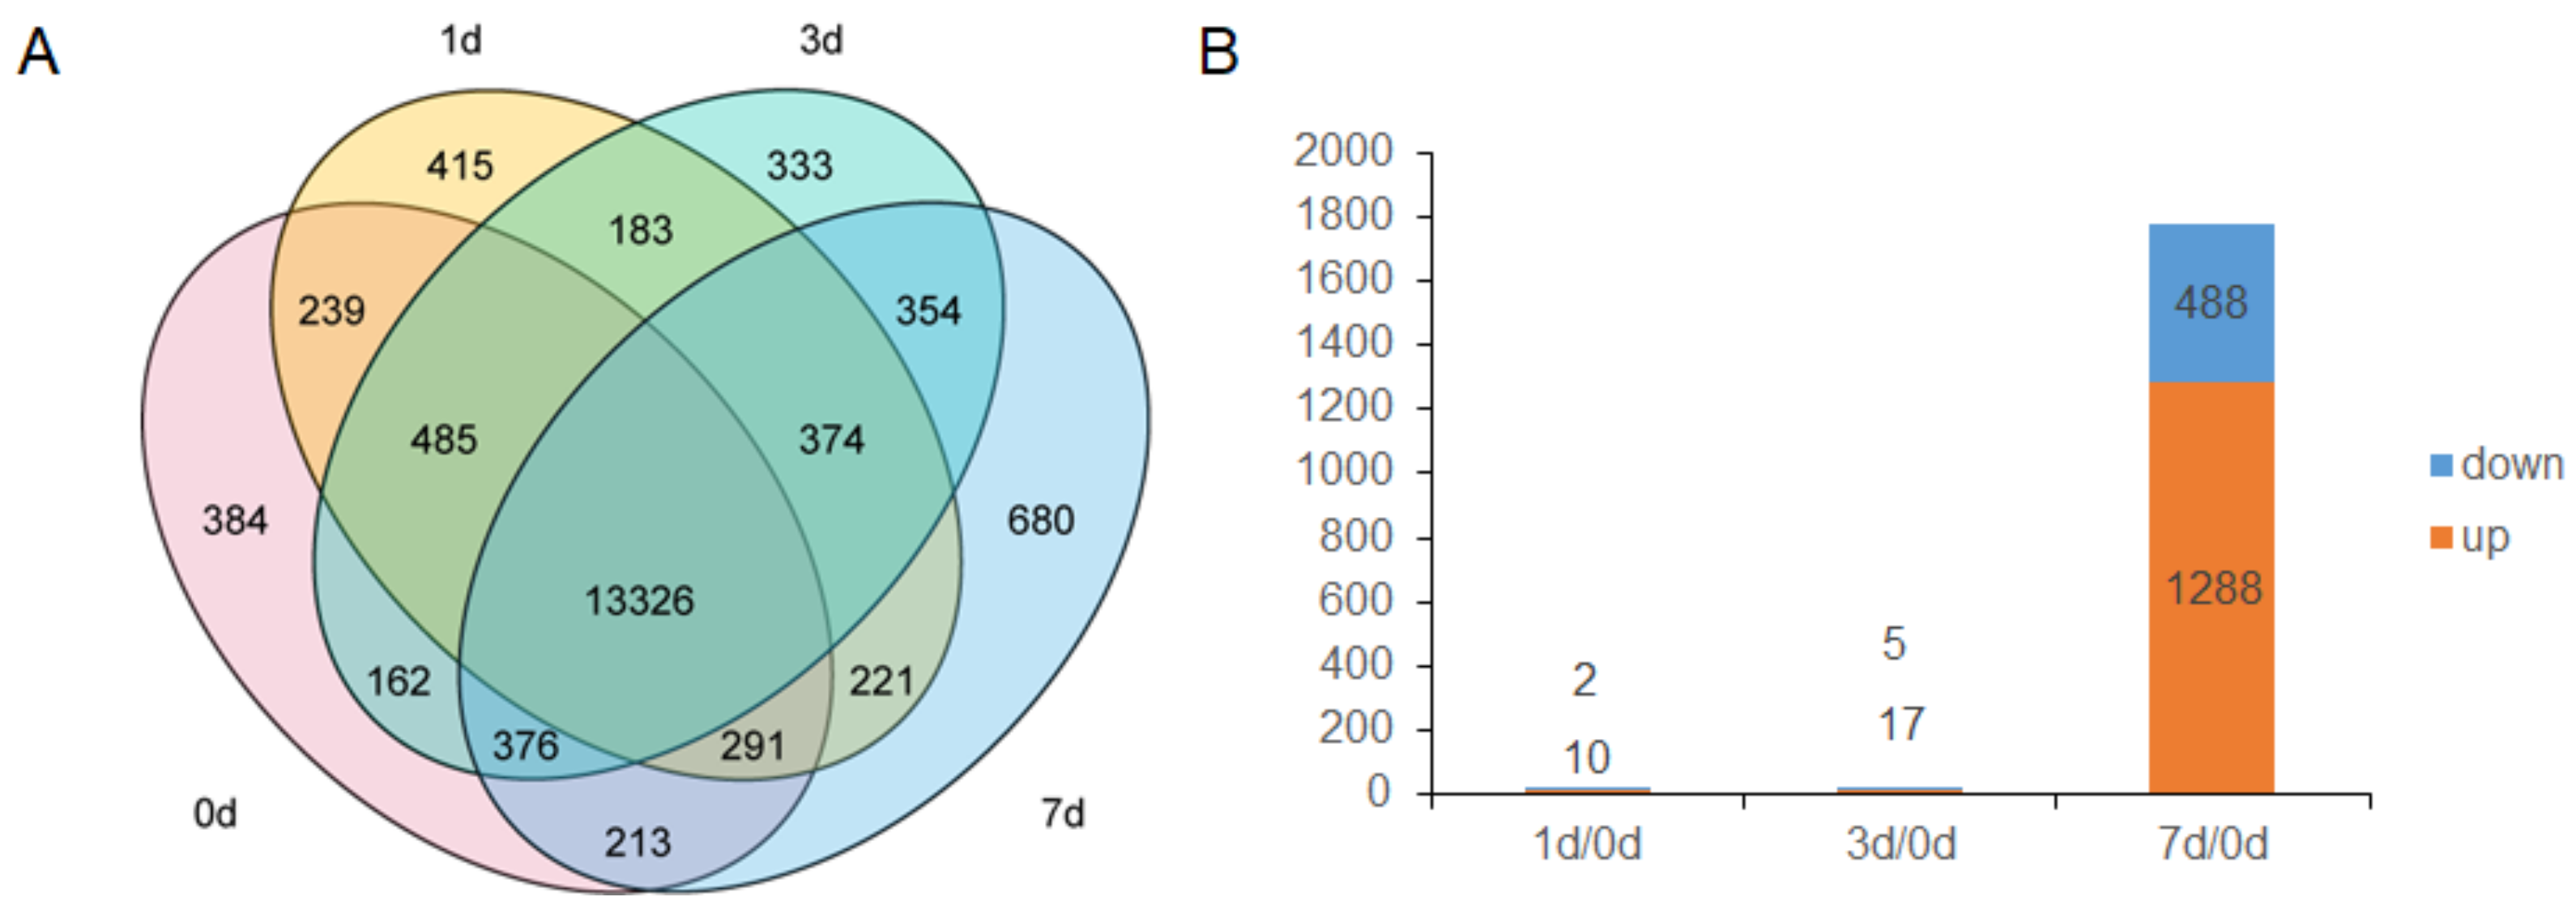
3.3. DEGs of V. davidii after Infection

To understand the dynamic change in the gene expression profiles after infection, the FPKM value of each gene was calculated (Supplementary Table S2), and DEGs of V. davidii were identified by comparing infected samples at different time points to control samples (Supplementary Tables S3–S5). For the V. davidii, there were 1315 up-regulated genes and 495 down-regulated genes (Figure 2). In detail, there were 10, 17 and 1288 up-regulated genes and 2, 5, and 488 down-regulated genes at 1 dpi, 3 dpi, and 7 dpi (Figure 2B). In general, these genes could be clustered into two groups. One group represented genes that were up-regulated at the 7-dpi stage, while the other group represented genes that were down-regulated at the 7-dpi stage (Supplementary Table S5).

3.4. GO Functional Analysis of the DEGs

We conducted a GO functional analysis of up-regulated and down-regulated DEGs at the 7-dpi stage. They were clustered into three categories, namely “biological process”, “molecular function”, and “cellular component”. In addition, we conducted a GO enrichment analysis of up-regulated and down-regulated genes at the 7-dpi stage (Supplementary Table S6). The enriched GO categories of up-regulated genes are shown in Figure 3A. In detail, there were 28 enriched GO categories of up-regulated genes. MAPK cascade, calcium ion binding, and protein serine/threonine kinase activity were enriched (Figure 3A and Figure S2). In terms of the down-regulated genes, there were 14 enriched GO categories. From these GO terms, disaccharide metabolic process, motor activity, and protein kinase activity were enriched, and these gene ontologies were mostly engaged in carbohydrate metabolisms and cytoskeleton structures (Figure 3B and Figure S3).

3.5. KEGG Pathway Enrichment Analysis of the DEGs

To explore the linked pathways of DEGs at the 7-dpi stage, we enriched the KEGG pathway of the DEGs to understand the potential pathways involved in C. viniferum infection (Supplementary Table S7). The top 20 enriched pathways are shown in Figure 4, in which the top five most significant enriched pathways were stilbenoid, diarylheptanoid, and gingerol biosynthesis; fatty acid elongation in mitochondria; fructose and mannose metabolism; phenylpropanoid biosynthesis; and phenylalanine metabolism (Figure 4).

3.6. DEGs Involved in Primary Metabolism

Significant effects of biotic and abiotic stress on the primary metabolism were observed [23,24,25]. In the present study, the starch and sucrose metabolisms as well as the fatty acid metabolism were altered in C. viniferum-infected grapes (Supplementary Table S8). The activity of beta-glucosidase (VIT_01s0011g00760), acid beta-fructofuranosidase (VIT_02s0154g00090), and sucrose-phosphate synthase (VIT_18s0089g00410) was down-regulated (Figure 5A), suggesting that the conversion of both polysaccharide and sucrose into glucose was inhibited. However, the activity of pectin esterase (VIT_13s0047g00230 and VIT_15s0048g00510) was enhanced, while the relationship between pectin esterase and pathogen resistance remained complex [26]. All the DEGs (VIT_04s0044g01110, VIT_16s0039g00320, VIT_18s0001g00380, and VIT_18s0001g15410) involved in fatty acid metabolism were up-regulated (Figure 5A), and the DEGs belonged to the alcohol dehydrogenase gene family.

3.7. DEGs Involved in Signal Transduction

In the plant–pathogen interaction, signal transduction plays a crucial role [27]. We detected dynamic changes in genes associated with plant hormone signal transduction, the MAPK cascade, and calcium-mediated signaling (Figure 5B). In plant hormone signal transduction, BRASSINOSTEROID INSENSITIVE 1-associated receptor kinase 1 (VIT_12s0055g01160) and ethylene receptor (VIT_05s0049g00090 and VIT_06s0004g05240) were up-regulated, while auxin-induced genes (VIT_04s0023g03230, VIT_15s0048g02860 and VIT_13s0067g00330) were inhibited (Figure 5B and Supplementary Table S8). In the DEGs of the MAPK cascade, the up-regulated genes were mitogen-activated protein kinase 7 (VIT_04s0023g02420), LRR receptor-like serine/threonine-protein kinase (VIT_17s0000g06710), and receptor-like protein kinase 5 (VIT_11s0016g03080), whereas the down-regulated genes were receptor-like cytosolic serine/threonine-protein kinase RBK1 (VIT_00s0768g00040) and cysteine-rich receptor-like protein kinase 2 (VIT_04s0079g00020) (Figure 5B and Supplementary Table S8). CBL-interacting protein kinase 08 (VIT_08s0058g01090) was the only DEG in the calcium-mediated signaling pathway (Figure 5B and Supplementary Table S8).

3.8. DEGs Involved in Pathogen-Resistance Genes

We identified four clusters of pathogen-resistance genes, including plant–pathogen interaction, response to biotic stimulus, peroxisome, and cytochrome P450 (Figure 5C, Figure 6 and Supplementary Table S8). In terms of plant–pathogen interaction, several calcium-binding proteins were observed, namely VIT_04s0023g01100, VIT_08s0007g05790, VIT_14s0006g01400, and VIT_18s0122g00180. Additionally, in the terms of response to biotic stimulus, we identified five Mildew Locus O (MLO)-like proteins (VIT_13s0019g04060, VIT_07s0031g02240, VIT_10s0003g00410, VIT_08s0040g02180, and VIT_08s0040g02170) and four pathogenesis-related proteins (VIT_05s0077g01560, VIT_05s0077g01670, VIT_05s0077g01690, and VIT_05s0077g01550). The DEGs (VIT_00s0698g00010 and VIT_04s0044g00020) that belonged to peroxisome were down-regulated during C. viniferum infection, while for VIT_19s0093g00510, it was first up-regulated at 3 dpi and then decreased at 7 dpi. In addition, two cytochrome P450 enzymes (VIT_11s0065g00350 and VIT_11s0078g00290) were up-regulated upon 7 dpi with C. viniferum (Figure 5C, Figure 6 and Supplementary Table S8).

3.9. DEGs Involved in Phenylalanine Metabolism Pathway

As three out of five enriched pathways were related with the phenylalanine metabolism pathway, we filtered DEGs in this pathway, and genes encoding three key enzymes were identified, as shown in Figure 6. The expression profiles of phenylalanine ammonia-lyase genes, stilbene synthase genes, and the UDP-glucose: flavonoid 3-O-glucosyltransferase gene were significantly up-regulated at 7 dpi, while in the early infection stages, little change was observed (Figure 6 and Supplementary Table S8). Nine phenylalanine ammonia-lyase genes were up-regulated, and the number of genes in the phenylalanine ammonia-lyase gene family was thirteen in V. vinifera. In addition, we observed that the synthesis of nine stilbene synthase genes, which catalyzed the resveratrol, a phytoalexin, was up-regulated. Interestingly, anthocyanin accumulation was also positively regulated as the UDP-glucose: flavonoid 3-O-glucosyltransferase gene (VIT_12s0034g00030) was significantly up-regulated (Figure 6).

3.10. Co-Expression Analysis of Differentially Expressed Transcription Factors and Target Functional Genes

After annotating the DEGs, we identified numerous transcription factors that were differentially expressed in C. viniferum-infected grapes. The most important transcription factor genes were WRKY transcription factors. Fourteen WRKY TFs were involved in the infection process. Additionally, the expression patterns of 10 ERF TFs were prominently changed. Moreover, four MYB TFs were found to be up-regulated upon pathogen infection (Supplementary Table S8). To generate an overview of the regulatory network of genes resistant to C. viniferum, the correlation coefficients of all the genes without missing values in this study were calculated using WGCNA (Figure S4), and we obtained the node-to-node interaction relationships of transcript factor genes with their target genes (Figure 7 and Supplementary Table S9). Several WRKY and ERF transcription factors were centered in this co-expression network, surrounded by primary-metabolism-, signal-transduction-, pathogen-resistance-, and phenylalanine-metabolism-related genes (Figure 7).

3.11. Validation of Differentially Expressed Genes

To verify the transcriptomic results, 10 genes, including LRR-RLK (VIT_17s0000g06710), MYB4 (VIT_05s0049g01020), WRKY22 (VIT_15s0046g02190), WRKY31 (VIT_19s0090g00840), WRKY33 (VIT_06s0004g07500), ERF4 (VIT_12s0028g03270), ERF5 (VIT_16s0013g01120), ERF14 (VIT_18s0001g03240), ERF23 (VIT_18s0089g01030), and ERF113 (VIT_01s0150g00120), which were differentially expressed, were analyzed using qRT-PCR. The transcriptome and qRT-PCR results are compared in Figure 8. Most of the selected genes analyzed using qRT-PCR showed an expression profile consistent with the transcriptomic data. Two genes, MYB4 and ERF113, showed inconsistent regulation between the qRT-PCR and transcriptome results (Figure 8). This discrepancy may be attributed to the different sensitivities of the qRT-PCR and transcriptome analytical methods.

4. Discussion

Currently, it has been accepted that 190 Colletotrichum species infect various plants worldwide [28,29]. At least 10 Colletotrichum species have been identified in grape [5,30,31,32,33,34]. In our early study, we identified three pathogens of grape ripe rot in southern China based on multi-gene data and morphology, among which C. viniferum was mainly responsible for cases of ripe rot in Fujian Province and Guizhou Province [35]. Pathogenicity tests revealed that the typical symptoms of ripe rot in V. davidii initially developed 3 days after C. viniferum infection, and then, the spots grew larger and were surrounded by narrow, reddish-brown to black margins at 7 dpi (Figure 1), which was also observed in the susceptible V. vinifera cv. Kyoho [35]. This result revealed that C. viniferum was able to infect the resistant cultivar V. davidii.
To determine the resistance mechanism in response to C. viniferum infection in the resistant cultivar, all DEGs at 1 dpi, 3 dpi, and 7 dpi were assessed. Compared with the control, 12 DEGs were identified at 1 dpi during the early phase of infection (Figure 2B). This phenomenon persisted for 3 days, with 22 DEGs being identified. These results were in accordance with the observations that only three transcripts were responsible for powdery mildew fungus infection in Erysiphe necator-resistant V. aestivalis “Norton” [36]. However, 1776 DEGs were involved in the response to C. viniferum infection at the 7-dpi stage. Diverse defense-related genes and functional pathways have been enriched in response to Colletotrichum infection in grape, lentil, bean, tea and chili pepper [37,38,39,40,41]. Based on our GO analysis, these DEGs were enriched in 42 (28 up-regulated genes/14 down-regulated genes) terms, including 5 (2 up-regulated genes/3 down-regulated) biological process, 2 (2 up-regulated genes/0 down-regulated) cellular components, and 35 (24 up-regulated genes/11 down-regulated) molecular functions (Figure 3). In total, 28 up-regulated GO categories participated in signal transduction, and 14 down-regulated GO categories were repressed in catalytic activity. Furthermore, these DEGs were enriched in 20 functional pathways, including stilbenoid, diarylheptanoid, and gingerol biosynthesis; plant–pathogen interaction; and plant hormone signal transduction, which were involved in the defense against C. viniferum infection. The overall changes in C. viniferum-induced gene expression were consistent with the phenotype in berries, indicating that defense-oriented transcriptional modifications are triggered late in the infection process in resistant grapes.
It was revealed that the carbohydrate and fatty acid metabolisms are important in disease resistance [41,42,43]. Four out of sixteen DEGs involved in the starch and sucrose metabolisms were up-regulated in order to prevent the degradation of pectin, hence enhancing plant disease resistance [44] (Figure 5). As signaling molecules, an increase in the levels of these sugars may contribute to plant immunity [42,45]. After invading plant cells, pathogenic fungi are able to exploit the plant’s fatty acid production system to enhance infection [43]. Interestingly, four DEGs implicated in fatty acid biosynthesis initiation were increased in response to Colletotrichum infection (Figure 5). However, the role of fatty acids in the grape–Colletotrichum interaction is still unknown. Secondary metabolites derived from phenylpropanoids are used in antimicrobial compounds to improve plant disease resistance [46,47,48]. In this study, the expression levels of nine phenylalanine ammonia-lyase (PAL) and two trans-cinnamate 4-monooxygenase (Cytochrome P450 family) genes were up-regulated to participate in phenylalanine metabolism and phenylpropanoid biosynthesis (Figure 6). Nine stilbene synthase (STS) genes were significantly increased in response to C. viniferum infection at 7 dpi. These findings revealed that the stilbene biosynthetic pathway was implicated in the defense against ripe rot in the resistant cultivar, which was consistent with the rapid accumulation of stilbenes in response to downy mildew in grapevines [49,50].
MAPK cascades and Ca2+ signaling pathways are meditated by the R gene, which activates the expression of PCD-related genes to initiate defense against C. fructicola in tea plants [41]. In our study, one receptor-like protein kinase 5, one LRR receptor-like serine/threonine-protein kinase, one mitogen-activated protein kinase 7 (MAPK7), and one CBL-interacting protein kinase 08 were induced by C. viniferum (Figure 5B). MAPK cascades and Ca2+ signaling may also be the most important defensive signaling pathways in grapes regarding the activation of the downstream defense response against pathogen invasion [51,52]. Interestingly, DEGs implicated in biotic stimulus and plant–pathogen interaction were enriched (Figure 5C). Two DEGs encoding PR10.3 and one encoding PR10.8 were up-regulated by more than ten-fold relative to the control. These PR proteins may have a role in plant defense against Colletotrichum infection. Moreover, plant hormones may play a role in plant defense against ripe rot (Figure 5B). One gene encoding ethylene receptor 2 protein was up-regulated by more than 2-fold, indicating that ethylene signaling was involved in the regulation of both berry maturation and plant defensive responses [52].
The analysis of the expression of the ripe-rot-resistance-related DEGs and transcription factor genes (TFs) may shed light on how plants recruit “guards” to activate defensive responses. The construction of a co-expression network between the selected DEGs revealed considerable positive connections between transcription factors and genes involved in primary and secondary metabolites, signal transduction, biotic stimulation, and plant–pathogen interaction (Figure 7). Three types of TFs (including eight WRKYs, five ERFs, and two MYBs) were identified as co-expressing within and between other DEGs. For example, WRKY65 shared strong positive correlations with ERF98, MYB24, WRKY17, WRKY40, and WRKY69, and these TFs were also co-expressed with five PALs, nine STSs, and two PR proteins. Consistent with the reports by Wong and Matus [53] and Vannozzi et al. [54], multi-TFs may regulate these genes involved in ripe rot resistance. Our data are novel in suggesting the regulatory roles of multi-TF families in phytoalexin synthesis and PR protein expression to enhance resistance to grape ripe rot. More research is needed in the future to clarify these functions.

5. Conclusions

Grapes have evolved a sophisticated defensive system to combat numerous pathogens. Colletotrichum appressoria was unable to penetrate the cells of berries of the resistant material V. davidii during the early stage of infection. However, late in the infection process, appressoria invaded plant cells. Several biological processes were drastically altered in berries infected with Colletotrichum. Colletotrichum produced a variety of virulence factors and triggered signaling pathways, such as MAPK cascades and Ca2+ signaling. The activated WRKY-, ERF-, and MYB-type TFs directly regulated the expression of genes involved in primary and secondary metabolites, biotic stimulus, and plant–pathogen interaction. Subsequently, the production of stilbene phytoalexin and the expression of PR protein enhanced the resistance to grape ripe rot (Figure 9). The precise and efficient defensive responses inhibited the growth of grape ripe rot.

Supplementary Materials

The following supporting information can be downloaded at: https://www.mdpi.com/article/10.3390/horticulturae8090843/s1, Table S1: Primers for qRT-PCR test; Table S2: Expression value of all genes in Vitis davidii Föex berries incubated with Colletotrichum viniferum; Table S3: Differentially expressed genes between 1 dpi with control of Vitis davidii Föex berries incubated with Colletotrichum viniferum; Table S4: Differentially expressed genes between 3 dpi with control of Vitis davidii Föex berries incubated with Colletotrichum viniferum; Table S5: Differentially expressed genes between 7 dpi with control of Vitis davidii Föex berries incubated with Colletotrichum viniferum; Table S6: GO ontology terms of differentially expressed genes between 7 dpi with control of Vitis davidii Föex berries incubated with Colletotrichum viniferum; Table S7: KEGG pathway enrichment of differentially expressed genes between 7 dpi with control of Vitis davidii Föex berries incubated with Colletotrichum viniferum; Table S8: List of pathogen-resistant and metabolism-related genes in differentially expressed gene datasets; Table S9: Co-expression network of transcript factor genes with their target genes in Vitis davidii Föex berries incubated with Colletotrichum viniferum; Figure S1: Symptom development in cv. Kyoho (Vitis vinifera × Vitis labrusca) berries upon pathogen attack, (A) Uninfected berries at day zero were used as control samples (CK), an inoculation was made at day zero, and the berries were subsequently analyzed at 1 day, 3 days, and 7 days post inoculation (dpi). (B) Typical symptoms of berries. Arrows represent inoculation sites; Figure S2: Gene ontology of up-regulated genes of Vitis davidii Föex berries infected with Colletotrichum viniferum at 7 dpi. (A) Biological process, (B) cellular component, (C) molecular function; Figure S3: Gene ontology of down-regulated genes of Vitis davidii Föex berries infected with Colletotrichum viniferum at 7 dpi. (A) Biological process, (B) cellular component, (C) molecular function; Figure S4: Cluster dendrogram of DEGs in Vitis davidii Föex berries incubated with Colletotrichum viniferum. Each color represents a certain gene module.

Author Contributions

Q.C. conceived the research; Y.L. and X.Y. performed the study and analyzed the data; T.C., Y.Y., X.L. and X.T. helped prepare the plant and pathogen materials; Y.L. wrote the manuscript. All authors have read and agreed to the published version of the manuscript.

Funding

Our study was supported by the earmarked fund for CARS (CARS-29), the Natural Science Foundation of Fujian Province (2020J011362), the Seed Industry Innovation and Industrialization Project of Fujian Province (zycxny2021010-4), the Collaborative Innovation Project from the People’s Government of Fujian Province & Chinese Academy of Agricultural Sciences (XTCXGC2021006), and the Science and Technology Innovation Team of Fujian Academy of Agricultural Sciences (CXTD2021009-2).

Institutional Review Board Statement

Not applicable.

Informed Consent Statement

Not applicable.

Data Availability Statement

The data presented in this study are available in the article and Supplementary Materials.

Conflicts of Interest

The authors declare no conflict of interest.

References

  1. Welke, J.E. Fungal and mycotoxin problems in grape juice and wine industries. Curr. Opin. Food Sci. 2019, 29, 7–13. [Google Scholar] [CrossRef]
  2. Oo, M.M.; Oh, S. Identification and characterization of new record of grape ripe rot disease caused by Colletotrichum viniferum in Korea. Mycobiology 2017, 45, 421–425. [Google Scholar] [CrossRef] [PubMed]
  3. Cosseboom, S.D.; Hu, M. Predicting Ripe Rot of Grape, Caused by Colletotrichum fioriniae, with Leaf Wetness, Temperature, and the Crop Growth. PhytoFrontiers 2022. [Google Scholar] [CrossRef]
  4. Whitelawweckert, M.A.; Curtin, S.J.; Huang, R.; Steel, C.; Blanchard, C.; Roffey, P. Phylogenetic relationships and pathogenicity of Colletotrichum acutatum isolates from grape in subtropical Australia. Plant Pathol. 2007, 56, 448–463. [Google Scholar] [CrossRef]
  5. Dou, M.; Hao, Y.; Yang, J.; Yuan, X.; Yin, X.; Jiao, Y.; Zhao, J.; Chen, T.; Wang, Y.; Xu, Y. Genome Sequence Resource for Colletotrichum viniferum, the cause of grapevine ripe rot in China. Mol. Plant-Microbe Interact. 2022, 35, 90–93. [Google Scholar] [CrossRef]
  6. Sadoughi, N. Effect of Ripe Rot of Grapes (Colletotrichum spp.) on the Chemical Composition and Off-Flavour Compounds in Grapes and Wine. Ph.D. Dissertation, Charles Sturt University, Bathurst, Australia, 2016. [Google Scholar]
  7. Ji, T.; Salotti, I.; Dong, C.; Li, M.; Rossi, V. Modeling the effects of the environment and the host plant on the ripe rot of grapes, caused by the Colletotrichum species. Plants 2021, 10, 2288. [Google Scholar] [CrossRef]
  8. Shiraishi, M.; Koide, M.; Itamura, H.; Yamada, M.; Mitani, N.; Ueno, T.; Nakaune, R.; Nakano, M. Screening for resistance to ripe rot caused by Colletotrichum acutatum in grape germplasm. Vitis 2007, 46, 196–201. [Google Scholar]
  9. Fu, P.; Tian, Q.; Lai, G.; Li, R.; Song, S.; Lu, J. Cgr1, a ripe rot resistance QTL in Vitis amurensis ‘Shuang Hong’ grapevine. Hortic. Res. 2019, 6, 67. [Google Scholar] [CrossRef]
  10. Reid, K.E.; Olsson, N.; Schlosser, J.; Peng, F.Y.; Lund, S.T. An optimized grapevine RNA isolation procedure and statistical determination of reference genes for real-time RT-PCR during berry development. BMC Plant Biol. 2006, 6, 27. [Google Scholar] [CrossRef]
  11. Trapnell, C.; Pachter, L.; Salzberg, S.L. TopHat: Discovering splice junctions with RNA-Seq. Bioinformatics 2009, 25, 1105–1111. [Google Scholar] [CrossRef]
  12. Jaillon, O.; Aury, J.; Noel, B.; Policriti, A.; Clepet, C.; Casagrande, A.; Choisne, N.; Aubourg, S.; Vitulo, N.; Jubin, C.; et al. The grapevine genome sequence suggests ancestral hexaploidization in major angiosperm phyla. Nature 2007, 449, 463–467. [Google Scholar] [CrossRef] [PubMed] [Green Version]
  13. Mortazavi, A.; Williams, B.A.; Mccue, K.; Schaeffer, L.; Wold, B.J. Mapping and quantifying mammalian transcriptomes by RNA-Seq. Nat. Methods 2008, 5, 621–628. [Google Scholar] [CrossRef] [PubMed]
  14. Conesa, A.; Gotz, S. Blast2GO: A comprehensive suite for functional analysis in plant genomics. Int. J. Plant Genom. 2008, 2008, 619832. [Google Scholar] [CrossRef] [PubMed]
  15. Robinson, M.D.; Mccarthy, D.J.; Smyth, G.K. edgeR: A Bioconductor package for differential expression analysis of digital gene expression data. Bioinformatics 2010, 26, 139–140. [Google Scholar] [CrossRef]
  16. Anders, S.; Huber, W. Differential expression analysis for sequence count data. Genome Biol. 2010, 11, 1–12. [Google Scholar] [CrossRef]
  17. Benjamini, Y.; Hochberg, Y. Controlling the false discovery rate: A practical and powerful approach to multiple testing. J. R. Stat. Soc. B 1995, 57, 289–300. [Google Scholar] [CrossRef]
  18. Du, Z.; Zhou, X.; Ling, Y.; Zhang, Z.; Su, Z. agriGO: A GO analysis toolkit for the agricultural community. Nucleic Acids Res. 2010, 38, W64–W70. [Google Scholar] [CrossRef]
  19. Kotera, M.; Hirakawa, M.; Tokimatsu, T.; Goto, S.; Kanehisa, M. The KEGG databases and tools facilitating omics analysis: Latest developments involving human diseases and pharmaceuticals. Methods Mol. Biol. 2012, 802, 19–39. [Google Scholar] [CrossRef]
  20. Langfelder, P.; Horvath, S. WGCNA: An R package for weighted correlation network analysis. BMC Bioinform. 2008, 9, 559. [Google Scholar] [CrossRef]
  21. Shannon, P.; Markiel, A.; Ozier, O.; Baliga, N.S.; Wang, J.T.; Ramage, D.; Amin, N.; Schwikowski, B.; Ideker, T. Cytoscape: A software environment for integrated models of biomolecular interaction networks. Genome Res. 2003, 13, 2498–2504. [Google Scholar] [CrossRef]
  22. Livak, K.J.; Schmittgen, T.D. Analysis of relative gene expression data using real-time quantitative PCR and the 2(-Delta Delta C(T)) method. Methods 2001, 25, 402–408. [Google Scholar] [CrossRef] [PubMed]
  23. Sudheeran, P.K.; Sela, N.; Carmeli-Weissberg, M.; Ovadia, R.; Panda, S.; Feygenberg, O.; Maurer, D.; Oren-Shamir, M.; Aharoni, A.; Alkan, N. Induced defense response in red mango fruit against Colletotrichum gloeosporioides. Hortic. Res. 2021, 8, 17. [Google Scholar] [CrossRef] [PubMed]
  24. Li, X.; Wu, J.; Yin, L.; Zhang, Y.; Qu, J.; Lu, J. Comparative transcriptome analysis reveals defense-related genes and pathways against downy mildew in Vitis amurensis grapevine. Plant Physiol. Biochem. 2015, 95, 1–14. [Google Scholar] [CrossRef] [PubMed]
  25. Xu, W.; Li, R.; Zhang, N.; Ma, F.; Jiao, Y.; Wang, Z. Transcriptome profiling of Vitis amurensis, an extremely cold-tolerant Chinese wild Vitis species, reveals candidate genes and events that potentially connected to cold stress. Plant Mol. Biol. 2014, 86, 527–541. [Google Scholar] [CrossRef]
  26. Marzin, S.; Hanemann, A.; Sharma, S.; Hensel, G.; Kumlehn, J.; Schweizer, G.; Roder, M.S. Are PECTIN ESTERASE INHIBITOR genes involved in mediating resistance to rhynchosporium commune in barley. PLoS ONE 2016, 11, e0150485. [Google Scholar] [CrossRef]
  27. Baker, B.; Zambryski, P.; Staskawicz, B.J.; Dineshkumar, S.P. Signaling in plant-microbe interactions. Science 1997, 276, 726–733. [Google Scholar] [CrossRef]
  28. Freeman, S.; Katan, T.; Shabi, E. Characterization of Colletotrichum species responsible for anthracnose diseases of various fruits. Plant Dis. 1998, 82, 596–605. [Google Scholar] [CrossRef]
  29. Jayawardena, R.S.; Hyde, K.D.; Damm, U.; Cai, L.; Liu, M.; Li, X.; Zhang, W.; Zhao, W.; Yan, J.Y. Notes on currently accepted species of Colletotrichum. Mycosphere 2016, 7, 1192–1260. [Google Scholar] [CrossRef]
  30. Hong, S.; Kim, W.; Yun, H.; Choi, K. Morphological variations, genetic diversity and pathogenicity of Colletotrichum species causing grape ripe rot in Korea. Plant Pathol. J. 2008, 24, 269–278. [Google Scholar] [CrossRef]
  31. Echeverrigaray, S.; Scariot, F.J.; Fontanella, G.; Favaron, F.; Sella, L.; Santos, M.C.; Schwambach, J.; Pedrotti, C.; Delamare, A.P. Colletotrichum species causing grape ripe rot disease in Vitis labrusca and V. vinifera varieties in the highlands of southern Brazil. Plant Pathol. 2020, 69, 1504–1512. [Google Scholar] [CrossRef]
  32. Yan, J.; Jayawardena, M.M.R.S.; Goonasekara, I.D.; Wang, Y.; Zhang, W.; Liu, M.; Huang, J.; Wangm, Z.; Shang, J.; Peng, Y. Diverse species of Colletotrichum associated with grapevine anthracnose in China. Fungal Divers. 2014, 71, 233–246. [Google Scholar] [CrossRef]
  33. Kim, J.S.; Hassan, O.; Chang, T. First report of Colletotrichum aenigma causing anthracnose of grape in Korea. Plant Dis. 2021, 105, 2729. [Google Scholar] [CrossRef] [PubMed]
  34. Sawant, I.S.; Wadkar, P.N.; Rajguru, Y.R.; Mhaske, N.H.; Salunkhe, V.P.; Sawant, S.D.; Upadhyay, A. Biocontrol potential of two novel grapevine associated Bacillus strains for management of anthracnose disease caused by Colletotrichum gloeosporioides. Biocontrol. Sci. Technol. 2016, 26, 964–979. [Google Scholar] [CrossRef]
  35. Lei, Y.; Tang, X.B.; Jayawardena, R.S.; Yan, J.Y.; Wang, X.D.; Liu, M.; Chen, T.; Liu, X.M.; Wang, J.C.; Chen, Q.X. Identification and characterization of Colletotrichum species causing grape ripe rot in southern China. Mycosphere 2016, 7, 1177–1191. [Google Scholar] [CrossRef]
  36. Fung, R.W.M.; Gonzalo, M.; Fekete, C.; Kovacs, L.; He, Y.; Marsh, E.L.; Mcintyre, L.M.; Schachtman, D.P.; Qiu, W. Powdery mildew induces defense-oriented reprogramming of the transcriptome in a susceptible but not in a resistant grapevine. Plant Physiol. 2007, 146, 236–249. [Google Scholar] [CrossRef]
  37. Bhadauria, V.; Bett, K.E.; Zhou, T.; Vandenberg, A.; Wei, Y.; Banniza, S. Identification of Lens culinaris defense genes responsive to the anthracnose pathogen Colletotrichum truncatum. BMC Genet. 2013, 14, 31. [Google Scholar] [CrossRef]
  38. Padder, B.A.; Kamfwa, K.; Awale, H.; Kelly, J.D. Transcriptome profiling of the phaseolus vulgaris-Colletotrichum lindemuthianum pathosystem. PLoS ONE 2016, 11, e0165823. [Google Scholar] [CrossRef]
  39. Wang, L.; Wang, Y.; Cao, H.; Hao, X.; Zeng, J.; Yang, Y.; Wang, X. Transcriptome analysis of an anthracnose-resistant tea plant cultivar reveals genes associated with resistance to Colletotrichum camelliae. PLoS ONE 2016, 11, e0148535. [Google Scholar] [CrossRef]
  40. Mishra, R.; Nanda, S.; Rout, E.; Chand, S.K.; Mohanty, J.N.; Joshi, R.K. Differential expression of defense-related genes in chilli pepper infected with anthracnose pathogen Colletotrichum truncatum. Physiol. Mol. Plant Pathol. 2017, 97, 1–10. [Google Scholar] [CrossRef]
  41. Wang, Y.; Hao, X.; Lu, Q.; Wang, L.; Qian, W.; Li, N.; Ding, C.; Wang, X.; Yang, Y. Transcriptional analysis and histochemistry reveal that hypersensitive cell death and H2O2 have crucial roles in the resistance of tea plant (Camellia sinensis (L.) O. Kuntze) to anthracnose. Hortic. Res. 2018, 5, 18. [Google Scholar] [CrossRef]
  42. Trouvelot, S.; Heloir, M.; Poinssot, B.; Gauthier, A.; Paris, F.; Guillier, C.; Combier, M.; Trda, L.; Daire, X.; Adrian, M. Carbohydrates in plant immunity and plant protection: Roles and potential application as foliar sprays. Front. Plant Sci. 2014, 5, 592. [Google Scholar] [CrossRef] [PubMed] [Green Version]
  43. Jiang, Y.; Wang, W.; Xie, Q.; Liu, N.; Liu, L.; Wang, D.; Zhang, X.; Yang, C.; Chen, X.; Tang, D. Plants transfer lipids to sustain colonization by mutualistic mycorrhizal and parasitic fungi. Science 2017, 356, 1172–1175. [Google Scholar] [CrossRef] [PubMed]
  44. Lionetti, V.; Cervone, F.; Bellincampi, D. Methyl esterification of pectin plays a role during plant–pathogen interactions and affects plant resistance to diseases. J. Plant Physiol. 2012, 169, 1623–1630. [Google Scholar] [CrossRef] [PubMed]
  45. Mao, J.; Li, W.; Mi, B.; Ma, Z.; Dawuda, M.M.; Zuo, C.; Zhang, Y.; Jiang, X.; Chen, B. Transcriptome analysis revealed glucose application affects plant hormone signal transduction pathway in “Red Globe” grape plantlets. Plant Growth Regul. 2018, 84, 45–56. [Google Scholar] [CrossRef]
  46. Dixon, R.A.; Paiva, N.L. Stress-induced phenylpropanoid metabolism. Plant Cell 1995, 7, 1085–1097. [Google Scholar] [CrossRef]
  47. Patel, R.R.; Patel, D.D.; Bhatt, J.; Thakor, P.; Triplett, L.R.; Thakkar, V.R. Induction of pre-chorismate, jasmonate and salicylate pathways by Burkholderia sp. RR18 in peanut seedlings. J. Appl. Microbiol. 2021, 131, 1417–1430. [Google Scholar] [CrossRef]
  48. Dixon, R.A. Natural products and plant disease resistance. Nature 2001, 411, 843–847. [Google Scholar] [CrossRef]
  49. Ahuja, I.; Kissen, R.; Bones, A.M. Phytoalexins in defense against pathogens. Trends Plant Sci. 2012, 17, 73–90. [Google Scholar] [CrossRef]
  50. Ciaffi, M.; Paolacci, A.R.; Paolocci, M.; Alicandri, E.; Bigini, V.; Badiani, M.; Muganu, M. Transcriptional regulation of stilbene synthases in grapevine germplasm differentially susceptible to downy mildew. BMC Plant Biol. 2019, 19, 404. [Google Scholar] [CrossRef]
  51. Meng, X.; Zhang, S. MAPK cascades in plant disease resistance signaling. Annu. Rev. Phytopathol. 2013, 51, 245–266. [Google Scholar] [CrossRef]
  52. Guo, W.W.; Jin, L.; Miao, Y.; He, X.; Hu, Q.; Guo, K.; Zhu, L.; Zhang, X. An ethylene response-related factor, GbERF1-like, from Gossypium barbadense improves resistance to Verticillium dahliae via activating lignin synthesis. Plant Mol. Biol. 2016, 91, 305–318. [Google Scholar] [CrossRef] [PubMed]
  53. Wong, D.C.J.; Matus, J.T. Constructing integrated networks for identifying new secondary metabolic pathway regulators in grapevine: Recent applications and future opportunities. Front. Plant Sci. 2017, 8, 1–8. [Google Scholar] [CrossRef] [PubMed]
  54. Vannozzi, A.; Wong, D.C.J.; Holl, J.; Hmmam, I.; Matus, J.T.; Bogs, J.; Ziegler, T.; Dry, I.B.; Barcaccia, G.; Lucchin, M. Combinatorial regulation of stilbene synthase genes by WRKY and MYB transcription factors in grapevine (Vitis vinifera L.). Plant Cell Physiol. 2018, 59, 1043–1059. [Google Scholar] [CrossRef] [PubMed]
Figure 1. Symptom development in Vitis davidii Föex berries upon pathogen attack. (A) Uninfected berries at day zero were used as control samples (CK), an inoculation was made at day zero, and the berries were subsequently analyzed at 1 day, 3 days, and 7 days post inoculation (dpi). (B) Typical symptoms of berries. Arrows represent inoculation sites.
Horticulturae 08 00843 g001
Figure 2. DEGs of different incubation time points of Vitis davidii Föex berries. (A) Venn diagram analysis of gene expression at different incubation time points. (B) Number of different gene expressions at different incubation time points. Orange bar represents up-regulated genes; blue bar represents down-regulated genes.
Horticulturae 08 00843 g002
Figure 3. GO enrichment of DEGs of Vitis davidii Föex berries with Colletotrichum viniferum infection at 7 dpi. (A) GO enrichment of up-regulated genes; (B) GO enrichment of down-regulated genes.
Horticulturae 08 00843 g003
Figure 4. KEGG pathways of differentially expressed genes of Vitis davidi Föex berries infected with Colletotrichum viniferum at 7 dpi.
Horticulturae 08 00843 g004
Figure 5. Differentially expressed genes in different pathways. (A) Expression profiles of primary metabolism genes in Vitis davidii Föex berries infected with Colletotrichum viniferum. (B) Expression profiles of signal transduction genes in Vitis davidii Föex berries infected with Colletotrichum viniferum. (C) Expression profiles of pathogen-resistance genes in Vitis davidii Föex berries infected with Colletotrichum viniferum. Heat maps of genes were constructed with transcriptome quantitative data. The genes that increased and decreased are displayed in red and blue, respectively.
Horticulturae 08 00843 g005
Figure 6. Differentially expressed genes in phenylalanine metabolism pathway that promote stilbene and anthocyanin accumulation in Vitis davidii Föex berries incubated with Colletotrichum viniferum. PAL, phenylalanine ammonia-lyase; STS, stilbene synthase; UFGT, UDP-glucose: flavonoid 3-O-glucosyltransferase. Heat maps of genes were constructed with transcriptome quantitative data. The genes that increased and decreased are displayed in red and blue, respectively.
Horticulturae 08 00843 g006
Figure 7. Co-expression network of transcript factor genes with their target genes in Vitis davidii Föex berries incubated with Colletotrichum viniferum.
Horticulturae 08 00843 g007
Figure 8. Validation and expression analysis of 10 genes in response to Colletotrichum viniferum. Gene expression analysis was carried out with qRT-PCR using cDNA from berries of Vitis davidii Föex after Colletotrichum viniferum inoculation for different lengths of time. Color panels above the bars symbolize log2-transformed mean expression values obtained in the RNA-seq (see reference color bar). All data are shown as the mean ± SD (n = 3).
Horticulturae 08 00843 g008
Figure 9. Model of the Colletotrichum viniferum recognition signal transduction pathway.
Horticulturae 08 00843 g009
Table 1. Statistics of RNA-seq data of Vitis davidii Föex berries incubated with Colletotrichum viniferum.
SampleClean Data (bp)Q30 (%)All Reads NumUnique Mapped ReadsMapping Ratio
CK-14,018,242,90094.71%26,705,70021,281,48986.92%
CK-23,243,124,80092.76%21,536,26816,703,12484.22%
CK-33,717,704,10092.20%24,716,63819,629,62285.51%
1 dpi-14,110,842,40092.49%27,270,04021,660,48386.46%
1 dpi-23,827,514,00092.69%25,395,46419,739,44384.27%
1 dpi-33,105,880,50092.77%20,600,18215,925,78183.94%
3 dpi-13,842,454,60094.52%25,584,84420,578,57887.13%
3 dpi-23,693,470,40092.63%24,576,84019,248,68485.01%
3 dpi-34,030,943,70092.71%26,802,66621,077,49385.21%
7 dpi-13,517,864,80092.85%23,405,35217,628,14782.03%
7 dpi-23,743,716,20092.99%24,914,15018,468,16380.75%
7 dpi-34,558,513,20094.94%30,292,85621,269,28875.81%
Note: Uninfected berries at day zero were used as control samples (CK).
Publisher’s Note: MDPI stays neutral with regard to jurisdictional claims in published maps and institutional affiliations.

