1. Introduction
Tomatoes are high in trace elements and vitamins and rich in a variety of functions, and their flesh has a pleasant flavor with a sour and sweet taste. They can be consumed raw or cooked. Eating tomatoes not only quenches thirst and appetite but also helps prevent cancer and lower blood pressure and lipid levels, and it has a special effect on hemophilia [
1]. Tomato acreage has gradually increased in recent years as countries have emphasized agricultural production to achieve high quality and high production levels of projects, but the temperature and humidity of the growth environment directly impact tomato yield. Therefore, the tomato is easily infected with diseases due to poor management in the growth process [
2], which seriously affects its yield and quality. To date, there have been many studies on the rapid detection of tomato fruit quality, but this can only be used for the classification of tomatoes; in order to improve the yield and quality, it is necessary to assess tomatoes at the seedling stage. The detection of tomato growth status is still in the stage of eye observation, and there are many problems with such intuitive observation, such as color differences and relatively subjective judgment, which cause certain errors. Therefore, the method of visual observation is inaccurate and unsuitable for large-scale monitoring and management. To achieve a high yield and high quality of tomatoes, technology is urgently needed to detect the growth of tomatoes under abiotic and biotic stress conditions while minimizing the damage to tomatoes and to take effective measures to improve the growth state of tomato in time [
3,
4,
5].
Spectral technology is a rapid, effective, and minimally damaging technology for measuring objects. Several researchers around the world have applied different spectral technologies to the detection of a variety of agricultural and sideline products [
6]. Sankaran used fluorescence spectroscopy to identify healthy citrus leaves and leaves suffering from yellow dragon disease. The collected data were analyzed by the decision tree model, and the accuracy reached 97% after analysis [
7]. Römera used fluorescence spectroscopy to detect healthy wheat leaves and leaves with leaf rust disease. After piecewise fitting of the spectral data with a fourth-order polynomial, a support vector machine (SVM) was used to establish the model. The established model was tested by the cross-validation method, and the accuracy of the model was 93% [
8]. Ranulfi used fluorescence spectroscopy combined with PLSR (partial least squares regression) to detect Huanglongbing(HLB) and citrus variegated chlorosis(CVC). The detection system could distinguish four types of leaves: healthy, HLB asymptomatic, HLB symptomatic, and CVC symptomatic. The accuracy of the test system reached more than 90% [
9]. Piotr Baranowski used hyperspectral technology to detect apple bruises. They analyzed the hyperspectral images of VNIR and SWIR bands with the principal component analysis method and combined the analysis with MNF transformation to establish a model that could distinguish bruised tissues from sound tissues and detect bruises of different depths; the detection accuracy was good, up to 93% [
5]. By applying the PLS algorithm to the hyperspectral estimation of pigment content in the processing of tomato powdery mildew, Yin found characteristic bands after hyperspectral determination and processing of the data and established a new optimal pigment content estimation model, which was of great practical value [
10].
By understanding the current status of domestic and international research, we found that hyperspectral techniques and fluorescence spectroscopy are relatively limited regarding the types of samples and growth periods they can detect. Most hyperspectral image techniques used for tomato detection are qualitative, and few are quantitative; additionally, laser-induced fluorescence spectroscopy has not been applied to tomato detection. Tomato plants contain high levels of chlorophyll needed for photosynthesis when exposed to light. The greenness value can indicate the chlorophyll content of the plant, and the photosynthetic rate can assess the intensity of photosynthesis in the plant. Therefore, in the same environment, the greenness value and the photosynthetic rate can reflect the growth of tomatoes [
11,
12,
13]. Because tomato leaves contain chlorophyll, the leaves can produce fluorescence when exposed to laser irradiation. Leaf images obtained using hyperspectral imaging technology contain the leaves’ external information as well as their spectral information [
14]. Therefore, correlation equations were established by fluorescence spectroscopy, hyperspectral intensity, greenness value content, and photosynthetic rate. Later, the spectral model may be utilized to assess the greenness value content and photosynthetic rate of tomato leaves as well as the growth conditions of tomato plants. This study explored tomato leaves using a laser to excite plant chlorophyll to emit fluorescence and hyperspectral imaging. A fluorescence spectral model and a hyperspectral model were developed on the basis of the photosynthetic rate and greenness value of the leaves, respectively. The aim was to develop a method to predict the health of tomatoes before they reach maturity from the perspectives of the economy, convenience, and effectiveness; this method will play a guiding role in improving the health of tomatoes.
2. Materials and Methods
2.1. Experimental Apparatus
The products used in the laser-induced fluorescence spectroscopy measurement systems were purchased from Hangzhou SPL Photonics Co., Ltd. (Hangzhou, China). The basic components of this system included a digital display, an adjustable power supply, a laser, a fluorescence spectrum detection bracket, a USB4000 spectrometer, two optical fibers, and a computer. The laser used in this test was the LSR473NL; the excitation wavelength was 473 nm, and the maximum laser output power was 80 mW. It is a type of diode-pumped solid fiber-coupled output laser (FC series) that is widely used at present.
Figure 1 depicts the system’s connectivity diagram. Spectra Suite software (2.0.162, Beijing Journey Chuangtuo Technology Co., LTD, Beijing, China) was used for fluorescence spectral data collection. The software parameters were set as follows: the integration time was 65 ms; the average number was 1; the smoothness was 9; and the built-in processing functions, such as dark noise removal, nonlinearity, and stray light correction, were turned on. The fluorescence spectrum curve of the tomato leaves is shown in
Figure 2. To avoid redundancy caused by a large number of spectral data points, the fluorescence spectrum was differentiated, and then the characteristic band was selected. Finally, the range of 1400–2280 (spectral interval 801.36–633.56 nm) was selected as the band in this study. Finally, a variety of single preprocessing and combined preprocessing techniques were performed on the spectral data of the characteristic band and combined with partial least squares (PLS) regression to establish the model.
A spectrometer (V10E-PS, Beijing Zhuoli Hanguang Instrument Co., LTD, Beijing, China), an adjustable test platform, two light sources, two cameras, image processing equipment, a dark environment device, and a computer comprised the hyperspectral imaging equipment. The wavelength range of the spectrometer was 400–1100 nm, and the resolution was 2.8 nm; the light source consisted of two 150 W halogen lamps; the pixels of the camera were 1392 × 1040 μm; the dark environment device was a 120 × 50 × 140 cm dark box.
The hyperspectral image was collected by Hyper Spectral Image software (ISUZU OPTICS CORP., Taiwan, China) (
Figure 3). HIS (Hyper Spectral Image) Analyzer software was used to correct the original hyperspectral image with a blackboard and a whiteboard, and the spectral data were extracted from the hyperspectral image through ENVI (ENVI 5.3, Exelis Visual Information Solutions Inc., Boulder, CO, USA). HSI Analyzer software was used to calibrate all sample spectral data to obtain the calibrated spectrum of each leaf, and ENVI was used to extract the spectrum interface (
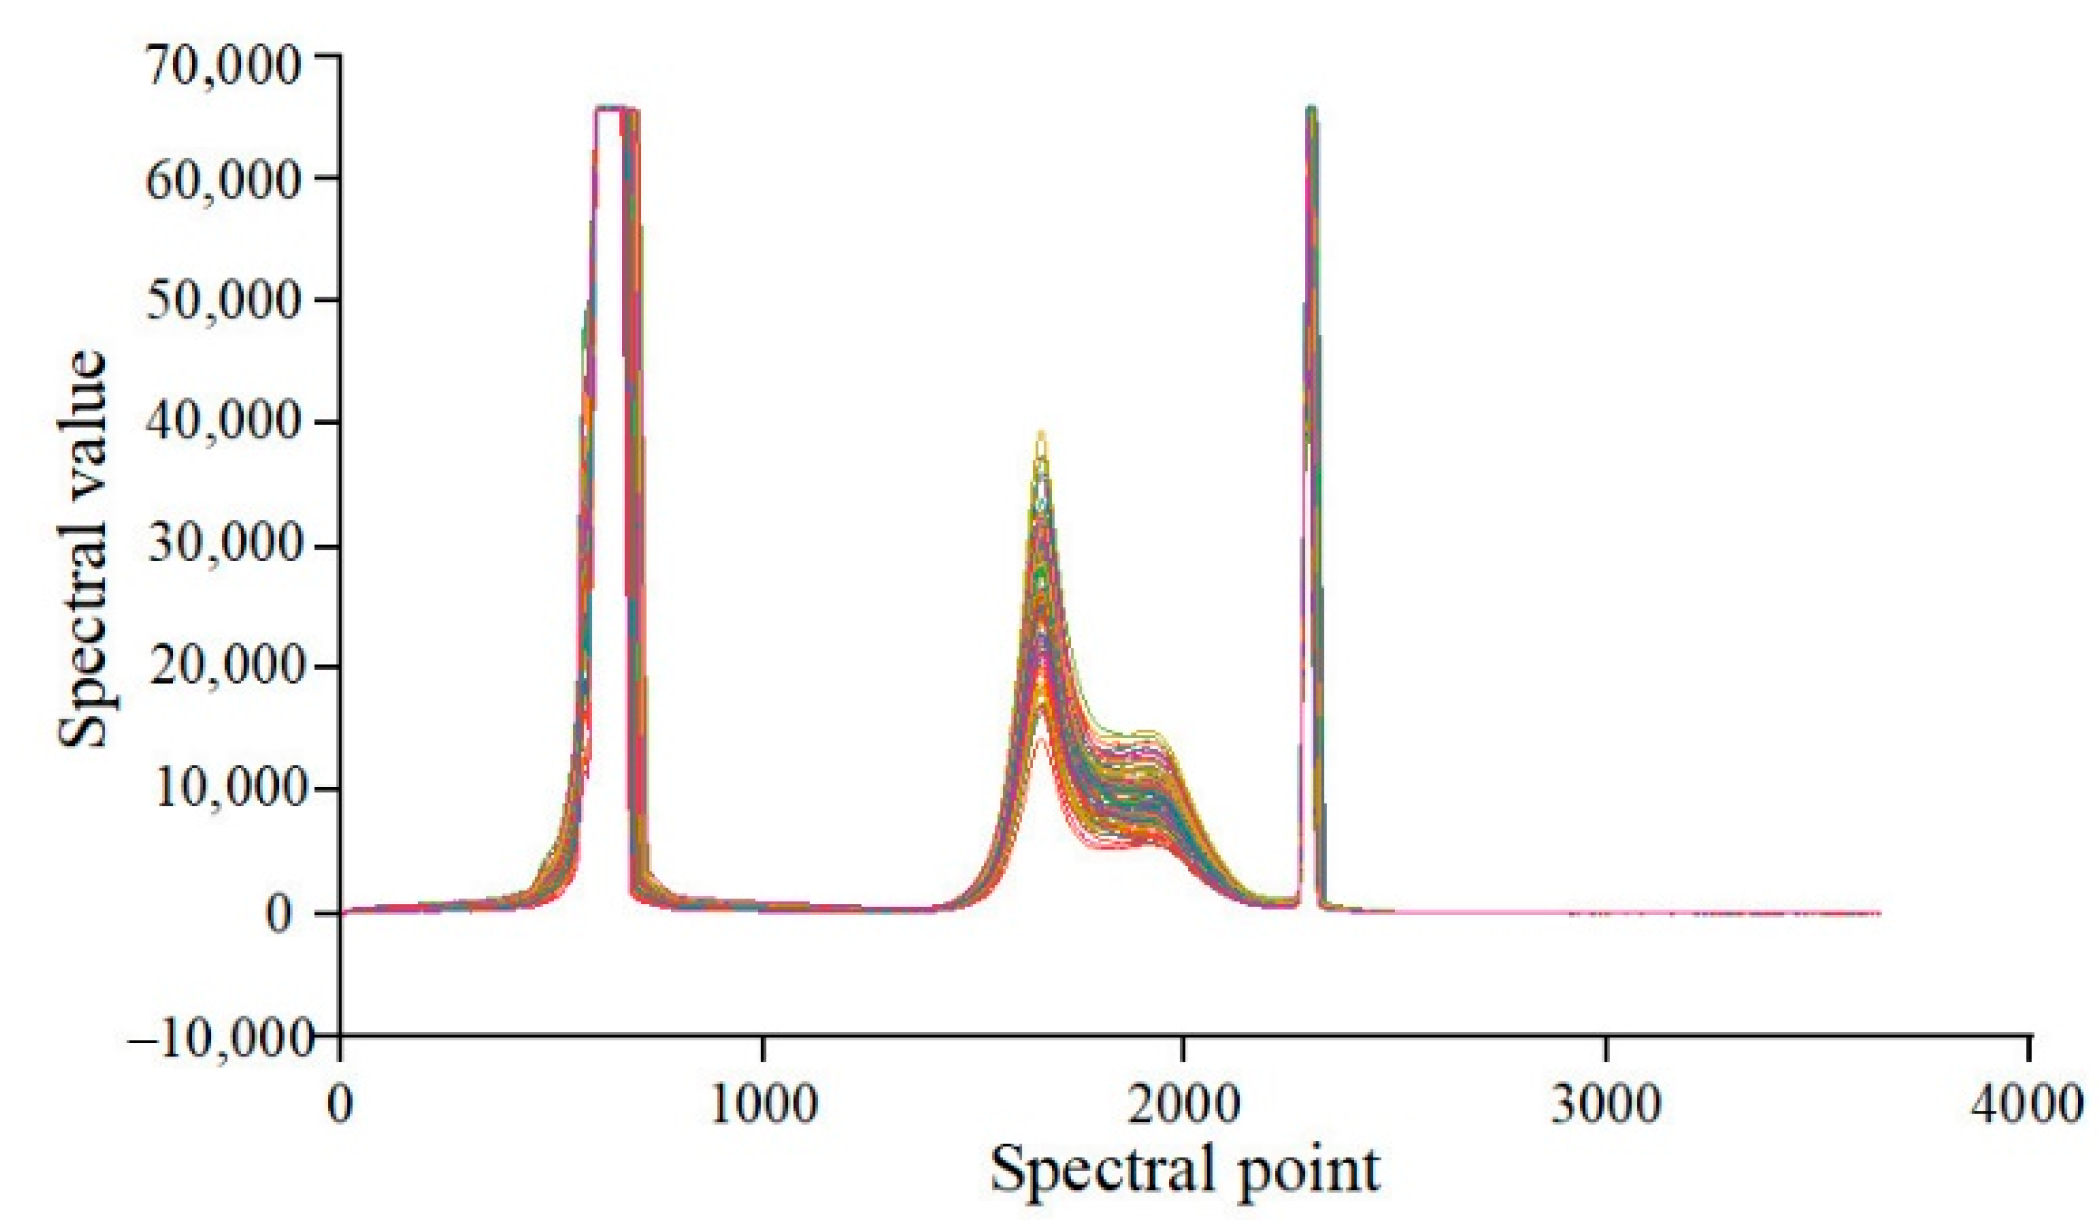
Figure 3). After extracting the spectral data from five distinct areas of each leaf, the average value was calculated. The hyperspectral curve of tomato leaves is shown (
Figure 4). The final spectral range of 509.5671–744.4276 nm was chosen on the basis of characteristic waveband processing. Finally, the prediction model was established by combining preprocessing and PLS regression [
15].
2.2. Preprocessing Methods
The disadvantage of spectral detection is that stray light, noise, and other factors easily interfere with it. In addition to the simple settings applied when collecting the spectrum, preprocessing is an effective way to reduce interference and improve model accuracy. At present, the common spectral preprocessing methods include noise cancellation, optical path correction, and differential preprocessing. Denoising processing mainly consists of Moving Average (MA) and Savitzky–Golay (SG), and optical path correction processing mainly consists of Multiplicative Scatter Correction (MSC), Standard Normal Variate Correction (SNV), and Normalization. Differential processing mainly consists of the first derivative (FD) and second derivative (SD). There are various preprocessing methods, but finding the optimal preprocessing method is the key to improving the accuracy of the model [
16].
2.3. Experimental Materials
The experiment was conducted in Sunlight Greenhouse No. 27, Beishan Base, Shenyang Agricultural University, and the tomato variety used was ‘Liaoyuan Duoli’. The leaves were categorized into five groups with different specifications, with 20 samples in each group and 100 samples in total. Among the three healthy groups and the two infected groups, 66 samples were selected as modeling samples in equal proportions during modeling, and the remaining 34 leaves were used as test set samples. All the samples were numbered in sequence. To ensure the accuracy of sample modeling, the collected tomato leaf samples were put into Ziplock bags and placed in a dark place, and their spectral and greenness information was collected as soon as possible.
2.4. Greenness Value and Photosynthetic Rate Measurement
A CR-400 color difference meter (Konica Minolta Holdings, Inc., Tokyo, Japan) was used to measure the greenness value of the tomato leaves, and the equipped whiteboard was used for calibration. Then, the leaves were laid flat on the white paper of the test bench in an environment at the same temperature, and the probe was aimed at the leaves for measurement. The greenness value out of 5 points was measured, and the average value was used as the final greenness value; the ‘L, a, b’ information of the greenness value was also measured, where ‘a’ represented red and green colors [
17].
An LI-6400 photosynthesis measuring instrument (LI-COR, Lincoln, America) was used to measure the photosynthetic rate of the tomato leaves. Before the measurement, the instrument was preheated for 15–20 min, and after checking the stability of the buffer bottle, the leaf chamber was opened and the living leaves to be measured were clamped. The data were recorded from the display after they stabilized in the normal range, and the average of the five points measured was taken for each leaf.
3. Results and Discussion
3.1. Analysis of Fluorescence Spectroscopy and Hyperspectral Preprocessing Results
The fluorescence spectral data of the characteristic band based on the greenness value and photosynthetic rate were preprocessed, and the evaluation parameters corresponding to each preprocessing method were obtained [
18] (
Table 1). The R
2 after single preprocessing was slightly higher than that of the original data, indicating that these methods were effective for data processing
For the greenness value (a) of the tomato leaves, the model established by the combination of second-order differential and standard normal variable transformation had a relatively large coefficient of determination (R2 = 0.9915), and the two smaller root-mean-square errors were the corrected mean squares. The root-mean-square error of the prediction (RMSEP) value (0.1696) was less than the root-mean-square error of calibration (RMSEC) (0.1743); in the detection of the tomato leaf greenness value (a), the best preprocessing method to obtain fluorescence spectrum data through laser excitation of the leaves was the combination of second-order differential and standard normal variable transformation (SD+SNV).
A series of evaluation indicators for each model was generated after preprocessing and modeling the fluorescence spectrum on the basis of the photosynthesis rate. It was found that the combination of seven-point second-order differential and standard normal transformation (SD+SNV) had the best effect. A large R
2 (0.9868) was obtained, with an RMSEC of 0.2805 and an RMSEP of 0.2781. Although the R
2 after SD+MSC processing was higher, the RMSEP value was relatively large, as was the difference between them. When selecting the best preprocessing method, it is necessary to require a relatively high R
2 and a relatively low RMSEP, and a model with a higher RMSEC relative to RMSEP is preferred; therefore, SD+SNV was determined to be the best preprocessing method [
19].
The hyperspectral data of the characteristic band based on the greenness value and photosynthetic rate were preprocessed, and the evaluation parameters corresponding to each preprocessing method were obtained (
Table 2). The combined preprocessing of FD and MSC was the optimal approach for the greenness value based on the spectral data. The R
2 (0.9790) obtained by this preprocessing method was larger than that obtained by the other methods, with an RMSEC of 0.2743 and an RMSEP of 0.5032, which were relatively small. The combined preprocessing of FD and SNV was the optimal preprocessing method for photosynthetic rate based on spectral data. The R
2 (0.9822) obtained by this preprocessing method was larger than that obtained by the other methods, with an RMSEC of 0.3261 and an RMSEP of 0.3374, which were relatively small.
3.2. Comparison of Models for the Prediction of Greenness Value
Following the collection and preprocessing of the two spectra, a greenness value regression model was established. Because PLSR is a modeling method with the advantages of multiple linear regression, principal component analysis, and canonical correlation analysis, the first step was to determine the number of principal components. By reducing the number of principal components (PCs), a lower residual value can be obtained, which can not only ensure the accuracy of the model but also achieve a better prediction effect. A PC value of 6 was selected in this study. After establishing a quantitative prediction model, linear scatter plots were obtained for the predicted greenness value and the measured value of the tomato leaf inspection set based on the two spectral technologies (
Figure 5).
The R
2 and RMSEP of the tomato leaf greenness value prediction model based on the fluorescence spectrum were 0.9816 and 0.1696, respectively, while those of the model based on the hyperspectrum were 0.9595 and 0.4032, respectively (
Figure 5). These results demonstrated that the prediction model was suitable and predicted results with acceptable accuracy. However, the model based on the fluorescence spectrum had a higher R
2 and a smaller RMSEP, indicating the prediction accuracy of this model was better.
According to the measured greenness value and the predicted greenness value obtained by the two models, a comparison chart of the predicted greenness values of the two models was established (
Figure 6). Combining the R
2 and RMSEP of the prediction model, the comparison chart analyzed the prediction results of the greenness value obtained by the models established on the basis of the two spectrums; the results showed that they reached a prediction accuracy of more than 95%, and the fluorescence spectrum regression model was obtained. The predicted value was closer to the actual measured value, indicating that the fluorescence spectroscopy technique was more accurate.
The scatter plots of the residual distribution of the predicted greenness values of tomato leaves based on the fluorescence spectrum and hyperspectrum are shown in
Figure 7. The residual difference between the measured greenness value and the predicted greenness value was low based on the fluorescence spectrum and hyperspectrum of tomato leaves. The residual values of more than 90% of the samples were between ±0.3 and ±0.5, and the distribution of residual points was relatively uniform [
20]. These two points of analysis, combined with the previous R
2 and RMSEP analysis, demonstrated that the prediction accuracy of the model for the tomato leaf greenness value based on the fluorescence spectrum and hyperspectrum was high, and the prediction results met the requirements.
3.3. Comparison of Models for the Prediction of Photosynthetic Rate
The two kinds of spectra were established using the regression model of the photosynthetic rate, and the linear scatter plots of the predicted and measured values of the photosynthetic rate of the tomato leaf inspection set based on the two spectral technologies were obtained (
Figure 8). The R
2 of the model based on the fluorescence spectral model (0.9928) was higher than that of the hyperspectral model (0.9739), while the RMSEP of the former (0.2781) was smaller than that of the latter (0.3374), which meant that the fluorescence spectral model had a higher detection accuracy with lower deviations than the hyperspectral model.
A comparison chart of the predicted photosynthetic rates of the two spectroscopic models was generated on the basis of the measured values and the predicted values of the photosynthetic rate (
Figure 9). Combining the R
2 and RMSEP of the prediction models, the comparison analyzed the predicted values of the photosynthetic rate obtained by the models based on the two kinds of spectra; both spectra met the required prediction accuracy. Additionally, the predicted value obtained by the regression model of the fluorescence spectrum was close to the actual measured value, and the photosynthetic rate had a higher accuracy.
Scatter plots of the residual distribution of the predicted photosynthetic rates based on the fluorescence spectra were obtained (
Figure 10). The residual difference between the measured value and the predicted value based on the fluorescence spectrum and hyperspectrum was small (between ±0.5 and ±1.0), with all residual value points evenly distributed on both sides of the horizontal axis. Moreover, the residual value of the model based on the fluorescence spectrum was smaller than that of the hyperspectral model. In conclusion, the prediction effect of the model was ideal, the residual was within acceptable limits, and the establishment of the model based on the fluorescence spectrum was able to detect the tomato leaf photosynthetic rate.
In general, the assessment of the two spectrum systems revealed that the fluorescence spectrum system has a good guarantee in terms of the speed and accuracy of spectrum collection. The laser it uses is a single light, which greatly improves the sensitivity. In addition, because the distance between the measurement samples and the laser light source is very short, the influence of the surrounding stray light on the test is very small, and it is hardly affected by the surrounding environment. Although hyperspectral imaging technology has the advantage of ‘integrating the spectrum into one’, it is easily affected by external stray light during the acquisition process; the acquisition process is slow, which makes it prone to noise; and much of the spectral information is unrelated to physiological characteristics. The prediction accuracy is greatly affected. In this regard, the fluorescence spectrum system has a slight advantage over hyperspectral imaging technology. In addition, the modeling results showed that the fluorescence spectral prediction model had a higher R2 value and a lower RMSEP value than the hyperspectral model in the prediction set. However, this only meant that the fluorescence spectrum was more accurate than the hyperspectrum in predicting the greenness and photosynthetic rates of the tomato leaf; it did not indicate that the fluorescence spectrum was superior to the hyperspectrum in nondestructive testing. More tests are needed to verify the accuracy of both spectroscopic techniques in terms of nondestructive testing.
4. Conclusions
In this study, the prediction models for tomato leaf greenness values and photosynthetic rates based on the fluorescence spectrum and hyperspectrum were established, and the prediction effects of the models were analyzed. For the photosynthetic rate and greenness value, the best preprocessing method for the fluorescence spectrum was SD+SNV. The residual values of predicted and true values were within ±0.06. The best preprocessing methods for the hyperspectrum under the same evaluation index of tomato leaves for the photosynthetic rate and greenness value were FD+SNV and FD+MSC, respectively, and the residual value of the predicted value and the true value were both 0.5.
Two spectroscopic techniques were compared and analyzed using different tomato leaf assessment indices. For the photosynthetic rate, the R2 values of the model established by the fluorescence spectrum and hyperspectrum were equal to 0.9982 and 0.9739, respectively, and the absolute values of the sum of residuals were equal to 0.884 and 1.255, respectively. For the greenness value, the R2 values of the model established by the fluorescence spectrum and hyperspectrum were equal to 0.9816 and 0.9595, respectively, and the absolute values of the sum of residuals were equal to 0.316 and 1.070, respectively. According to the characteristics of the two spectra and the modeling results, the model based on the fluorescence spectrum had a stronger predictive power and relatively high detection accuracy, and it is a feasible model for detecting the growth state of tomatoes.


