
Response of Common Ice Plant (Mesembryanthemum crystallinum L.) to Photoperiod/Daily Light Integral in Vertical Hydroponic Production


Abstract
:1. Introduction
2. Materials and Methods
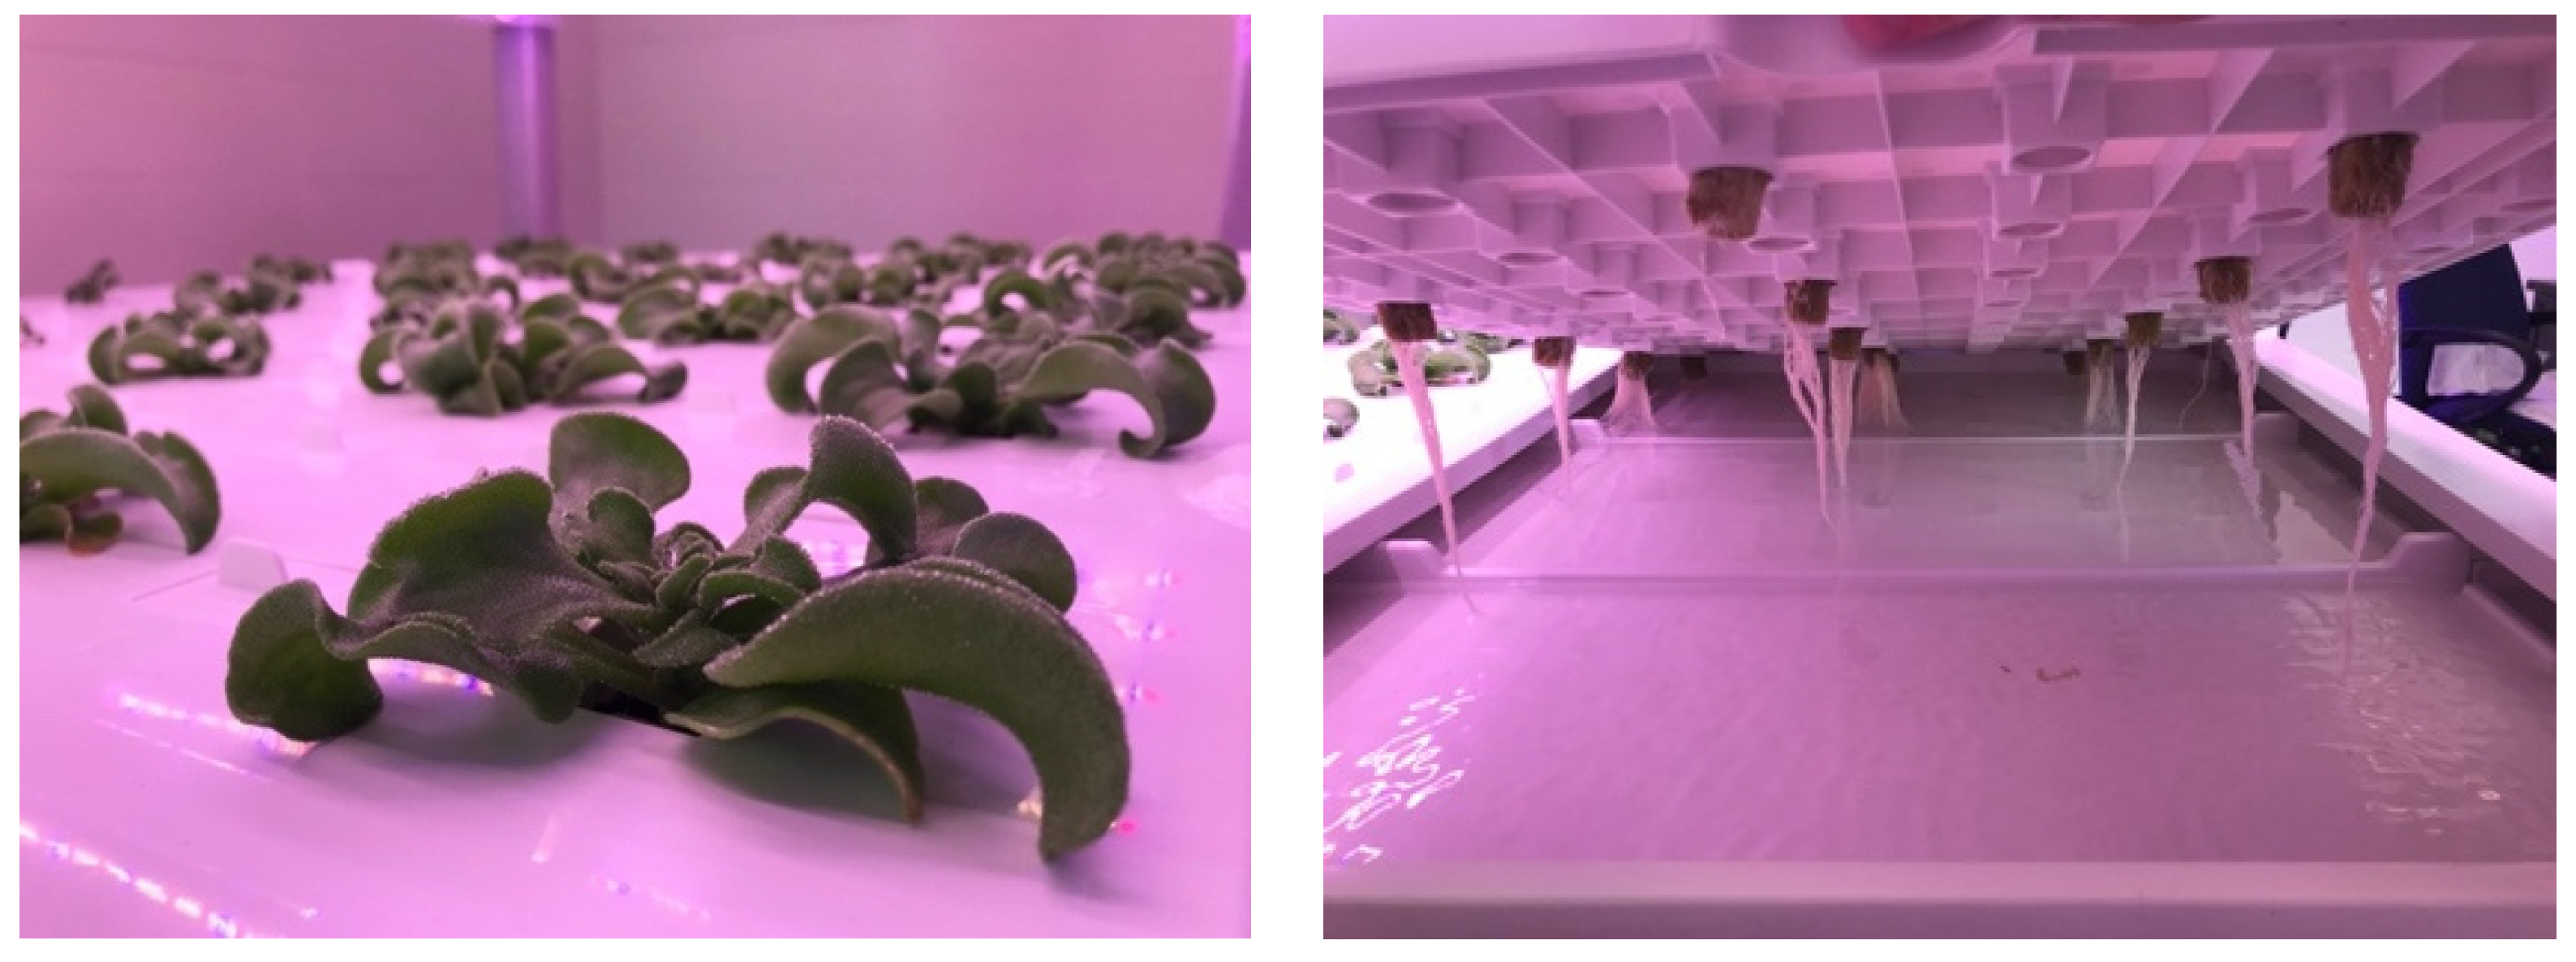
2.1. Plant Material
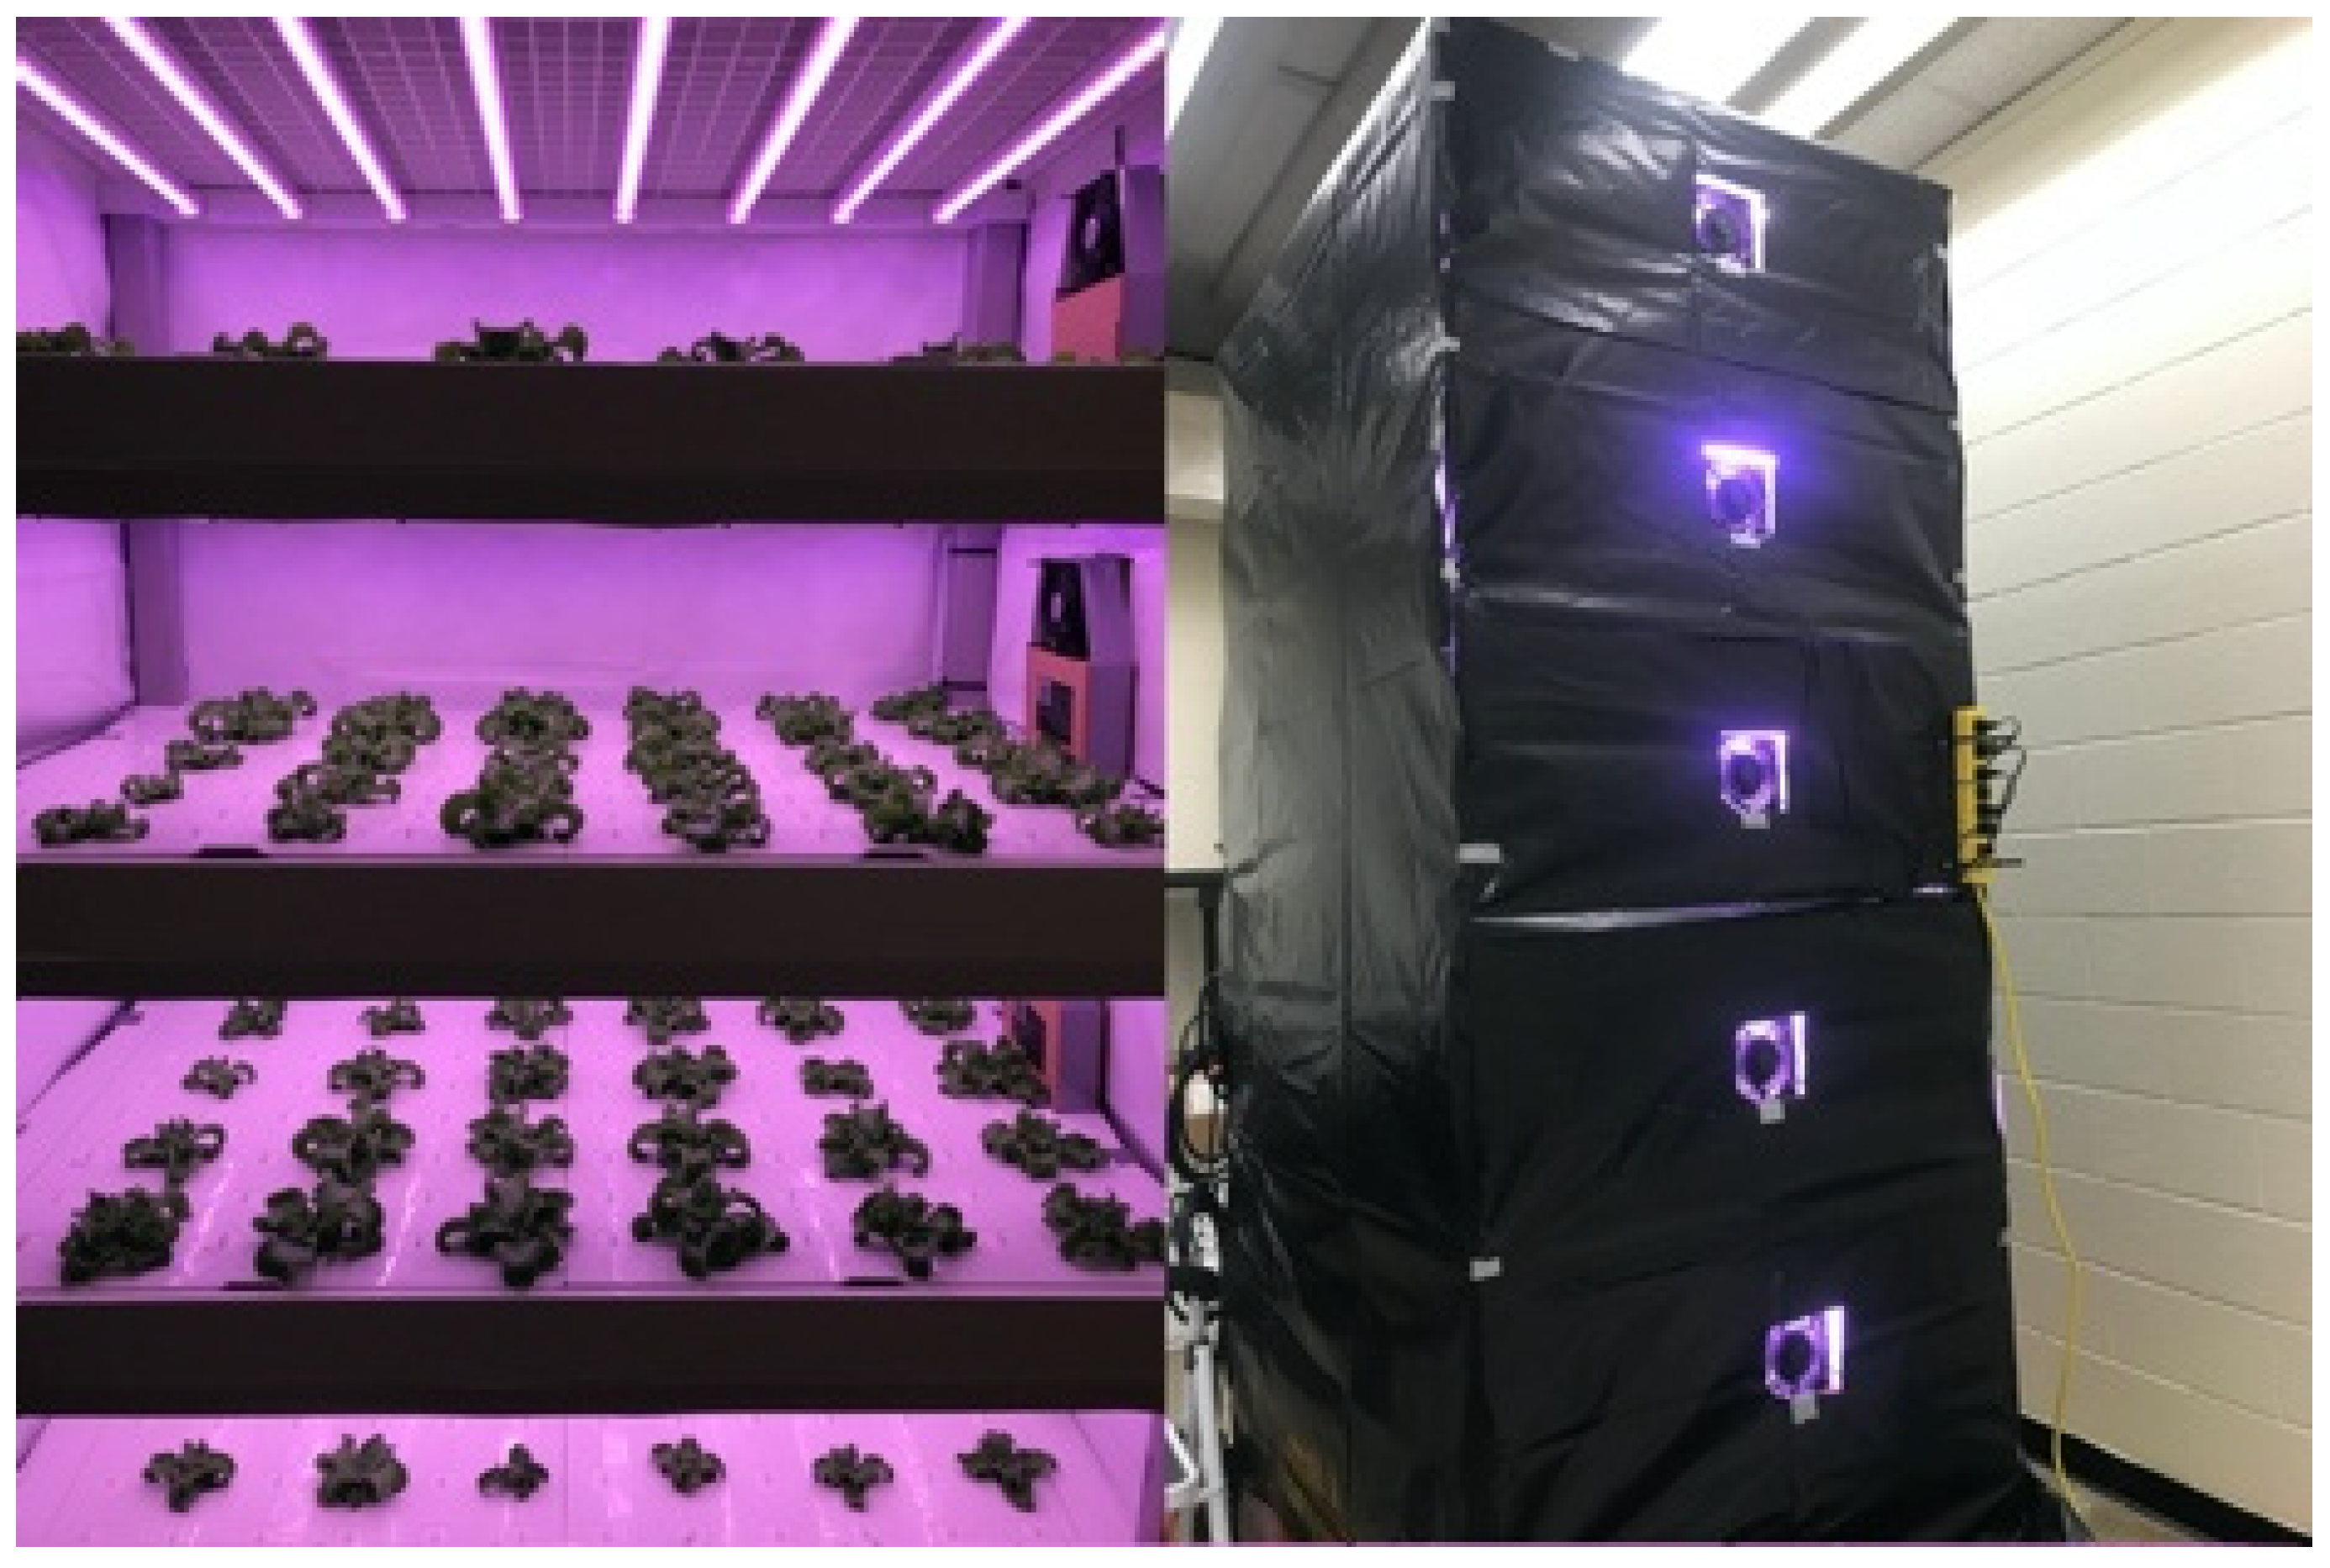
2.2. Experimental Setting
2.3. Measurements
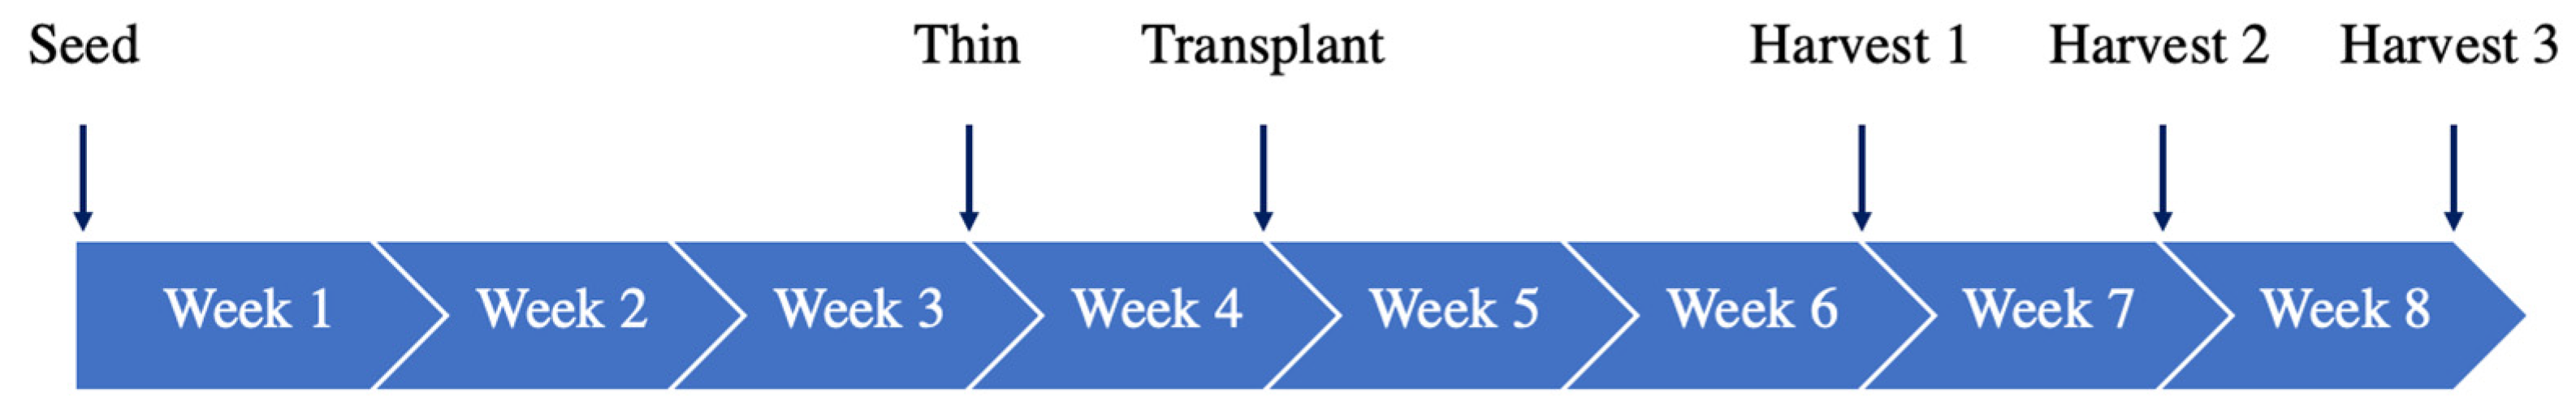
2.4. Experimental Design and Statistical Analysis
3. Results
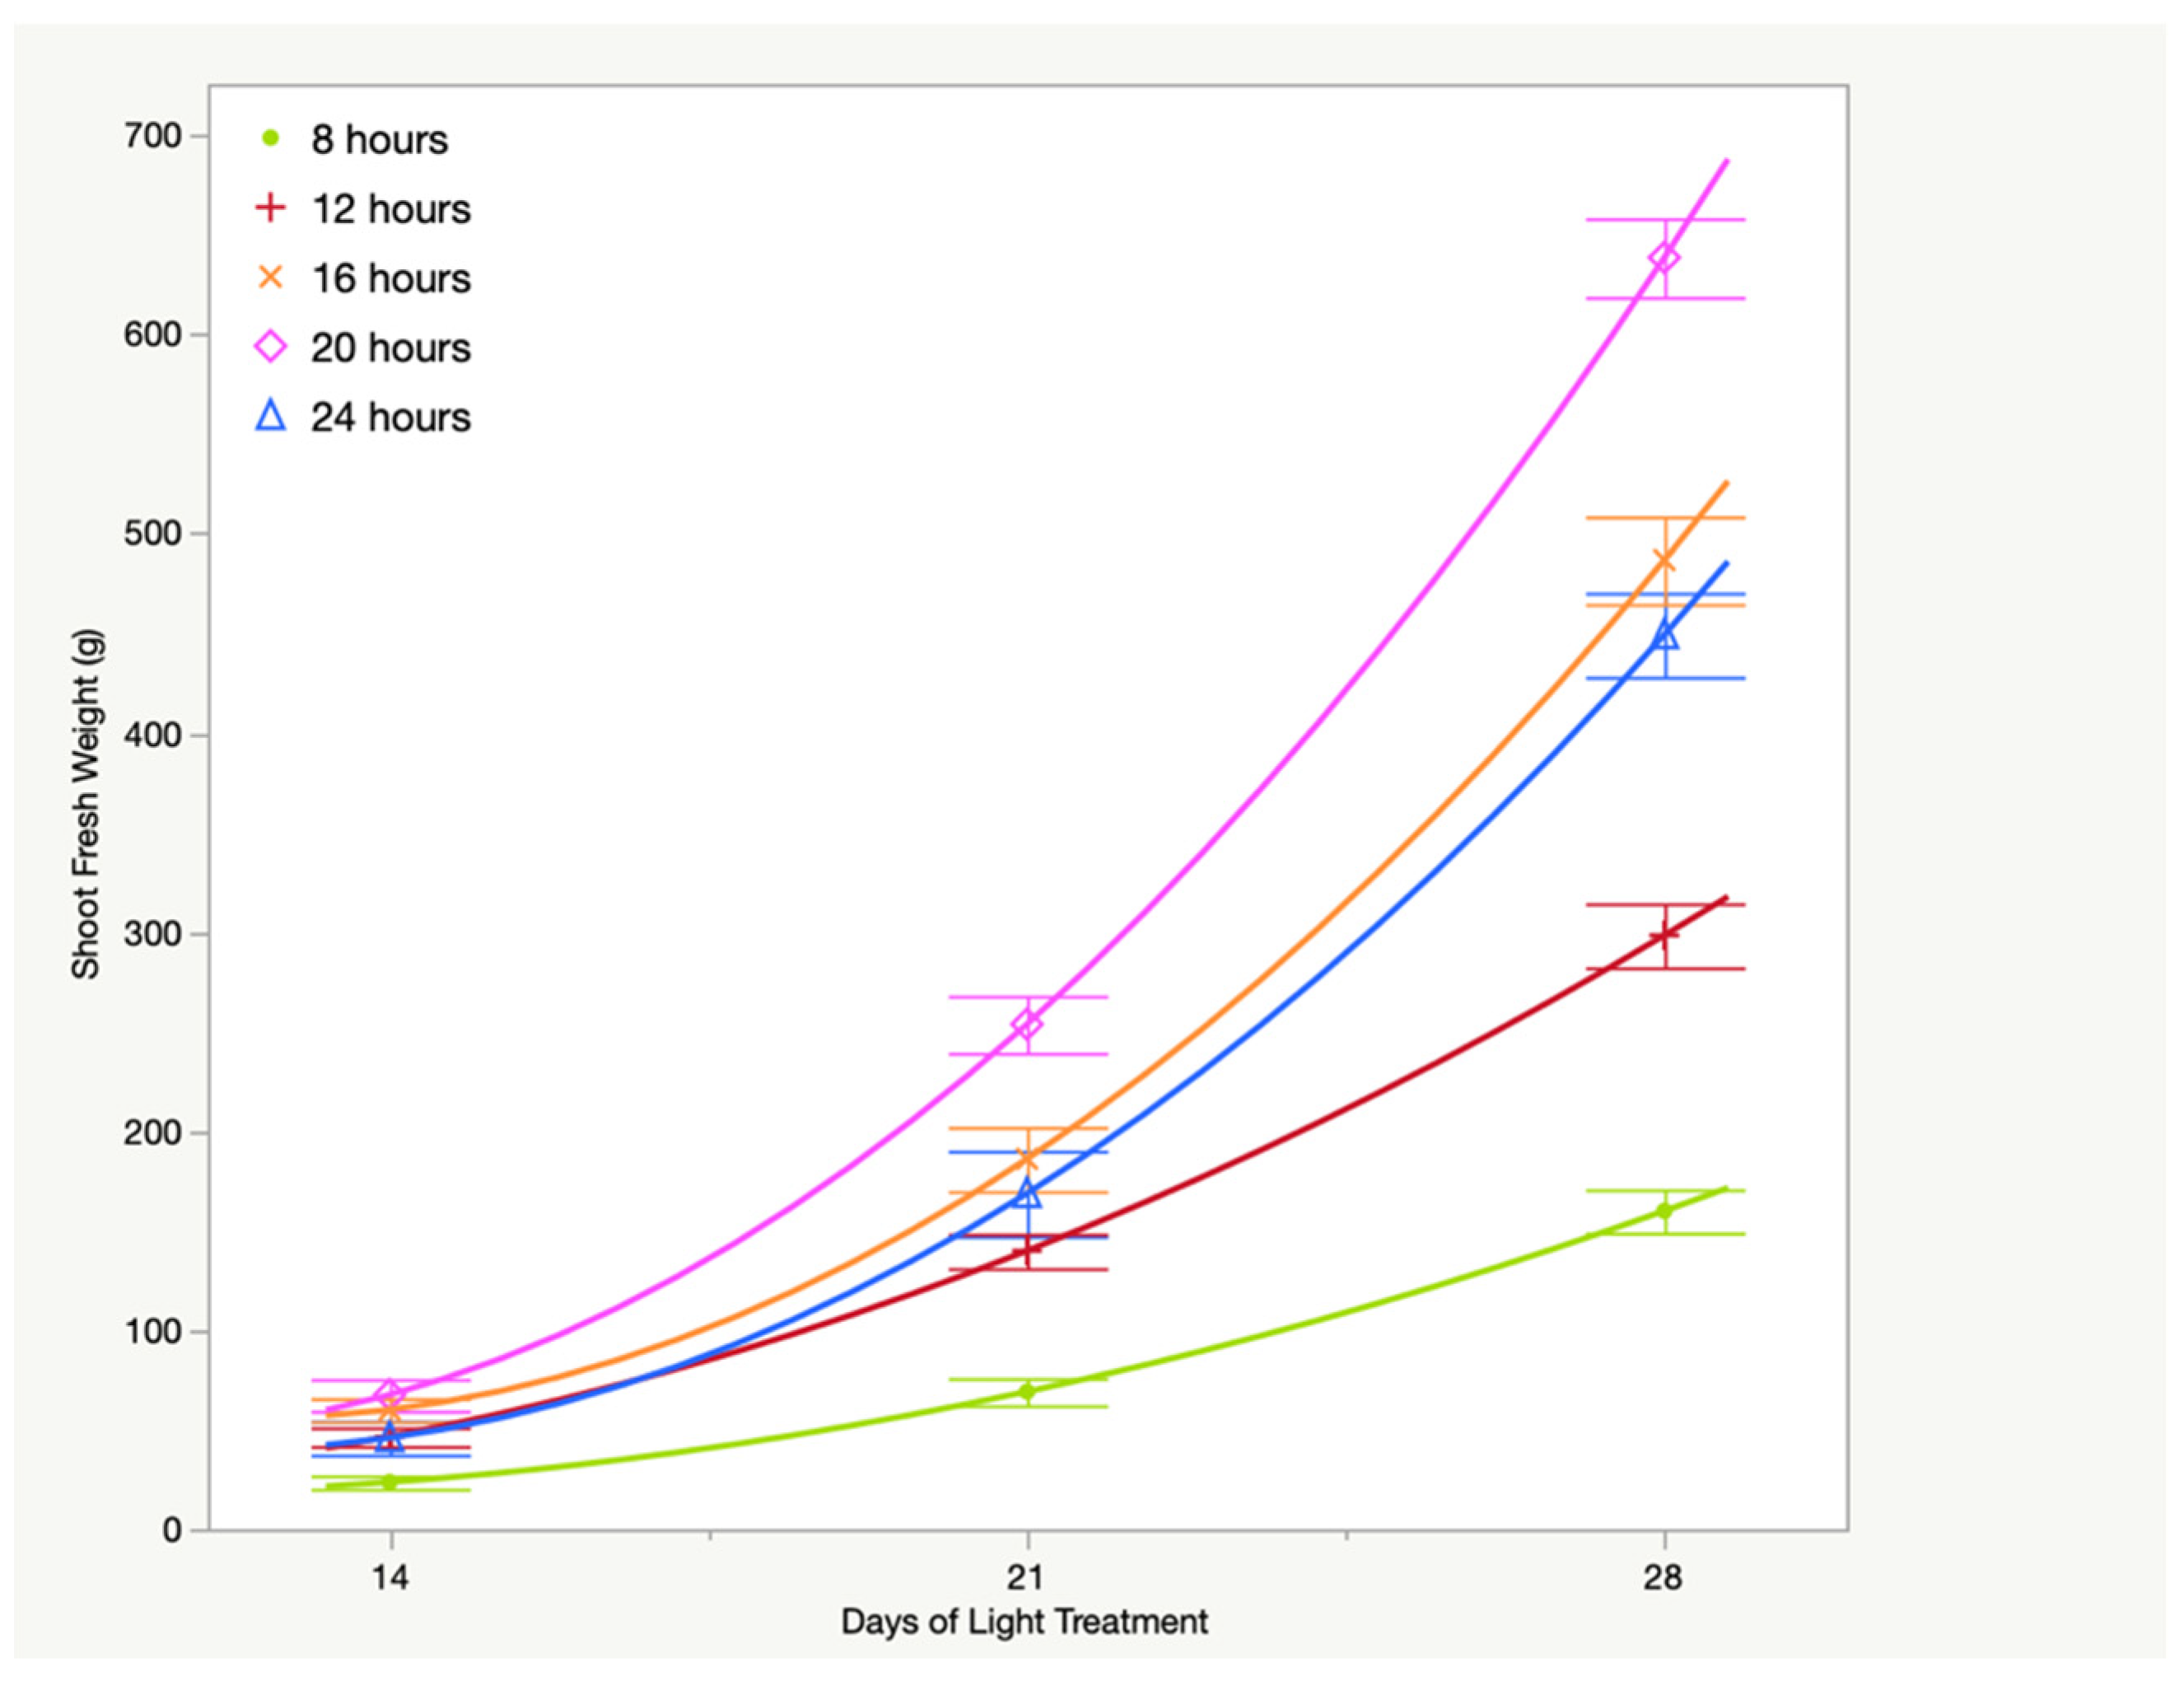
3.1. Fresh Weight
3.2. Dry Weight
3.3. Shoot:Root Ratio
3.4. Leaf Number on the Main Stem, Leaf Fresh Weight, Leaf Dry Weight, Specific Leaf Area
3.5. Nutrient Analysis
4. Discussion
5. Conclusions
Author Contributions
Funding
Data Availability Statement
Acknowledgments
Conflicts of Interest
References
- Kang, S.; Kim, S.; Ha, S.; Lee, C.; Nam, S. Biochemical components and physiological activities of ice plant (Mesembryanthemum crystallinum). J. Korean Soc. Food Sci. Nutr. 2016, 45, 1732–1739. [Google Scholar] [CrossRef]
- Loconsole, D.; Murillo-Amador, B.; Cristiano, G.; De Lucia, B. Halophyte Common Ice Plants: A Future Solution to Arable Land Salinization. Sustainability 2019, 11, 6076. [Google Scholar] [CrossRef] [Green Version]
- Gómez, C.; Currey, C.J.; Dickson, R.W.; Kim, H.-J.; Hernández, R.; Sabeh, N.C.; Raudales, R.E.; Brumfield, R.G.; Laury-Shaw, A.; Wilke, A.K.; et al. Controlled environment food production for urban agriculture. HortScience 2019, 54, 1448–1458. [Google Scholar] [CrossRef]
- Shamshiri, R.; Kalantari, F.; Ting, K.; Thorp, K.R.; Hameed, I.A.; Weltzien, C.; Ahmad, D.; Shad, Z.M. Advances in greenhouse automation and controlled environment agriculture: A transition to plant factories and urban agriculture. Int. J. Agric. Biol. 2018, 11, 1–22. [Google Scholar] [CrossRef]
- Benke, K.; Tomkins, B. Future food-production systems: Vertical farming and controlled-environment agriculture. Sustain. Sci. Pract. Policy 2017, 13, 13–26. [Google Scholar] [CrossRef] [Green Version]
- Goto, E. Plant production in a closed plant factory with artificial lighting. Acta Hortic. 2012, 956, 37–49. [Google Scholar] [CrossRef]
- Kozai, T.; Niu, G.; Takagaki, M. Plant Factory: An Indoor Vertical Farming System for Efficient Quality Food Production, 2nd ed.; Academic Press: London, UK; San Diego, CA, USA, 2019. [Google Scholar]
- Kerslake, N. Indoor Crop Production: Feeding the Future; Newbean Capital: Reno, NV, USA, 2017. [Google Scholar]
- Nicholson, C.F.; Harbick, K.; Gómez, M.I.; Mattson, N.S. An Economic and Environmental Comparison of Conventional and Controlled Environment Agriculture (CEA) Supply Chains for Leaf Lettuce to US Cities. In Food Supply Chains in Cities; Aktas, E., Bourlakis, M., Eds.; Springer: Berlin, Germany, 2020; pp. 33–68. [Google Scholar]
- Yang, J.; Liu, M.; Lu, J.; Miao, Y.; Hossain, M.A.; Alhamid, M.F. Botanical internet of things: Toward smart indoor farming by connecting people, plant, data and clouds. Mob. Netw. Appl. 2018, 23, 188–202. [Google Scholar] [CrossRef]
- Lee, K.; Elliott, c.; Pattison, P. Energy Savings Potential of SSL in Agricultural Applications; Guidehouse Inc.: Washington, DC, USA, 2020. [Google Scholar]
- Snowden, M.C.; Cope, K.R.; Bugbee, B. Sensitivity of seven diverse species to blue and green light: Interactions with photon flux. PLoS ONE 2016, 11, e0163121. [Google Scholar]
- Kusuma, P.; Pattison, P.M.; Bugbee, B. From physics to fixtures to food: Current and potential LED efficacy. Hortic. Res. 2020, 7, 56. [Google Scholar] [CrossRef] [Green Version]
- Massa, G.D.; Kim, H.-H.; Wheeler, R.M.; Mitchell, C.A. Plant productivity in response to LED lighting. HortScience 2008, 43, 1951–1956. [Google Scholar] [CrossRef]
- Stutte, G.W.; Edney, S.; Skerritt, T. Photoregulation of Bioprotectant Content of Red Leaf Lettuce with Light-emitting Diodes. Hortscience 2009, 44, 79–82. [Google Scholar] [CrossRef] [Green Version]
- Dou, H.; Niu, G.; Gu, M. Pre-harvest UV-B radiation and photosynthetic photon flux density interactively affect plant photosynthesis, growth, and secondary metabolites accumulation in basil (Ocimum basilicum) plants. Agronomy 2019, 9, 434. [Google Scholar] [CrossRef] [Green Version]
- Park, Y.; Runkle, E.S. Far-red radiation and photosynthetic photon flux density independently regulate seedling growth but interactively regulate flowering. Environ. Exp. Bot. 2018, 155, 206–216. [Google Scholar] [CrossRef]
- Jones, H.G. Limiting factors in photosynthesis. New Phytol. 1973, 72, 1089–1094. [Google Scholar] [CrossRef]
- Cammarisano, L.; Donnison, I.S.; Robson, P.R. Producing enhanced yield and nutritional pigmentation in lollo rosso through manipulating the irradiance, duration, and periodicity of LEDs in the visible region of light. Front. Plant Sci. 2020, 11, 598082. [Google Scholar] [CrossRef] [PubMed]
- Kelly, N.; Choe, D.; Meng, Q.; Runkle, E.S. Promotion of lettuce growth under an increasing daily light integral depends on the combination of the photosynthetic photon flux density and photoperiod. Sci. Hortic. 2020, 272, 109565. [Google Scholar] [CrossRef]
- Palmer, S.; van Iersel, M.W. Increasing Growth of Lettuce and Mizuna under Sole-Source LED Lighting Using Longer Photoperiods with the Same Daily Light Integral. Agronomy 2020, 10, 1659. [Google Scholar] [CrossRef]
- Elkins, C.; van Iersel, M.W. Longer photoperiods with the same daily light integral increase daily electron transport through photosystem II in lettuce. Plants 2020, 9, 1172. [Google Scholar] [CrossRef]
- Kim, Y.J.; Kim, H.M.; Kim, H.M.; Jeong, B.R.; Lee, H.-J.; Kim, H.-J.; Hwang, S.J. Ice plant growth and phytochemical concentrations are affected by light quality and intensity of monochromatic light-emitting diodes. Hortic. Environ. Biotechnol. 2018, 59, 529–536. [Google Scholar] [CrossRef]
- Mattson, N.S.; Peters, C. A recipe for hydroponic success. In Inside Grower; Ball Publishing: Chicago, IL, USA, 2014; pp. 16–19. [Google Scholar]
- Xia, J.; Mattson, N. Response of Common Ice Plant (Mesembryanthemum crystallinum L.) to Sodium Chloride Concentration in Hydroponic Nutrient Solution. HortScience 2022, 57, 750–756. [Google Scholar] [CrossRef]
- Agarie, S.; Shimoda, T.; Shimizu, Y.; Baumann, K.; Sunagawa, H.; Kondo, A.; Ueno, O.; Nakahara, T.; Nose, A.; Cushman, J.C. Salt tolerance, salt accumulation, and ionic homeostasis in an epidermal bladder-cell-less mutant of the common ice plant Mesembryanthemum crystallinum. J. Exp. Bot. 2007, 58, 1957–1967. [Google Scholar] [CrossRef] [PubMed]
- Atzori, G.; de Vos, A.C.; van Rijsselberghe, M.; Vignolini, P.; Rozema, J.; Mancuso, S.; van Bodegom, P.M. Effects of increased seawater salinity irrigation on growth and quality of the edible halophyte Mesembryanthemum crystallinum L. under field conditions. Agric. Water Manag. 2017, 187, 37–46. [Google Scholar] [CrossRef]
- Jackson, S.D. Plant responses to photoperiod. New Phytol. 2009, 181, 517–531. [Google Scholar] [CrossRef] [PubMed] [Green Version]
- Koontz, H.; Prince, R. Effect of 16 and 24 hours daily radiation (light) on lettuce growth. HortScience 1986, 21, 123–124. [Google Scholar]
- Velez-Ramirez, A.I.; van Ieperen, W.; Vreugdenhil, D.; Millenaar, F.F. Plants under continuous light. Trends Plant Sci. 2011, 16, 310–318. [Google Scholar] [CrossRef] [Green Version]
- Demers, D.; Gosselin, A. Growing greenhouse tomato and sweet pepper under supplemental lighting: Optimal photoperiod, negative effects of long photoperiod and their causes. Acta Hortic. 2000, 580, 83–88. [Google Scholar] [CrossRef]
- Murage, E.N.; Watashiro, N.; Masuda, M. Leaf chlorosis and carbon metabolism of eggplant in response to continuous light and carbon dioxide. Sci. Hortic. 1996, 67, 27–37. [Google Scholar] [CrossRef]
- Barber, J.; Andersson, B. Too much of a good thing: Light can be bad for photosynthesis. Trends Biochem. Sci. 1992, 17, 61–66. [Google Scholar] [CrossRef]
- Müller, P.; Li, X.-P.; Niyogi, K.K. Non-photochemical quenching. A response to excess light energy. Plant Physiol. 2001, 125, 1558–1566. [Google Scholar] [CrossRef] [Green Version]
- Xu, D.-Q.; Shen, Y.-K. Light stress: Photoinhibition of photosynthesis in plants under natural conditions. In Handbook of Plant and Crop Stress, 4th ed.; Mohammad, P., Ed.; Marcel Dekker, Inc.: New York, NY, USA, 1999; pp. 483–497. [Google Scholar]
- Flexas, J.; Ribas-Carbó, M.; Bota, J.; Galmés, J.; Henkle, M.; Martínez-Cañellas, S.; Medrano, H. Decreased Rubisco activity during water stress is not induced by decreased relative water content but related to conditions of low stomatal conductance and chloroplast CO2 concentration. New Phytol. 2006, 172, 73–82. [Google Scholar] [CrossRef]
- Givnish, T.J. Adaptation to sun and shade: A whole-plant perspective. Funct. Plant Biol. 1988, 15, 63–92. [Google Scholar] [CrossRef] [Green Version]
- Terashima, I.; Miyazawa, S.-I.; Hanba, Y.T. Why are sun leaves thicker than shade leaves?—Consideration based on analyses of CO2 diffusion in the leaf. J. Plant Res. 2001, 114, 93–105. [Google Scholar] [CrossRef]
- Walters, K.J.; Currey, C.J. Effects of nutrient solution concentration and daily light integral on growth and nutrient concentration of several basil species in hydroponic production. HortScience 2018, 53, 1319–1325. [Google Scholar] [CrossRef]
- Gent, M.P. Effect of daily light integral on composition of hydroponic lettuce. HortScience 2014, 49, 173–179. [Google Scholar] [CrossRef] [Green Version]
- Mansfield, T.; Jones, R.J. Effects of abscisic acid on potassium uptake and starch content of stomatal guard cells. Planta 1971, 101, 147–158. [Google Scholar] [CrossRef]
- Nu-may, R.R.; Bonner, B.A. The effect of abscisic acid on the uptake of potassium and chloride into Avena coleoptile sections. Planta 1974, 116, 173–185. [Google Scholar]
- Desikan, R.; Cheung, M.K.; Bright, J.; Henson, D.; Hancock, J.T.; Neill, S.J. ABA, hydrogen peroxide and nitric oxide signalling in stomatal guard cells. J. Exp. Bot. 2004, 55, 205–212. [Google Scholar] [CrossRef] [Green Version]
- Kriedemann, P.; Loveys, B.; Fuller, G.; Leopold, A. Abscisic acid and stomatal regulation. Plant Physiol. 1972, 49, 842–847. [Google Scholar] [CrossRef]
- Winter, K.; Foster, J.G.; Edwards, G.E.; Holtum, J.A. Intracellular localization of enzymes of carbon metabolism in Mesembryanthemum crystallinum exhibiting C3 photosynthetic characteristics or performing Crassulacean acid metabolism. Plant Physiol. 1982, 69, 300–307. [Google Scholar] [CrossRef] [Green Version]
- Chu, C.; Dai, Z.; Ku, M.S.; Edwards, G.E. Induction of Crassulacean acid metabolism in the facultative halophyte Mesembryanthemum crystallinum by abscisic acid. Plant Physiol. 1990, 93, 1253–1260. [Google Scholar] [CrossRef] [Green Version]


| Photoperiod (Hours of Light per Day, h)/ DLI (mol·m−2·d−1) | 14 Days | 21 Days | 28 Days | Significance across Time |
|---|---|---|---|---|
| Plant Fresh Weight (g) | ||||
| 8/6.34 | 25.4 ± 4.1 C | 73.5 ± 11.3 D | 167.1 ± 11.3 D | L*** Q * |
| 12/9.50 | 50.7 ± 3.2 B | 149.6 ± 8.3 C | 314.8 ± 15.3 C | L *** Q * |
| 16/12.67 | 66.2 ± 5.5 AB | 200.3 ± 11.3 B | 521.1 ± 22.2 B | L *** Q *** |
| 20/15.84 | 75.0 ± 4.3 A | 272.6 ± 11.9 A | 683.6 ± 20.4 A | L *** Q *** |
| 24/19.01 | 51.7 ± 5.8 B | 184.9 ± 15.8 BC | 477.1 ± 23.1 B | L *** Q ** |
| Shoot Fresh Weight (g) | ||||
| 8/6.34 | 23.7 ± 3.6 C | 69.1 ± 10.3 D | 159.8 ± 10.6 D | L *** Q * |
| 12/9.50 | 46.5 ± 3.0 B | 139.8 ± 7.8 C | 298.3 ± 15.5 C | L *** Q * |
| 16/12.67 | 60.0 ± 5.1 AB | 186.0 ± 10.3 B | 486.7 ± 20.1 B | L *** Q *** |
| 20/15.84 | 67.5 ± 3.9 A | 253.6 ± 10.9 A | 638.6 ± 19.9 A | L *** Q *** |
| 24/19.01 | 45.9 ± 5.2 B | 168.6 ± 14.6 BC | 449.2 ± 21.8 B | L *** Q ** |
| Root Fresh Weight (g) | ||||
| 8/6.34 | 1.8 ± 0.5 C | 4.5 ± 1.2 C | 7.2 ± 1.7 D | L *** Q NS |
| 12/9.50 | 4.2 ± 0.3 B | 9.8 ± 0.7 B | 16.6 ± 1.7 CD | L *** Q NS |
| 16/12.67 | 6.2 ± 0.4 AB | 14.4 ± 1.2 AB | 34.5 ± 5.2 AB | L *** Q NS |
| 20/15.84 | 7.5 ± 0.5 A | 19.0 ± 1.4 A | 44.9 ± 3.5 A | L *** Q NS |
| 24/19.01 | 5.7 ± 0.6 AB | 16.3 ± 1.3 A | 27.9 ± 2.6 BC | L *** Q NS |
| Photoperiod (Hours of Lighting per Day, h)/ DLI (mol·m−2·d−1) | 14 Days | 21 Days | 28 Days | Significance across Time |
|---|---|---|---|---|
| Plant Dry Weight (g) | ||||
| 8/6.34 | 0.650 ± 0.129 C | 1.726 ± 0.179 D | 3.411 ± 0.303 D | L *** Q NS |
| 12/9.50 | 1.372 ± 0.076 B | 3.451 ± 0.161 C | 6.318 ± 0.269 C | L *** Q NS |
| 16/12.67 | 1.998 ± 0.121 A | 4.811 ± 0.313 B | 11.198 ± 0.399 B | L *** Q ** |
| 20/15.84 | 2.417 ± 0.114 A | 6.827 ± 0.256 A | 15.733 ± 0.731 A | L *** Q ** |
| 24/19.01 | 1.947 ± 0.160 A | 5.478 ± 0.283 B | 13.976 ± 0.818 A | L *** Q ** |
| Shoot Dry Weight (g) | ||||
| 8 /6.34 | 0.599 ± 0.116 C | 1.574 ± 0.152 D | 3.148 ± 0.252 D | L *** Q NS |
| 12/9.50 | 0.238 ± 0.069 B | 3.136 ± 0.146 C | 5.724 ± 0.272 C | L *** Q NS |
| 16/12.67 | 1.776 ± 0.112 A | 4.319 ± 0.276 B | 10.027 ± 0.375 B | L *** Q *** |
| 20/15.84 | 2.119 ± 0.101 A | 6.149 ± 0.239 A | 13.954 ± 0.961 A | L *** Q ** |
| 24/19.01 | 1.799 ± 0.156 A | 4.881 ± 0.263 B | 12.866 ± 0.740 B | L *** Q *** |
| Root Dry Weight (g) | ||||
| 8/6.34 | 0.051 ± 0.014 D | 0.151 ± 0.032 D | 0.263 ± 0.071 C | L *** Q NS |
| 12/9.50 | 0.134 ± 0.009 C | 0.316 ± 0.018 C | 0.593 ± 0.067 C | L *** Q NS |
| 16/12.67 | 0.222 ± 0.013 B | 0.492 ± 0.042 B | 1.171 ± 0.146 B | L *** Q NS |
| 20/15.84 | 0.298 ± 0.019 A | 0.678 ± 0.037 A | 1.779 ± 0.106 A | L *** Q ** |
| 24/19.01 | 0.148 ± 0.017 C | 0.597 ± 0.042 AB | 1.110 ± 0.090 B | L *** Q NS |
| Shoot:Root Ratio | ||||
| 8/6.34 | 12.187 ± 1.178 AB | 10.798 ± 0.771 A | 12.255 ± 0.388 A | L NS Q NS |
| 12/9.50 | 9.193 ± 0.479 BC | 10.286 ± 0.366 A | 10.224 ± 0.757 AB | L NS Q NS |
| 16/12.67 | 8.042 ± 0.582 C | 9.197 ± 0.407 A | 10.661 ± 1.163 AB | L NS Q NS |
| 20/15.84 | 7.084 ± 0.440 C | 9.433 ± 0.479 A | 8.183 ± 0.532 B | L NS Q * |
| 24/19.01 | 13.077 ± 1.249 A | 9.023 ± 1.140 A | 11.740 ± 0.471 A | L NS Q * |
| Photoperiod (Hours of Lighting per Day, h)/ DLI (mol·m−2·d−1) | 14 Days | 21 Days | 28 Days | Significance across Time |
|---|---|---|---|---|
| Leaf Number on the Main Stem | ||||
| 8/6.34 | 11.6 ± 0.4 A | 15.3 ± 0.3 AB | 16.8 ± 0.3 A | L *** Q NS |
| 12/9.50 | 12.4 ± 0.3 A | 15.3 ± 0.1 AB | 17.2 ± 0.1 A | L *** Q NS |
| 16/12.67 | 12.2 ± 0.4 A | 15.3 ± 0.1 AB | 17.1 ± 0.2 A | L *** Q NS |
| 20/15.84 | 12.9 ± 0.4 A | 15.6 ± 0.2 A | 16.9 ± 0.2 A | L *** Q NS |
| 24/19.01 | 12.7 ± 0.2 A | 14.6 ± 0.2 B | 16.2 ± 0.3 A | L *** Q NS |
| Leaf Fresh Weight (g) | ||||
| 8/6.34 | 23.2 ± 3.4 C | 66.2 ± 9.6 C | 145.6 ± 9.4 D | L *** Q * |
| 12/9.50 | 45.1 ± 2.8 B | 129.2 ± 7.1 B | 256.4 ± 13.2 C | L *** Q NS |
| 16/12.67 | 57.7 ± 4.9 AB | 169.7 ± 9.0 B | 395.9 ± 18.3 B | L *** Q ** |
| 20/15.84 | 64.7 ± 3.6 A | 224.3 ± 9.6 A | 507.1 ± 14.5 A | L *** Q *** |
| 24/19.01 | 44.1 ± 5.0 B | 151.5 ± 12.9 B | 351.6 ± 18.6 B | L *** Q * |
| Leaf Dry Weight (g) | ||||
| 8/6.34 | 0.568 ± 0.105 C | 1.479 ± 0.136 D | 2.730 ± 0.215 D | L *** Q NS |
| 12/9.50 | 1.168 ± 0.062 B | 2.770 ± 0.124 C | 4.501 ± 0.219 C | L *** Q NS |
| 16/12.67 | 1.654 ± 0.103 A | 3.711 ± 0.226 B | 7.183 ± 0.343 B | L *** Q NS |
| 20/15.84 | 1.967 ± 0.093 A | 5.014 ± 0.184 A | 9.582 ± 0.537 A | L *** Q NS |
| 24/19.01 | 1.678 ± 0.148 A | 4.113 ± 0.220 B | 9.069 ± 0.539 A | L *** Q * |
| Photoperiod (Hours of Lighting per Day, h)/ DLI (mol·m−2·d−1) | 14 Days | 21 Days | 28 Days | Significanceacross Time |
|---|---|---|---|---|
| Leaf Water Content (%) | ||||
| 8/6.34 | 97.5 ± 0.1 A | 97.7 ± 0.1 A | 98.2 ± 0.1 A | L *** Q NS |
| 12/9.50 | 97.4 ± 0.1 A | 97.8 ± 0.1 A | 98.2 ± 0.1 A | L *** Q NS |
| 16/12.67 | 97.1 ± 0.1 AB | 97.8 ± 0.1 A | 98.2 ± 0.1 A | L *** Q NS |
| 20/15.84 | 97.0 ± 0.1 B | 97.7 ± 0.1 A | 98.1 ± 0.1 A | L *** Q NS |
| 24/19.01 | 96.0 ± 0.2 C | 97.0 ± 0.3 B | 97.4 ± 0.2 B | L ** Q NS |
| Specific Leaf Area (cm2·g−1) | ||||
| 8/6.34 | 280.9 ± 5.7 A | 293.9 ± 5.9 A | 365.1 ± 6.9 A | L *** Q ** |
| 12/9.50 | 250.1 ± 3.3 B | 293.0 ± 5.2 A | 360.0 ± 8.9 A | L *** Q NS |
| 16/12.67 | 196.0 ± 3.9 C | 238.1 ± 7.5 B | 305.5 ± 13.5 B | L *** Q NS |
| 20/15.84 | 171.9 ± 6.5 D | 209.8 ± 7.3 B | 247.3 ± 15.4 C | L *** Q NS |
| 24/19.01 | 112.1 ± 5.8 E | 154.6 ± 15.0 C | 172.8 ± 7.3 D | L *** Q NS |
| Photoperiod (Hours of Lighting per Day, h)/ DLI (mol·m−2·d−1) | Nitrogen (mg·kg−1) | Phosphorus (mg·kg−1) | Potassium (mg·kg−1) |
|---|---|---|---|
| 8/6.34 | 57,955 ± 716 A | 9146 ± 536 A | 37,708 ± 204 A |
| 12/9.50 | 53,085 ± 1939 A | 8981 ± 403 A | 35,859 ± 1188 AB |
| 16/12.67 | 51,372 ± 636 A | 9484 ± 572 A | 32,240 ± 1924 ABC |
| 20/15.84 | 51,932 ± 2522 A | 10,364 ± 234 A | 29,304 ± 1672 BC |
| 24/19.01 | 47,658 ± 4131 A | 11,114 ± 1141 A | 29,805 ± 1261 C |
| Photoperiod (hours of lighting per day, h)/ DLI (mol·m−2·d−1) | Calcium (mg·kg−1) | Magnesium (mg·kg−1) | Sulfur (mg·kg−1) |
| 8/6.34 | 7228 ± 457 B | 5682 ± 156 A | 3989 ± 236 A |
| 12/9.50 | 8104 ± 425 AB | 4731 ± 214 B | 3599 ± 158 A |
| 16/12.67 | 10,017 ± 1148 AB | 4553 ± 36 B | 3815 ± 63 A |
| 20/15.84 | 10,455 ± 769 AB | 4319 ± 119 B | 3738 ± 203 A |
| 24/19.01 | 10,877 ± 838 A | 4216 ± 252 B | 4370 ± 243 A |
Publisher’s Note: MDPI stays neutral with regard to jurisdictional claims in published maps and institutional affiliations. |
© 2022 by the authors. Licensee MDPI, Basel, Switzerland. This article is an open access article distributed under the terms and conditions of the Creative Commons Attribution (CC BY) license (https://creativecommons.org/licenses/by/4.0/).
Share and Cite
Xia, J.; Mattson, N. Response of Common Ice Plant (Mesembryanthemum crystallinum L.) to Photoperiod/Daily Light Integral in Vertical Hydroponic Production. Horticulturae 2022, 8, 653. https://doi.org/10.3390/horticulturae8070653
Xia J, Mattson N. Response of Common Ice Plant (Mesembryanthemum crystallinum L.) to Photoperiod/Daily Light Integral in Vertical Hydroponic Production. Horticulturae. 2022; 8(7):653. https://doi.org/10.3390/horticulturae8070653
Chicago/Turabian StyleXia, Jiaqi, and Neil Mattson. 2022. "Response of Common Ice Plant (Mesembryanthemum crystallinum L.) to Photoperiod/Daily Light Integral in Vertical Hydroponic Production" Horticulturae 8, no. 7: 653. https://doi.org/10.3390/horticulturae8070653