Article

Climatic Suitability of Different Areas in Abruzzo, Central Italy, for the Cultivation of Hazelnut

1
Abruzzo Region, Agriculture Directorate-Regional Agro-Meteorological Centre, Contrada Colle Comune, 66020 Scerni, Italy
2
Dipartimento di Scienze Fisiche e Chimiche, Università degli Studi dell’Aquila, Via Vetoio—Coppito, 67100 L’Aquila, Italy
3
Center of Excellence in Telesensing of Environment and Model Prediction of Severe Events (CETEMPS), Università degli Studi dell’Aquila, Via Vetoio—Coppito, 67100 L’Aquila, Italy
4
Department of Agricultural, Food and Environmental Sciences, University of Perugia, Via Borgo XX Giugno 74, 06121 Perugia, Italy
*
Author to whom correspondence should be addressed.
Horticulturae 2022, 8(7), 580; https://doi.org/10.3390/horticulturae8070580
Submission received: 19 March 2022 / Revised: 27 April 2022 / Accepted: 24 June 2022 / Published: 27 June 2022
(This article belongs to the Section Fruit Production Systems)

Abstract

:
The demand for nuts has prompted the need to identify additional zones for hazelnut cultivation in Italy. There is great interest in the Abruzzo Region, in the central–eastern part of the country. The relationships between climate and environmental requirements for hazelnut were analyzed, taking into account the geography of the region, as well as climate change. The study was conducted by using the weather data from 34 stations between 1980 and 2019. The chilling requirements of the species are mostly met, except on the southern coast. Hot spring and summer caused an increase in the growing degree day in all locations. Years with minimum temperatures below −10 °C from December to March were almost null in coastal areas and the hilly belt. Late spring frosts in inland and mountainous areas occurred frequently, and the number of days with temperatures above 30 °C showed an upward trend everywhere. Five locations (Santo Stefano, Caramanico, Vasto, Isola del Gran Sasso, and Penne) were suitable for hazelnut cultivation, three were moderately suitable, seven were not very suitable, and nineteen were unsuitable.

1. Introduction

European hazelnut (Corylus avellana L.), in Italy, is grown mainly in four regions: Piedmont, Latium, Campania, and Sicily [1]. Due to the great demand from the processing industries, hazelnut cultivation has grown significantly in recent years, from 70,464 to 90,312 hectares [2]. This demand and the diversification of the supply have urged additional areas of cultivation to be identified, but, given the long-term nature of the investment needed to establish new orchards, an ex ante evaluation is critical to support stakeholders and decision makers.
Besides the type and technical and cultural factors, hazelnut growing is also related to environmental and, particularly, to climatic conditions [3,4,5,6,7,8]. Studies, however, are limited to a few locations and refer to current climatic conditions, despite the long-term nature of the investment connected to cultivation (around 10 years after planting before full production) [3,4,5,6,7,8,9,10]. Hence, the identification of the new areas suitable for hazelnut farming should be based also on the projected trends of the impacts of thermal and precipitation regimes [6]. The effects of the temperature and rainfall are among the climatic parameters having a distinctive role in the cultivation conditions of hazelnut, as reported by several authors [3,4,5,10,11,12,13,14]. Moreover, an increase in the number of days with a maximum temperature higher than 35 °C and relative humidity lower than 70% has been reported to cause severe water and heat stresses, leading to yield decline and shortened vegetative growth, combined with a reduction in kernel filling [4,15,16]. In contrast to water stress, which can be reduced with irrigation, the negative effects of high temperature on chilling hours and leaf burning cannot be easily mitigated [4,17]. Furthermore, factors such as average temperature, chilling hours, growing degree days, solar radiation, rainfall, wind speed, and relative humidity, among others, strongly affect the various phenological stages, as well as pollination and fruit set success [9,10,11,12,18,19,20].
In hazelnut, the dates of flowering and leafing at the end of winter or early spring are a function of the chilling requirements for buds and the heat requirements during the post-rest phase. The chilling requirement of vegetative buds is a major consideration in selecting the area of cultivar adaptation [14]. The chilling hours differ from cultivar to cultivar, and different parts of the plant also have substantially different chilling requirements [10]. Mehlembacher [14] reported chilling requirements for Tonda Gentile delle Langhe of 1050–1300 for leaves, 600–800 h for female flowers, and 350–600 for male catkins.
The aim of this study was to determine the effects of climate on the cultivation of hazelnut trees in areas of the Abruzzo Region, which is located in the central eastern part of Italy. There are currently about 132 hectares of hazelnut in the Abruzzo Region [21]. The relationship between the climate and the management requirements of the Corylus avellana L. species was evaluated by considering the complex geography of the Abruzzo Region. The first objective was to identify suitable climatic conditions for hazelnut growth and productivity; the second was to identify those areas in the Abruzzo Region where the hazelnut could face environmental conditions no longer suitable for its cultivation due to climate change.

2. Materials and Methods

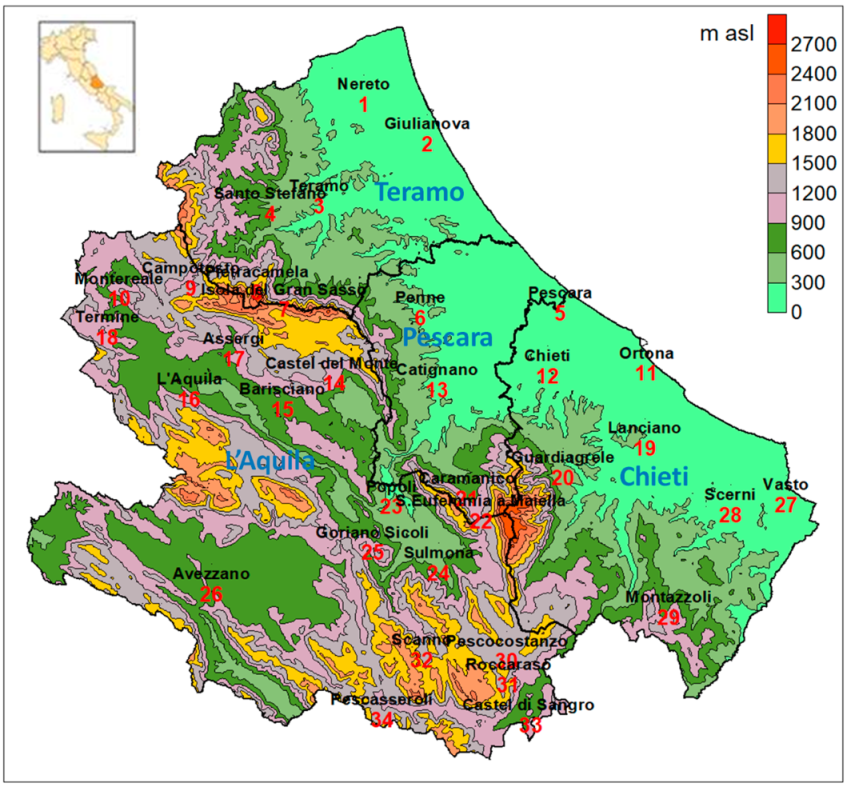
2.1. Climatic Data Collection and Climate Description of the Abruzzo Region

The climate study was conducted by using the daily thermo-pluviometric data collected from 34 locations (described in Table 1) and uniformly distributed throughout the Abruzzo Region, in the period 1980–2019 (Figure 1). The stations are indicated with a numeric code imposed from north to south and from west to east.
The 34 weather stations are managed by the regional public Hydrographic and Mareographic Office (Ufficio Idrografico e Mareografico, Regione Abruzzo, https://www.regione.abruzzo.it/content/idrografico-mareografico, accessed on 10 February 2022). The westernmost station, Montereale (10), has the geographic coordinates 42°31′30″ N and 13°14′39″ E; the easternmost station, Vasto (27) has 42°07′28″ N and 14°42′21″ E; the northernmost station, Nereto (1), has 42°49′08″ N and 13°48′58″ E; and the southernmost station, Castel di Sangro (33), has 41°47′03″ N and 14°06′29″ E (Table 1 and Figure 1).
The Abruzzo Region has a complex orography. Roughly half of the stations are below 500 m a.s.l., and half are in the range 500–1500 m a.s.l. (Table 1 and Figure 1). The Abruzzo Region is bordered on the east by the Adriatic Sea, and on the west, by the Apennines. It is relatively homogeneous, with a gentle east–west gradient of both temperature and precipitation. The area east of the Apennines has a prevalent temperate climate without a dry season and hot summer, while the western part is more variable, from temperate, in the valleys to cold in the mountains. Large parts of the valleys are wet in summer [22]. Climatic historical series from the Hydrographic and Mareographic Office were checked for quality and homogenization, as detailed in Curci [22], according to international standards [23,24,25]. The homogenization procedure is based on the Climatologic algorithm.

2.2. Calculation of Chilling Accumulation

To estimate the average chilling unit (CU) accumulation under Abruzzo conditions, a chilling-hours model was used [10,26,27].
This model calculates the number of hours (H) in which the temperature (T) is below 7 °C, without considering freezing temperatures. The number of accumulated chilling hours (CHs) at a given time (t) after a fixed starting time is given as follows:
CH   t = i = 1 t H ;   if   0   ° C   <   T   <   7   ° C ,   then   add   1 ,   else   0 .
where T = hourly temperatures
Hourly temperatures, starting from the maximum and minimum daily temperatures, were estimated by using the Interpol T library of R [28].
The starting date for chilling accumulation was the 1st of November, as suggested by other researchers [10,26,27], since, before that date, the temperatures are too high to contribute notably to chilling accumulation. Based on other investigations [10,27], chilling accumulation was calculated until the end of February.

2.3. Calculation of Growing Degree Day

A growing degree day (GDD in °C) is defined as a day on which the mean daily temperature is 1 °C above the base temperature required for the growth of a particular plant. The heat requirement was obtained from the sum of daily mean temperature (Tmean) above the base temperature (Tbase), equal to 10 °C, for the period April–October [10].
GDD = i = 1 t = T mean T base ;   if   T mean   <   T base ,   then   add   0 .
where Tmean = average temperature obtained by the following ratio: (Tmaximun + Tminimun)/2
GDD is a useful tool to predict the flowering dates of catkins and female flowers of hazelnut cultivars [12,18].

2.4. Climatic Indexes

The variables considered were maximum and minimum temperatures (°C) and precipitation (mm). The daily data for the 40 years (1980–2019) were averaged to obtain weekly and monthly values. Annual rainfall and April–September rainfall were analyzed for decades.
Since the most important factor limiting the hazelnut production in the interior areas away from the coast are very low winter temperatures, the frequency of years with minimum temperatures below −10 °C from December through March was calculated for each station. Hazelnut, having early leaves, is very sensitive to spring frost, which could damage the small shoots [29].
To assess the spring frost risk at each station, the frequency of frost for the single decades of March and April was calculated as the percentage of the years with minimum temperatures lower than −4 °C and −2 °C.
Moreover, the temperature interval from 35 to 40°C is critical for the onset of stomatal limitation of gas exchange in hazelnut, and when summer temperatures rise above 36 °C, the fruit is damaged [4,15,30]. Therefore, the numbers of days with maximum temperatures above 30 °C and 35 °C were calculated.

2.5. Graphical Forms

Results of the climatic data analysis are reported in graphical form, using the geostatistical software SURFER 8 (Golden Software Inc., Golden, CO, USA).

2.6. Development of an Agro-Climatic Suitability Map (Reference Period 1980–2019)

GDD was not used as a climatic parameter to evaluate the suitability of each station for hazelnut growing, because it is a tool for predicting the flowering dates of catkins and female flowers already growing in a specific area [12,18]. In contrast, this study evaluated only the adaptability of this species to Abruzzo Region.
Using the following key climate parameters for hazelnut, an agro-climatic suitability map was built according to the following criteria:
(a)
The frequency of years with at least one daily minimum temperature < −10 °C in the period December–March: If more than 30%, the area is unsuitable (N); between 20 and 30%, it is not very suitable (S3); between 10 and 20%, it is moderately suitable (S2); and less than 10%, it is suitable (S1);
(b)
The number of days with maximum temperatures above 35 °C: if more than 10 days, the area is unsuitable (N); between 7 and 10 days, it is not very suitable (S3); between 5 and 7 days, it is moderately suitable (S2); and less than 5, it is suitable (S1).
The stations classified as unsuitable (N) or not very suitable (S3) for hazelnut cultivation (according to a and b) were not further evaluated. Those classified as moderately suitable (S2) or suitable (S1) were evaluated according to the following parameters:
(c)
The number of hours of chilling (680) required for Tonda di Giffoni variety [14]: If more than 680 h, the area is suitable (S1); between 600 and 680 h, it is moderately suitable (S2); between 500 and 600 h, it is not very suitable (S3); and less than 500 h, it is unsuitable (N);
(d)
Annual rainfall: If more than 800 mm, the area is suitable (S1); between 700 and 800 mm, it is moderately suitable (S2); between 500 and 700 mm, it is not very suitable (S3); and between 300 and 500 mm, it is unsuitable (N);
(e)
Frequency (in percentage) of years with minimum temperatures < −4 °C in the second decade of March: between 0 and 3%, the area is suitable (S1); between 3 and 4%, it is moderately suitable (S2); between 4 and 5%, it is not very suitable (S3); and more than 5%, it is unsuitable (N);
(f)
Frequency (as a percentage) of years with minimum temperatures < −4 °C in the third decade of March: between 0 and 2%, the area is suitable (S1); between 2 and 3%, it is moderately suitable (S2); between 3 and 4%, it is not very suitable (S3); and more than 4%, it is unsuitable (N);
(g)
The number of days with maximum temperatures above 30 °C: >40, the area is unsuitable (N); between 30 and 40, it is not very suitable (S3); between 20 and 30, it is moderately suitable (S2); and less than 20, it is suitable (S1).
The stations were classified as suitable for hazelnut cultivation if the parameters are all S1 or S1 with only one in S2; moderately suitable if a majority are S1 with a maximum of two S2 with no S3 or N; not very suitable if one or two are S3; and unsuitable if only one is S1.

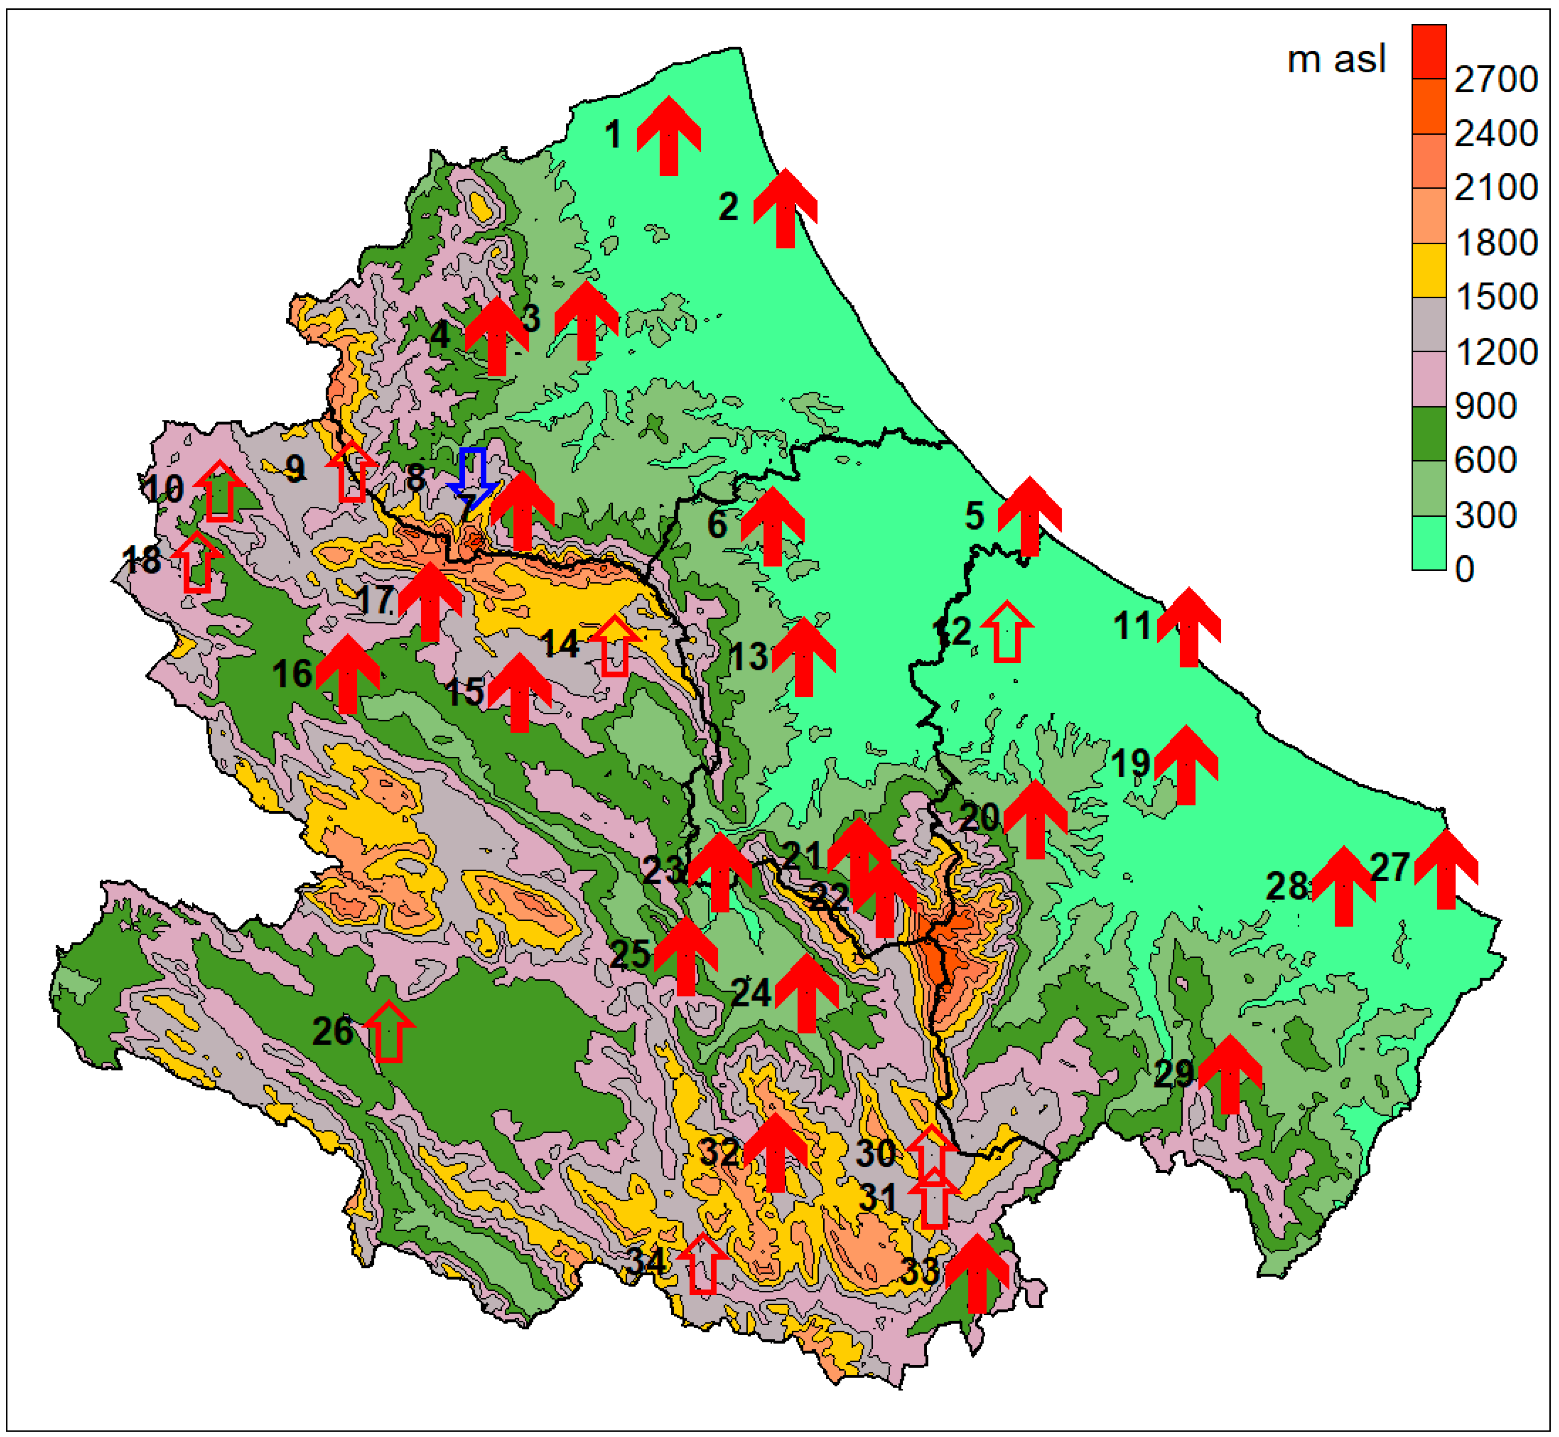
2.7. Mean Climatic Trends in the Abruzzo Region from 1980 to 2019

A climatic trend analysis was carried out to identify the areas where the hazelnut could face environmental conditions no longer suitable or now suitable for cultivation. The trends in the time series of the variables considered were analyzed by the non-parametric Mann–Kendall test [31,32]. The null hypothesis (H0) of this test is that no trend is present in the population from which the dataset under investigation was extracted, whilst the alternative hypothesis indicates the presence of an increasing or decreasing monotonous trend.
The test statistic indicated by S is given by the following:
S = i = 1 N 1 j = i + 1 N s i g n ( y j y i )
where N is the number of observations, and yi and yj are consecutive values of the variable under study. The sign function is defined as follows:
s i g n ( ϑ ) = {   1                 i f > ϑ 0   0                 i f ϑ = 0 1             i f ϑ < 0
Under the null hypothesis and for N ≥ 8, S follows a normal distribution, with a 0 mean and a variance approximately equal to the following:
V A R ( S ) = N ( N 1 ) ( 2 N + 5 ) p = 1 q t p ( t p 1 ) ( 2 t p + 5 ) 18
where q is the number of tied values, and tp is the number of tied values for the pth value. The test can be finally applied by referring to the standard deviate, Z:
Z = {   S 1 V A R ( S )                 i f   S > 0   0                                       i f   S = 0 S + 1 V A R ( S )             i f   S < 0
The p-value of the test is Z p v a l u e = 2 [ 1 Ф | Z | ] , where Ф is the cumulative probability function of the standardized normal distribution.
The Mann–Kendall test identifies the existence of a monotonous trend, but it cannot be measured; for this reason, as is usually performed in the literature, the non-parametric Theil–Sen slope estimator, b [33,34], was used to evaluate the slope of the straight lines interpolating the data. The Zyp [35] and Kendall packages of the R statistical software were used, respectively, to calculate the Theil–Sen non-parametric estimator and the p-value of the Mann–Kendall test.

3. Results

3.1. Chilling and Heat Accumulations and Climatic Indexes

The maximum and minimum temperatures are reported in Supplementary Tables S1 and S2. Maximum temperatures were found along the coastal strip and in the interior areas, where the microclimate is influenced by the mountains (Figure 1 and Supplementary Table S1). The frequencies of years with at least one daily minimum temperature < −10 °C in December–March were almost null in coastal stations, and in the hilly ones, until 300 m a.s.l. In contrast, in inland areas, the frequency of years with critical winter temperatures varies from 15.4 to 100% (Figure 1 and Supplementary Figure S1). In the interior areas, there was a greater frequency in the percentage of years with minimum temperatures < −4 °C in the second and third decade of March and less in the first decade of April (Supplementary Figure S2a–c). In the coastal and hilly areas, late frosts rarely occurred. On the contrary, late frosts in inland and mountainous areas occurred from 22.5 to 42.5% of the years (Figure 1 and Supplementary Figure S2c). In inland areas, at both high and medium altitudes, spring frosts in the first decade of April were much more frequent (Supplementary Figure S2d). In the last two decades of April, the temperatures dropped below −2 °C only in the mountainous areas and in the interior areas (Figure 1 and Supplementary Figure S2e,f). Regarding the maximum critical summer temperature, at only four stations, the temperature exceeded 35 °C (Figure 1 and Supplementary Figure S3a,b).
Annual rainfall was extremely variable (Figure 1 and Supplementary Figure S4). The low rainfall in some areas of the interior valleys is caused by a typical rain shadow effect due to the surrounding mountain ranges. Precipitation from April to September, in which the greater part of the vegetative cycle of the hazelnut takes place, ranged from 238 to 564 mm (Supplementary Figure S5).
The chilling-unit accumulation ranged from 776 to 1562.3 (Supplementary Figure S6). The highest accumulation of GDD was found at five stations located in the southern coastal area; the lowest was found in the interior and highest stations (Figure 1 and Supplementary Figure S7).

3.2. Classification of Stations for Hazelnut Growing

For vegetative buds, the chilling requirement, which is a major factor in identifying suitable areas for hazelnut cultivation, is still satisfied in all areas of the region. Therefore, other climatic parameters were investigated for developing an agro-climatic suitability map, as suggested by Benatti [36].
Suitability for cultivation is defined starting from the frequency of years where at least one daily minimum temperature drops below −10 °C in the period December–March: if more than 30%, the area is unsuitable for hazelnut cultivation; between 20 and 30%, it is not very suitable; between 10 and 20%, it is moderately suitable; and less than 10%, it is suitable.
Using this parameter, the following 14 stations were identified as unsuitable for hazelnut cultivation: 8, 9, 10, 14, 16, 17, 18, 22, 23, 30, 31, 32, 33, and 34, (Supplementary Figure S2). Likewise, three other stations were classified as not very suitable (24, 25, and 26), and one station was deemed to be moderately suitable (7). Despite being characterized by a limited frequency of years where the minimum temperature drops below −10 °C in the period December–March, Barisciano was classified as unsuitable, rather than moderately suitable because, between 1980 and 2019, the minimum temperature was below −4 °C during the second and even third decade of March in 8 out of 40 years (Supplementary Figure S2). The 15 other stations had no critical aspects regarding the minimum winter temperatures, not even the risk of late frosts, except for Teramo, where the minimum temperatures below −4 °C in the second decade of March for 8 out of 40 years. In addition, due to many days with maximum temperatures above 30 °C, this station was classified as not very suitable. The average annual number of days with high thermal stress, expressed as maximum temperatures over 35 °C, resulted as “moderate” in only one station: Teramo (Supplementary Figure S3b). In the remaining stations, the annual rainfall was suitable (Supplementary Figure S4).
The final climatic parameter used for classifying suitability for hazelnut cultivation is the average annual number of days with high thermal stress, expressed as temperatures exceeding 30 °C: if more than 40 days, the area is unsuitable; between 30 and 40, it is not very suitable; between 20 and 30, it is moderately suitable; and less than 20, it is suitable. According to the number of days with maximum temperatures over 30 °C (Supplementary Figure S3a), the stations were classified as follows: suitable = 11, 21, and 27; moderately suitable = 1, 2, 5, 6, 7, 12, 20, and 29; and not very suitable = 11, 13, 19, and 28.
According to the methodology described in Section 2.6, an agro-climatic suitability map was constructed (Figure 2).
The following five stations were classified as suitable (S1): 4, 6, 7, 21, and 27 (Figure 1 and Figure 2). Three stations were classified as moderately suitable (S2): 12, 20, and 29. Seven stations were classified as not very suitable (S3): 1, 2, 5, 11, 13, 19, 28. Nineteen stations were classified as unsuitable (N) (Figure 1 and Figure 2). The station 27 (Vasto), classified as suitable, is located close to the coast, as the stations 2, 5, and 11 are that result, on the contrary, to be not very suitable (Figure 2). This is because Vasto is located 144 m a.s.l. and not on sea level as the other three are (Table 1), with an orography that determines very different climatic conditions from those of the others three stations (Supplementary Tables S1 and S2).

3.3. Future Trends for Hazelnut Growing

Fourteen stations were classified as unsuitable for hazelnut cultivation due to the high frequency of years with at least one daily minimum temperature < −10 °C in December–March (Supplementary Figures S1). Despite this, the expected trends of the number of days with minimum temperatures below −10 °C showed that four stations (18, 30, 31, and 34) could, theoretically, become moderately suitable or suitable for hazelnut growing due to the trend for the frequency of the minimum critical temperatures to decrease (Figure 1 and Figure 3).
On the other hand, from 1980 to 2019, the number of days with temperatures above 30 °C showed an upward trend, which was significant in more than 70% of the stations (Figure 4).
The increase in the number of days with temperatures above 30 °C was estimated according to the significance of the non-parametric Theil–Sen slope estimator b (data not shown). According to this criterion, in the next 10 years the suitability classification of Vasto could shift from suitable to moderately suitable; on the contrary, Isola del Gran Sasso, Penne, Guardiagrele, Pescara, and Nereto could shift from moderate to not very suitable; and, finally, Catignano could shift from not very suitable to unsuitable.
Moreover, the analysis highlighted a significant increase in annual rainfall in eight stations (2, 3, 4, 5, 8, 9, 11, and 20) (Table 1, Figure 1, and Supplementary Figure S8) and a general increase in rainfall from April to September; it was significant at only nine stations (2, 3, 8, 7, 9, 14, 18, 23, and 25) (Figure 5).
An increase in warm-season precipitation was also reported by Curci [22] as a combined effect of increased precipitation in summer shoulder months (April–June and September) and a decrease in summer months (July–August).
The chilling units for hazelnut are highly accumulated, except for the stations located in the southern coast of the Abruzzo Region, where the minimum threshold was still reached but with a decreasing trend (Figure 1 and Figure 6 and Supplementary Figure S7a). Moderation of the winter climate has resulted in a significant reduction in the chilling units (CUs). The greatest decrease in chilling units in the period 1980–2019, and it occurred at the Chieti (12) station, with a decrease of about 400 units (Figure 1 and Supplementary Figure S9).
The spring–summer heating caused a significant increase in GDD at all the stations—even those located in the interior areas and those in the mountainous areas (Figure 7). The station that experienced the greatest increase in GDD in the period 1980–2019 was Vasto (27), with an increase in about 400 growing degree days (Supplementary Figure S10).

4. Discussion

The potential for future hazelnut cultivation in the Abruzzo Region, located in central–eastern Italy, was investigated, taking into account anticipated climatic changes. The rise of global temperatures and changes in precipitation patterns have been forecasted [37]. In the Mediterranean Basin, the annual mean temperature is 1.4 °C higher than late-nineteenth-century levels, mostly during the summer months.
Future warming in the Mediterranean region is expected to exceed global rates by 25%, notably with summer warming 40% more than the global mean [38]. This increase is expected to be associated with more frequent high-temperature events and heat waves. For each 1 °C of global warming, the mean rainfall will probably decrease by about 4% in most regions, particularly in the south [17].
Moreover, it has been reported that global warming [37] and minimum daily temperatures over the last 50 years have increased at a greater rate than maximum daily temperatures. Therefore, the amount of winter chilling at locations of the Abruzzo Region might be significantly affected in the future, as already observed by Črepinšek [10] in Northeastern Slovenia and by Jha [3] in Australia. This is a critical point because, as Mehlenbacher [14] reported, the chilling requirement of vegetative buds is a major factor in selecting areas suitable for hazelnut cultivation. The second factor is the phenological phase of leaf out, which may cause frost injury (late spring frost) when it occurs too early in the spring. On the other hand, the most important factor limiting hazelnut production in the interior areas, especially in the most mountainous areas, could be the very low winter temperatures, as temperatures below −8 °C cause tree and fruit damage [4,19].
Hazelnut is a temperate-climate plant, for which, ideally, the maximum temperature should not be higher than 35 °C, with relative humidity above 50% [30,39].
The study results pointed out that the maximum temperatures showed a significant upward trend in most of the stations in the Abruzzo Region. The use of several crop management techniques could lessen multiple summer stresses in hazelnut. For example, kaolin application makes it possible to grow hazelnut even in areas with heat-stress conditions, favoring significant improvement in kernel yield and the commercial quality of the nuts, such as fruit weight and fat content [15,16,17].
Since water stress leads to a decrease in photosynthesis [15,16], water is a key element for the growth and hazelnut yield [40,41]. Hazelnut requires regular annual precipitation, so summer droughts damage production and reduce yields. Therefore, a humid and temperate climate is needed [4]. However, in the subtropical regions with high temperatures (i.e., Valencia—Catalonia of Spain; the South of Italy; the Oregon region of the Pacific Coast of the USA and Washington State), commercial hazelnut orchards have been established with irrigation in the summer [4,15].
Hazelnut in temperate climates, such as the Abruzzo Region, with moderate/high annual rainfall (800–1000 mm) [39] and summer stress, should be cultivated only with irrigation, except for a few areas. Indeed, water stress is detrimental to hazelnut yield, especially in the second part of July and in the first half of August, when maximum oil accumulation in the kernel occurs [16,42].
According to the statistical data [43] referring to the administrative four provinces in which the Abruzzo Region is divided (Figure 1), hazelnut orchards are mainly concentrated (47%) in the province of Teramo (in the northeast of the region), 27% are in the province of L’Aquila (in the west), 22% are in the province of Chieti (in the south), and 4% are in the province of Pescara (in the central–eastern). Based on the agro-climatic suitability map (Figure 2) obtained in this study, all orchards planted in the province of L’Aquila are located in unsuitable areas for hazelnut growing. For the other provinces, the exact location of the various hazelnut plantations should be assessed, as there could be suitable or less suitable areas. This result suggests that coupling horticultural data with climatic data is critical before introducing a new crop for commercial purposes in a region. Although some of the areas in this study seem to be climatically suitable for hazelnut production, we strongly recommend that horticultural and pomological criteria, such as yield and nut quality, be studied in detail in small-scale pilot studies before starting extensive investments.
Moreover, the soil series type has to be considered when deciding where to plant a hazelnut orchard. Even if hazelnut plants can tolerate a wider range of conditions, hazelnut grows better on deep, fertile, well–drained soils with a pH between 6.0 and 7.5. Suitable soil types include sandy loam, loam, clay loam, and loamy clay, provided that the latter is not compacted [13]. The soil types of the Abruzzo Region have been classified and mapped, and the soils in the studied areas are classified as alkaline, with a pH between 7 and 8.5, from slightly to highly calcareous [44]. Although the soil maps give useful general information, further investigations are needed, including performing some on-site specific evaluations [45]. These soil characteristics are similar to those in Spain, where hazelnuts are grown mainly on calcareous loam soils with a pH > 7–8 [46]. Instead, they are very different from those observed in Corvallis (Oregon), which is the capital of production in the USA, where soils are acidic, pHs have a common range of 5.0 to 6.5, and soil liming before planting is recommended when the soil pH is below 6.4 [8,47]. Finally, the adaptation of cultivars to adverse soil conditions should also be studied in the Abruzzo Region in order to recommend the most suitable ones.

5. Conclusions

In conclusion, five areas were identified as suitable (S1), showing no critical parameters for growing hazelnut: Vasto, Penne, Santo Stefano, Isola del Gran Sasso, and Caramanico. Three areas were moderately suitable (S2), with only one non-optimal climatic parameter: Chieti, Montazzoli, and Guardiagrele. Seven stations, with two critical climatic parameters, were not very suitable (S3): Scerni, Lanciano, Ortona, and Pescara; and Catignano, Giulianova, and Nereto. Nineteen areas were unsuitable (N). Lastly, due mainly to the increase in the number of days with temperatures above 30 °C and, thus, in GDD, in the next 10 years, the suitability classification of the Vasto area could shift from suitable to moderately suitable; on the contrary, Isola del Gran Sasso, Penne, Guardiagrele, Pescara, and Nereto could shift from moderate to not very suitable; and, finally, Catignano could shift from not very suitable to unsuitable. Finally, in addition to assessing the climatic suitability, we recommend considering the soil characteristics in the areas identified as potentially suitable.

Supplementary Materials

The following supporting information can be downloaded at: https://www.mdpi.com/article/10.3390/horticulturae8070580/s1, Figure S1: Map of the Abruzzo Region that indicates, for the 34 weather stations, the frequency as a percentage of the years with at least one daily minimum temperature <-10 °C in the period December–March. The circles, which correspond to the stations, report the frequency and change from blue to red as the frequency of the climatic event increases. The number next to the circle indicates the numeric code of the meteorological station. The altitude classes are given on the top right. Figure S2: (a) Map of the Abruzzo Region that indicates, for the 34 weather stations, the frequency as a percentage of the years with minimum temperatures < −4 °C in the second decade of March; (b) the frequency as a percentage of the years with minimum temperatures < −4 °C in the third decade of March; (c) the frequency as a percentage of the years with minimum temperatures < −4 °C in the first decade of April; (d) the frequency as a percentage of the years with minimum temperatures < −2 °C in the first decade of April; (e) the frequency as a percentage of the years with minimum temperatures < −2 °C in the second decade of April; and (f) the frequency as a percentage of the years with minimum temperatures < −2 °C in the third decade of April. The circles, which correspond to the stations, report the frequency and change from blue to red as the frequency of the climatic event increases. The number next to the circle indicates the numeric code of the meteorological station. The altitude classes are given on the upper right. Figure S3: (a) Map of the Abruzzo Region that indicates, for the 34 weather stations, the number of days with maximum temperatures over 30 °C and (b) the number of days with maximum temperatures over 35 °C. The circles, which correspond to the stations, give the number of days and change from blue to red as the number increases. The number next to the circle indicates the numeric code of the meteorological station. The altitude classes are given on the upper right. Figure S4: Map of the Abruzzo Region that indicates, for each of the 34 meteorological stations, the annual rainfall, in mm (40-year average). The circles, which correspond to the stations, give the average annual rainfall and change from blue to red as the amount of rain increases. The number next to the circle indicates the numeric code of the meteorological station. The altitude classes are given on the upper right. Figure S5: Map of the Abruzzo Region that indicates, for each of the 34 meteorological stations, the rainfall (in mm) from April to September (40-year average). The circles, which correspond to the stations, give the average rainfall from April to September and change from blue to red as the rain increases. The number next to the circle indicates the numeric code of the meteorological station. The altitude classes are given on the upper right. Figure S6: Map of the Abruzzo Region that indicates, for each of the 34 meteorological stations, the chilling unit accumulation (40-year average). The circles, which correspond to the stations, give the chilling hours’ accumulation and change from blue to red as the value increases. The number next to the circle indicates the numeric code of the meteorological station. The altitude classes are given on the upper right. Figure S7: Map of the Abruzzo Region that indicates, for each of the 34 meteorological stations, the growing degree day (GDD in °C) accumulation from April to October (40-year average). The circles, which correspond to the stations, give the GDD and change from blue to red as the value increases. The number next to the circle indicates the numeric code of the meteorological station. The altitude classes are given on the upper right. Figure S8: Analysis of annual rainfall trends. The downward arrows indicate decreasing trends, while the upward arrows denote increasing trends. Full arrows indicate significant trends with p < 0.05, while empty arrows indicate no significance. The red arrows represent a trend of decrease in rain, while the blue arrows represent a trend of increase in rain. The altitude classes are given on the upper right. Figure S9: Trend in chilling hours accumulated in Chieti (CN 5) from 1980 to 2019. Orange circles represent the value of CU each year. Figure S10: Trend in growing degree days at Vasto (CN 2) from 1980 to 2019. Blue circles represent the value of GDD each year. Table S1: Annual maximum temperatures (T. max), monthly maximum temperatures (40-year averages), and coefficient of variation per station and month.; Table S2: Annual minimum temperatures (T. min), monthly minimum temperatures (40-year averages), and coefficient of variation per station and month.

Author Contributions

Conceptualization, B.D.L. and D.F.; methodology, D.F.; software, B.D.L. and G.C.; validation, B.D.L. and G.C.; formal analysis, B.D.L.; investigation, B.D.L.; resources, B.D.L.; data curation, B.D.L., L.V. and G.C.; writing—original draft preparation, D.F.; writing—review and editing, B.D.L., L.V. and D.F.; visualization, D.F.; supervision, D.F.; project administration, none; funding acquisition, none. All authors have read and agreed to the published version of the manuscript.

Funding

This research received no external funding.

Institutional Review Board Statement

Not applicable.

Conflicts of Interest

The authors declare no conflict of interest.

References

  1. FAOSTAT. Food Balance. Available online: https://www.fao.org/faostat/en/#search/Hazelnuts%2C%20with%20shell (accessed on 4 March 2022).
  2. ISTAT ‘Coltivazioni olColtivazioni Legnose Fruttifere. 2021. Available online: http://dati.istat.it/Index.aspx?QueryId=33705 (accessed on 7 March 2022).
  3. Jha, P.K.; Materia, S.; Zizzi, G.; Costa-Saura, J.M.; Trabucco, A.; Evans, J.; Bregaglio, S. Climate change impacts on phenology and yield of hazelnut in Australia. Agric. Syst. 2020, 186, 102982. [Google Scholar] [CrossRef]
  4. An, N.; Turp, M.T.; Türkeş, M.; Kurnaz, M.L. Mid-term impact of climate change on hazelnut yield. Agriculture 2020, 10, 159. [Google Scholar] [CrossRef]
  5. Ustaoglu, B.; Karaca, M. The Effects of Climate Change on Spatiotemporal Changes of Hazelnut (Corylus avellana) Cultivation Areas in the Black Sea Region, Turkey. Appl. Ecol. Environ. Res. 2014, 12, 309–324. [Google Scholar] [CrossRef]
  6. Challinor, A.J.; Slingo, J.M.; Wheeler, T.R.; Craufurd, P.Q.; Grimes, D.I.F. Toward a Combined Seasonal Weather and Crop Productivity Forecasting System: Determination of the Working Spatial Scale. J. Appl. Meteorol. 2003, 42, 175–192. [Google Scholar] [CrossRef]
  7. Beyhan, N.; Odabaş, F. The climate factor’s effects on the yield in hazelnut and importance for growing. Ondokuz Mayıs Univ. J. Agric. Fac. 1996, 11, 177–188. [Google Scholar]
  8. Baldwin, B.J. The Growth and Productivity of Hazelnut Cultivars (Corylus avellana L.) in Australia. Doctor of Philosophy Faculty of Rural Management University of Sydney, July 2015. Available online: https://ses.library.usyd.edu.au/handle/2123/12892 (accessed on 4 March 2022).
  9. Piskornik, Z.; Wyzgolik, G.; Piskornik, M. Flowering of Hazelnut Cultivars from Different Regions under the Climatic Conditions of Southern Poland. Acta Hortic. 2000, 556, 529–536. [Google Scholar] [CrossRef]
  10. Crepinsek, Z.; Štampar, F.; Kajfež-Bogataj, L.; Solar, A. The response of Corylus avellana L. phenology to rising temperature in north-eastern Slovenia. Int. J. Biometeorol. 2012, 56, 681–694. [Google Scholar] [CrossRef]
  11. Orlandi, F.; Ruga, L.; Bonofiglio, T.; Romano, B.; Fornaciari, M. Fifteen-year phenological plant species and meteorological trends in central Italy. Int. J. Biometeorol. 2014, 58, 661–667. [Google Scholar] [CrossRef]
  12. von Bennewitz, E.; Ramírez, C.; Muñoz, D.; Cazanga-Solar, R.; Losak, T.; Alba-Mejía, J.E.; Maureira-Butler, I. Fenología, sincronización polínica y características frutales de avellano europeo (Corylus avellana L.) cv.” Tonda de gifoni” en tres localidades de Chile central. Rev. De La Fac. De Cienc. Agrarias. Univ. Nac. De Cuyo 2019, 51, 55–67. [Google Scholar]
  13. Mehlenbacher, S.A. Hazelnuts (Corylus). Acta Hortic. 1991, 290, 791–838. [Google Scholar] [CrossRef]
  14. Mehlenbacher, S.A. Chilling requirements of hazelnut cultivars. Sci. Hortic. 1991, 47, 271–282. [Google Scholar] [CrossRef]
  15. Luciani, E.; Palliotti, A.; Tombesi, S.; Gardi, T.; Micheli, M.; Berrios, J.G.; Zadra, C.; Farinelli, D. Mitigation of multiple summer stresses on hazelnut (Corylus avellana L.): Effects of the new arbuscular mycorrhiza Glomus iranicum tenuihypharum sp. nova. Sci. Hortic. 2019, 257, 108659. [Google Scholar] [CrossRef]
  16. Portarena, S.; Gavrichkova, O.; Brugnoli, E.; Battistelli, A.; Proietti, S.; Moscatello, S.; Famiani, F.; Tombesi, S.; Zadra, C.; Farinelli, D. Carbon allocation strategies and water uptake in young grafted and own-rooted hazelnut (Corylus avellana L.) cultivars. Tree Physiol. 2022, 42, 939–957. [Google Scholar] [CrossRef] [PubMed]
  17. Luciani, E.; Palliotti, A.; Frioni, T.; Tombesi, S.; Villa, F.; Zadra, C.; Farinelli, D. Kaolin treatments on Tonda Giffoni hazelnut (Corylus avellana L.) for the control of heat stress damages. Sci. Hortic. 2019, 263, 109097. [Google Scholar] [CrossRef]
  18. Taghavi, T.; Rahemi, A.; Dale, A.; Galic, D.; Kelly, J. Hazelnut floral phenology in southern Ontario. Can. J. Plant Sci. 2021, 101, 803–817. [Google Scholar] [CrossRef]
  19. Baldwin, B. The Effects of Site and Seasonal Conditions on Nut Yield and Kernel Quality of Hazelnut Genotypes Grown in Australia. Acta Hortic. 2009, 845, 83–88. [Google Scholar] [CrossRef]
  20. Orlandi, F.; Ranfa, A.; Ruga, L.; Fornaciari, M. Hazelnut phenological phases and environmental effects in two central Italy areas. J. Agric. Meteorol. 2019, 75, 137–143. [Google Scholar] [CrossRef]
  21. Corte, M.; Pizzinat, A.; Sonnati, C. Nocciolo in Piemonte Linee Tecniche per una Corilicoltura Sostenibile; AGRION, TI-POLITOEUROPA: Cuneo, Italy, 2019; p. 8. [Google Scholar]
  22. Curci, G.; Guijarro, J.A.; Di Antonio, L.; Di Bacco, M.; Di Lena, B.; Scorzini, A.R. Building a local climate reference dataset: Application to the Abruzzo region (Central Italy), 1930–2019. Int. J. Clim. 2021, 41, 4414–4436. [Google Scholar] [CrossRef]
  23. Fioravanti, G.; Piervitali, E.; Desiato, F. Recent changes of temperature extremes over Italy: An index-based analysis. Arch. Meteorol. Geophys. Bioclimatol. Ser. B 2015, 123, 473–486. [Google Scholar] [CrossRef]
  24. Peterson, T.C.; Vose, R.; Schmoyer, R.; Razuvaëv, V. Global historical climatology network (GHCN) quality control of monthly temperature data. Int. J. Clim. 1998, 18, 1169–1179. [Google Scholar] [CrossRef]
  25. World Meteorological Organization (WMO). Guide to Instruments and Methods of Observation; WMO: Geneva, Switzerland, 2018. [Google Scholar]
  26. Luedeling, E.; Zhang, M.; McGranahan, G.; Leslie, C. Validation of winter chill models using historic records of walnut phenology. Agric. For. Meteorol. 2009, 149, 1854–1864. [Google Scholar] [CrossRef]
  27. Ruiz, D.; Campoy, J.; Egea, J. Chilling and heat requirements of apricot cultivars for flowering. Environ. Exp. Bot. 2007, 61, 254–263. [Google Scholar] [CrossRef]
  28. Eccel, E.; Cordano, E. Interpol. T: Hourly Interpolation of Multiple Temperature Daily Series. 2012. Available online: https://openpub.fmach.it/handle/10449/20808 (accessed on 7 March 2022).
  29. Bergoughoux, F.; Germain, E.; Sarraquigne, J.P. The Hazelnut. Production and Culture; INVUFEC: Paris, France, 1978; pp. 1–98. [Google Scholar]
  30. Cincera, I.; Frioni, T.; Ughini, V.; Poni, S.; Farinelli, D.; Tombesi, S. Intra-specific variability of stomatal sensitivity to vapour pressure deficit in Corylus avellana L.: A candidate factor influencing different adaptability to different climates? J. Plant Physiol. 2019, 232, 241–247. [Google Scholar] [CrossRef] [PubMed]
  31. Mann, H.B. Nonparametric tests against trend. Econometrica 1945, 13, 245–259. [Google Scholar] [CrossRef]
  32. Kendall, M. Rank Correlation Methods, 4th ed.; Charles Griffin: San Francisco, CA, USA, 1975; Volume 8, p. 875. [Google Scholar]
  33. Theil, H. Estimation of Parameters of Econometric Models. In Henri Theil’s Contributions to Economics and Econometrics: Econo-metric Theory and Methodology; Raj, B., Koerts, J., Eds.; Springer: Dordrecht, The Netherlands, 1992; pp. 109–116. [Google Scholar] [CrossRef]
  34. Sen, P.K. Estimates of the regression coefficient based on Kendall’s tau. J. Am. Stat. Assoc. 1968, 63, 1379–1389. [Google Scholar] [CrossRef]
  35. Bronaugh, D.; Werner, A. Zhang + Yue-Pilon Trends Package ZYP. 2019. Available online: https://www.r-project.org (accessed on 6 February 2022).
  36. Benatti, N.; Laruccia, N.; Magazzini, P.; Marchi, N.; Piretta, F.; Pratizzoli, W.; Tombesi, S. Le carte di attitudine alla coltivazione intensiva del nocciolo. Riv. Fruttic. E Ortofloric. 2019, 10, 32–35. [Google Scholar]
  37. Stocker, T.F.; Qin, D. Climate Change 2013 the Physical Science Basis. Contribution of Working Group I to the Fifth Assessment Report of the Intergovernmental Panel on Climate Change; Cambridge University Press: Cambridge, UK, 2013; pp. 33–115. [Google Scholar]
  38. Cramer, W.; Guiot, J.; Fader, M.; Garrabou, J.; Gattuso, J.-P.; Iglesias, A.; Lange, M.A.; Lionello, P.; Llasat, M.C.; Paz, S.; et al. Climate change and interconnected risks to sustainable development in the Mediterranean. Nat. Clim. Chang. 2018, 8, 972–980. [Google Scholar] [CrossRef] [Green Version]
  39. Fideghelli, C.; De Salvador, F. World Hazelnut Situation and Perspectives. Acta Hortic. 2009, 845, 39–52. [Google Scholar] [CrossRef]
  40. Mingeau, M.; Rousseau, P. Water Use of Hazelnut Trees as Measured with Lysimeters. Acta Hortic. 1994, 351, 315–322. [Google Scholar] [CrossRef]
  41. Tombesi, A. Influence of Soil Water Levels on Assimilation and Water Use Efficiency in Hazelnut. Acta Hortic. 1994, 351, 247–256. [Google Scholar] [CrossRef]
  42. Gonçalves, B.; Silva, A.; Bacelar, E.; Correia, C.; Santos, A.; Ferreira, H.; Moutinho-Pereira, J. Effect of Training System on Hazelnut (Corylus avellana) Physiology. Acta Hortic. 2009, 845, 239–244. [Google Scholar] [CrossRef]
  43. SIAN (Sistema Sincronizzazione AGEA-Agenzia per le Erogazioni in Aagricoltura) Regione Abruzzo. Available online: www.sian.it (accessed on 13 June 2022).
  44. Chiuchiarelli, I.; Paolanti, M.; Rivieccio, R.; Santucci, S. Atlante dei Suoli, Carta dei Suoli Della Regione Abruzzo; ARSSA Regione Abruzzo: Avezzano, Italy, 2006. [Google Scholar]
  45. Olsen, J. Growing Hazelnuts in the Pacific Nothwest Orchard Site Selection, Oregon State University Extension Service. 2013. Available online: https://catalog.extension.oregonstate.edu/em9076 (accessed on 18 June 2022).
  46. Tous, J. Hazelnut Production in Spain. Acta Hortic. 2005, 686, 659–664. [Google Scholar] [CrossRef]
  47. Cacka, J.; Sanguankeo, P. Calcium Influence on Hazelnut Quality and Yields in Oregon. Acta Hortic. 2014, 1052, 187–193. [Google Scholar] [CrossRef]
Figure 1. Map of the Abruzzo Region with the names and numeric codes of the 34 meteorological stations and, on the upper right, the altitude classes. The names of the administrative provinces are in blue for each area. The map of Italy with the location of the Abruzzo Region is on the upper left.
Horticulturae 08 00580 g001
Figure 2. Agro-climatic suitability map (reference period 1980–2019), where S1 indicates an area suitable for hazelnut cultivation, S2 moderately suitable, S3 not very suitable, and N unsuitable, with numeric codes of the 34 meteorological stations on the left of each letter of suitability and with the altitude classes given on the upper right.
Horticulturae 08 00580 g002
Figure 3. Map of the Abruzzo Region, indicating the increasing or decreasing trends of the number of days with minimum temperatures below −10 °C. The downward arrows indicate decreasing trends, while the upward arrows indicate increasing trends. Full arrows indicate significant trends with p < 0.05, while empty arrows indicate no significance. The number next to the arrow indicates the numeric code of the meteorological station. The red arrows represent a warming trend, while the blue arrows represent a cooling trend. The altitude classes are given on the upper right.
Horticulturae 08 00580 g003
Figure 4. Map of the Abruzzo Region, indicating the increasing or decreasing trends of the number of days with maximum temperatures over 30 °C. The downward arrow indicates a decreasing trend, while the upward arrows indicate increasing trends. Full arrows indicate significant trends with p < 0.05, while empty arrows indicate no significant trends. The number next to the arrow indicates the numeric code of the meteorological station. The red arrows represent a warming trend, while the blue arrows represent a cooling trend. The altitude classes are given on the upper right.
Horticulturae 08 00580 g004
Figure 5. Trends in rainfall from April to September. The downward arrows indicate decreasing trends, while the upward arrows indicate increasing trends. Full arrows indicate significant trends with p < 0.05, while empty arrows indicate no significance. The number next to the arrow indicates the numeric code of the meteorological station. The red arrows represent a trend of decrease in rain, while the blue arrows represent a trend of increase in rain. The altitude classes are given on the upper right.
Horticulturae 08 00580 g005
Figure 6. Trend in chilling hours accumulated from November to February. The downward arrows indicate decreasing trends, while the upward arrows denote increasing trends. Full arrows indicate significant trends with p < 0.05, while empty arrows indicate no significance. The number next to the arrow indicates the numeric code of the meteorological station. The red arrows represent a warming trend, while the blue arrows represent a cooling trend. The altitude classes are given on the upper right.
Horticulturae 08 00580 g006
Figure 7. Analysis of GDD trends accumulated in the period April–October. The upward arrows denote increasing trends. Full arrows indicate significant trends with p < 0.05. The red arrows represent a warming trend. The number next to the arrow indicates the numeric code of the meteorological station. The altitude classes are given on the upper right.
Horticulturae 08 00580 g007
Table 1. Name of meteorological station, code number, geographical coordinates, and altitude of each station.
Station
Name
Numeric
Code
Latitude 1Longitude 1Altitude
(m a.s.l.)
Nereto142°49′08″ N13°48′58″ E142
Giulianova242°45′12″ N13°58′00″ E68
Teramo342°39′29″ N13°41′59″ E265
Santo Stefano442°39′13″ N13°36′16″ E790
Pescara542°28′11″ N14°12′21″ E4
Penne642°27′29″ N13°55′38″ E438
Isola del Gran Sasso742°30′02″ N13°39′48″ E660
Pietracamela842°31′25″ N13°33′19″ E1005
Campotosto942°33′32″ N13°22′05″ E1300
Montereale1042°31′30″ N13°14′39″ E945
Ortona1142°20′59″ N14°24′14″ E72
Chieti1242°20′41″ N14°09′57″ E330
Catignano1342°20′46″ N13°57′00″ E335
Castel del Monte1442°21′54″ N13°43′36″ E1346
Barisciano1542°19′30″ N13°35′30″ E940
L’Aquila1642°20′56″ N13°23′53″ E714
Assergi1742°24′55″ N13°30′26″ E895
Termine1842°15′36″ N13°35′01″ E841
Lanciano1942°13′50″ N14°23′27″ E265
Guardiagrele2042°11′43″ N14°13′11″ E576
Caramanico2142°22′40″ N14°18′38″ E650
S. Eufemia a Maiella2242°07′34″ N14°01′35″ E878
Popoli2342°10′17″ N13°49′58″ E260
Sulmona2442°02′51″ N13°55′37″ E420
Goriano Sicoli2542°04′52″ N13°46′28″ E720
Avezzano2642°02′05″ N13°25′35″ E695
Vasto2742°07′28″ N14°42′21″ E144
Scerni2842°06′43″ N14°34′12″ E276
Montazzoli2941°57′25″ N14°25′54″ E850
Pescocostanzo3041°53′11″ N14°03′56″ E1395
Roccaraso3141°51′00″ N14°04′42″ E1236
Scanno3241°54′14″ N13°52′49″ E930
Castel di Sangro3341°47′03″ N14°06′29″ E800
Pescasseroli3441°48′30″ N13°47′21″ E1167
1 World Geodetic System 84 (WGS 84).
Publisher’s Note: MDPI stays neutral with regard to jurisdictional claims in published maps and institutional affiliations.

