Article

Evaluation of Suitable Water–Zeolite Coupling Regulation Strategy of Tomatoes with Alternate Drip Irrigation under Mulch

College of Water Resource Science and Engineering, Taiyuan University of Technology, Taiyuan 030024, China
*
Author to whom correspondence should be addressed.
Horticulturae 2022, 8(6), 536; https://doi.org/10.3390/horticulturae8060536
Submission received: 1 May 2022 / Revised: 14 June 2022 / Accepted: 14 June 2022 / Published: 16 June 2022

Abstract

:
The water (W; W50, W75, and W100)–zeolite (Z; Z0, Z3, Z6 and Z9) coupling (W-Z) regulation strategy of high-quality and high-yield tomato was explored with alternate drip irrigation under mulch. Greenhouse planting experiments were used in monitoring and analyzing tomato growth, physiology, yield, quality, and water use efficiency (WUE). Suitable amounts of W and Z for tomato growth were determined through the principal component analysis (PCA) method. Results showed that tomato plant height (Ph), stem thickness (St), root indexes, leaf area index (LAI), photosynthetic rate (Pn), transpiration rate (Tr), stomatal conductance (Gs), organic acid (OA), and yield showed a positive response to W, whereas nitrate (NC), vitamin C (VC), soluble solid (SS), intercellular CO2 concentration (Ci), fruit firmness (Ff), and WUE showed the opposite trend. The responses of Ci and Ff to Z were first negative and then positive, whereas the responses of other indexes to Z showed an opposite trend (except yield under W50). The effects of W, Z, and W-Z on tomato growth, physiological, and quality indexes and yield were as follows: W > Z > W-Z; the effects on WUE were as follows: Z > W > W-Z. The two principal components of growth factor and water usage factor were extracted, and the cumulative variance contribution rate reached 93.831%. Under different treatments for tomato growth, the comprehensive evaluation score F was between −1.529 and 1.295, the highest treated with Z6W100, the lowest treated with Z0W50. The PCA method showed that under the condition of alternate drip irrigation under mulch, the most suitable W for tomato planting was 100% E (E is the water surface evaporation), and the amount of Z was 6 t·ha−1.

1. Introduction

Tomatoes are popular worldwide and a high water-dependent horticultural crop, cultivated in open fields and greenhouses [1]. Water stress has negative effects on biochemical and physiological systems and affects the healthy development of crops [2]. Adding zeolite (Z) can improve soil water retention [3], improve the ability of crop roots to absorb and utilize soil water [4], and reduce the impact of water stress on crop growth and physiological development [5]. Alternate drip irrigation is an effective irrigation method that saves water and regulates soil quality. It has the advantages of low degree of soil evaporation, water conservation, high yield, and high irrigation efficiency [6]. On the basis of the coupling strategy of Z modifier and alternate irrigation, this paper is expected to further enrich the alternative irrigation theory, explore the potential of agricultural water conservation, and promote the efficient utilization of water resources and tomato yield and quality.
Previous studies mainly revealed the effects of Z on tomato growth [7], yield [8,9], and dry matter [10]. However, studies on the effects of Z on photosynthetic characteristics, WUE, and root growth of tomato during growth period are few. The effects of W on the yield of tomato under drip irrigation and furrow irrigation [11,12,13], root growth under alternate partial root-zone irrigation [14,15], nutritional quality under drip irrigation [11], WUE under furrow irrigation [12], and other indicators [16,17] have been studied more. However, the effect of coupled water (W) regulation strategy combined with alternate drip irrigation under mulch and Z improvement on the growth and development of tomato throughout the growth period is still unclear. Owing to significant spatial variability in soil water between the dry and wet areas of alternate drip irrigation under mulch, the resulting physiological stimulation effect of the rhizosphere, and excellent water absorption and water retention performance of Z, the response of soil wetting body rhizosphere and crop growth and physiology under this coupled W regulation strategy must be different from that under conventional drip irrigation and furrow irrigation. Although the effects of a single factor of W or Z on crop growth have been clarified [8,12,15], the primary and secondary relationships between the effects of W and Z on tomato are unknown. The W-Z strategy has a synergistic effect on potato yield [18], soybean growth, and seed quality [19], and bean yield and WUE [20]. However, effects on the root growth, photosynthetic characteristics, and nutrient quality of tomato remain unclear.
PCA uses the idea of dimensionality reduction to convert multiple indicators with many correlations into few comprehensive indicators, so that the comprehensive performance of each indicator can be accurately determined. PCA has been widely applied to agriculture. For instance, it was used in establishing a comprehensive evaluation model of plant height (Ph), stem thickness (St), yield, and WUE for green pepper growth [21] and a comprehensive evaluation model of yield, WUE, and nutritional quality for potato growth [22]. However, these previous models did not involve crop root growth and physiological indicators. The root systems of plants are the main organs that absorb water and mineral nutrients, and their form and configurations largely determine the ability of plants to acquire nutrients [23]. Photosynthesis is the material basis for crop yield formation and improving crop light energy utilization efficiency is one of the important ways to improve crop yield [24]. Therefore, incorporating tomato root growth, photosynthetic physiology, and other indicators into the comprehensive evaluation model may be reasonable and objective.
The objective of this paper is to study the effects of W-Z effect of alternate drip irrigation under mulch on tomato to construct a comprehensive evaluation model of tomato growth on the basis of growth, physiology, quality, yield, and WUE. The suitable W and Z amount for tomato growth were clarified to provide theoretical guidance for tomato planting under the condition of alternate drip irrigation under mulch.

2. Materials and Methods

2.1. Experimental Site

The test was carried out in the greenhouse of the High-efficiency Water-saving Demonstration Base of Shanxi Water Conservancy and Hydropower Research Institute. The average altitude of the area is 763–780 m, and the site has warm temperate continental climate. The annual average precipitation is about 468.4 mm, annual average evaporation is 1812.7 mm, and annual average temperature is 9.5 °C. The test soil was clayey loam with a saturated water content of 0.44 cm3·cm−3, and the field water holding rate was 0.28 cm3·cm−3. The experimental irrigation water source was the fresh water well in the base.

2.2. Experimental Design

This experiment studied the growth characteristics of tomato under different W and Z amounts. Here, W was set at three levels: W50, W75, and W100, which were 50%, 75%, and 100% water surface evaporation (E), respectively. Meanwhile, Z was set at four levels: Z0, Z3, Z6, and Z9, which were 0, 3, 6, and 9 t·ha−1, respectively. The experiment adopted a comprehensive experimental design with 12 treatments in total, and each treatment was repeated three times. The experimental tomato (Ao-guan No. 8) was planted in a film-mulched ridge planting mode. The ridge length was 6 m, the ridge surface width was 0.8 m, the ridge height was 0.15 m, and the ridge width was 0.6 m. A total of 30 tomato plants were planted in each row with a row spacing of 0.4 m × 0.4 m. According to local planting habits, all plots were managed in the same field. The irrigation method was alternate irrigation under mulch. Two drip irrigation belts were laid in each ridge, the distance between drip heads was 40 cm, and the working flow was 1.2 L·h−1. Irrigation was performed once every 4 days, and drip irrigation was conducted with one-side irrigation. The type of zeolite used in this study was the 4A zeolite purchased from Shanxi Taiheng Technology Co., Ltd. (Shanxi, China). Before tomato planting, zeolite was mixed into the soil to a depth of 30 cm. Tomato plants were transplanted on 4 June 2020, and the end time was 7 October 2020.

2.3. Measurement Parameters and Methods

(1) Ph and St: three tomatoes with similar growth rates at the seedling stage were selected and Ph was measured from the stem base of each tomato to the growth point with a tape measure. The accuracy was 1 mm. St below the first lateral branch of tomato stem base was measured with a digital vernier caliper with an accuracy of 0.01 mm.
(2) Root characteristic parameters: in the harvest period, three tomato plants with the same growth rates were randomly selected from each treatment. With the plants as the center, the whole root was excavated in the quadrats with an area of 40 cm × 40 cm and depth of 60 cm, and the whole root was removed and washed with water for the removal of debris. A V700 scanner (EPSON company, Nagano, Japan) was used for root scanning, and Win RHIZO 2003 software was used in analyzing and obtaining root characteristic parameters, such as total root length (RL), total root surface area (RS), and total root volume (RV).
(3) LAI: in each growth period, three representative plants were selected from each treatment, the leaf area was measured, and the average value was taken.
(4) Physiological indexes: during the expansion period of tomato fruit, clear and cloudless weather was selected, and photosynthesis was measured with an Li-6400 portable photosynthetic instrument. The measurement time was 9:00–11:00. The leaf selection principle was at the same position and the same leaf age.
(5) Ff: Ff was measured with GYJ-4 hardness tester.
(6) Nutritional quality: determination of OA by NaOH titration [25], determination of VC with molybdenum blue colorimetry [26], determination of NC by sulfuric acid salicylic acid method [27], and determination of SS with PAL-1 handheld refractometer [28]. The average of three measurements was obtained as the final measurement.
(7) Yield: yield was measured with an electronic scale and had an accuracy of 0.01 kg.

2.4. Data Processing and Statistical Analysis

Microsoft Office 2020 was used for data calculation, IBM SPSS statistics 25 was used for two-way ANOVA and principal component analysis, GSTA V7.0 for gray correlation analysis, and Origin 2018 was used for drawing.

3. Results

3.1. Effects of W-Z on the Soil Moisture Dynamics

Figure 1 shows the effects of W-Z on soil moisture dynamics subjected to alternate drip irrigation under mulch. As shown in Figure 1, soil moisture content with different treatments, ranging from 16.84% to 33.65%, showed sawtooth fluctuations with time growth. In the range of seedling stage and fruit expansion stage (19 July to 12 September 2020), which belongs to the vegetative and reproductive growth process, soil moisture content decreased with increased time, attributed to increased water transpiration consumption, caused by the rapid development of the rhizosphere system and functional leaves. In the range of the fruit harvest stage (12 to 30 September 2020), soil moisture content stabilized with the increased time, attributed to the stabilization of plant growth and transpirational water consumption. As shown in Figure 1, soil moisture content increased by an average of 0.69–10.38% with the increased W from W50 to W100, and increased by an average of 0.98–5.79% with the increased Z from Z0 to Z9, respectively. This indicates that the increase in W and Z have different degrees of promoting effects on soil water content.

3.2. Effects of W-Z on the Growth and Physiological Characteristics of Tomato

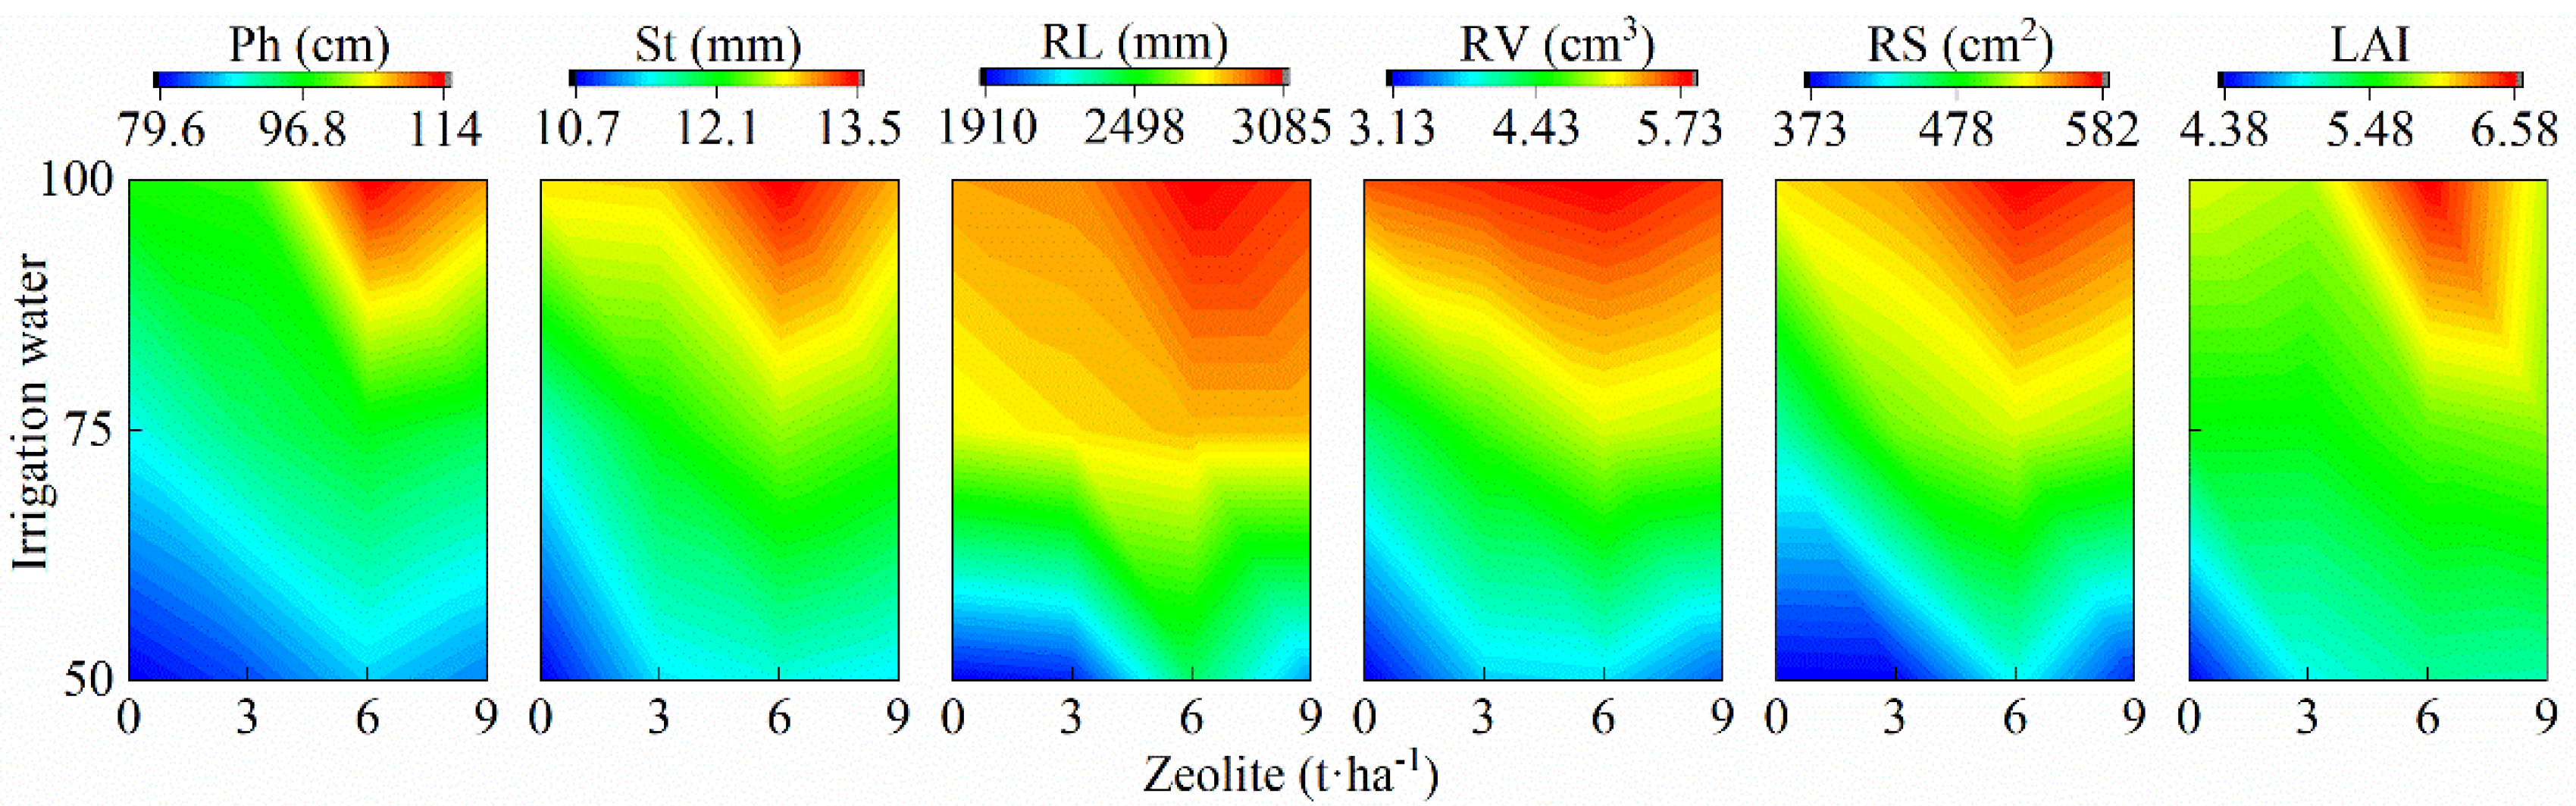
3.2.1. Effects of W-Z on Tomato Growth

Figure 2 shows the effect of W-Z on tomato growth indicators during alternate drip irrigation under mulch. Figure 2 shows that under the conditions of Z0, Z3, Z6, and Z9, when W increased from W50 to W100, tomato Ph, St, RL, RS, RV, and LAI increased monotonically by 19.78–31.30%, 13.57–20.43%, 29.10–50.84%, 35.46–47.88%, 53.91–77.96%, and 14.55–35.67%, respectively. This result showed that an increase in W can significantly (p < 0.01) promote tomato growth between W and Z and have synergistic effects on tomato growth. Figure 2 also shows that under the conditions of W50, W75, and W100, when Z increased from Z0 to Z6, Ph, St, RL, RS, and RV, these increased monotonically by 8.32–16.55%, 5.14–8.42%, 3.51–24.70%, 9.08–16.98%, and 4.67–20.13%, respectively. When Z increased from Z6 to Z9, Ph, St, RL, RS, and RV decreased by 2.08–4.91%, 1.13–3.85%, 0.07–11.64%, 2.49–11.04%, and 2.19–9.84%, respectively. However, under the conditions of W50, W75 and W100, when the amount of zeolite changed, the change in LAI was not regular. This result showed that the effects of increased Z on Ph (p < 0.01), St, and root system growth (p < 0.01) were first accelerated and then suppressed and the response trends and intensities of Ph and St to Z were relatively affected by W factors. In the Z0Z6 range, the amounts of W and Z had a synergistic effect on tomato growth but exerted antagonistic effects in the Z6Z9 range. Two-way ANOVA showed that the W-Z effect had a significant effect (p < 0.01) on Ph, RL, and RS, had a significant effect (p < 0.05) on LAI, but had no significant effect on St and RV. We found that the sum of the squares was for Ph (2778.95, 557.89, 170.54), St (20.38, 3.09, 0.54), RL (5,290,316.26, 348,892.52, 157,083.72), RS (170,236.82, 16,600.85, 3818.61), RV (28.87, 1.54, 0.55), and LAI (136.28, 16.10, 3.94) under the effects of W, Z, and W-Z, respectively. The effects of W, Z, and W-Z on Ph, St, RL, RS, RV, and LAI of tomato were as follows: W > Z > W-Z. The W factor played a leading role in tomato growth (Table S1).

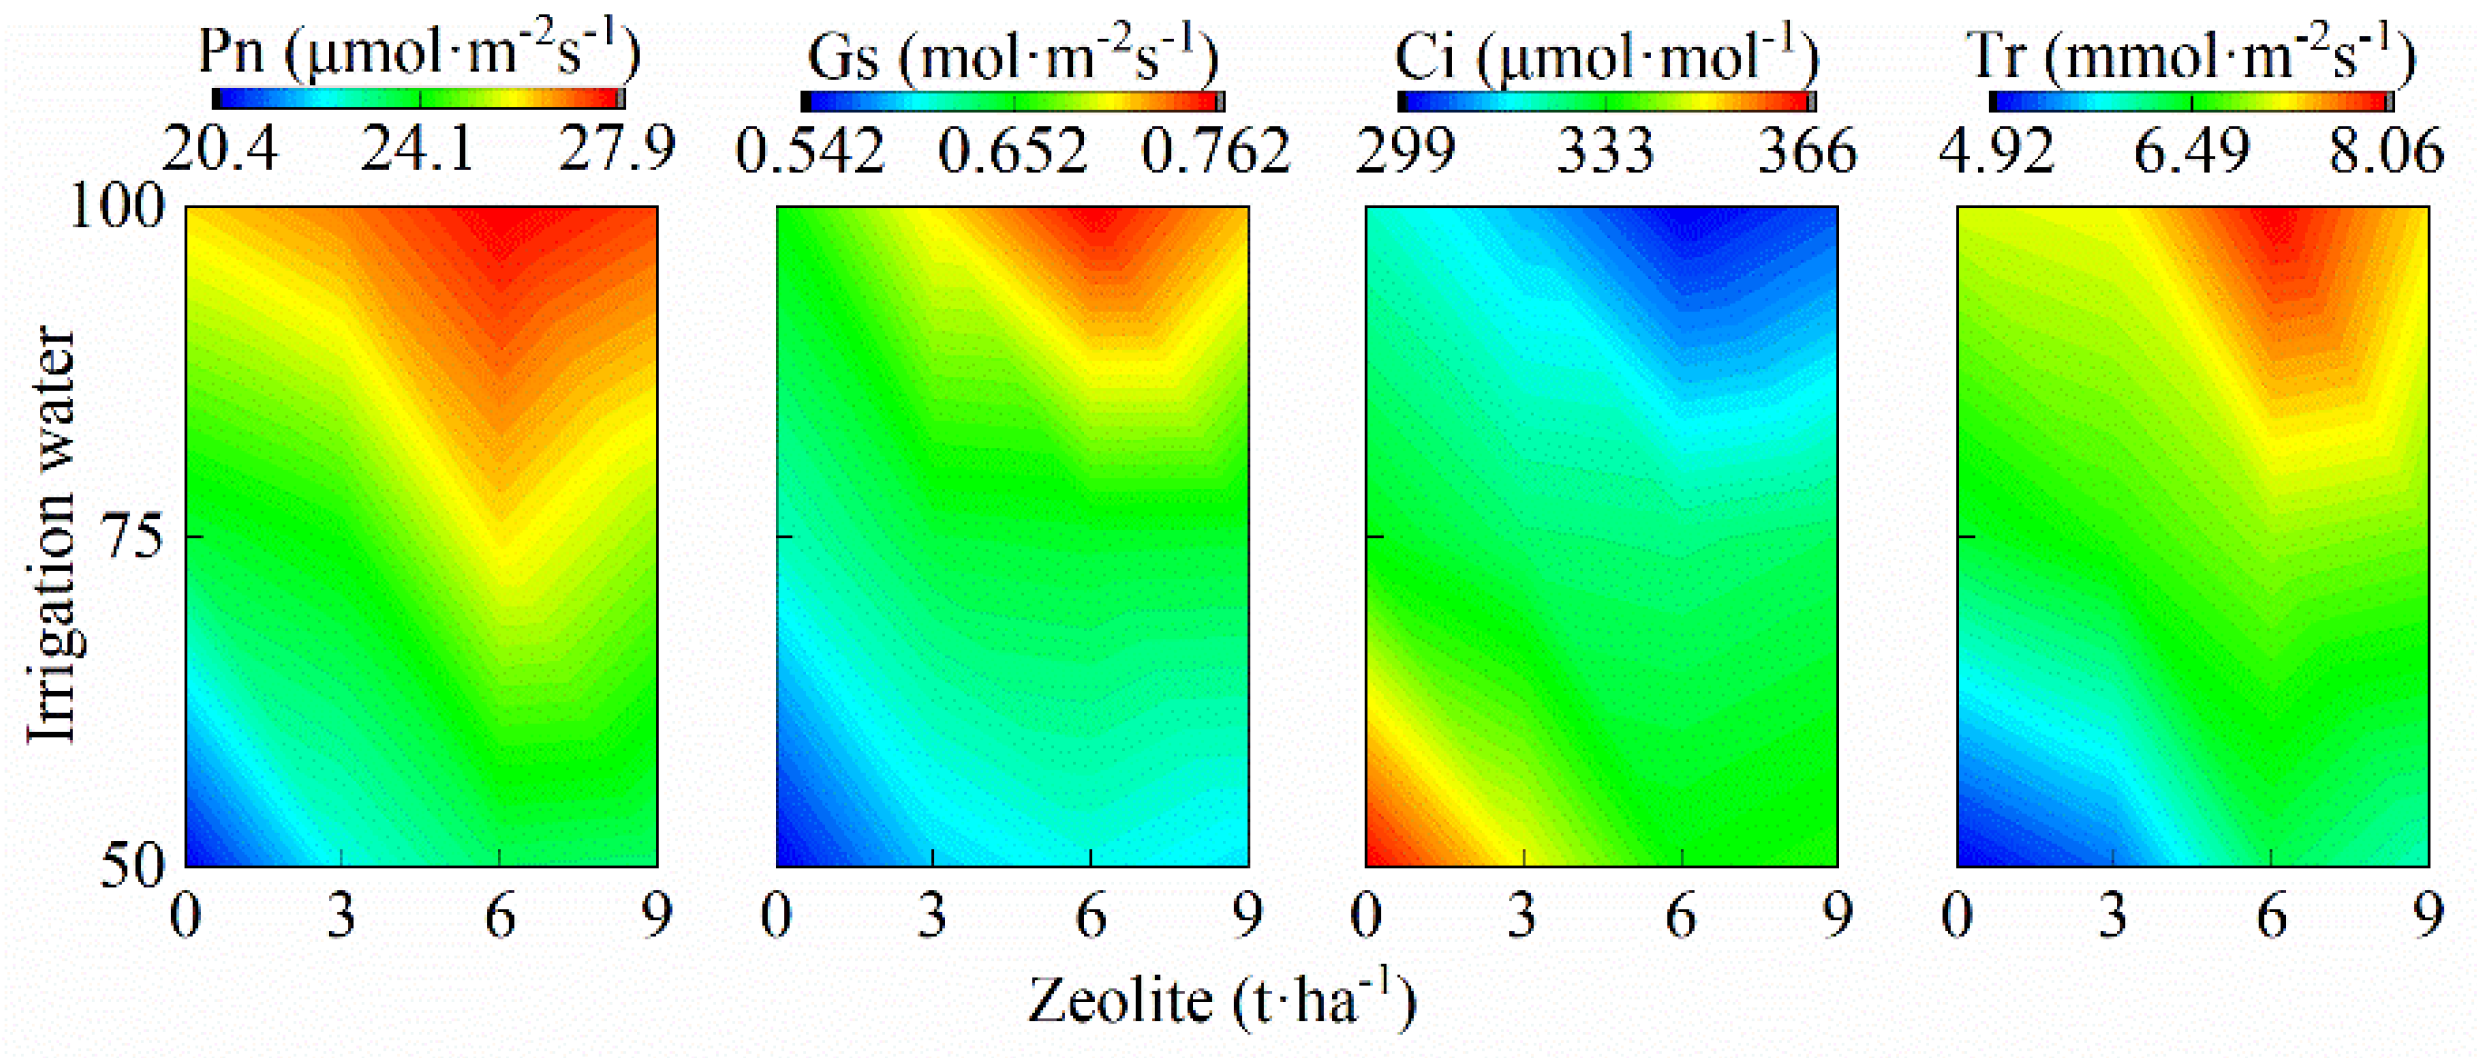
3.2.2. Effects of W-Z on Tomato Physiological Characteristics

Figure 3 shows the effect of W-Z on the physiological indexes of tomatoes subjected to alternate drip irrigation under mulch. Under the conditions of Z0, Z3, Z6, and Z9, when W increased from W50 to W100, tomato Ci decreased monotonically by 8.96–12.57%, Pn, Tr, and Gs monotonically increased by 16.67–28.43%, 22.82–44.51%, and 20.37–26.16%, respectively. This result showed that an increase in W can significantly inhibit Ci (p < 0.01) and promote Pn, Tr, and Gs. W and Z exerted antagonistic effects on Ci and synergistic effects on Pn, Tr, and Gs. Under the conditions of W50, W75, and W100, when Z increased from Z0 to Z6, Ci decreased monotonically by 2.11–9.02%, whereas Pn, Tr, and Gs monotonically increased by 6.49–15.20%, 8.95–27.34%, and 5.22–16.51%, respectively. When Z increased from Z6 to Z9, Ci increased by 0.60–2.01%, whereas Pn, Tr, and Gs decreased by 0.43–3.45%, 1.44–9.18%, and 0.16–5.77%, respectively. This result showed that in the Z0Z6 range, W and Z had an antagonistic effect on Ci and a synergistic effect on Pn, Tr, and Gs, and opposite results were obtained in a range of Z6Z9. Two-way ANOVA calculation showed that W-Z had a significant effect (p < 0.05) on Ci, Tr, and Gs but had no significant effect on Pn. As follows, the sum of the squares was for Ci (7994.00, 2138.08, 812.00), Pn (127.48, 28.14, 4.19), Tr (20.14, 4.58, 1.00), and Gs (0.10, 0.02, 0.01) under the effects of W, Z and W-Z, respectively. The effects of W, Z, and W-Z on tomato physiological indicators were as follows: W > Z > W-Z. The W factor played a leading role in tomato growth (Table S1).

3.3. Effects of W-Z on Tomato Quality

Figure 4 shows the effect of W-Z on tomato quality during alternate drip irrigation under mulch. Under the conditions of Z0, Z3, Z6, and Z9, when W increased from W50 to W100, tomato OA monotonically increased by 13.51–16.90%, and NC, VC, SS, and Ff monotonically decreased by 25.12–29.11%, 14.44–17.81%, 17.24–28.57%, and 23.16–33.69%, respectively. These results showed that an increase in W had a significant effect (p < 0.01) on tomato quality and W and Z had synergistic effects on OA and antagonistic effects on NC, VC, SS, and Ff. Under the conditions of W50, W75, and W100, when Z increased from Z0 to Z6, NC, VC, SS, and OA monotonically increased by 6.42–16.23%, 3.65–10.18%, 3.57–20.00%, and 6.80–8.10%, respectively, and Ff decreased monotonically by 4.05–17.20%. When Z increased from Z6 to Z9, NC, VC, SS, and OA decreased by 4.00–7.23%, 2.69–3.40%, 1.72–12.50%, and 1.52–4.23%, Ff increased by 4.55% and 6.27% under W50 and W75 treatments, respectively, whereas it decreased by 2.82% under W100 treatment. These results showed that under the conditions of W50 and W75, the significant effect (p < 0.01) of increasing Z on the quality of tomatoes was first suppressed and then enhanced, and under the W100 condition, the effects of NC, VC, SS, and OA were first accelerated and then suppressed, and only Ff was suppressed. In a range of Z0Z6, W and Z exerted synergistic effects on tomato quality and antagonistic effects in a range of Z6Z9 (except W100 Ff). The two-way ANOVA calculation showed that the W-Z effect had no significant effect on OA and Ff but had a significant effect (p < 0.01) on NC, VC, and SS. The sum of the squares was for NC (244.37, 22.07, 5.26), VC (44.32, 6.00, 2.04), SS (10.20, 1.15, 0.58), OA (0.01, 0.01, 0.00), and Ff (1.36, 0.13, 0.08) under the effects of W, Z and W-Z, respectively. The effects of W, Z, and W-Z on tomato physiological indicators were as follows: W > Z > W-Z. The W factor played a leading role in tomato quality (Table S1).

3.4. Effects of W-Z on Tomato Yield and WUE

Figure 5 shows the effect of W-Z on tomato yield and WUE during alternate drip irrigation under mulch. Under the conditions of Z0, Z3, Z6, and Z9, when W increased from W50 to W100, tomato yield monotonically increased by 16.56%, 16.31%, 16.25%, and 8.48%, respectively, whereas WUE monotonically decreased by 5.80%, 6.77%, 7.47%, and 16.17%, respectively. An increase in W had a significant promoting effect (p < 0.01) on the yield, and the strength of this promoting effect gradually decreased with increasing Z, and WUE showed opposite results. Under the conditions of W50, W75, and W100, when Z increased from Z0 to Z6, the yield increased by 9.21%, 15.06%, and 8.91%, respectively, whereas WUE increased by 45.20%, 47.06%, and 42.63%, respectively. When Z increased from Z6 to Z9, the yield under W50 treatment increased by 3.68%, the yield under W75 and W100 treatments decreased by 2.25% and 3.24%, respectively, and WUE decreased by 16.60%, 20.68%, and 24.44%. These results showed that an increase in Z had a significant effect (p < 0.01) on tomato yield and WUE. In the Z0Z6 range, W and Z had synergistic effects on yield and WUE. In the Z6Z9 range, W and Z exerted antagonistic effects on yield and WUE. The two-way ANOVA calculation showed that the W-Z had no significant effect on yield and WUE. The effects of W, Z, and W-Z on the yield were 2574.23, 231.50, and 76.92, respectively. The effects of W, Z, and W-Z on WUE were 57.05, 830.44, and 11.44, respectively. The effects of W, Z, and W-Z on tomato yield were W > Z > W-Z, whereas the effect on WUE was as follows: Z > W > W-Z. The W factor played a dominant role in tomato yield, whereas Z factor played a dominant role in tomato WUE (Table S1).

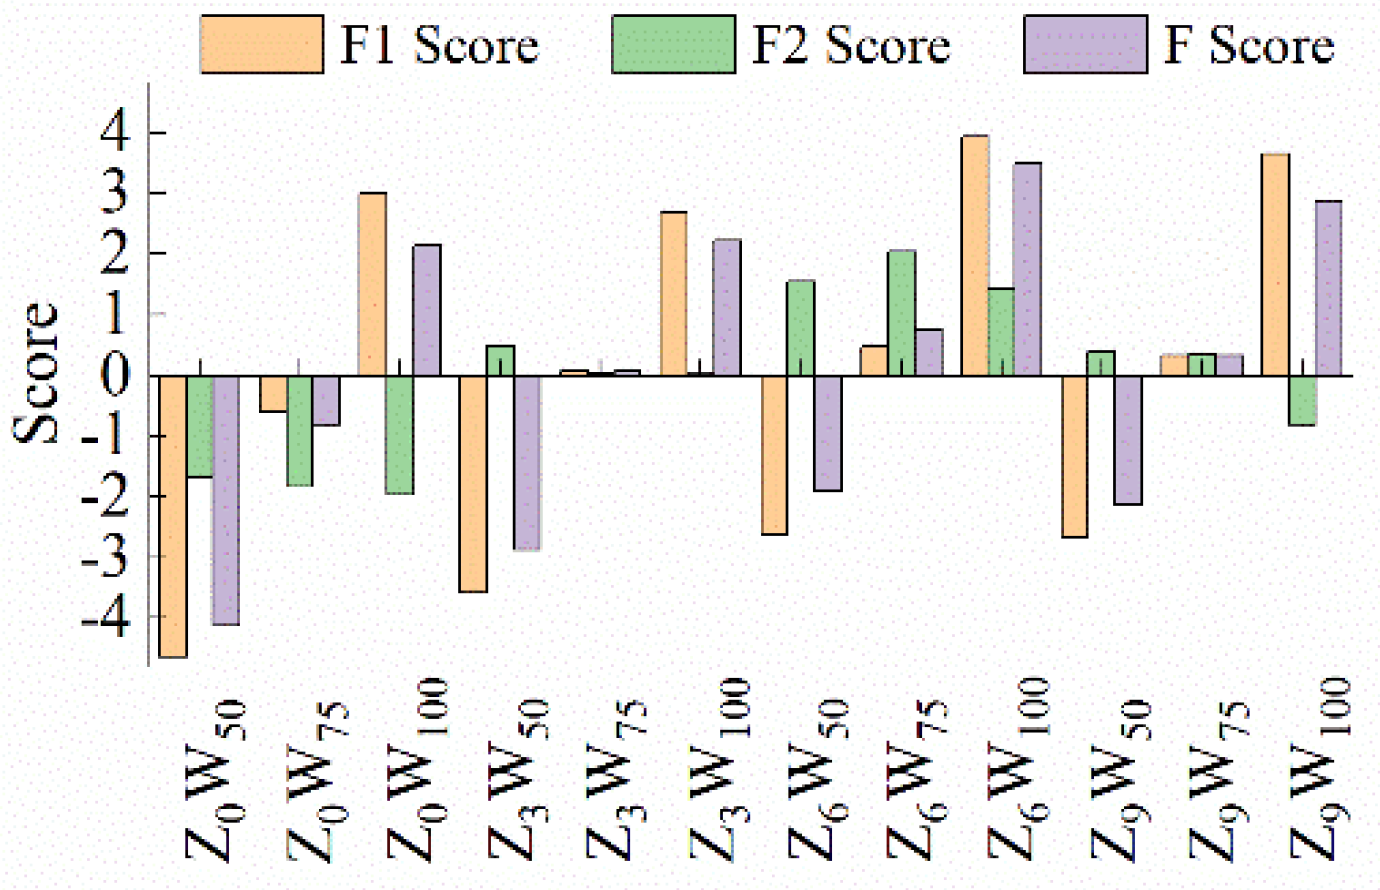
3.5. Comprehensive Evaluation and Analysis of Tomato

Our goal is to achieve high yield and water efficiency while ensuring normal growth of tomato plants and high fruit quality. Therefore, the factors of W and Z have different effects on tomato growth, physiology, quality, yield, and WUE. Determined based on a single index, the analysis results of the optimal W coupling strategy were inconsistent, and objectively and comprehensively meeting the goals of high-quality and high-efficiency planting and cultivation of tomatoes was difficult. Therefore, a comprehensive evaluation of various tomato indicators based on principal component analysis is necessary. A total of 17 indexes was used in this study, larger than the number of experimental treatments by 12, and forms a non-positive definite matrix in statistical analysis, making it difficult to carry out comprehensive evaluation. The gray correlation analysis method can be used to screen various tomato indicators [29]. The gray correlation analysis results (Table S2) showed that the gray correlation ranking was RV > St > Tr > LAI > VC > NC > Pn > SS > WUE > Ff > yield > Ph > Gs > Ci > OA > RS > RL. However, because the KMO statistic of the first 11 indicators was 0.390, when the principal component analysis was performed, it did not meet the principal component analysis standard. Therefore, these 11 indicators were selected for the comprehensive evaluation of principal components: RV(X1), St(X2), Tr(X3), VC(X4), NC(X5), Pn(X6), WUE(X7), SS(X8), Ff(X9), yield(X10), and Ph(X11). After statistical calculation, the KMO statistic in this study was 0.575, and p < 0.001 for Bartlett test. Therefore, the data samples in this study were suitable for PCA. Based on the extraction criteria with eigenvalues of ≥1 [30], two principal components were obtained in this study (Tables S3 and S4). The contribution rate of the variance in the first principal component F1 (named as growth factor) was 77.521%, which was a comprehensive reflection of tomato growth and quality. The contribution rate of the variance in the second principal component F2 (named as water use factor) was 16.310%, which was a comprehensive reflection of tomato water use. The score function of each principal component was as follows:
F 1 = 0 . 335 X 1 + 0 . 333 X 2 + 0 . 326 X 3 0 . 291 X 4 0 . 301 X 5 + 0 . 329 X 6 0 . 047 X 7 0 . 293 X 8 0 . 335 X 9 + 0 . 286 X 10 + 0 . 324 X 11
F 2 = 0 . 053 X 1 + 0 . 153 X 2 + 0 . 180 X 3 + 0 . 352 X 4 + 0 . 333 X 5 + 0 . 184 X 6 + 0 . 660 X 7 + 0 . 364 X 8 0 . 084 X 9 + 0 . 282 X 10 + 0 . 135 X 11
After the proportion of the variance contribution rate corresponding to each principal component was taken to the cumulative contribution rate of the principal component variance as the weight, the comprehensive model of the principal component score F was obtained using Formula (3).
F = 0.775 F 1 + 0.163 F 2 / 0.938
The comprehensive score F can be used as an objective evaluation index for evaluating the pros and cons of different W-Z strategies. Submitting each parameter under different treatments into Formula (3) can generate a comprehensive evaluation score of each treatment, as shown in Figure 6. The Z0W50 had the lowest comprehensive evaluation score at −1.529, whereas Z6W100 had the highest result of 1.295. The coupling planting strategy of Z of 6 t·ha−1 and W of 100% E was recommended.

4. Discussion

4.1. Effects of Water Level on Tomato Growth

The present results showed that when W increased from 50% E to 100% E, tomato Ph and St increased by 19.78–31.30% and 13.57–20.43%, respectively. Wei et al. [31] found that tomato Ph under 4950, 4750, and 4500 m3·ha−1 irrigation amount increased by 3.3%, 5.5%, and 5.7%, whereas the St increased by 1.9%, 11.4%, and 7.2%, respectively, compared with the 4050 m3·ha−1 irrigation treatment. Ph and St increased first and then decreased with increasing irrigation amount, and the response intensity of Ph and St to W was lower than that in this study. In previous studies, soil texture was sandy soil and sandy clay, and the soil moisture content was maintained at 5.5–34.5% [31]. In this study, the soil texture was clay loam, and the soil moisture content was maintained at 16.84–33.65% (Figure 1), which was higher than that in previous reports. More sufficient soil moisture will help accelerate root water absorption and improve water absorption and utilization and then increase plant growth accumulation.
The present results showed that with an increase in W, tomato RL, RV, RS, and OA increased by 29.10–50.84%, 53.91–77.96%, 35.46–47.88%, and 13.51–16.90% respectively, whereas Ff, NC, VC, and SS decreased by 23.16–33.69%, 25.12–29.11%, 14.44–17.81%, and 17.24–28.57%, respectively. Cabello et al. [32] found that when the amount of irrigation increased from 60% to 140% ETc (crop evapotranspiration), the firmness of melon decreased by 7.27%, and the response intensity of hardness to W was significantly lower than that in this study. This result may be due to the different reduction ranges in cell wall pressure and cell wall swelling pressure when crops were subjected to different degrees of water stress [33], which affected the change in Ff.
Yang Hui et al. [15] showed that under different nitrogen application conditions, with an increase in irrigation amount, tomato RL, RS, RV, VC, OA, and NC first increased by 30.21%, 66.70%, 47.07%, 9.72%, 21.90%, and 22.04% on average, respectively, and then decreased by 10.48%, 7.53%, 10.13%, 12.73%, 6.38%, and 29.89% on average, respectively, whereas SS decreased by 10.81% on average. The response intensity and trend of RL, RS, RV, NC, SS, VC, and OA to W were different from the results of this study. This difference may be caused by different basic experimental conditions, such as experimental design and soil texture. Previous studies reported that the pot experiment was adopted, the soil texture was heavy loam, the soil total nitrogen content was 0.81 g·kg−1, and the nitrogen application rate was 0.18–0.42 g·kg−1 (equal to 565–1320 kg·ha−1) [15]. The greenhouse experiment was used in this study, the soil texture was clay loam, the soil total nitrogen content was 1.12 g·kg−1, and the nitrogen application rate was 350 kg·ha−1. In previous studies, the amount of nitrogen application was 1.61–3.77-times that in this study. Excessive nitrogen input significantly inhibits root growth while causing waste of resources [34]. In addition, the water-holding performance of soil in the present study was better than that in previous reports. Appropriate soil nutrients and sufficient water can stimulate root growth, improve the ability of roots to absorb water and nutrients, and improve tomato quality.
The present results showed that with increasing Irrigation, the Pn, Tr, and Gs of tomatoes increased by 16.67–28.43%, 22.82–44.51%, and 20.37–26.16%, respectively, and Ci decreased by 8.96–12.57%. Guo et al. [35] showed that with the weakening of drought degree, the Pn, Tr, Gs, and Ci of drought-resistant soybeans increased by 91.06%, 90.30%, 89.01%, and 50.71%, respectively. The response intensity of Pn, Tr, and Gs to W was significantly higher than that in this study, and the response trend of Ci to W was the opposite to that in this study. This finding may be attributed to different degrees of water stress and restrictions on photosynthesis. The previous irrigation levels were 40%, 70%, and 85% of the field water capacity, and the water stress intensity was higher than that in this study. The water potential in the cells increased with the water absorption ability of tomato guard cells because of high water stress intensity, enabling guard cells to absorb more water, increasing the degree of stomata opening and stomatal conductance [36], accelerating water loss in leaves, and increasing the values of Tr and Pn. The photosynthesis of tomatoes was limited by nonstomatal factors because of water stress [37], which increased the Ci of leaves.
Water significantly affected the yield and WUE of tomatoes throughout the growth period. The present results showed that after irrigation increased from 50% E to 100% E, the tomato yield increased by 8.48–16.56%, whereas the WUE decreased by 5.8–16.17%. Xia et al. [38] found that as the relative water content of the substrate increased from 50 ± 5% to 95 ± 5%, the yield of tomato per square meter increased by 48.05% and WUE decreased by 28.23%. Abdel-Razzak et al. [11] found that with an increase in irrigation amount from 50% eTc to 100 eTc, tomato yield increased by 89.09% and WUE decreased by 14.80%. Xia et al. reported that the response intensity of yield and WUE to W were higher than that in this study possibly because of a difference in substrate. The substrate was organic matter mixed with mushroom residue and peanut shell mixed fermentation material and sheep manure, which contained 185.38 mg·kg−1 N, 122.46 mg·kg−1 P2O5, and 3.92 g·kg−1 K2O (equal to 180 kg N·ha−1, 119 kg P2O5·ha−1, and 3812 kg K2O·ha−1) [38]. In this study, natural soil was used for cultivation, which had 350 kg N·ha−1, 200 kg of P2O5·ha−1, and 400 kg K2O·ha−1. Compared with organic matrix cultivation, the application amount of potassium fertilizer was significantly reduced, and, thus, the amounts of nutrients required for crop growth were reduced to a certain extent. However, the response intensity of yield to water in the Abdel-Razzak study [11] was significantly higher than that in this study, which may be because the soil texture in the previous study was sandy loam [11], and the soil texture in this study was clay loam, and the soil water-holding capacity was better than the predecessors. Therefore, the soil osmotic pressure increased significantly when the predecessors were irrigated in deficit, inhibiting crop growth and, thus, reducing yield [39].

4.2. Effects of Zeolite Amount on Tomato Growth

This paper showed that after Z increased from Z0 to Z6, tomato Ph, St, NC, VC, SS, and OA increased by 8.32–16.55%, 5.14–8.42%, 6.42–16.23%, 3.65–10.18%, 3.57–20%, and 6.8–8.1%, respectively, whereas Ff was reduced by 4.05–17.20%. After Z increased from Z6 to Z9, Ph, St, NC, VC, SS, and OA were reduced by 2.08–4.91%, 1.13–3.85%, 4.0–7.23%, 2.69–3.4%, and 1.72–12.50%, respectively, whereas Ff increased by 4.55–6.27%, except for W100. Obregon-Portocarrero et al. [40] found that after Z increased from Z0 to Z15, maize Ph and St increased by 2.96% and 6.06%, respectively. When Z increased from Z15 to Z35, Ph decreased by 10.07%, whereas St showed no significant difference. Petropoulos et al. [41] found that compared with the treatment without Z, the addition of Z increased Ff and OA by 2.16% and 78.13%, respectively, and SS was reduced by 6.29%. This is due to the fact that adding Z can improve soil structure by improving the availability of fertilizer and the buffer capacity of soil [42], promoting crop root development, and improving crop growth and quality. However, the excessive application of Z caused a large amount of sodium ions from Z to invade the soil, which poisoned the roots of tomato and inhibited the normal growth of tomato [43]. The response intensities of Ph and St to Z in the study of Obregon-Portocarrero [40] and the response trends of Ff, OA, and SS to Z in the study of Petropoulos et al. [41] were different from those in this study, possibly because of differences in application amount and period of nitrogen fertilizer addition. In the study of Obregon-Portocarrero, nitrogen application was carried out at two time points: 30 kg·ha−1 at 15 days and 70 kg·ha−1 at 70 days after sowing. In the study of Petropoulos, conventional fertilizer (N:P:K = 21:0:0) was applied twice. In this study, nitrogen was applied three times: half of the nitrogen was applied at the base fertilizer stage, and one-fourth of nitrogen was applied with a drip irrigation system at the first and third ear fruit expanding stages. The amount of nitrogen was 350 kg·ha−1. Sufficient nitrogen fertilizer and rational distribution of nitrogen fertilizer can supply nitrogen for crop growth effectively and continuously and then promote crop growth accumulation.
This paper showed that when Z increased from Z0 to Z6, tomato RL, RV, and RS increased by 3.51–24.70%, 4.67–20.13%, and 9.08–16.98%, respectively. When Z increased from Z6 to Z9, RL, RV, and RS decreased by 0.07–11.64%, 2.19–9.84%, and 2.49–11.04%, respectively. Wu et al. [44] found that compared with treatment without Z, adding Z increased RL and RV by 9.90–15.54% and 5.45–15.04%, respectively. The response trends of RL and RV to Z were different from those in this study, possibly because of differences in test conditions, such as application amount of Z and crop type. Previous studies set Z at two levels: 0 and 10 t·ha−1, and the test crop was rice [44]. In the present study, Z was set at four levels: 0, 3, 6, and 9 t·ha−1, and the test crop was tomato. Previous studies revealed that adding Z had a promoting effect on crop growth. The present study set multiple levels, which accurately described the effects of different Z levels on crops. Different crop types have different levels of response to Z levels. The current paper showed that after Z increased from Z0 to Z6, tomato Ci decreased by 2.11–9.02%, whereas Pn, Tr, and Gs increased by 6.49–15.20%, 8.95–27.24%, and 5.22–16.51%, respectively. When Z increased from Z6 to Z9, Ci increased by 0.60–2.01%, whereas Pn, Tr, and Gs decreased by 0.43–3.45%, 1.44–9.18%, and 0.16–5.77% respectively. Zheng et al. [45] showed that when Z increased from Z0 to Z15, the Pn, Tr, and Gs of rice increased by 0.52%, 17.13%, and 35% respectively, whereas Ci decreased by 17.02%. Chi et al. [46] showed that when Z increased from Z0 to Z10, the Pn, Tr, and Gs of rice increased by 0.95%, 3.93%, and 5.56% respectively, whereas Ci decreased by 4.58%. The response intensities of Pn, Tr, Gs, and Ci to Z were different from those in this study, possibly because of differences in irrigation methods and Z burial depths. Zheng et al.’s studies showed that Z was mixed into the soil to a depth of 5 cm under continuous flood irrigation [45]. Chi et al.’s studies showed that Z was applied to the soil along with the base fertilizer at one time and mixed with the soil evenly [46]. The present study adopted alternate drip irrigation under mulch, and Z was mixed into the soil to a depth of 30 cm. The apparent morphological characteristics of the crops were promoted as available nitrogen content in deep soil was reduced due to the increased buried depth of Z, increasing the chlorophyll content and leaf area index of crops and then promoting the net photosynthetic rate [47].
This paper showed that compared with no-Z treatment, the application of Z increased the yield and WUE of tomatoes by 0.52–15.06% and 7.77–47.06%, respectively. Previous studies showed that the application of Z significantly saved water by 4.8–11.4% and increased production by 9.7% [44]. The response intensities of yield and WUE to Z were less than those in this study, which may be caused by different crop types, irrigation methods, and soil texture. Previous studies adopted alternative irrigation, the test crop was rice, and the soil texture was sandy loam. The soil was affected by wind and sand in the entire year, poor fertilizer, and water-holding capacity [44]. This study adopted alternate drip irrigation under mulch, the test crop was tomato, and the soil texture was clay loam. The soil moisture content was 16.8–33.7%. The soil water-holding capacity in this study was better than that reported by previous studies, and sufficient soil water will help accelerate tomato growth. Compared with conventional alternate irrigation, alternate drip irrigation under mulch can stimulate and strengthen the root absorption compensation function [48] and thereby, improves root activity and WUE, and then promotes tomato growth and yield. These features were the reasons for the difference between the present study and previous reports.

4.3. Comprehensive Evaluation Analysis

Two traditional comprehensive evaluation models based on Ph-St-yield-WUE indicators and yield-WUE-quality indicators were used for validation in this study: PCABi and PCAWang models [21,22]. Comprehensive evaluation results of tomato growth based on PCABi, PCAWang, and the PCAJv model proposed by this paper are shown in Table 1. Z6W100 was the best treatment, whereas Z0W50 was the worst in the PCABi and PCAJv models, and differences in the ranking of other treatments were observed. The PCAWang model showed that Z6W50 and Z0W100 were the best and worst treatment for tomatoes, respectively, in contrast to the PCAJv model. Considerable differences in ranking results were found between the PCAWang and PCAJv models. These differences may be due to differences in index factors among the evaluation methods and subsequent changes in principal component loads and contribution rates.
In the PCABi model, Ph, St, and yield in F1 had large loads with values of 0.975, 0.979, and 0.949, respectively. In the PCAWang model, NC, VC, SS, and OA in F1 had large loads with values of 0.954, 0.974, 0.963, and 0.848, respectively. The load values of Ph, St, yield, NC, VC, and SS in the PCAJv model F1 were 0.945, 0.971, 0.836, 0.879, 0.851, and 0.857, respectively. In the F2 of these three models, WUE dominated the largest load, with values of 0.998, 0.810, and 0.884. The variance contribution rates of F1 and F2 were 70.290% and 25.023% in the PCABi model, 68.821% and 23.067% in the PCAWang model, and 77.521% and 16.310% in the PCAJv model. These results indicated that the variance contribution rate of F1 increased and that of F2 decreased compared with those in previous studies, which was due to the changing of the index load. The PCAJv model focuses much more on the effects of growth, physiological, yield, and quality indicators on the growth and development of tomatoes throughout the growth period. The PCAWang model showed that some treatments were ranked in the order of Z0W50 > Z0W75 > Z0W100 (Table 1), indicating under a condition without Z, tomato growth characteristics improve with decreasing moisture content. This finding contradicts the general law of tomato growth response to water content. It showed that the rationality and applicability of the model are closely related to the selection of evaluation indexes and crop types. Therefore, the typical indicators that can objectively reflect the growth status of crops should be reasonably selected in combination with specific crop types in the modeling process. These indicators can help build a reasonable model evaluation system and obtain reasonable evaluation results.

5. Conclusions

(1) Tomato Ph, St, root indexes, LAI, Pn, Tr, Gs, OA, and yield showed a positive response to W, whereas NC, VC, SS, Ci, Ff, and WUE showed opposite trends. The response of Ci and Ff to Z was first negative and then positive, whereas that of other indexes to Z showed an opposite trend (except W50 yield).
(2) The effects of W, Z, and W-Z on tomato growth physiological indexes, quality indexes, and yield were as follows: W > Z > W-Z; the effects on WUE were as follows: Z > W > W-Z.
(3) The two principal components of growth quality factor and water usage factor were extracted through analysis, and the cumulative variance contribution rate reached 93.831%. According to the comprehensive score evaluation of principal components, the optimum W of tomatoes was 100% E, and the amount of Z was 6 t·ha−1 during alternate drip irrigation under mulch.

Supplementary Materials

The following are available online at https://www.mdpi.com/article/10.3390/horticulturae8060536/s1, Table S1: Results of two-way ANOVA for tomato growth, physiology, quality, yield and WUE, Table S2: Grey relational analysis calculation, Table S3: Eigenvalues and Cumulative Variance Contribution Rates of Tomato Evaluation Factors, Table S4: Factor loading matrix of principal components on each index.

Author Contributions

Conceptualization, X.J.; methodology, X.S.; software, M.Z.; validation, X.J., T.L. and X.G.; formal analysis, R.L.; investigation, J.M.; resources, T.L.; data curation, X.G.; writing—original draft preparation, X.J.; writing—review and editing, T.L.; data analysis and visualization, X.G.; supervision, T.L.; project administration, T.L.; funding acquisition, T.L. All authors have read and agreed to the published version of the manuscript.

Funding

This research was funded by the National Natural Science Foundation of China (51809189; 51909184), the China Postdoctoral Science Foundation (2020M670693), and the Scientific and Technologial Innovation Programs of Higher Education Institutions in Shanxi (2019L0136).

Institutional Review Board Statement

Not applicable.

Informed Consent Statement

Not applicable.

Data Availability Statement

Not applicable.

Acknowledgments

We appreciate that postgraduates from the university of the first author, who investigated and collected data. We are also grateful to the editors and anonymous reviewers for their suggestions and comments.

Conflicts of Interest

The authors declare no conflict of interest.

References

  1. Chand, J.B.; Hewa, G.; Hassanli, A.; Myers, B. Deficit Irrigation on Tomato Production in a Greenhouse Environment: A Review. J. Irrig. Drain. Eng. 2021, 147, 04020041. [Google Scholar] [CrossRef]
  2. Fariasa, D.B.D.; da Silva, P.S.O.; Lucas, A.A.T.; de Freitae, M.I.; Santos, T.D.; Fontes, P.T.N.; de Oliveira, L.F.G. Physiological and productive parameters of the okra under irrigation levels. Sci. Hortic. 2019, 252, 1–6. [Google Scholar] [CrossRef]
  3. Sepaskhah, A.R.; Barzegar, M. Yield, water and nitrogen-use response of rice to zeolite and nitrogen fertilization in a semi-arid environment. Agric. Water Manag. 2010, 98, 38–44. [Google Scholar] [CrossRef]
  4. Cui, X.; Song, J.; Qu, M. Effect of soil water potential on hydraulic parameters of Fraxinus mandshurica seedlings. J. Appl. Ecol. 2004, 15, 2237–2244. [Google Scholar]
  5. Wang, Y.S.; Liu, J.; Tang, S.; An, Z.X.; Guo, Z.L.; Ding, X.B.; Liu, F.J.; Cao, Z.L.; Zhang, T.; Zhang, Y. Modifications of chemically induced-enucleated nuclear transfer technique by reverse-order nuclear transfer in mouse. Zygote 2009, 17, 261–268. [Google Scholar] [CrossRef]
  6. Wang, J.W.; Niu, W.Q.; Li, Y. Nitrogen and Phosphorus Absorption and Yield of Tomato Increased by Regulating the Bacterial Community under Greenhouse Conditions via the Alternate Drip Irrigation Method. Agronomy 2020, 10, 315. [Google Scholar] [CrossRef] [Green Version]
  7. Sonmez, I.; Kaplan, M.; Demir, H.; Yilmaz, E. Effects of zeolite on seedling quality and nutrient contents of tomato plant (Solanum lycopersicon cv. Malike F1) grown in different mixtures of growing media. Food Agric. Environ. 2010, 8, 1162–1165. [Google Scholar]
  8. Podkovyrov, I.; Kostin, M.; Dolgova, A.; Filipchuk, O.G.; Nesvat, A. Impact of zeolites on intensity of the vital processes of hybrid plants. Vestn. Kazan State Agrar. Univ. 2019, 14, 31–36. [Google Scholar] [CrossRef]
  9. Urbina-Sanchez, E.; Baca-Castillo, G.A.; Nunez-Escobar, R.; Colinas-Leon, M.T.; Tijerina-Chavez, L.; Tirado-Torres, J.L. Tomato seedlings soilless culture on K+, Ca2+ or Mg2+ loaded zeolite and different granule size. Agrociencia 2006, 40, 419–429. [Google Scholar]
  10. Bernardi, A.C.D.; Monte, M.B.D.; Paiva, P.R.P.; Werneck, C.G.; Haim, P.G.; Barros, F.D. Dry matter production and nutrient accumulation after successive crops of lettuce, tomato, rice, and andropogongrass in a substrate with zeolite. Rev. Bras. Cienc. Solo 2010, 34, 435–442. [Google Scholar] [CrossRef]
  11. Abdel-Razzak, H.; Wahb-Allah, M.; Ibrahim, A.; Alenazi, M.; Alsadon, A. Response of Cherry Tomato to Irrigation Levels and Fruit Pruning under Greenhouse Conditions. J. Agric. Sci. Technol. 2016, 18, 1091–1103. [Google Scholar]
  12. Ajirloo, A.R.; Amiri, E. Responses of Tomato Cultivars to Water-Deficit Conditions (Case Study: Moghan Plain, Iran). Commun. Soil Sci. Plant Anal. 2018, 49, 2267–2283. [Google Scholar] [CrossRef]
  13. Aydiner, E.; Tuzel, Y.; Tuzel, I.H.; Tunali, U.; Oztekin, G.B. Effects of Irrigation Based on Different Moisture Levels of growing Medium on Soilless Grown Greenhouse Tomatoes. Int. Soc. Hort. Cult. Sci. 2014, 1142, 93–98. [Google Scholar] [CrossRef]
  14. Ullah, I.; Mao, H.P.; Rasool, G.; Gao, H.Y.; Javed, Q.; Sarwar, A.; Khan, M.I. Effect of Deficit Irrigation and Reduced N Fertilization on Plant Growth, Root Morphology and Water Use Efficiency of Tomato Grown in Soilless Culture. Agronomy 2021, 11, 228. [Google Scholar] [CrossRef]
  15. Yang, H.; Cao, H.X.; Hao, X.M.; Guo, L.J.; Li, H.Z.; Wu, X.Y. Evaluation of tomato fruit quality response to water and nitrogen management under alternate partial root-zone irrigation. Int. J. Agric. Biol. Eng. 2017, 10, 85–94. [Google Scholar]
  16. Liu, G.Y.; Du, Q.J.; Jiao, X.C.; Li, J.M. Irrigation at the level of evapotranspiration aids growth recovery and photosynthesis rate in tomato grown under chilling stress. Acta Physiol. Plant. 2018, 40, 2. [Google Scholar] [CrossRef]
  17. Zhao, Z.L.; Li, B.; Feng, X.; Yao, M.Z.; Xie, Y.; Xing, J.W.; Li, C.X. Parameter estimation and verification of DSSAT-CROPGRO-Tomato model under different irrigation levels in greenhouse. J. Appl. Ecol. 2018, 29, 2017–2027. [Google Scholar]
  18. Ozbahce, A.; Tari, A.F.; Gonulal, E.; Simsekli, N. Zeolite for Enhancing Yield and Quality of Potatoes Cultivated Under Water-Deficit Conditions. Potato Res. 2018, 61, 247–259. [Google Scholar] [CrossRef]
  19. Nozari, R.; Tohidi-Moghadam, H.R.; Mashhadi-Akbar-Boojar, M. Effects of zeolite and cattle manure on growth, yield and yield components of soybean grown under water deficit stress. Res. Crop. 2012, 13, 920–927. [Google Scholar]
  20. Ozbahce, A.; Tari, A.F.; Gonulal, E.; Simsekli, N.; Padem, H. The effect of zeolite applications on yield components and nutrient uptake of common bean under water stress. Arch. Agron. Soil Sci. 2015, 61, 615–626. [Google Scholar] [CrossRef]
  21. Bi, Y.J.; Lv, P.P.; Su, R.D.; Wang, Y.M.; Wang, J.; Lei, M.J. Determination of the buried depth and pressure head under moistube irrigation based on principal component analysis. Fresenius Environ. Bull. 2020, 29, 5021–5028. [Google Scholar]
  22. Wang, Y.; Zhang, F.-C.; Wang, H.-D.; Bi, L.-F.; Cheng, M.-H.; Yan, F.-L.; Fan, J.-L.; Xiang, Y.-Z. Effects of the frequency and amount of drip irrigation on yield, tuber quality and water use efficiency of potato in sandy soil of Yulin, northern Shaanxi, China. J. Appl. Ecol. 2019, 30, 4159–4168. [Google Scholar]
  23. Zhang, G.W.; Yang, C.Q.; Liu, R.X.; Ni, W.C. Effects of p-hydroxybenzoic acid and phloroglucinol on mitochondria function and root growth in cotton (Gossypium hirsutum L.) seedling roots. J. Appl. Ecol. 2018, 29, 231–237. [Google Scholar]
  24. Zhang, L.; Lu, C.; Peng, L.; Ma, W.; Qian, W. Progress in improving photosynthetic efficiency by synthetic biology. Chin. J. Biotechnol. 2017, 33, 486–493. [Google Scholar]
  25. Colaric, M.; Stampar, F.; Hudina, M. Content levels of various fruit metabolites in the “Conferenc” pear response to branch bending. Sci. Hortic. 2007, 113, 261–266. [Google Scholar] [CrossRef]
  26. Fan, B.H.; Ma, L.L.; Ren, R.D.; He, J.X.; Hamiti, A.; Li, J.M. Effects of irrigation frequency of organic nutrient solution and irrigation amount on yield, quality, fertilizer and water use efficiency of melon in facility. J. Appl. Ecol. 2019, 30, 1261–1268. [Google Scholar]
  27. Tang, L.; Luo, W.J.; He, Z.L.; Gurajala, H.K.; Hamid, Y.; Khan, K.Y.; Yang, X.E. Variations in cadmium and nitrate co-accumulation among water spinach genotypes and implications for screening safe genotypes for human consumption. Zhejiang Univ.-Sci. B 2018, 19, 147–158. [Google Scholar] [CrossRef] [Green Version]
  28. Tian, G.; Li, H.F.; Tian, M.; Liu, X.X.; Chen, Q.; Zhu, Z.L.; Jiang, Y.M.; Ge, S.F. Effects of different integration of water and fertilizer modes on the absorption and utilization of nitrogen fertilizer and fruit yield and quality of apple trees. J. Appl. Ecol. 2020, 31, 1867–1874. [Google Scholar]
  29. Yin, S.X.; Wei, L.F.; Mei, Y.Q.; Liu, X.H.; Zou, L.S.; Cai, Z.C.; Yuan, J.H.; Ge, H.-T.; Wang, D.-G.; Wang, D.-D. Simultaneous determination of multiple bioactive constituents in Abelmoschi Corolla by UFLC-QTRAP-MS/MS. China J. Chin. Mater. Med. 2021, 46, 2527–2536. [Google Scholar]
  30. Wang, X.; Cui, S.X.; Sun, Z.M.; Mu, G.J.; Cui, S.L.; Wang, P.C.; Liu, L.F. Ecological adaptability evaluation of peanut cultivars based on biomass and nutrient accumulation. J. Appl. Ecol. 2015, 26, 2023–2029. [Google Scholar]
  31. Wei, C.L.; Zhu, Y.; Zhang, J.Z.; Wang, Z.H. Evaluation of Suitable Mixture of Water and Air for Processing Tomato in Drip Irrigation in Xinjiang Oasis. Sustainability 2021, 13, 7845. [Google Scholar] [CrossRef]
  32. Cabello, M.J.; Castellanos, M.T.; Romojaro, F.; Martinez-Madrid, C.; Ribas, F. Yield and quality of melon grown under different irrigation and nitrogen rates. Agric. Water Manag. 2009, 96, 866–874. [Google Scholar] [CrossRef]
  33. Guichard, S.; Gary, C.; Longuenesse, J.J.; Leonardi, C. Water Fluxes and Growth of Greenhouse Tomato Fruits under Summer Conditions; International Society for Horticultural Science (ISHS): Leuven, Belgium, 1999; pp. 223–230. [Google Scholar]
  34. Song, Q.L.; Yue, S.C.; Cai, L.Q. Response of Maize Root Morphology to Nitrogen Application Under Film Mulch. Res. Soil Water Conserv. 2020, 27, 23–29. (In Chinese) [Google Scholar]
  35. Guo, S.J.; Yang, K.M.; Huo, J.; Zhou, Y.H.; Wang, Y.P.; Li, G.Q. Influence of drought on leaf photosynthetic capacity and root growth of soybeans at grain filling stage. J. Appl. Ecol. 2015, 26, 1419–1425. [Google Scholar]
  36. Luo, D.D.; Wang, C.K.; Jin, Y. Stomatal regulation of plants in response to drought stress. J. Appl. Ecol. 2019, 30, 4333–4343. [Google Scholar]
  37. Winter, K.; Schramm, M.J. Analysis of Stomatal and Nonstomatal Components in the Environmental Control of CO2 Exchange in Leaves of Welwitschia mirabilis. Plant Physiol. 1986, 82, 173–178. [Google Scholar] [CrossRef] [Green Version]
  38. Xia, X.B.; Yu, X.C.; Gao, J.J. Effects of moisture content in organic substrate on the physiological characters, fruit quality and yield of tomato plant. J. Appl. Ecol. 2007, 18, 2710–2714. [Google Scholar]
  39. Agbna, G.H.D.; She, D.L.; Liu, Z.P.; Elshaikh, N.A.; Shao, G.C.; Timm, L.C. Effects of deficit irrigation and biochar addition on the growth, yield, and quality of tomato. Sci. Hortic. 2017, 222, 90–101. [Google Scholar] [CrossRef]
  40. Obregón-Portocarrero, N.; Díaz-Ortiz, J.E.; Daza-Torres, M.C.; Aristizabal-Rodríguez, H.F. Efecto de la aplicación de zeolita en la recuperación de nitrógeno y el rendimiento de maíz. Acta Agron. 2016, 65, 24–30. [Google Scholar] [CrossRef]
  41. Petropoulos, S.A.; Fernandes, A.; Xyrafis, E.; Polyzos, N.; Antoniadis, V.; Barros, L.; Ferreira, I. The Optimization of Nitrogen Fertilization Regulates Crop Performance and Quality of Processing Tomato (Solanum lycopersicum L. cv. Heinz 3402). Agronomy 2020, 10, 715. [Google Scholar] [CrossRef]
  42. Palanivell, P.; Ahmed, O.H.; Omar, L.; Majid, N.M.A. Nitrogen, Phosphorus, and Potassium Adsorption and Desorption Improvement and Soil Buffering Capacity Using Clinoptilolite Zeolite. Agronomy 2021, 11, 379. [Google Scholar] [CrossRef]
  43. Ma, M.L. Effects of controlled root zoning and alternating sub-film drip irrigation on water consumption and yield of tomato. Inn. Mong. Sci. Technol. Econ. 2019, 18, 86–87. (In Chinese) [Google Scholar]
  44. Wu, Q.; Chen, H.Y.; Wang, Y.Z.; Chi, D.C. Water-saving and Fertilizer-reducing Effect of Clinoptilolite in Water-saving Irrigated Paddy Fields in Semiarid Areas of Western Liaoning. J. Agric. Mach. 2021, 52, 305–313+406. (In Chinese) [Google Scholar]
  45. Zheng, J.L.; Chen, T.T.; Wu, Q.; Yu, J.M.; Chen, W.; Chen, Y.L.; Siddique, K.H.M.; Meng, W.Z.; Chi, D.C.; Xia, G.M. Effect of zeolite application on phenology, grain yield and grain quality in rice under water stress. Agric. Water Manag. 2018, 206, 241–251. [Google Scholar] [CrossRef]
  46. Chi, D.C.; Yu, J.M.; Chen, T.T.; Zheng, J.L.; Chen, W.; Yi, E.B. Effects of the Coupling of Nitrogen and Zeolite on Physiological Characteristics of Rice during Milky Ripe Stage. J. Shenyang Agric. Univ. 2017, 48, 745–750. (In Chinese) [Google Scholar]
  47. Amiri, H.; Ghalavand, A.; Mokhtassi-Bidgoli, A. Growth, Seed Yield and Quality of Soybean as Affected by Integrated Fertilizer Managements and Zeolite Application. Commun. Soil Sci. Plant Anal. 2021, 52, 1834–1851. [Google Scholar] [CrossRef]
  48. Kang, S.Z.; Pan, Y.H.; Shi, P.Z.; Zhang, J.H. Theory and Experiment on Alternate Irrigation of Root System of Controlled Crops. J. Hydraul. Eng. 2001, 80–86. (In Chinese) [Google Scholar]
Figure 1. Effects of W-Z on variations of soil moisture during alternate drip irrigation under mulch.
Horticulturae 08 00536 g001
Figure 2. Effects of W-Z on tomato growth during alternate drip irrigation under mulch. Ph, St, RL, RV, RS, and LAI represent plant height, stem thickness, root length, root volume, root surface area, and leaf area index, respectively.
Horticulturae 08 00536 g002
Figure 3. Effects of W-Z on tomato physiological indexes during alternate drip irrigation under mulch. Pn, Gs, Ci, and Tr represent photosynthetic rate, stomatal conductance, intercellular CO2 concentration, and transpiration rate, respectively.
Horticulturae 08 00536 g003
Figure 4. Effects of W-Z on tomato quality during alternate drip irrigation under mulch. NC, VC, SS, OA and Ff represent nitrate, vitamin C, soluble solid, organic acid, and fruit firmness, respectively.
Horticulturae 08 00536 g004
Figure 5. Effects of W-Z on tomato yield and WUE during alternate drip irrigation under mulch.
Horticulturae 08 00536 g005
Figure 6. Comprehensive evaluation score of tomato planting under different W-Z conditions.
Horticulturae 08 00536 g006
Table 1. Comprehensive evaluation results of tomato growth based on PCAJv, PCABi, and PCAWang models.
TreamentFJvRankingFBiRankingFWangRanking
Z0W50−1.5312−1.465120.4185
Z0W75−0.418−0.84211−0.5059
Z0W1000.5940.0077−1.33512
Z3W50−0.9511−0.588100.9672
Z3W750.0270.0766−0.0087
Z3W1000.7630.5873−0.56710
Z6W50−0.549−0.15381.1181
Z6W750.4050.72220.6054
Z6W1001.2911.4401−0.3718
Z9W50−0.7110−0.47690.6983
Z9W750.1460.11650.0526
Z9W1000.9320.5764−1.07211
Note: FJv, FBi, and FWang were the comprehensive principal component scores of PCAJv, PCABi, and PCAWang models, which can be calculated by Formulae (1)–(3), respectively.
Publisher’s Note: MDPI stays neutral with regard to jurisdictional claims in published maps and institutional affiliations.

