Article

Anthocyanin Accumulation and Differential Expression of the Biosynthetic Genes Result in a Discrepancy in the Red Color of Herbaceous Peony (Paeonia lactiflora Pall.) Flowers

1
Joint International Research Laboratory of Agriculture and Agri-Product Safety, The Ministry of Education of China, Institutes of Agricultural Science and Technology Development, Yangzhou University, Yangzhou 225009, China
2
College of Horticulture and Plant Protection, Yangzhou University, Yangzhou 225009, China
*
Author to whom correspondence should be addressed.
Horticulturae 2022, 8(4), 349; https://doi.org/10.3390/horticulturae8040349
Submission received: 2 March 2022 / Revised: 31 March 2022 / Accepted: 16 April 2022 / Published: 18 April 2022
(This article belongs to the Section Genetics, Genomics, Breeding, and Biotechnology (G2B2))

Abstract

:
Herbaceous peony (Paeonia lactiflora Pall.) is an ornamental plant with huge potential in the international flower market. Similar to the flowers of most other ornamental plants, the top sellers of P. lactiflora are those with red or pink flowers. However, most studies on flower colors have focused on the novel colors and have neglected the most common red flowers. In this study, a red cultivar of P. lactiflora (‘Dafugui’) and a pink cultivar (‘Qingwen’) were selected in order to study the discrepancy in the red color of the flowers. The results demonstrate that these two cultivars have the same compositions as anthocyanins, flavones, and flavonols but different contents. ‘Dafugui’ was found to have a high accumulation of upstream substances due to the higher expression of the early genes encoding phenylalanine ammonialyase (PlPAL) and flavonoid 3′-hydroxylase (PlF3′H). Moreover, the anthocyanidin synthase gene (PlANS) and UDP-glucose flavonoid 3-O-glucosyltransferase gene (PlUF3GT) encoding enzymes catalyze these upstream substances into anthocyanins, resulting in more redness in ‘Dafugui’ than in ‘Qingwen’. Our study thus provides a better understanding of the anthocyanin accumulation and coloring mechanism of P. lactiflora and can serve as a theoretical basis for breeding more red flowers using genetic engineering techniques to cater to consumers’ preferences.

1. Introduction

The herbaceous peony (Paeonia lactiflora Pall.), belonging to Paeoniaceae, is a herbaceous perennial plant widely cultivated in many countries such as the United States, European countries, China, and Russia. It bears large flowers of various colors and shapes [1]. It has been cultivated in China for a long time, and more than 600 cultivars had been reported in China by 2005. These cultivars can be divided into nine flower color categories, including red, pink, white, blue, purple, green, yellow, black, and double color [2]. An important ornamental plant, P. lactiflora can be used as potted flowers, dry flowers, and garden flowers and is also considered as a wedding flower and a high-end cut flower popular among high-income consumers [3,4,5].
Flower color is one of the most dominant attributes of flowering plants that can affect the sales of floral products. Investigations into the color preferences among the consumers have indicated red and pink as the most popular colors of flowers [6,7]. Red and pink are eye-catching in contrast with the green leaves and have significant aesthetic values (red symbolizes passion and affection; pink symbolizes grace, gentility, and happiness) [8]. Therefore, red and pink flowers are indispensable for both flower shops and gardens. An investigation into consumers’ preferences for cut herbaceous peonies conducted by Kansas State University revealed that the red ‘Shawnee Chief’ and the pink ‘Sara Bernhardt’ are the two most popular cultivars.
Anthocyanins are the principal compounds contributing to flower color, conferring pink, red, purple, and blue cyanic colors to the petals [9,10]. There are six main anthocyanidins in plants: pelargonidin (Pg), peonidin (Pn), cyanidin (Cy), malvidin (Mv), petunidin (Pt), and delphinidin (Dp) [11,12,13]. Previous studies have already identified anthocyanins in various plant species, many of which have red flowers. Mizuta et al. [14] performed high-performance liquid chromatography (HPLC) and identified only Cy and Pn in Rhododendron red flowers and Cy, Dp, Pn, Mv, and Pt in purple flowers. Tatsuzawa et al. [15] found that cyanidin-3,5-di-O-glucoside (Cy3G5G), pelargonidin-3,5-di-O-glucoside (Pg3G5G), and pelargonidin-3-di-O-glucoside (Pg3G) were the major anthocyanins in red-purple, red, and peach flowers of Matthiola incana. The derivatives of Dp and Cy in the red Nymphaea were more complicated than the blue ones [16]. Jia et al. [17] found that in P. lactiflora, the deep purple or reddish-purple cultivars contained 4–5 anthocyanins, whereas pink cultivars only contained Cy3G5G and peonidin-3,5-di-O-glucoside (Pn3G5G) at much lower contents than those in purple cultivars. These results have preliminarily established that the red or pink color of flowers was a result of anthocyanin accumulation.
The anthocyanin biosynthetic pathway has been well-established to date [12]. It is usually divided into the early section and the late section. The early section involves the production of dihydro-flavonols after a series of actions catalyzed by phenylalanine ammonialyase (PAL), cinnamate 4-hydroxylase (C4H), 4-coumarate: CoA ligase (4CL), chalcone synthase (CHS), chalcone isomerase (CHI), flavanone 3-hydroxylase (F3H), and flavonoid 3′-hydroxylase (F3′H). On the other hand, the late section involves anthocyanins catalyzed by dihydroflavonol reductase (DFR), anthocyanidin synthase (ANS), UDP-Glucose: flavonoid 3-O-glucosyltransferase (UF3GT), and UDP-Glucose: flavonoid 5-O-glucosyltransferase (UF5GT) (Figure S1) [18]. Reports on cloning the structural genes and analysis of their expression levels in the anthocyanin biosynthetic pathway have shown that these genes are related to the redness of fruits and leaves in many species, such as pepper [19], strawberry [20], mango [21], tea [22], P. lactiflora [23], and Pelargonium crispum [24]. Nevertheless, most studies on flower color have focused on the novel color or the diversity of the flower color, but the most common red-flowered forms are often disregarded in research. There are almost no studies focusing on the discrepancy in the red color of the flowers. However, it is unknown how anthocyanin accumulation occurs and which gene is dominant in the process of determining the different color depths of red flowers.
Previously, we identified that PlDFR, PlANS, and PlUF3GT were highly expressed in a purplish-red P. lactiflora cv. ‘Hongyan Zhenghui’ [25]. In order to elucidate how anthocyanins affect the different color depths of red flowers and which gene is dominant in the process, a red cultivar of P. lactiflora (‘Dafugui’) and a pink cultivar (‘Qingwen’) (Figure 1) were selected to study the discrepancy in the red color of the flowers in this study. Firstly, the floral qualities and plant morphological parameters of these two cultivars were compared. In addition, the anthocyanins, as well as the flavones and flavonols, were quantified in the petals of the two cultivars using high-performance liquid chromatography–electrospray ionization-mass spectrometry (HPLC–ESI-MSn), and the expression levels of anthocyanin biosynthetic genes, including PlPAL, PlC4H, PlCHS, PlCHI, PlF3H, PlF3′H, PlANS, PlDFR, PlUF3GT, and PlUF5GT, were detected. These results can provide a further understanding of the discrepancy in the red color of the flowers.

2. Materials and Methods

2.1. Plant Materials

P. lactiflora was cultivated in the National Herbaceous Peony Germplasm Repository of Yangzhou University, Jiangsu Province, China (32°39′ N, 119°42′ E). A red cultivar ‘Dafugui’ and a pink cultivar ‘Qingwen’ were selected for study, and the plants’ morphological parameters and photosynthetic characteristics in the full-bloom stage were measured. During the development of the plants, fresh petals at four different developmental stages (Figure 1), including a flower-bud stage (S1), an initiating bloom stage (S2), a full-bloom stage (S3), and a withering stage (S4), were considered in order to measuring the flower quality and to analyze the anthocyanins, flavones, and flavonols. All the samples were frozen immediately in liquid nitrogen and stored at −80 °C. Then, the frozen petals at four stages were used for analyzing the gene expression.

2.2. Measurement of the Morphological Parameters

The plant height and crown width were measured with a meter stick (Zhejiang Yuyao Sanxin Measuring Tools Co., Ltd., Yuyao, China); the stem diameter was measured with a micrometer scale (Taizhou Xinshangliang Measuring Tools Co., Ltd., Taizhou, China), and the leaf area was determined using the method of paper weighing [26] (Table S1).

2.3. Measurements of the Floral Quality and Color Indices

The weight of fresh flowers was measured using a balance (Gandg Testing Instrument Factory, Suzhou, China), and their diameters were measured using a micrometer scale. The flower color of the two cultivars was measured using the Royal Horticultural Society Color Chart (RHSCC) colorimetric method. In addition, a TC-P2A chroma meter (Beijing Optical Instrument Factory, Beijing, China) was used to measure the indices of flower color and to obtain three color parameters, including L* (lightness), a*, and b* values. The hue angle (, = arctan b*/a*) and a*/b* were calculated according to the previously reported methods [27,28].

2.4. Analysis of the Anthocyanins, Flavones, and Flavonols

The anthocyanins, flavones, and flavonols were analyzed according to Zhu et al. [16] method, with some modifications. Briefly, 0.5 g fresh flower petals were ground in liquid nitrogen and extracted for the first time with a 3 mL solution of acidic methanol solution (70:29.9:0.1; by volume, CH3OH:H2O:HCl). Then, the mixture was shaken in an XW-80A vortex (Shanghai Huxi Analysis Instruments Factory Co., Ltd., Shanghai, China), sonicated in a KQ-200VDB ultrasonic generator (Kunshan Ultrasonic Instruments Co., Ltd., Kunshan, China) at 20 °C for 30 min, and centrifuged in an HC-2518 R centrifugal machine (USTC Chuangxin Co., Ltd., Hefei, China) (12,000 rpm, 10 min), and the supernatant was collected. The operation was repeated for a second and third time with 2 mL and 1 mL extraction solution separately supplemented with the residue, and finally, the merged extract was filtered through 0.22 μm reinforced nylon membrane filters (Shanghai ANPEL scientific, Instruments Co., Ltd., Shanghai, China). Then, the filtrate was diluted 5-fold and transferred into a 2 mL vial for analyzing the anthocyanins and the flavones and flavonols.
The anthocyanins, flavones, and flavonols were analyzed using high-performance liquid chromatography coupled to the photodiode array and mass spectrometry detectors (HPLC–PDA–MS) with a three-dimensional quadrupole ion trap mass spectrometer (model LCQ Deca XP MAX, Thermo Fisher Scientific, Waltham, MA, USA). The HPLC column was an Agilent C18 column (150 mm × 4.6 mm, 5 μm, Thermo Fisher Scientific, Waltham, MA, USA). Eluent A was a 0.1% formic acid aqueous solution, and eluent B was a 0.1% formic acid in acetonitrile. The flow rate was 0.8 mL·min−1, and the injected sample size was 10 μL. The gradient elution was as follows: 10% B at 0 min, 20% B at 30 min, 30% B at 50 min, 40% B at 60 min, 50% B at 80 min, 50% B at 85 min, and 10% B at 90 min. The column temperature was 35 °C. The chromatograms were acquired at 525 for anthocyanins and 350 for flavones and flavonols and PDA data were recorded from 200 to 700 nm.
For HPLC-ESI-MS2 analysis, the HPLC separation conditions were the same as mentioned above. The MS conditions were as follows: positive mode, capillary voltage, 3500 V; capillary exit, 120.4 V; dry gas (N2) temperature, 350 °C; flow, 6.0 L/min; nebulizer, 241.3 kPa; scan range, m/z 100–1200 u.
The total anthocyanin content (TA (mg per 100 mg fresh weight)) was detected semi-quantitatively from the peak area according to a simple linear regression using cyanidin-3-O-glucoside (Cy3G) at 525 nm as standards, and total flavone and flavonol contents (TF (mg per 100 mg fresh weight)) were detected using rutin at 350 nm. The co-pigmentation index (CI) was obtained by dividing TF by TA [29].

2.5. Gene Expression Analysis

Expressions of the genes were quantified using real-time quantitative polymerase chain reaction (qRT-PCR) using a BIO-RAD CFX96TM Real-Time System (C1000TM Thermal Cycler) (Bio-Rad, Hercules, CA, USA). The first-strand cDNAs were reverse-transcribed from RNA isolated from the petals with PrimeScript® RT reagent Kit (TaKaRa, Kusatsu, Japan). P. lactiflora actin (JN105299) was chosen as the internal control. qRT-PCR was carried out using the SYBR® Premix Ex TaqTM (Perfect Real Time) (TaKaRa). The thermocycler program was 50 °C for 2 min, 95 °C for 5 min, 40 cycles at 95 °C for 15 s, 51 °C for 15 s, and 72 °C for 40 s. The relative expression levels were calculated using the 2△△Ct comparative threshold cycle (Ct), and the expression level of PlPAL in S1 of ‘Dafugui’ was used as the control. The results were gathered using the Bio-Rad CFX Manager V1.6.541.1028 software.

2.6. Statistical Analysis

All data are represented as means of at least three replicates with standard deviations. Data were subjected to analysis of variance (ANOVA) using the SAS/STAT statistical analysis package (version 6.12, SAS Institute, Cary, NC, USA), and the differences were compared by Duncan’s test with a significance level of p < 0.05. The figures were drawn using SigmaPlot 10.0 (SPSS Inc., Chicago, IL, USA).

3. Results

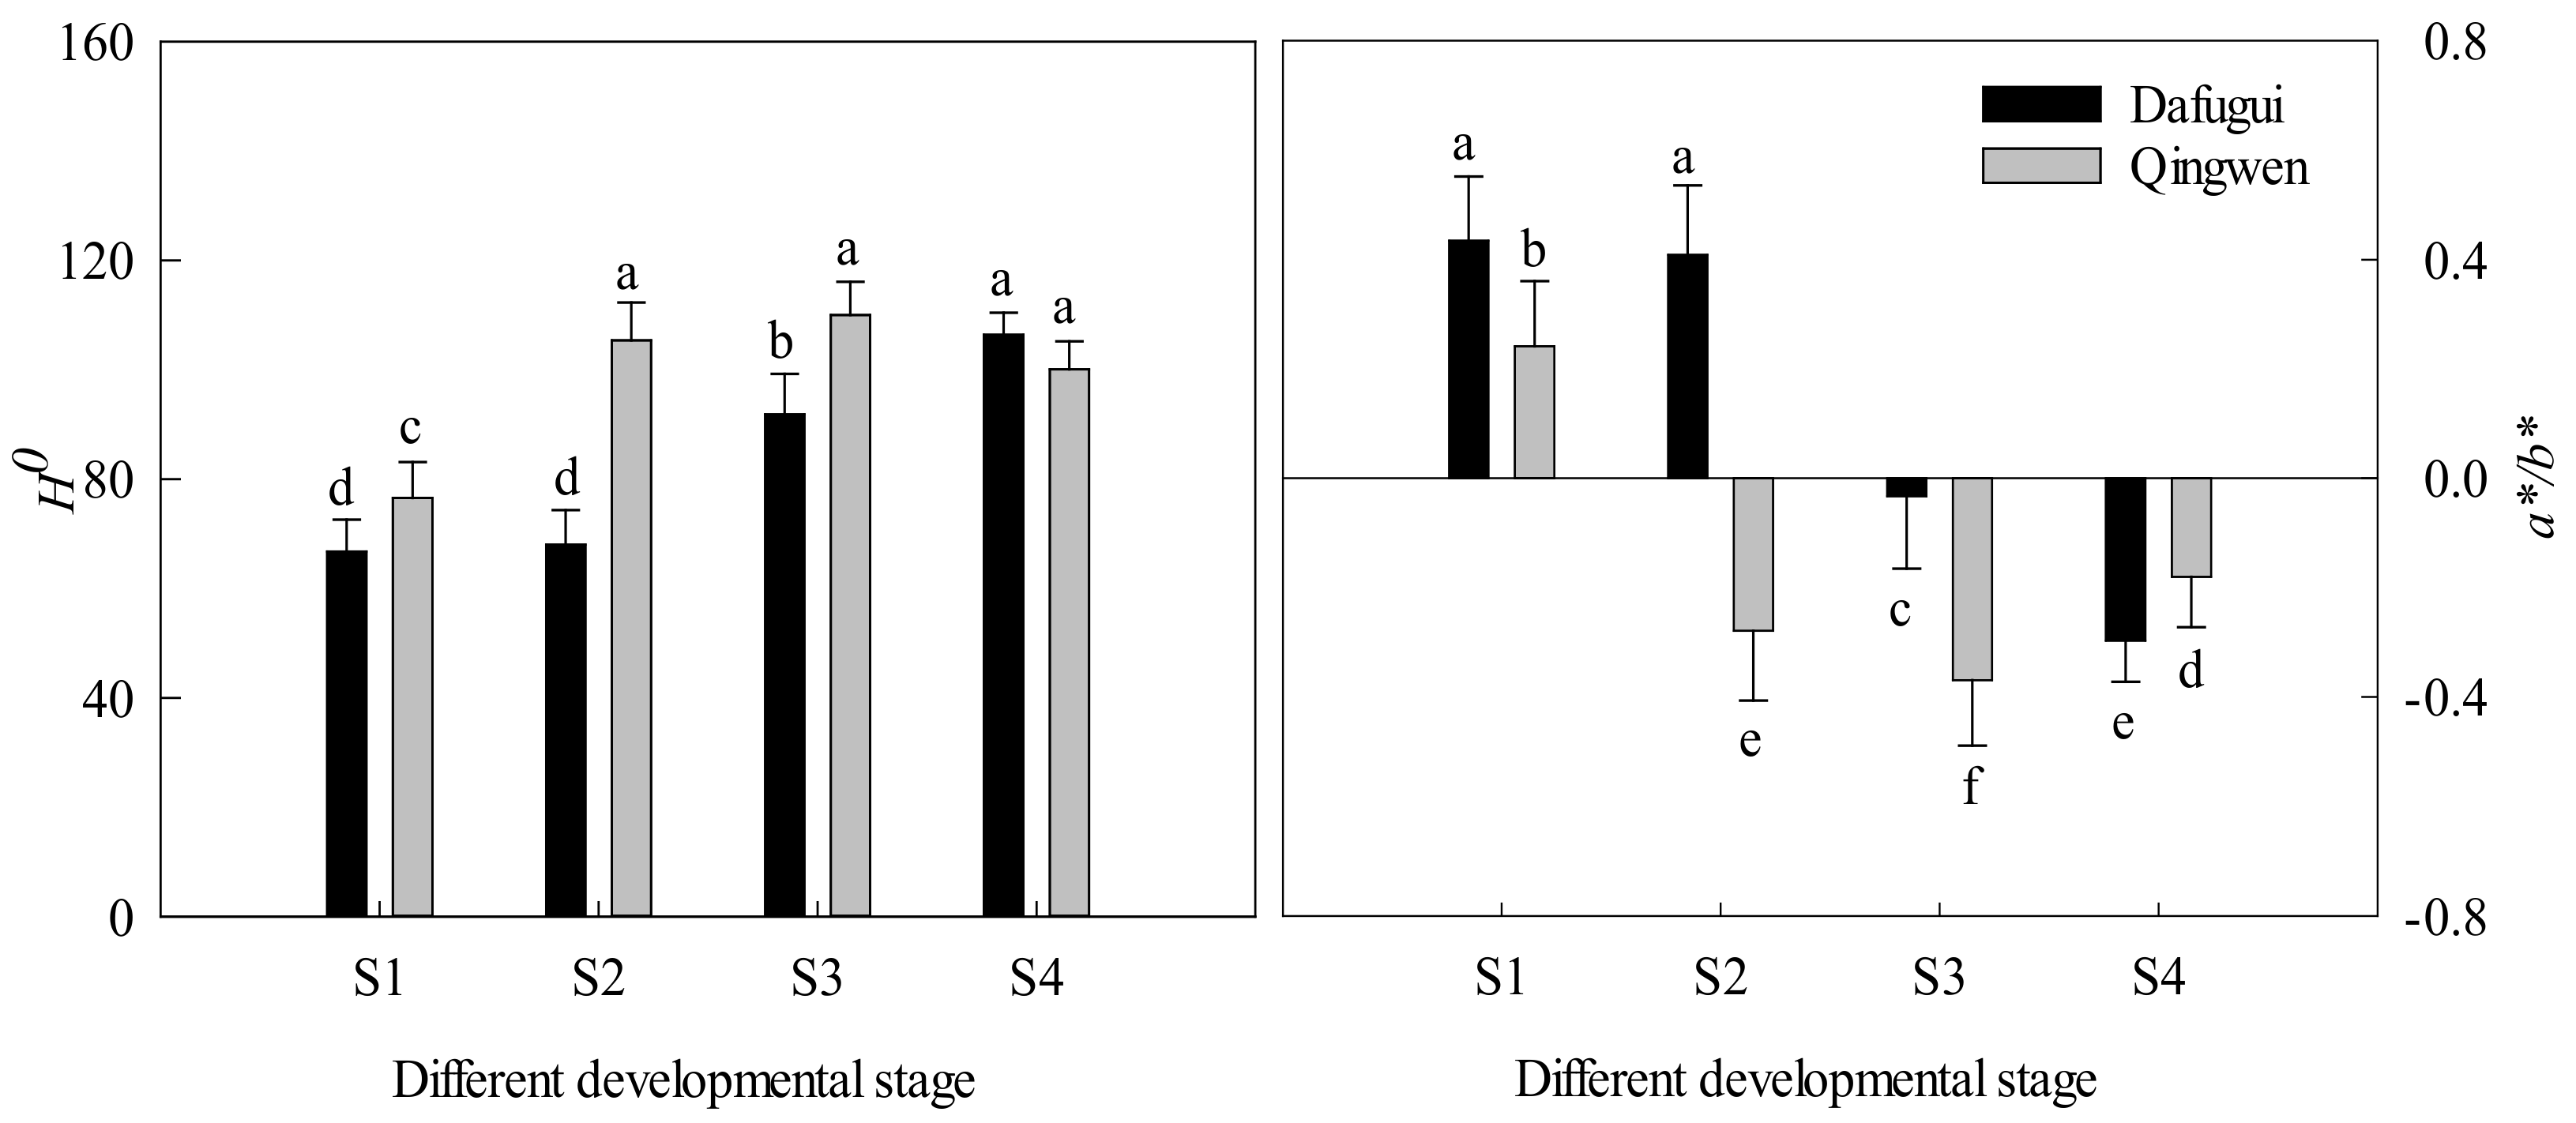
3.1. Flower Quality and Color Indices

The flower diameters of ‘Qingwen’ were somewhat bigger than those of ‘Dafugui’ during S1 and S2, but the difference was not significant; however, in S3 and S4, the flower diameters of ‘Qingwen’ were 3.34 and 2.85 mm larger than those of ‘Dafugui’ (Figure 2). There was a gradual increase in the fresh weight of the flowers from S1 to S3 followed by a decline in S4 in both cultivars. Moreover, the flower weights were significantly larger in ‘Qingwen’ than in ‘Dafugui’ in all four stages.
Figure 1 displays the flowers of red ‘Dafugui’ and pink ‘Qingwen’ in the four stages. The RHSCCs of ‘Dafugui’ and ‘Qingwen’ in S3 were 64A and 73B, respectively. To avoid the effects of differences in color perception among human observers and to achieve a more objective notation of flower color, a chromameter was used to measure the color indices (Figure 3). According to the CIELAB color space system (the Commission Internationale de l’Eclairage (CIE)), was as follows: 0° for reddish-purple, 90° for yellow, 180° for bluish-green, and 270° for blue [20]. The larger the value of a*/b*, the redder the petals would appear [27,28]. The pink ‘Qingwen’ had higher values and lower a*/b* values than the red ‘Dafugui’. The values of both the cultivars were found to gradually increase with the development of the flowers, whereas the a*/b* values decreased, indicating that the flowers’ colors faded as they developed. These data describing the color difference between the flowers of two cultivars at different developmental stages were consistent with the visual results.

3.2. Analysis of the Anthocyanins, Flavones, and Flavonols

All eight of the chromatograms less than 525 nm, which detected anthocyanins, were found to possess the same number of peaks, with almost the same retention time but different intensity (Figure 4A), and the same phenomenon appeared in the chromatograms less than 350 nm, which detected flavones and flavonols (Figure 4B). These results indicate that the two cultivars had the same composition of anthocyanins, flavones, and flavonols. There were two peaks, a1 and a2, in the chromatograms of anthocyanins in both the cultivars, with the solvent peak (the peak appeared before a1) deducted. The molecular ion of a1 was m/z 611.2 [M+H]+, with two major fragments at m/z 448.9 [M+H-162]+ and 287.2 [M+H-162-162]+ (m/z 449 for cyanidin glucoside and m/z 287 for cyanidin). Based on other papers [18,29], a1 was identified as Cy3G5G. Similarly, a2 was identified as Pn3G5G. Fourteen flavones and flavonols were detected under 350 nm, and five were detected. Peak f1 with the [M+H]+ molecular ion at m/z 627.03 and two major fragments at m/z 464.9 [M+H-162]+ and 303.3 [M+H-162-162]+ were identified as quercetin di-hexoside [30]. Likewise, f2, f3, f4, and f5 were identified as kaempferol di-hexoside, isorhamnetin di-hexoside, quercetin-3-O-rhamnoside, and luteolin-7-O-glucoside, respectively (Table 1).
Both the composition of the pigments and their contents in the petals need consideration. Therefore, TA, TF, and CI were calculated to examine whether they were related to the color depth of the petals (Figure 5). The TA of ‘Dafugui’ was approximately four to five times that of ‘Qingwen’ in S1 to S3 and almost two times that in S4, in which stage the anthocyanin content was the least. Conversely, the TF of ‘Qingwen’ was about two to three times that of ‘Dafugui’ in the four stages. When compared with TA and TF, both these two cultivars were found to have much higher TF than TA. As the CI indicated, the TF was approximately 16–40 times that of TA in ‘Qingwen’ and 1.5–7 times that in ‘Dafugui’. In terms of development of the flowers, the TA of both the cultivars, as well as TF of ‘Dafugui’, was found to demonstrate obvious downtrends from S1 to S4, while the TF of ‘Qingwen’ was irregular.

3.3. Anthocyanin Biosynthetic Genes Expression Analysis

To examine whether anthocyanin accumulation in the flower during its development is related to the expression patterns of the anthocyanin biosynthetic genes, the expression levels of 11 genes involved in the pathway during four stages were analyzed in the flower petals (Figure 6), which included PlPAL, PlC4H, PlCHS, PlCHI, PlF3H, PlF3′H, PlANS, PlFLS, PlDFR, PlUF3GT, and PlUF5GT. Briefly, the expression of PlCHS was the highest among the 11 genes in both the cultivars, and that of PlUF5GT was the lowest. The expression pattern of the 11 genes differed between the two cultivars: the early genes PlPAL and PlF3′H, as well as the late genes PlANS and PlUF3GT, were found to have distinctly higher overall expression levels in ‘Dafugui’ than in ‘Qingwen’. However, the expression of PlCHI, PlFLS and PlUF5GT was found to be opposite. During the development of the flowers, the genes were all expressed with a certain regularity except PlUF3GT. PlPAL and PlF3′H were expressed in abundance initially and then gradually expressed at lower levels, followed by a final mild increase in the levels in S4. In general, the expression levels of PlPAL, PlCHS, PlF3H, PlDFR, PlANS, and PlUF5GT declined with the flower development; however, the expression levels of PlCHI, PlC4H, and PlFLS increased.

4. Discussion

Flowers are important organs in ornamental plants; their quality changes with certain regularity during its development. The petal color of red cotton flower deepens dramatically after blooming [33]. In P. lactiflora, the petal color in different blooming stages was measured by the Royal Horticultural Society Colour Chart (RHSCC), and its color changed from red-purple to violet [30], which has been previously proved by Zhao et al. [17]. In this study, the color of P. suffruticosa petals with white and red flowers presented a contrary tendency with P. lactiflora; that is, its color deepened gradually as the flower developed, which was in line with the report by Zhou et al. [18]. This result shows that the law of growth and development differed between plants, and even closely related plants had certain specificity in their development.
The coloration of flowers critically depends on the composition and contents of pigments in their petals. Among the various natural pigments, anthocyanins chiefly contribute to the pink, red, purple, and blue cyanic colors of petals [9,10]. In certain species, some anthocyanins have been identified in red flowers. In the tree peony, only one composition of anthocyanin, Pn3G5G, was found in red flowers, whereas no anthocyanins were found in white flowers [34]. Additionally, in P. lactiflora, Jia et al. [17] identified deep purple or reddish-purple cultivars containing 4–5 anthocyanins, whereas pink cultivars only contained two anthocyanins (Cy3G5G and Pn3G5G), with much lower contents than those of the purple cultivars. This study identified two kinds of anthocyanins, Cy3G5G and Pn3G5G, from both the cultivars of P. lactiflora. The statistics from the HPLC chromatograms indicated that the two cultivars in all four developmental stages had the same kinds of pigments but different contents.
When the contents of the anthocyanins and the flavones and flavonols were considered, both TA and TF of ‘Dafugui’ were found to be higher than those of ‘Qingwen’; TF was higher than TA in both ‘Dafugui’ and ‘Qingwen’. In the study by Jia et al. [17], the TA of the pink cultivars was identified to be always lower than that of the purple ones in P. lactiflora, but for TF, it was not absolute. TF was found to be higher than TA in the pink cultivars, but for the purple ones, this was not absolute. In conclusion, the lower TA in ‘Qingwen’ resulted in a light pink color of flowers, and on the contrary, the higher TA in ‘Dafugui’ resulted in deep red color of flowers. The depth of the red color in P. lactiflora flowers depended on the anthocyanin content, such that the redness of the flowers is indicative of more anthocyanins in the petals. Although TF was much higher than TA, the colorless or pale yellow flavones and flavonols [9] could only account for the color of anthocyanins to a small extent. This could also be deduced from the phenomenon in which the color of ‘Qingwen’ lightened from S1 to S4, with the TA reducing regularly but the TF fluctuating irregularly.
A series of structural and regulatory genes are related to the anthocyanin biosynthetic pathway, and the expression of the structural genes is directly associated with the accumulation of anthocyanins [35]. In tree peony, the expression levels of DFR and ANS in red flowers were much higher than those in white flowers, which changed the proportion of anthoxanthins to anthocyanins and brought about a red color [34]. Meanwhile in P. lactiflora, the expression levels of PlPAL, PlCHS, PlCHI, PlF3H, PlF3′H, PlDFR, PlANS, PlUF3GT, and PlUF5GT in white flowers were all lower than those in red flowers, especially PlDFR, PlANS, and PlUF3GT, which induced the formation of a large amount of colored anthocyanins from anthoxanthins [25]. In this study, the expression levels of all 10 genes were analyzed, and the results showed that the early genes PlPAL and PlF3′H, as well as the late genes PlANS and PlUF3GT, had higher overall expression in ‘Dafugui’ than in ‘Qingwen’, while the results for PlCHI and PlUF5GT were opposite. These results suggest that the expression of the structural genes in the anthocyanin biosynthetic pathway is directly associated with the accumulation of anthocyanins. ‘Dafugui’ was found to accumulate a high amount of the initial precursor for anthocyanins due to the higher expression level of PlPAL. Subsequently, a large number of intermediate products were produced, although with lower expression levels of PlC4H, PlCHS, PlCHI, and PlF3H. Finally, with higher expression levels of PlDFR, PlANS, and PlUF3GT, the substances above were found to be catalyzed by these enzymes step-by-step and formed colored anthocyanins. In this process, the leucoanthocyanidins were converted by PlANS into the corresponding anthocyanidins. Then, the glucosylation reaction was catalyzed by PlUF3GT and PlUF5GT such that anthocyanidins could be converted into stable anthocyanins [9]. However, in ‘Qingwen’, the upstream substances were insufficient because of the low expression levels of the early genes PlPAL and PlF3′H. Additionally, the formation of anthocyanins was inhibited by the low expression levels of the late genes PlANS and PlUF3GT, which resulted in a light pink color of petals. It could be seen that PlPAL, PlF3′H, PlANS, and PlUF3GT were identified as critical genes in anthocyanin accumulation, contributing to the discrepancy in the red color of the flowers of the ‘Dafugui’ and ‘Qingwen’ cultivars. However, this result is not in accordance with studies of other species. In litchi, only the late genes in the anthocyanin biosynthetic pathway are coordinately expressed in red-colored pericarp, and the regulating genes affect the anthocyanin accumulation to produce different colors of the pericarp in different cultivars [19]. In addition, expressions of DFR and UFGT were consistent with the anthocyanin contents in different color genotypes of litchi [19], apple [36], and bayberry [37], while in grapes [38], only UFGT accounted for the difference in the coloration between the white and the red varieties. This difference might be due to the difference in the genetic background of the materials studied.

5. Conclusions

In P. lactiflora cultivars ‘Dafugui’ and ‘Qingwen’, the same compositions of anthocyanins were found, and the depth of the red color was determined by the anthocyanin contents. Low expressions of the early genes (especially PlPAL and PlF3′H) resulted in insufficient upstream substances, and the formation of anthocyanins was inhibited by low expression levels of the late genes (especially PlANS and PlUF3GT), which resulted in a light pink color of petals. This study can serve as a theoretical basis for breeding more red flowers using genetic engineering techniques to cater to the preferences of consumers.

Supplementary Materials

The following supporting information can be downloaded at: https://www.mdpi.com/article/10.3390/horticulturae8040349/s1, Figure S1: The schematic diagram of anthocyanin biosynthesis pathway in plants [18]. PAL, phenylalanine ammonia lyase gene; C4H, cinnamate-4-hydroxylase gene; 4CL, 4-coumarate: CoA ligase gene; CHS, chalcone synthase gene; CHI, chalcone isomerase gene; F3H, flavanone 3-hydroxylase gene; F3′H, flavonoid 3′-hydroxylase gene; F3′, 5′H. flavonoid 3′,5′-hydroxylase gene; DFR, dihydroflavonol 4-reductase gene; ANS, anthocyanidin synthase gene; UFGT, UDP-glucose: flavonoid glucosyltransferase gene; MT, methyl transferase gene; Table S1: Morphological parameters of P. lactiflora cv. ‘Dafugui’ and ‘Qingwen’. The values represented the mean ± SDs, and different letters indicate significant differences (p < 0.05).

Author Contributions

D.Z. and Y.W. planned and designed the experiments. Y.W., Z.H. and Y.T. performed the experiments. Y.W. analyzed the data and wrote the manuscript. All authors have read and agreed to the published version of the manuscript.

Funding

This work was supported by the National Natural Science Funds (32102411), the Natural Science Foundation of Jiangsu Province of China (BK20200924), the Natural Science Foundation of Jiangsu Higher Education Institutions of China (20KJB210005), Jiangsu Association for Science and Technology young Scientific and technological Talents Project- Supported by Yanqing Wu, the Agricultural Science & Technology Independent Innovation Fund of Jiangsu Province (CX [20]3021, CX [20]3186), Qing Lan Project of Jiangsu Province and High-Level Talent Support Program of Yangzhou University.

Institutional Review Board Statement

Not applicable.

Informed Consent Statement

Not applicable.

Data Availability Statement

Not applicable.

Conflicts of Interest

The authors declare that they have no competing interest.

References

  1. Yan, Z.G.; Li, M.C.; Xie, L.H.; Luo, X.N.; Yang, W.Z.; Yuan, Y.P.; Zhang, Y.L. A systematic comparison of 17 cultivated herbaceous peony seed based on phytochemicals and antioxidant activity. Eur. Food. Res. Technol. 2020, 246, 1919–1932. [Google Scholar] [CrossRef]
  2. Wang, J.G.; Zhang, Z.S. Herbaceous Peonies of China; China Forestry Publishing House: Beijing, China, 2005. [Google Scholar]
  3. Zhao, D.; Cheng, M.; Tang, W.; Liu, D.; Zhou, S.; Meng, J.; Tao, J. Nano-silver modifies the vase life of cut herbaceous peony (Paeonia lactiflora Pall.) flowers. Protoplasma 2018, 255, 1001–1013. [Google Scholar] [CrossRef] [PubMed]
  4. Wei, D.X.; Tang, Z.J.; da Silva, T.; Yu, X.N. In vitro induction of polyploidy by colchicine treatment in herbaceous peony (Paeonia lactiflora Pall.). Acta Hortic. 2017, 1171, 265–278. [Google Scholar] [CrossRef]
  5. Wan, Y.L.; Zhang, M.; Hong, A.Y.; Zhang, Y.X.; Liu, Y. Characteristics of microsatellites mined from transcriptome data and the development of novel markers in Paeonia lactiflora. Genes 2020, 11, 214. [Google Scholar] [CrossRef] [PubMed] [Green Version]
  6. Zhang, D.J.; Zhang, R.J.; Sun, L.; Wu, Y.Q.; Li, C.D.; Xiang, L.T.; Zhao, Y.X. A Cultivation experiment of introduced cut lily cultivars in Shanghai area. J. Shanghai Jiao Tong Univ. (Agric. Sci.) 2016, 34, 65–83. (In Chinese) [Google Scholar] [CrossRef]
  7. Min, J.; Xiang, Y.C.; Tian, D.K. Consumption Demand and market potential of cut lotus flower in China. J. Anhui Agric. Sci. 2018, 46, 212–217. (In Chinese) [Google Scholar] [CrossRef]
  8. Elliot, A.J.; Maier, M.A. Color Psychology: Effects of Perceiving Color on Psychological Functioning in Humans. Annu. Rev. Psychol. 2014, 65, 95–120. [Google Scholar] [CrossRef]
  9. Tanaka, Y.; Brugliera, F.; Kalc, G.; Senior, M.; Dyson, B.; Nakamura, N.; Katsumoto, Y.; Chandler, S. Flower color modification by engineering of the flavonoid biosynthetic pathway: Practical perspectives. Biosci. Biotechnol. Biochem. 2010, 74, 1760–1769. [Google Scholar] [CrossRef] [Green Version]
  10. Mol, J.; Grotewold, E.; Koes, R. How genes paint flowers and seeds. Trends Plant Sci. 1998, 3, 212–217. [Google Scholar] [CrossRef]
  11. Khoo, H.E.; Azlan, A.; Tang, S.T.; Lim, S.M. Anthocyanidins and anthocyanins: Colored pigments as food, pharmaceutical ingredients, and the potential health benefits. Food Nutr. Res. 2017, 61, 136–1779. [Google Scholar] [CrossRef] [Green Version]
  12. Forkmann, G. Flavonoids as flower pigments: The formation of the natural spectrum and its extension by genetic engineering. Plant Breed. 1991, 106, 1–26. [Google Scholar] [CrossRef]
  13. Kong, J.M.; Chia, L.S.; Goh, N.K.; Chia, T.F.; Brouillard, R. Analysis and biological activities of anthocyanins. Phytochemistry 2003, 64, 923–933. [Google Scholar] [CrossRef]
  14. Mizuta, D.; Ban, T.; Miyajima, I.; Nakatsuka, A.; Kobayashi, N. Comparison of flower color with anthocyanin composition patterns in evergreen azalea. Sci. Hortic. 2009, 122, 594–602. [Google Scholar] [CrossRef]
  15. Tatsuzawa, F.; Saito, N.; Toki, K.; Shinoda, K.; Honda, T. Flower colors and their anthocyanins in Matthiola incana cultivars (Brassicaceae). J. Jpn. Soc. Hortic. Sci. 2012, 81, 91–100. [Google Scholar] [CrossRef] [Green Version]
  16. Zhu, M.; Zheng, X.; Shu, Q.; Li, H.; Zhong, P.; Zhang, H.; Xu, Y.; Wang, L.; Wang, L. Relationship between the composition of flavonoids and flower colors variation in tropical water lily (Nymphaea) cultivars. PLoS ONE 2012, 7, e34335. [Google Scholar] [CrossRef] [Green Version]
  17. Jia, N.; Shu, Q.Y.; Wang, L.S.; Du, H.; Xu, Y.J.; Liu, Z.A. Analysis of petal anthocyanins to investigate coloration mechanism in herbaceous peony cultivars. Sci. Hortic. 2008, 117, 167–173. [Google Scholar] [CrossRef]
  18. Zhao, D.Q.; Tao, J. Recent advances on the development and regulation of flower color in ornamental plants. Front. Plant Sci. 2015, 6, 261. [Google Scholar] [CrossRef] [Green Version]
  19. Filyushin, M.A.; Dzhos, E.A.; Shchennikova, A.V.; Kochieva, E.Z. Dependence of pepper fruit colour on basic pigments ratio and expression pattern of carotenoid and anthocyanin biosynthesis genes. Russ. J. Plant Physl. 2020, 67, 1054–1062. [Google Scholar] [CrossRef]
  20. Hossain, M.R.; Kim, H.T.; Shanmugam, A.; Nath, U.K.; Goswami, G.; Song, J.Y.; Park, J.I.; Nou, I.S. Expression profiling of regulatory and biosynthetic genes in contrastingly anthocyanin rich strawberry (Fragaria x ananassa) cultivars reveals key genetic determinants of fruit color. Int. J. Mol. Sci. 2018, 19, 656. [Google Scholar] [CrossRef] [Green Version]
  21. Karanjalker, G.R.; Ravishankar, K.V.; Shivashankara, K.S.; Dinesh, M.R.; Roy, T.K.; Rao, D.V.S. A study on the expression of genes involved in carotenoids and anthocyanins during ripening in fruit peel of green, yellow, and red colored mango cultivars. Appl. Biochem. Biotechnol. 2018, 184, 140–154. [Google Scholar] [CrossRef]
  22. Maritim, T.K.; Masand, M.; Seth, R.; Sharma, R.K. Transcriptional analysis reveals key insights into seasonal induced anthocyanin degradation and leaf color transition in purple tea (Camellia sinensis (L.) O. Kuntze). Sci. Rep. 2021, 11, 1244. [Google Scholar] [CrossRef] [PubMed]
  23. Tang, Y.H.; Fang, Z.W.; Liu, M.; Zhao, D.Q.; Jun, T. Color characteristics, pigment accumulation and biosynthetic analyses of leaf color variation in herbaceous peony (Paeonia lactifora Pall.). 3 Biotech 2020, 10, 76. [Google Scholar] [CrossRef]
  24. Kanemakia, A.; Otania, M.; Takanoa, M.; Fujimotoa, T.; Okuharab, H.; Nomizub, T.; Kondob, M.; Kobayashib, H.; Tatsuzawac, F.; Nakano, M. Ectopic expression of the R2R3-MYB gene from Tricyrtis sp. results in leaf color alteration in transgenic Pelargonium crispum. Sci. Hortic. 2018, 240, 411–416. [Google Scholar] [CrossRef]
  25. Zhao, D.; Tao, J.; Han, C.; Ge, J. Flower color diversity revealed by differential expression of flavonoid biosynthetic genes and flavonoid accumulation in herbaceous peony (Paeonia lactiflora Pall.). Mol. Biol. Rep. 2012, 39, 11263–11275. [Google Scholar] [CrossRef] [PubMed]
  26. Zhao, D.Q.; Sheng, Y.L.; Zhou, C.H. Method of non-destructive measurement research on leaf area and fruit fresh weight of Ginkgo biloba. North. Hortic. 2010, 7, 28–30. [Google Scholar] [CrossRef]
  27. McGuire, R.G. Reporting of objective color measurements. Hortscience 1992, 27, 1254–1255. [Google Scholar] [CrossRef] [Green Version]
  28. Voss, D.H. Relating colorimeter measurement of plant color to the Royal Horticultural Society Colour Chart. HortScience Publ. Am. Soc. Hortic. Sci. 1992, 27, 1256–1260. [Google Scholar] [CrossRef]
  29. Wang, L.S.; Shiraishi, A.; Hashimoto, F.; Aoki, N.; Sakata, Y. Analysis of petal anthocyanins to investigate flower coloration of Zhongyuan (Chinese) and Daikon Island (Japanese) tree peony cultivars. J. Plant Res. 2001, 114, 33–43. [Google Scholar] [CrossRef]
  30. Auger, B.; Marnet, N.; Gautier, V.; Maja-Grondard, A.; Leprine, F.; Renard, M.; Juyot, S.; Nesi, S.; Routaboul, J.M. A detailed survey of seed coat flavonoids in developing seeds of Brassica napus L. J. Agric. Food Chem. 2010, 58, 6246–6256. [Google Scholar] [CrossRef]
  31. Fan, J.; Zhu, W.; Kang, H.; Ma, H.; Tao, G. Flavonoid constituents and antioxidant capacity in flowers of different Zhongyuan tree penoy cultivars. J. Funct. Foods 2012, 4, 147–157. [Google Scholar] [CrossRef]
  32. Tuberoso, C.I.G.; Montoro, P.; Piacente, S.; Corona, G.; Deiana, M.; Dessi, M.A.; Pizza, C.; Cabras, P. Flavonoid characterization and antioxidant activity of hydroalcoholic extracts from Achillea ligustica All. J. Pharm. Biomed. 2009, 50, 440–448. [Google Scholar] [CrossRef]
  33. Villanueva, E.; Fujibayashi-Yoshii, N.; Matsuzaki, S.; Yamazaki, K.; Burana, C.; Yamane, K. Effects of trehalose and sucrose on the vase life and physiology of cut astilbe (Astilbe x arendsii Arends) flowers. Horticult. J. 2019, 88, 276–283. [Google Scholar] [CrossRef] [Green Version]
  34. Zhao, D.Q.; Tang, W.H.; Hao, Z.J.; Tao, J. Identification of flavonoids and expression of flavonoid biosynthetic genes in two coloured tree peony flowers. Biochem. Bioph. Res. Co. 2015, 459, 450–456. [Google Scholar] [CrossRef] [PubMed]
  35. Nakatsuka, T.; Nishihara, M.; Mishiba, K.; Yamamura, S. Temporal expression of flavonoid biosynthesis-related genes regulates flower pigmentation in gentian plants. Plant Sci. 2005, 168, 1309–1318. [Google Scholar] [CrossRef]
  36. Wang, N.; Liu, W.J.; Chen, X.S. Transcriptomic Analysis of red-fleshed apples reveals the novel role of MdWRKY11 in flavonoid and anthocyanin biosynthesis. J. Agric. Food Chem. 2018, 66, 7076–7086. [Google Scholar] [CrossRef]
  37. Niu, S.S.; Xu, C.J.; Zhang, W.S.; Zhang, B.; Li, X.; Lin-Wang, K.; Ferguson, I.B.; Allan, A.C.; Chen, K.S. Coordinated regulation of anthocyanin biosynthesis in chinese bayberry (Myrica rubra) fruit by a R2R3 Myb transcription factor. Planta 2010, 231, 887–899. [Google Scholar] [CrossRef]
  38. Kobayashi, S.; Ishimaru, M.; Ding, C.K.; Yakushiji, H.; Goto, N. Comparison of udp-glucose: Flavonoid 3-o-glucosyltransferase (UFGT) gene sequences between white grapes (Vitis vinifera) and their sports with red skin. Plant Sci. 2001, 160, 543–550. [Google Scholar] [CrossRef]
Figure 1. Flowers of P. lactiflora cv. ‘Dafugui’ and ‘Qingwen’ in four developmental stages. S1: flower-bud stage; S2: initiating bloom; S3: bloom stage; S4: withering stage. Bar: 2 cm.
Horticulturae 08 00349 g001
Figure 2. Flower diameter and fresh weight of P. lactiflora cv. ‘Dafugui’ and ‘Qingwen’. S1: flower-bud stage; S2: initiating bloom; S3: bloom stage; S4: withering stage. The values represent the mean ± SDs, and different letters indicate significant differences (p < 0.05).
Horticulturae 08 00349 g002
Figure 3. Flower color indices of P. lactiflora cv. ‘Dafugui’ and ‘Qingwen’. For stage designations, see Figure 2. The values represent the mean ± SDs, and different letters indicate significant differences (p < 0.05).
Horticulturae 08 00349 g003
Figure 4. HPLC–PDA–MS profiles of P. lactiflora cv. ‘ Dafugui’ and ‘Qingwen’. (A) Chromatograms under 525 nm, detecting anthocyanins; (B) chromatograms under 350 nm, detecting flavones and flavonols. For stage designations, see Figure 2. Peaks a1–a2 and f1–f5 are listed in Table 1.
Horticulturae 08 00349 g004
Figure 5. TA and TF in the different developmental stages of flower in P. lactiflora cv. ‘Dafugui’ and ‘Qingwen’. TA: total anthocyanin content; TF: total flavone and flavonol contents; CI: copigmentation index (CI = TF/TA). For stage designations, see Figure 2. The values represent the mean ± SDs, and different letters indicate significant differences (p < 0.05).
Horticulturae 08 00349 g005
Figure 6. Expression analysis of the anthocyanin biosynthetic genes in the flower of P. lactiflora cv. ‘Dafugui’ and ‘Qingwen’. PlPAL: phenylalanine ammonialyase gene; PlC4H: cinnamate 4-hydroxylase gene; PlCHS: chalcone synthase gene; PlCHI: chalcone isomerase gene; PlF3H: flavanone 3-hydroxylase gene; PlF3′H: flavonoid 3′-hydroxylase gene; PlDFR: dihydroflavonol reductase gene; PlANS: anthocyanidin synthase gene; PlFLS: flavonol synthase gene; PlUF3GT: UDP-Glucose: flavonoid 3-O-glucosyltransferase gene; PlUF5GT: UDP-Glucose: flavonoid 5-O-glucosyltransferase gene. For stage designations, see Figure 2. The values represent the mean ± SDs, and different letters indicate significant differences (p < 0.05).
Horticulturae 08 00349 g006
Table 1. Anthocyanins and flavonols identified in the petals of P. lactiflora cv. ‘Dafugui’ and ‘Qingwen’. tR: retention time (min); λmax: maximum absorption wavelength (nm); MS1: molecular ion; MS2: fragment ions of secondary ion mass spectrum.
PeaktR (min)λmax (nm)MS1 (m/z)MS2 (m/z)Identification
a13.01235, 275, 515611.2448.9, 287.2Cyanidin-3,5-di-O-glucoside [17,29]
a24.80275, 510625.2462.9, 301.1Peonidin-3,5-di-O-glucoside [17]
f17.31235, 315627.0464.9, 303.3Quercetin di-hexoside [30]
f210.32265, 345611.1449.1, 287.3Kaempferol di-hexoside [31]
f311.57255, 355641.0478.9, 317.0Isorhamnetin di-hexoside [31]
f421.75235, 370465.1303.2Quercetin-3-O-rhamnoside [32]
f529.19230, 265, 365449.1287.2Luteolin-7-O-glucoside [32]
Publisher’s Note: MDPI stays neutral with regard to jurisdictional claims in published maps and institutional affiliations.

