Article

Physiological, Biochemical, and Agronomic Trait Responses of Nigella sativa Genotypes to Water Stress

1
Department of Agronomy and Plant Breeding, College of Agriculture, Isfahan University of Technology, Isfahan 84156-83111, Iran
2
Department of Molecular and Translational Medicine, Division of Pharmacology, University of Brescia, 25123 Brescia, Italy
3
Faculty of Science and Engineering, University of Wolverhampton, Wulfruna Street, Wolverhampton WV1 1LY, UK
*
Authors to whom correspondence should be addressed.
These authors contributed equally to this work.
Horticulturae 2022, 8(3), 193; https://doi.org/10.3390/horticulturae8030193
Submission received: 10 February 2022 / Revised: 17 February 2022 / Accepted: 18 February 2022 / Published: 23 February 2022
(This article belongs to the Special Issue Sustainable Production and Utilization of Oilseed Crops)

Abstract

:
Water stress may affect the growth, physiology, morphology, biochemistry, and productivity of Nigella sativa (black cumin), a medicinal and aromatic plant. Measuring these parameters under various irrigation regimes could provide useful information for successful genotype selection and breeding. Therefore, these agronomically significant features were evaluated in ten black cumin genotypes (Afghanistan, Pakistan, Syria, India, Arak, Isfahan, Semirom, Shahreza, Shahrekord, and Mashhad) under three irrigation regimes (40% (I1), 60% (I2), and 80% (I3) of permissible moisture discharge) during the 2017 to 2018 growing seasons. Water stress was shown to increase the levels of carotenoids (Cars), proline, total soluble carbohydrates (TSC), malondialdehyde (MDA), hydrogen peroxide (H2O2), catalase (CAT), and ascorbate peroxidase (APX) activities but reduced the relative water content (RWC) and chlorophyll content. The highest increases in Cars, TSC, proline, CAT, and APX were noted in the Arak, Isfahan, Semirom, Shahreza, Shahrekord, and Mashhad genotypes under the I3 water regime, respectively. At the same time, the lowest decrease was observed in chlorophyll, H2O2, and relative water content (RWC) in Semirom. According to the stress susceptibility index, the most resistant genotypes were Shahrekord under I2 and Semirom under I3. These data demonstrate that the irrigation regimes affected the physiological, biochemical, and morphological features of black cumin both qualitatively and quantitatively, although the impact varied depending upon the genotype, irrigation regime, and traits. As such, the results presented represent valuable information with which to inform future selection and breeding programs for drought-tolerant black cumin. This is of particular significance considering global climate change.

1. Introduction

Drought is widely acknowledged as one of the most limiting abiotic stresses affecting global agricultural productivity [1,2,3,4,5,6]. Climate change, insufficient and variable distribution of rainfall, population increase, and agricultural mismanagement have all contributed to water shortages, which have harmed the growth and development of crop species [2,7,8,9,10,11,12]. The effect of drought stress on plants is influenced by the level of drought and its duration, environmental factors, such as salt and heat stress, the genotype of the plant, and the plants’ life cycle [13,14,15,16]. The adverse effects of drought can be mitigated by implementing a variety of innovative management strategies. Under drought stress, some aromatic and medicinal plant species develop secondary metabolites with significant economic value [4]. Zali and Ehsanzadeh found that drought stress increased the production of leaf polyphenol and essential oil concentrations in fennel (Foeniculum vulgare Mill.) [7,17]. Several studies have also shown that drought had beneficial impacts on secondary metabolite biosynthesis, solute accumulation, and enzyme activity [5,8,9,10,18,19,20,21,22]. Cultivation of drought-tolerant genotypes of medicinal and aromatic plant species, on the other hand, could be another way to address water scarcity issues. The success of this approach was reported in some crops, such as caraway [22], pot marigold [23], cumin [24], and several other species [25]. Drought-resistant fennel genotypes, such as Shiraz and Yazd, demonstrated an increase in the accumulation of osmotic solutes and carotenoids, according to Askari and colleagues [26,27]. It is also feasible to boost bioactive plant components by inducing the formation of secondary metabolites under the most appropriate irrigation regime. For example, higher levels of secondary metabolites in pot marigold were obtained under 60 percent depletion of available soil water [23]. Alinian and colleagues suggested that an irrigation regime of 150 and 200 mm evaporation (based on a Class A pan) in cumin could result in higher leaf flavonoid and seed phenolic contents, respectively [24]. Laribi and collaborators also reported on the selection of appropriate irrigation regimes to increase the secondary metabolite production in caraway [22]. In this regard, other authors reported good results in chamomile (Matricaria chamomilla) [28] and in Thymus carmanicus [29]. The literature demonstrates that, while medicinal plant yields may be reduced, considerable gains in secondary metabolite production can be achieved by adopting drought-tolerant species and genotypes within species in conjunction with an appropriate watering scheme.
Black cumin (Nigella sativa L.) is a medicinal plant in the Ranunculaceae family, mostly grown for its seed and oil production. The traditional medicine, pharmaceutical, and food industries commonly use black cumin [30,31]. Anthelmintic, antiviral, antibacterial, antipyretic, galactagogue, carminative, and blood sugar-reducing properties are all ascribed to the seeds of this species [31]. The seed yield of black cumin was reduced by water stress, but the essential oil, thymoquinone, and carvone contents were concomitantly increased [32]. However, further, more detailed investigation of the physiological, biochemical, and morphological response of black cumin genotypes to different irrigation regimes is required. Thus, the aim of the current study is to investigate how a selection of widely cultivated black cumin genotypes respond to different watering regimes and degrees of drought stress.

2. Materials and Methods

2.1. Experimental Arrangement

To evaluate the growth performance of black cumin, an open field experiment was performed at the College of Agriculture, Isfahan University of Technology Experimental Station located in Levark, Nejaf-Abad (latitude: 32° 32 N and longitude: 51 23° E; altitude: 1630 m) Isfahan, Iran during the 2017 and 2018 growing seasons. The soil consisted of fine loam with a pH of 7.8, an EC of 1.8 dS m−1, a bulk density of 1.47 g cm−3, a soil organic C content of 3.8 g kg−1, and nitrogen, phosphorus, and potassium levels of 420, 23.6, and 250 mg kg−1, respectively. The geographical region has an average annual rainfall of 140 mm and an average annual temperature of 14 °C. The ten selected genotypes of black cumin (Arak, Isfahan, Semirom, Shahreza, ShahrKord, Mashhad, Afghanistan, Pakistan, India, and Syria) were subjected to three irrigation regimes: 40% (I1), 60% (I2), and 80% (I3) of permissible humidity discharge from soil, indicating normal, moderate, and severe stress, respectively. In March 2017 and 2018, the black cumin seeds were planted in rows, spaced 5 cm apart. Each subplot consisted of four rows, 25 cm apart and 3 m in length. Drought stress was initiated when the plants reached the fourth stage of leaf development.

2.2. Irrigation Treatment

According to the assessment of water content in the root growth zone before irrigation, three degrees of irrigation (40% (I1), 60% (I2), and 80% (I3)) of permitted moisture discharge from soil were performed. The percentage increase or decrease of the different parameters was calculated considering I1 as the control group. Two soil samples from each subplot were taken at depths of 30 cm, 72 h after irrigation, to measure the moisture content in order to determine the water capacity of the soil profile under the three irrigation treatments. Equation (1) was used to compute the volume of water for each plot. The irrigation time was determined using Equations (2)–(4).
V W = A S W × P E a
In Equation (1), VW was the volume of water per irrigation in m3, Ea denotes the irrigation water use efficiency, and P denotes the maximum rate at which soil moisture can be discharged (40% control, medium stress 60%, and severe stress 80%).
A S W = ( θ F C θ P W P ) × P b × V
In Equation (2), ASW represents available soil moisture, FC represents the percentage of soil water content in the crop capacity point, PWP represents the percentage of moisture content at the permanent wilting point, Pb represents soil bulk density at the root growth zone in grams per cm3, and V represents the experimental unit size.
V = ( A × D )
In Equation (3), A is the square meter area of the main plot (length × breadth of the experimental plot), and D is the depth of root development.
θ i r r i g = θ F C ( θ F C θ P W P ) × P
In Equation (4), θirrig = volumetric soil moisture content.

2.3. Relative Water Content (RWC) and Photosynthetic Pigments Measurements

Chlorophyll content and RWC were measured at the 50% blooming stage of the crop. The second fully grown top leaves were used to calculate RWC. The weight of fresh leaves was measured immediately after they were excised. The turgid mass was calculated after the excised leaves were placed in distilled water for 4 h at 23 °C. After drying at 70 °C for 48 h, the dry biomass was measured. Finally, using Equation (5) [33], RWC was calculated:
R W C % = ( F r e s h   W e i g h t D r y   W e i g h t T u r g i d   W e i g h t D r y   W e i g h t   )   × 100
Fresh leaf material (200 mg) was obtained from completely expanded leaves of each treatment to measure the chlorophyll concentration. Samples were stored at −30 °C until the next step. The frozen leaves were crushed and extracted with 10 mL of acetone 80% (v/v). The slurry was filtered, centrifuged at 5000× g for 10 min (5810R, Eppendorf Refrigerated Centrifuge, Germany), and Chlorophyll a (Chl-a), Chlorophyll b (Chl-b), and Carotenoids (Cars) concentrations were measured using a spectrophotometer (U-1800 UV/VIS, Hitachi, Japan) at 645, 663, and 470 nm, respectively. Acetone (80% v/v) was used as the blank. According to Lichtenthaler and Wellburn, Chl-a, Chl-b, and Cars concentrations were determined and reported as mg•g–1 leaf fresh weight.

2.4. Determination of MDA, H2O2, Proline, and Total Soluble Carbohydrates Concentrations

These traits were measured at the 50% blooming stage of the crop. Malondialdehyde (MDA) was measured using the thiobarbituric acid (TBA) reaction, and the level of lipid peroxidation was quantified in terms of thiobarbituric acid reaction substances (TBARS) concentration according to previously reported protocols [34]. Fresh leaf material (100 mg) was frozen and stored at −30 °C until the analyses were performed. To homogenize the leaf samples, 0.5 mL of 0.1% TCA was used, followed by centrifugation at 10,000× g for 5 min. After centrifugation, 4 mL of 0.5% TBA in 20% TCA was added to 1 mL of the supernatant and heated for 30 min to 95 °C before quick cooling in an ice bath. The suspended turbidity was removed by centrifugation at 10,000× g for 15 min. The absorbance of the resultant supernatant was measured at 532 nm using a spectrophotometer (U-1800 UV/VIS, Hitachi, Japan). Nonspecific absorption was acquired at 600 nm and deducted. The TBARS concentration was determined using a 150 mM−1 cm−1 absorption coefficient, and the results were reported in mmol MDA g–1 leaf fresh mass.
The Bates method was used to determine proline content [35]. In particular, 500 mg of fully formed leaves from the plant’s apex was homogenized in a 3% aqueous solution of sulfosalicylic acid (10 mL), followed by filtration of the resulting product. Then, 2 mL of glacial acetic acid, 2 mL of ninhydrin reagents, and 2 mL of filtered extract were added. The mixture was boiled for 1 h at 100 °C before being cooled on ice. The toluene phase was separated and its absorbance measured at 520 nm after thoroughly mixing 4 mL of toluene with the cooled mixture.
Dried leaf material (0.1 g) was crushed, mixed in 13 mL of 80% ethanol, and centrifuged for 10 min to determine total soluble carbohydrate (TSC) content in the samples. The homogenized extract was then mixed with 1 mL of phenol 5% and 5 mL of sulfuric acid. After 30 min, the absorbance of the reaction extract was determined spectrophotometrically at 490 nm [36].
The H2O2 concentration was measured as described by Velikova and colleagues [37]. Leaf material (200 mg) was homogenized in 2 mL 0.1% (w/v) TCA and centrifuged at 10,000× g at 4 °C for 10 min, and 0.5 mL of the supernatant was added to 0.5 mL potassium-phosphate buffer (0.1M, pH 7.0) and 1 mL of KI (1M). The blend was incubated at room temperature for 1 h, then processed by measuring the retention at 390 nm. The H2O2 concentration was calculated using a standard curve.

2.5. Antioxidant Enzyme Activity

Catalase (CAT) and ascorbate peroxidase (APX) activities were measured by using fresh leaf material (0.1 g). The leaf samples were ground to a fine powder in a pre-chilled mortar and pestle using liquid nitrogen. Once the samples had been powdered, the powder was added to 1 mL of 50 mM sodium-phosphate buffer (pH 7) containing 2 mM dithiothreitol, 2 mM EDTA, 0.2% Triton X-100, and 50 mM Tris–HCl. The resultant sample was centrifuged at 12,000 rpm for 30 min at 4 °C, and the supernatant was used for measurement of CAT and APX activities [38]. Soluble protein was determined using bovine serum albumin (BSA) at 595 nm by a UV/VIS spectrophotometer according to the method described by Bradford [39].
Catalase activity was measured in a total volume of 3 mL of 50 mM sodium-phosphate buffer (pH 7.0) containing 4.51 μL of H2O2 (30%) and 50 μL of enzyme extract (pH 7.8). H2O2 diminishment was measured at 240 nm every 30 s for 2 min using a spectrophotometer (U-1800, Hitachi, Japan). The sum of each catalase reaction was calculated using the following equation:
( U ) C A T   a c t i v i t y = A × T V × D Ԑ × E V
( U m L ) C A T   v o l u m e t r i c   a c t i v i t y = C A T   a c t i v i t y U n i t e   v o l u m e
( U m g   P r o t e i n ) S p e c i f i c   C A T   a c t i v i t y = C A T   v o l u m e t r i c   a c t i v i t y ( U m L ) E x t r a c t   p r o t e i n   c o n c e n t r a t i o n ( m g m L )
U = A unit of catalase activity is equal to the amount of enzyme that catalyzes the H2O2 to O2 and H2O in one min.
A = Differences in absorbance in 240 nm in one min
TV = Total bulk of buffer and extract (3 mL)
EV = Extract bulk (0.05 mL)
Ԑ = Extinction coefficient for catalase (39.4 mM−1cm−1)
D = Dilution factor
Ascorbate peroxide activity was measured in a total volume of 3 mL of 50 mM sodium-phosphate buffer (pH 7.0) containing 4.51 μL of H2O2 (30%), 100 μL of 5 mM ascorbate, and 50 μL of enzyme extract (pH 7.8). Ascorbate peroxide activity was measured at 290 nm every 30 s for 2 min using a spectrophotometer (U-1800, Hitachi, Japan). The sum of particular ascorbate peroxide activity was calculated utilizing the same equation utilized for particular catalase activity, whereas Ԑ = 2.8 mM−1 cm−1.

2.6. Stress Susceptibility Index

The Fischer and Maurer method [40] was used to calculate the stress susceptibility index (SSI) using the following equation:
S S I = ( 1 Y s i Y n i ) / S I
The stress intensity (SI) is a number that varies from zero to one, and it is calculated using the following equation.
S I = 1 ( Y S Y N )
Drought tolerance is indicated by a decreased index of stress susceptibility. Ysi denotes genotype performance (yield) in stressful environments, Yni signifies genotype grown in non-stressful situations, YS represents the average of genotypes grown in stressful conditions, and YN denotes the mean of genotypes produced in non-stressful settings in the above equations.

2.7. Statistical Analysis

The least significant difference (LSD, p < 0.05) in SAS (ver. 9.4) software was used to compare the means of the physiological, morphological, and biochemical variables. SAS was also used to perform principal component analysis (PCA) and cluster analysis, while Stat Graphics was used to compose graphical representations of the data.

3. Results and Discussion

In our initial investigation, the effect of the different growing seasons (2017–2018) was evaluated. No significant differences were found in any of the traits except for total soluble carbohydrate contents and the ratio of Chl-a and Chl-b concentrations. Therefore, the data for the two years were combined with the different irrigation regimes (I × Y), and no differences were observed (Table 1). However, when the interaction effects between irrigation regime × genotype were evaluated, significant results were observed for all the measured traits except for the ratio of Chl-a and Chl-b concentrations (Table 1).

3.1. Relative Water Content (RWC)

The relative water content was found to reduce as the water stress level increased, and the observed reduction in RWC was specific for both the drought level and plant genotype. The RWC ranged from 70% in Pakistan to 75% in Arak under I1 (Table 2). The highest RWC was observed in Shahrekord (72%) under I2 and in Semirom (68%) under I3. The lowest RWC was recorded in the Pakistan genotype: both I2 (62%) and I3 (54%) (Table 2). These results are in agreement with those previously recorded by Zali and Ehsanzadeh [17] and Askari and Ehsanzadeh in fennel [26,27], and Maghsoodi and colleagues in alfalfa [41], who reported that a water deficit led to a decrease in RWC and the extent of the decrease was genotype-specific.
Under water stress, the plant water content plays a significant function in modulating or activating the antioxidant defense mechanism [13,14]. The RWC refers to water uptake by the roots and water loss by transpiration. It is used as a reliable indicator of water content compared to the maximum water content in plants and is indicative of the plant hydration level [42].

3.2. Chlorophyll-a, Chlorophyll-b, and Carotenoid Content

An interaction between the genotype and irrigation regime on the Chl-a, Chl-a+b, and Cars concentrations was observed at the 1% probability level (Table 2 and Table 3).
Drought stress caused a decrease in Chl-a, Chl-b, and Chl-a+b but increased the Chl-a/b ratio and Cars concentrations (Table 2). Under the I2 and I3 irrigation regimes, Chl-a decreased by 14 and 23%, Chl-b decreased by 17 and 33%, Chl-a+b declined by 16 and 28%, while Chl-a/b increased by 11 and 37%, respectively (Table 4).
The highest decrease in the Chl-a concentration (−32%) was found in the Mashhad genotype under the I3, while the lowest (−5%) was obtained under I2 in Semirom (Table 3). Our results highlighted that the Chl-a and Chl-b concentrations decreased following drought stress, as previously reported [24]. Furthermore, an increase in the Chl-a/b ratio was recorded, probably due to the degradation of Chl-b into Chl-a during drought, as observed by several authors [26,27,43].
Drought stress may also cause an increase in Chl breakdown and inhibition of the production of photosynthetic pigments, thereby decreasing leaf Chl concentrations [44]. Furthermore, the loss or decline in Chl concentration may be due to the loss of chloroplast membranes, lamellae dispersion, or excessive edema [45]. A decrease in the Chl content during drought stress is a common marker of oxidative stress, which could be caused by pigment photo-oxidation and chlorophyll degradation. Chlorophyll and other photosynthetic pigments are essential for the light-harvesting process and lowering power output [46]. Higher Chl content and stability have been reported to be associated with drought tolerance [45].
With regard to carotenoids, a significant and growing increase was observed in all the experimental groups (I2 and I3) subjected to water stress compared to the control (I1). In particular, the plants subjected to water stress I2 showed a fairly uniform increase (13–16%). Greater water stress resulted in more heterogeneous responses. Indeed, Shahreza, Shahrekord, and Mashhad showed an increase of 22, 20, and 18%, respectively, and India only 5%. The other plants maintained an increase in the carotenoid content of between 11 and 13%. Moreover, the genotype ‘Pakistan’ was shown to produce the smallest Cars concentrations, and Mashhad had the greatest under I1 (Table 2). In sesame and in alfalfa under drought stress, the Cars concentrations increased in some genotypes and decreased in others [29,41]. Other authors reported similar increases in Cars content during drought stress in Zea mays and in Calendula officinalis [47,48]. In conditions of abiotic stress, such as drought, plants implement protective defenses, such as increasing the content of carotenoids [49]. Carotenoids improve the plant’s response to oxidative stress. In addition, the decrease in chlorophyll makes the carotenoid content percentage higher [49]. Our data indicate that the Shahreza genotype was drought-tolerant due to the highest increases in Cars content.
When plants are stressed by drought, Cars play an important role in signaling, neutralizing oxidative stress, and induction of abscisic acid production (an essential carotenoid-derived plant hormone that causes stomatal closure, thereby limiting transpiration) [50]. Under I2 and I3, Cars concentrations were shown to increase compared to the control (I1) (Table 4).

3.3. Leaf Proline and Total Soluble Carbohydrates (TSC)

The highest proline content was detected in the Shahrekord genotype under I1, I2, and I3, while the lowest was noted in the Afghanistan genotype under I1, I2, and I3 (Table 5).
The highest increase in proline content was observed in the Syria genotype (+74%) under I2 and in Arak (+95%) under the I3, while the lowest was obtained under I2 (+8%) and I3 (+22%) in Semirom (Table 5). Under drought stress, the proline content was previously reported to increase in canola [51] and remained unchanged in the early stages of development, but it increased upon flowering in soybean [52]. Changes in proline content may be influenced by irrigation regimes, plant growth stages, environmental variables, and plant genotypes. A well-known eco-physiological process that allows plants to maintain a lower osmotic potential and withstand drought is the accumulation of solutes, such as proline and sugars, in the cytoplasm [53]. Kaur and Asthir showed that proline accumulated under water stress decreased the degradation and hydrolysis of protein [54]. Under drought stress, proline production and accumulation are known to be due to variations in the enzyme activities involved in proline biosynthesis, degradation, and oxidation inhibition [54].
The highest TSC content was recorded in Shahrekord, under all three irrigation regimes, and the lowest was noted in Pakistan and Syria under I1 and I2, and in Pakistan under I3 (Table 5). TSC increased from +14% in Mashhad and Isfahan to +31% in Semirom and India under I2 and from +25% in Pakistan to +75% in Shehrekord under I3 (Table 5).
The greatest TSC was noted in Shehrekord under I1, while the lowest was obtained under I3 in the Pakistan and Syria genotypes (Table 5). Others have also reported increases in the TSC levels in plants under water stress [17,23,26,27,54]. Askari and colleagues reported that drought-tolerant genotypes (‘Yazd’ and ‘Kerman’) produced higher total leaf soluble carbohydrates [26,27].
Soluble sugars are carbon and energy sources in cells, and some also play a role as signaling molecules in stress tolerance in plants via osmotic adjustment [55]. They may also feed the oxidative pentose pathway, which can result in ROS scavenging. As a result, variations in sugar concentration in conjunction with changes in the environment often impact ROS production, making sugars one of the most critical ‘players’ in the redox balance in plants [56]. In addition, plants can regulate their osmotic potential to increase the accumulation of soluble sugars, which improves the plant’s water holding capacity and reduces water stress [57]. Our TSC results indicate that Shahrekord, under all irrigation regimes, is the preferred genotype for drought tolerance.

3.4. Antioxidant Enzyme Activities

Under drought, catalase (CAT) and ascorbate peroxidase (APX) activities increased, although the increase was drought level- and genotype-specific (Table 6). In the current study, the CAT activity was the highest in Arak under I1 and in Semirom under the I2 and I3 irrigation regimes, while it was the lowest in Afghanistan and Syria under I1 and in Isfahan and Syria under the I2 and I3 regimes, respectively (Table 6). Additionally, the highest increases in CAT activities were noted in Semirom (+60%) under I2 and in Shehrekor (+81%) under I3 treatments. However, the lowest increases in CAT activities in India were marked under I2 (+9%) and I3 (+16%), respectively (Table 6).
Catalase scavenges the oxidant H2O2 by decomposition to oxygen and water [56]. Catalase activity was shown to increase in Arabidopsis drought-tolerant genotypes when exposed to water stress, suggesting that this could be an adaptive response to ROS [58]. In our study, APX activity also increased, and the most significant increase was obtained for Shahrekord under I2 (+38%) and Semirom under I3 (+79%). In contrast, the Syria genotype displayed the lowest increase under I2 (+14%) and I3 (+25%), respectively (Table 6). In plant cells, APX, a key enzyme in the ascorbate-glutathione cycle, plays a crucial part in the detoxification system [59]. In line with our results, Shigeoka et al. showed that APX activity was increased under drought stress, alongside other enzymes [60]. However, in contrast to our findings, Zali and Ehsanzadeh found that drought stress reduced peroxidase and ascorbate peroxidase activities in fennel by 16 and 20%, respectively [17]. Several previous studies have found that, under drought stress, the antioxidant enzyme activity increased in drought-tolerant genotypes, which is consistent with our findings [23,26,27,29].

3.5. Malondialdehyde and Hydrogen Peroxide (H2O2) Analysis

The highest increase in malondialdehyde (MDA) was recorded in Mashhad (+32%) and Syria (+32%) under I2 and Syria (+58%) under I3, while the lowest increase was noted in Shahreza (+14%) and Shahrekord (+16%) under I2, and Isfahan (+31%) under I3 (Table 7).
The range of MDA content was from 17.72 (nmol.g) in Shahrekord to 28.86 (nmol g) in Afghanistan under I1. Lower MDA content within genotypes suggests the greater antioxidative activities alongside resistances to arid conditions [61]. In this regard, Ghadyeh-Zarrinabadi and colleagues showed that, under drought, the MDA content in pot marigold increased in drought-sensitive genotypes [23].
Under stress conditions, unsaturated fatty acids in cell membranes are impacted by free radicals, resulting in a chain reaction of lipid peroxidation. The quantity of malondialdehyde is commonly referred to as a lipid peroxidation marker [62]. H2O2 is a relatively long-lived molecule, making it easier to quantify in tissue samples. H2O2 can oxidize thiol groups in enzymes, such as those involved in the Calvin cycle, copper/zinc superoxide dismutase, and iron superoxide dismutase [63]. Different antioxidative enzymes in plant cells may have a role in regulating the H2O2 levels within the cell. The MDA and H2O2 levels increased dramatically when there was a water constraint, but the rise varied depending on the genotype and irrigation regime. Moreover, Wang and colleagues reported an increase in the MDA content under water stress in maize [64], and Maghsoodi and collaborators in alfalfa [41].
In our study, the H2O2 content was observed to increase from +8% in Semirom to +54% in Syria under I2, and +25% in Semirom to +95% in Syria under I3 as compared with I1. Under all the irrigation regimes, Mashhad also had the highest H2O2 content, whereas Semirom produced the lowest H2O2 content (Table 8). The results indicate that Semiron, based on the lowest H2O2, and Isfahan, based on the lowest MDA, were the more drought-tolerant genotypes.

3.6. Plant Height

The results show a significant interactive effect (at 1% probability levels) of genotype and irrigation regime on plant height in black cumin (Table 8). Plant height was shown to decline with an increasing moisture deficit in all the genotypes, but this decrease is dependent on the genotype and irrigation regime. Drought also causes a reduction in the leaf size, stem extension, stomatal conductance, and photosynthetic rate [3,15].
Other authors found, in marigold and fennel, that the extent of the reduction in plant height depended on the genotype and irrigation regimen, which is consistent with our findings [23,26,27]. In contrast, Baghalian and colleagues in Plantago [28] and Seyed and collaborators in black cumin [32] found that drought stress had no effect on plant height, which could be due to differing water regimes and experimental settings. In the current study, a decrease in the plant height was recorded ranging from −6% in the Afghanistan genotype to −42% in the Isfahan genotype under I2, and from −15% in Afghanistan to −48% in Mashhad under I3 (Table 9). However, the plant height ranged from 33 cm in India to 63 cm in Shahreza under I1 (Table 9). Other workers have documented a similar decrease in the plant height of black cumin, fennel, and cumin in response to water stress [24,26,27].

3.7. Capsules and Seeds per Plant

In general, water stress also negatively affects the number of capsules formed and the number of seeds produced in black cumin (Table 10). The genotypes most sensitive to water stress are Pakistan, Syria, India, and Mashhad, which already, at the I2 water regime, reduce the number of capsules by 52, 44, 51, and 44%, respectively. In these genotypes, the capsule production is reduced by approximately 60% at the I3 level of water stress. The Semirom and Shahrekord genotypes are the most resistant to the two water stress regimes, maintaining reductions below 20%.
As expected, the number of seeds showed a notable reduction in the genus India (−40%), Arak (−38%), and Mashhad (−38%) already in the I2 regime. Furthermore, Arak and Mashhad, when subjected to the I3 regimen, confirmed their sensitivity to water stress as they lost more than 50% of the number of seeds. There is no loss of more than 27% of the number of seeds in the Semirom and Shahrekord genotypes, thus confirming their resistance to water stress. All these data confirm the close relationship between water stress and seed production. Plants that are more resistant to drought do not greatly reduce the number of capsules and seeds because they have already developed systems of tolerance to arid environments [65]. On the contrary, the less resistant genotypes have to implement survival strategies of the new individuals (seeds). Indeed, the production of capsules and seeds requires an enormous energy effort for the plant. The reduction of water triggers the responses of the mother plant with the aim of preserving the future progeny. The lesser quantity of water means less availability of resources and less chance of survival. Therefore, reducing the number of seeds (and/or capsules) will increase the availability and the chances of survival [65].

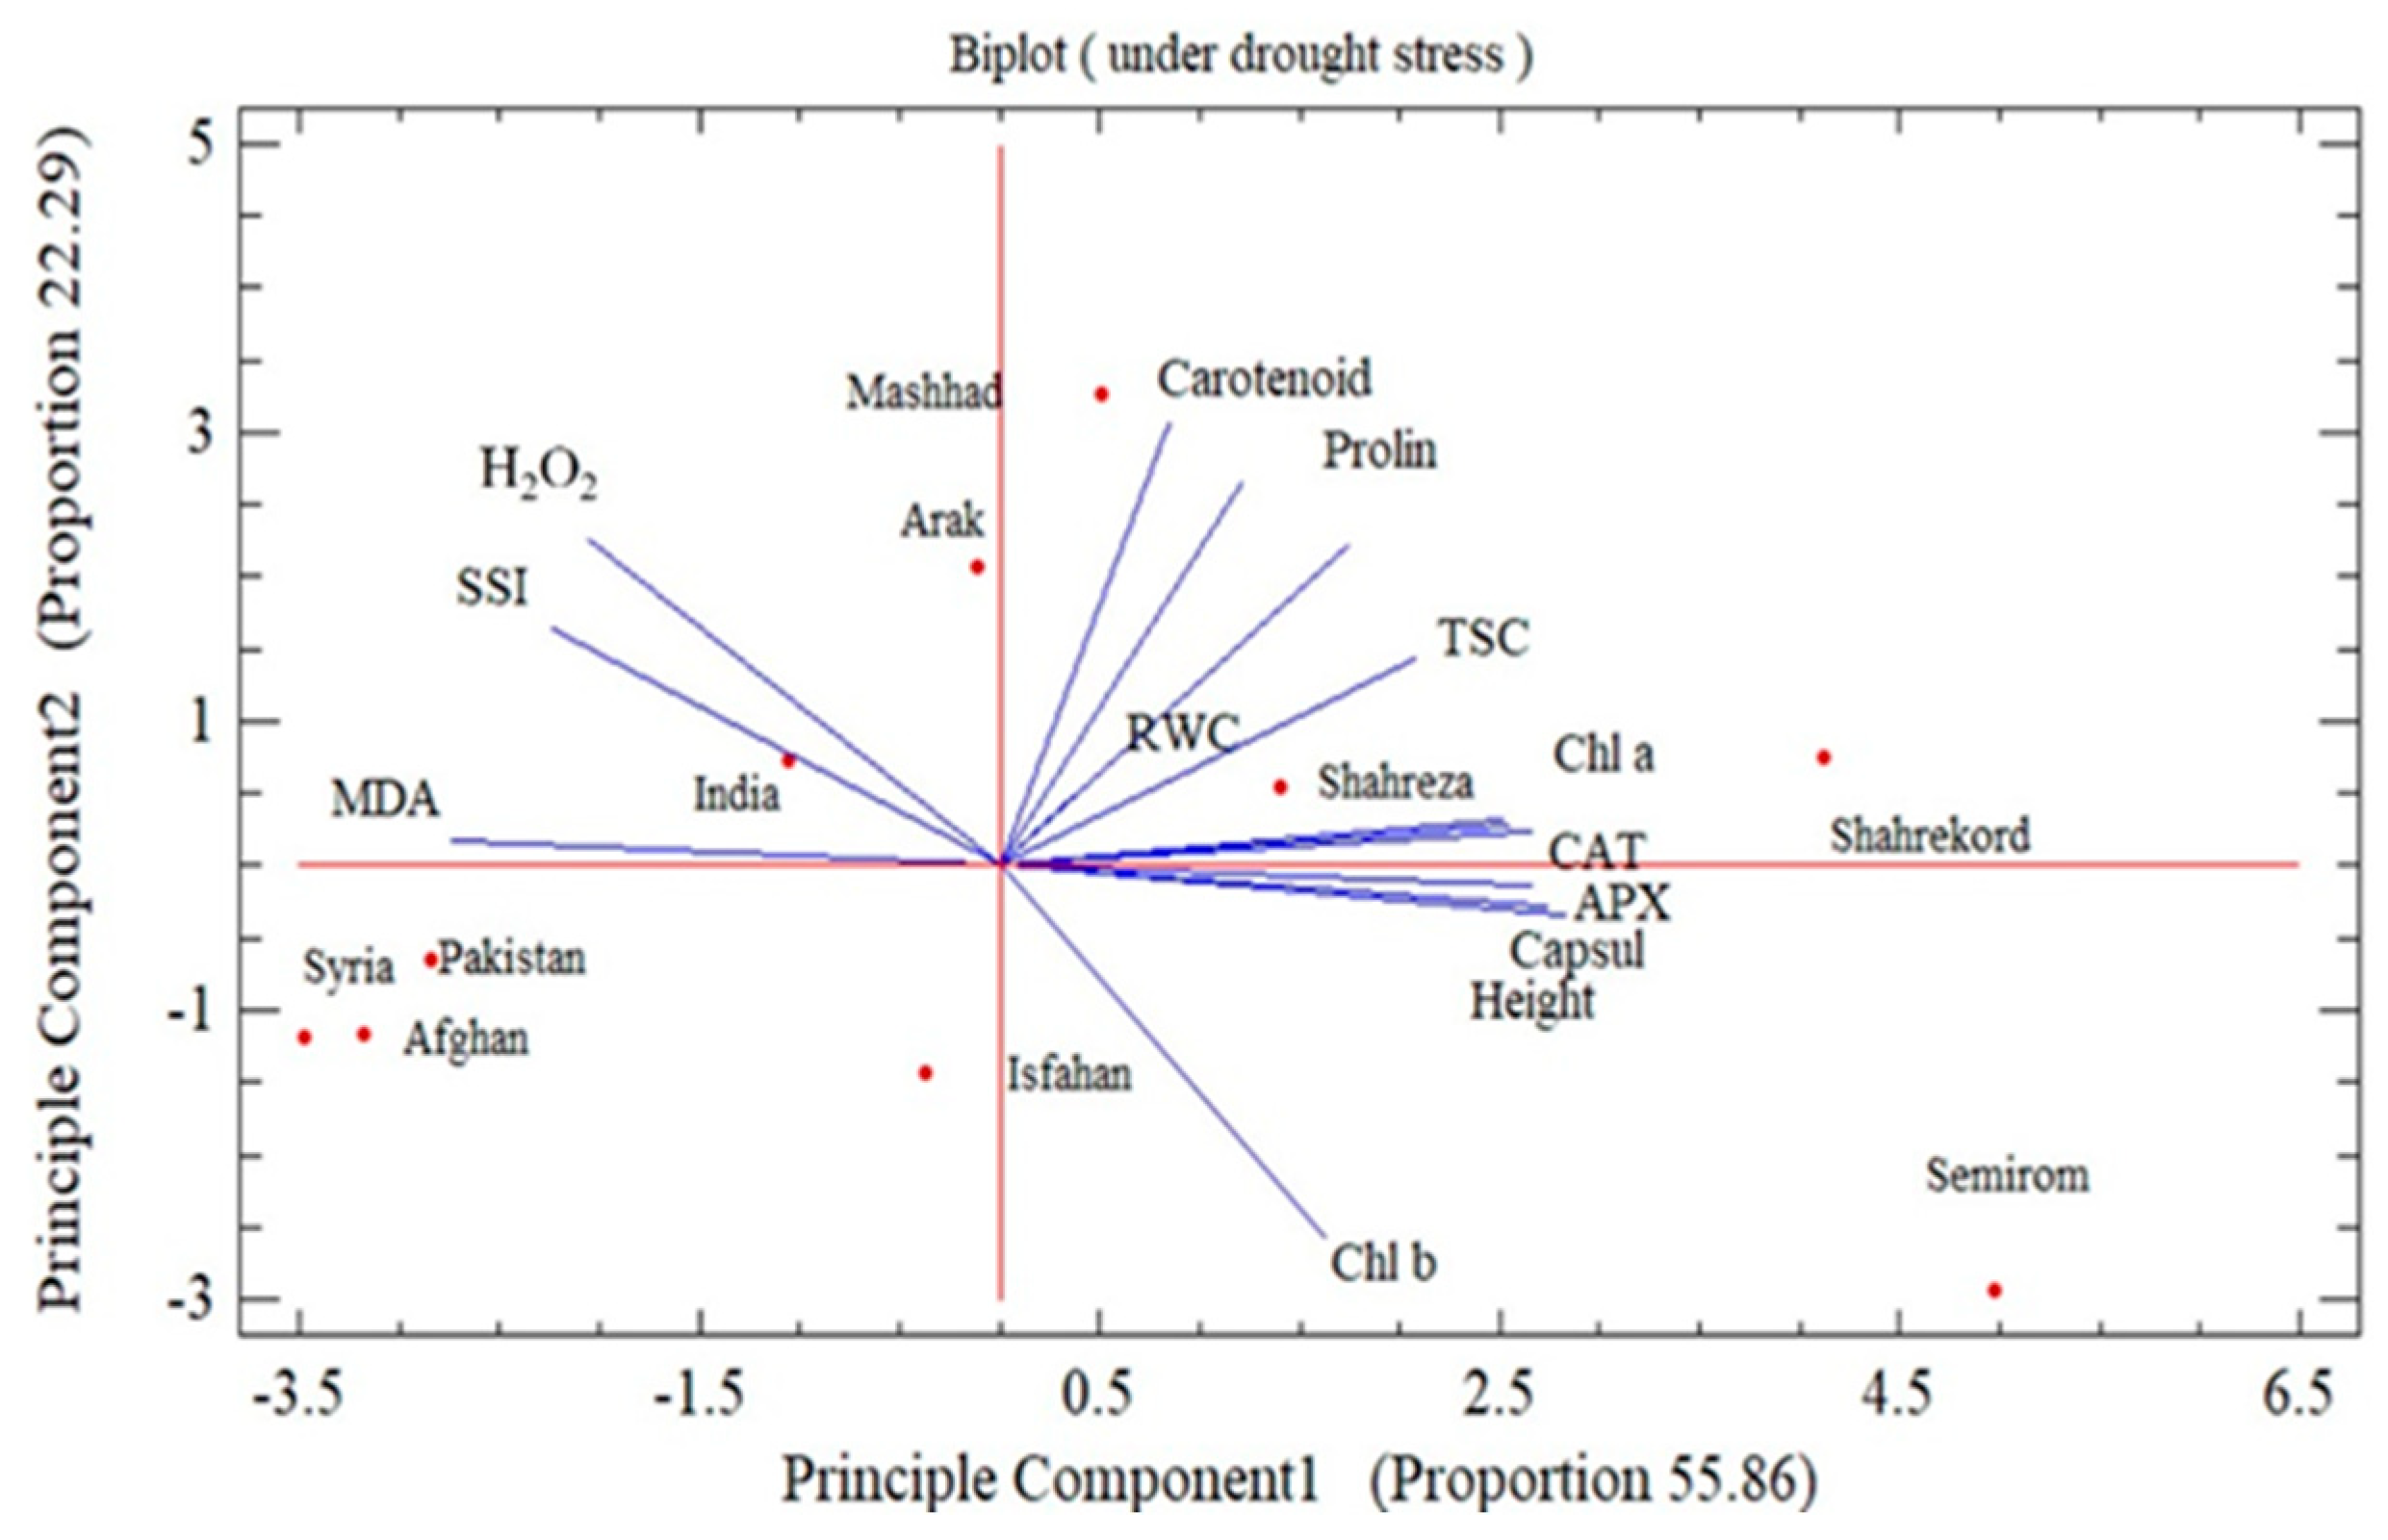
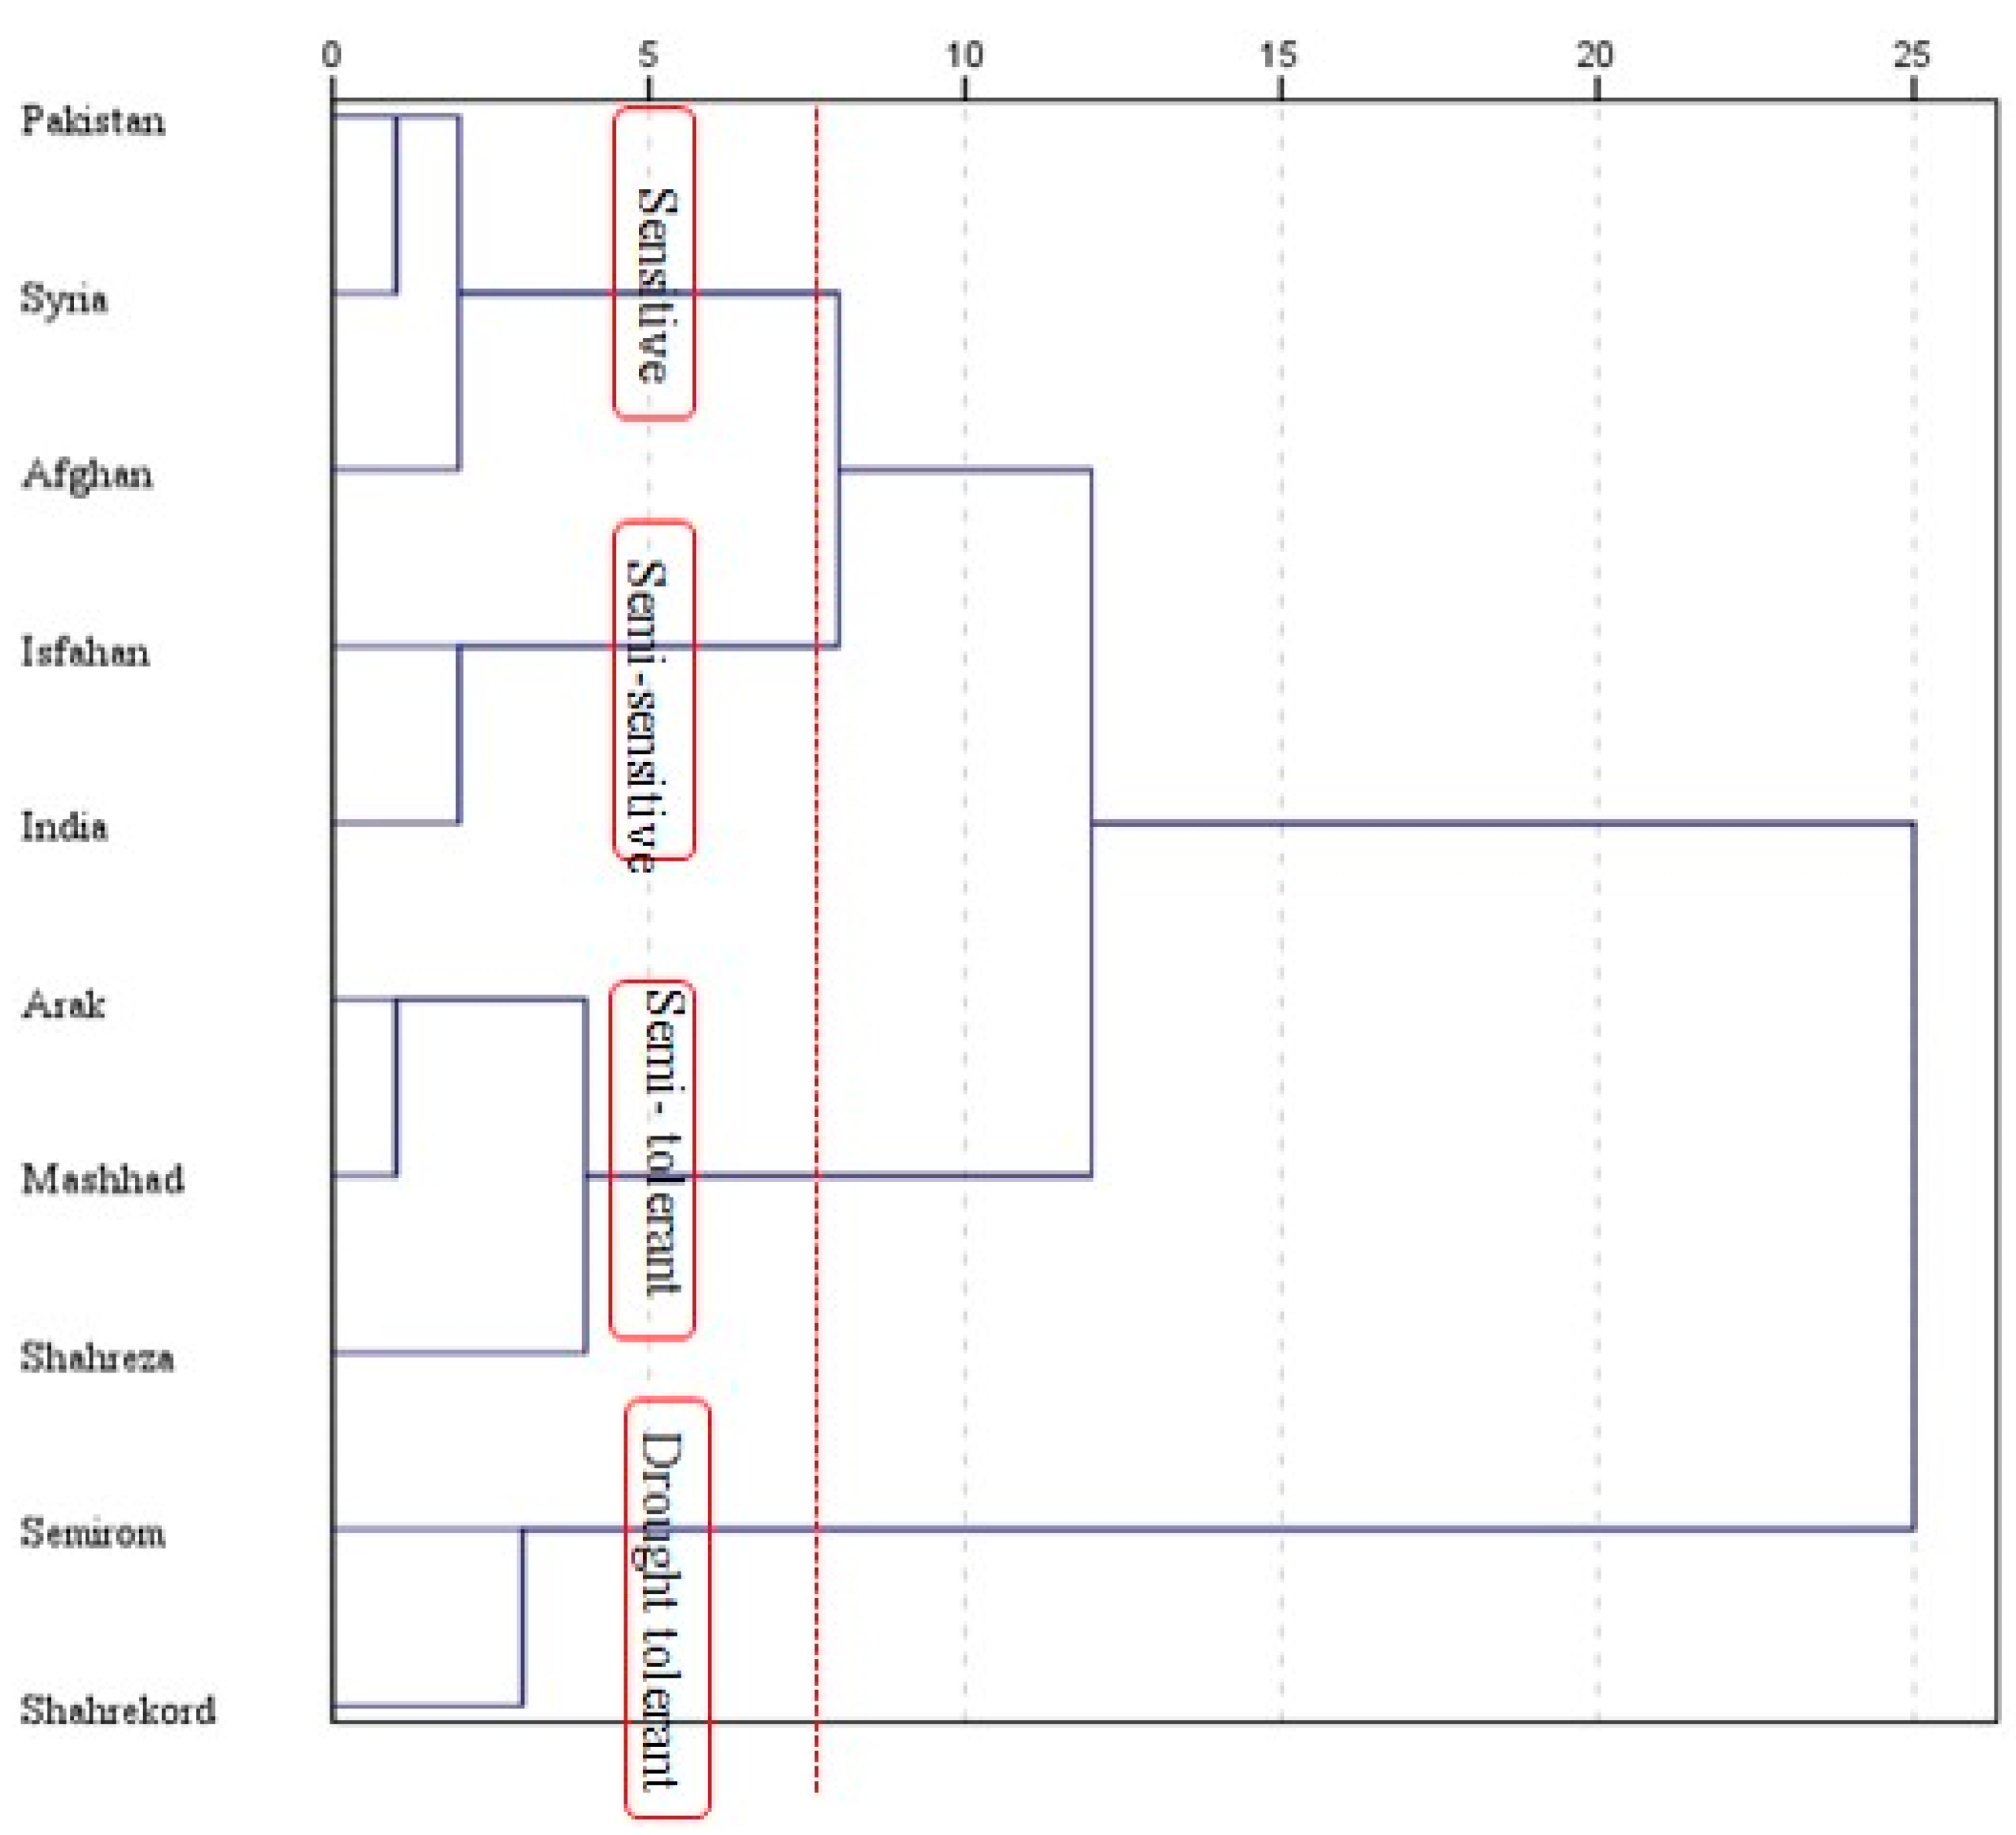
3.8. Stress Susceptibility Index and Principal Component Analysis

In the current study, our data indicate a significant relationship between the activity of antioxidant enzymes and the stress susceptibility index (SSI), which demonstrates the role of these enzymes in drought-tolerance in black cumin genotypes (Table 11). Furthermore, our findings suggest that Shahrekord under I2 and Semirom under I3 are the preferred genotypes for drought tolerance. The drought-tolerant genotypes were shown to exhibit a greater antioxidant enzyme activity. These data suggest that more drought-tolerant genotypes protect their cells more efficiently against damage by free radicals with a reduced yield loss, whilst drought-sensitive genotypes (i.e., Mashhad and Pakistan) are characterized by lower antioxidant enzyme activity and a higher MDA content.
A principal component analysis (PCA) was performed for the different traits studied (Figure 1). The cosine of the angles between the vectors indicates how closely the variables are related. Positive correlations are represented by acute angles (90°), while negative correlations are characterized by wide, obtuse angles (>90°). The length of the vectors linking the traits to the origin reveals the level of variability and contribution of each trait in the PCA. The intensity of the correlation increases for angles approaching 0° and 180°. The two components justified more than 87% of the variation under severe stress (I3). Under severe stress, a significant and positive correlation between APX, CAT, Chl-a, and Chl-b with leaf proline content and soluble carbohydrates was observed. In particular, a positive and significant correlation between the Chl contents and the activity of antioxidant enzymes was observed (Figure 1). Based upon the least reduction and highest retainment of Chl content under drought, it appears that, of those tested, Semirom was the most drought-tolerant genotype, possibly due to its higher RWC under drought conditions (see Table 4). Moreover, the PCA results indicate a positive correlation between proline content and antioxidant enzyme activity, as well as a negative relationship with MDA (Figure 1). Indeed, based on the highest proline content under all the irrigation regimes, Shahrekord was shown to be the most drought-tolerant genotype. Moreover, there was a positive and significant correlation between leaf proline content and soluble carbohydrates with RWC. It seems that these osmolytes, as proline and carbohydrates, may induce a reduction in the water stress in both the Shahrekord and Semirom genotypes. All the aforementioned traits were shown to exhibit a significant negative correlation with H2O2, MDA, and SSI. A significant and negative correlation was shown between stress susceptibility index (SSI) and the activity of antioxidant enzymes, TSC, and proline content. These data also indicate that there is a highly significant negative relationship between H2O2 and MDA with the activity of antioxidant enzymes; but a significant and positive correlation was observed between H2O2 and MDA with SSI. Therefore, the H2O2 and MDA contents may be used as phenotypic markers for the future selection and breeding of drought-tolerant black cumin genotypes.

4. Conclusions

This study revealed that the level of irrigation markedly influenced the physiological, biochemical, and morphological features of the black cumin genotypes studied, although the impact/affect upon these parameters varied according to the genotype, irrigation regime, and the trait in question. Water stress was clearly shown to increase the activities of CAT and APX and the carotenoid content, proline, soluble sugars, MDA, and H2O2 but reduced the RWC and chlorophyll content. Based upon the proline, TSC, RWC, H2O2, MDA, and SSI, the black cumin genotypes were classified into drought-tolerant (‘Shahrekord’ and ‘Semirom’), semi-tolerant (‘Arak’, ‘Mashhad’, and ‘Shahreza’), semi-sensitive (‘India’ and ‘Isfahan’), and drought-sensitive (‘Pakistan’, ‘Syria’, and ‘Afghanistan’) groups under I3 (Figure 2). According to the data presented, Mashhad under I1 and Arak under I2, and Semirom under I3 could be recommended for maximum yield production. Based on the stress susceptibility index, the genotypes Shahrekord under I2 and Semiron under I3 were shown to be the most drought-tolerant.

Author Contributions

Conceptualization, P.B., M.P. and H.K.; methodology, P.B. and H.K.; formal analysis, J.R. and T.C.B.; writing—original draft preparation, T.C.B., H.K., G.A. and M.P.; writing—review and editing, A.M. and G.A.; project administration, A.M.; funding acquisition, A.M. All authors have read and agreed to the published version of the manuscript.

Funding

This research received no external funding.

Institutional Review Board Statement

Not applicable.

Informed Consent Statement

Not applicable.

Data Availability Statement

The data presented in this study are available on request from the corresponding author.

Conflicts of Interest

The authors declare no conflict of interest.

References

  1. Mirjahanmardi, H.; Ehsanzadeh, P. Iron supplement ameliorates drought-induced alterations in physiological attributes of fennel (Foeniculum vulgare). Nutr. Cycl. Agroecosyst. 2016, 106, 61–76. [Google Scholar] [CrossRef]
  2. Aghajanlou, F.; Mirdavoudi, H.; Shojaee, M.; Mac Sweeney, E.; Mastinu, A.; Moradi, P. Rangeland Management and Ecological Adaptation Analysis Model for Astragalus curvirostris Boiss. Horticulturae 2021, 7, 67. [Google Scholar] [CrossRef]
  3. Biareh, V.; Shekari, F.; Sayfzadeh, S.; Zakerin, H.; Hadidi, E.; Beltrao, J.G.T.; Mastinu, A. Physiological and Qualitative Response of Cucurbita pepo L. to Salicylic Acid under Controlled Water Stress Conditions. Horticulturae 2022, 8, 79. [Google Scholar] [CrossRef]
  4. Mahdavi, A.; Moradi, P.; Mastinu, A. Variation in Terpene Profiles of Thymus vulgaris in Water Deficit Stress Response. Molecules 2020, 25, 1091. [Google Scholar] [CrossRef] [Green Version]
  5. Naservafaei, S.; Sohrabi, Y.; Moradi, P.; Mac Sweeney, E.; Mastinu, A. Biological Response of Lallemantia iberica to Brassinolide Treatment under Different Watering Conditions. Plants 2021, 10, 496. [Google Scholar] [CrossRef] [PubMed]
  6. Noryan, M.; Hervan, I.M.; Sabouri, H.; Kojouri, F.D.; Mastinu, A. Drought Resistance Loci in Recombinant Lines of Iranian Oryza sativa L. in Germination Stage. BioTech 2021, 10, 26. [Google Scholar] [CrossRef]
  7. Gharibvandi, A.; Karimmojeni, H.; Ehsanzadeh, P.; Maleki, M.R.; Mastinu, A. Weed management by allelopathic activity of Foeniculum vulgare essential oil. Plant Biosyst. Int. J. Deal. All Asp. Plant Biol. 2022, 1–15. [Google Scholar] [CrossRef]
  8. Karimmojeni, H.; Rahimian, H.; Alizadeh, H.; Yousefi, A.R.; Gonzalez-Andujar, J.L.; Mac Sweeney, E.; Mastinu, A. Competitive Ability Effects of Datura stramonium L. and Xanthium strumarium L. on the Development of Maize (Zea mays) Seeds. Plants 2021, 10, 1922. [Google Scholar] [CrossRef]
  9. Abate, G.; Zhang, L.L.; Pucci, M.; Morbini, G.; Mac Sweeney, E.; Maccarinelli, G.; Ribaudo, G.; Gianoncelli, A.; Uberti, D.; Memo, M.; et al. Phytochemical Analysis and Anti-Inflammatory Activity of Different Ethanolic Phyto-Extracts of Artemisia annua L. Biomolecules 2021, 11, 975. [Google Scholar] [CrossRef]
  10. Rad, S.V.; Valadabadi, S.A.R.; Pouryousef, M.; Saifzadeh, S.; Zakrin, H.R.; Mastinu, A. Quantitative and Qualitative Evaluation of Sorghum bicolor L. under Intercropping with Legumes and Different Weed Control Methods. Horticulturae 2020, 6, 78. [Google Scholar] [CrossRef]
  11. Sabouri, H.; Kazerani, B.; Fallahi, H.A.; Dehghan, M.A.; Alegh, S.M.; Dadras, A.R.; Katouzi, M.; Mastinu, A. Association analysis of yellow rust, fusarium head blight, tan spot, powdery mildew, and brown rust horizontal resistance genes in wheat. Physiol. Mol. Plant Pathol. 2022, 118, 101808. [Google Scholar] [CrossRef]
  12. Moradi, P.; Aghajanloo, F.; Moosavi, A.; Monfared, H.H.; Khalafi, J.; Taghiloo, M.; Khoshzaman, T.; Shojaee, M.; Mastinu, A. Anthropic Effects on the Biodiversity of the Habitats of Ferula gummosa. Sustainability 2021, 13, 7874. [Google Scholar] [CrossRef]
  13. Kumar, A.; Memo, M.; Mastinu, A. Plant behaviour: An evolutionary response to the environment? Plant Biol. 2020, 22, 961–970. [Google Scholar] [CrossRef] [PubMed]
  14. Kumar, A.; Premoli, M.; Aria, F.; Bonini, S.A.; Maccarinelli, G.; Gianoncelli, A.; Memo, M.; Mastinu, A. Cannabimimetic plants: Are they new cannabinoidergic modulators? Planta 2019, 249, 1681–1694. [Google Scholar] [CrossRef] [PubMed]
  15. Yousefi, A.R.; Rashidi, S.; Moradi, P.; Mastinu, A. Germination and Seedling Growth Responses of Zygophyllum fabago, Salsola kali L. and Atriplex canescens to PEG-Induced Drought Stress. Environments 2020, 7, 107. [Google Scholar] [CrossRef]
  16. Pucci, M.; Aria, F.; Premoli, M.; Maccarinelli, G.; Mastinu, A.; Bonini, S.; Memo, M.; Uberti, D.; Abate, G. Methylglyoxal affects cognitive behaviour and modulates RAGE and Presenilin-1 expression in hippocampus of aged mice. Food Chem. Toxicol. Int. J. Publ. Br. Ind. Biol. Res. Assoc. 2021, 158, 112608. [Google Scholar] [CrossRef] [PubMed]
  17. Zali, A.G.; Ehsanzadeh, P. Exogenous proline improves osmoregulation, physiological functions, essential oil, and seed yield of fennel. Ind. Crop Prod. 2018, 111, 133–140. [Google Scholar] [CrossRef]
  18. Gupta, A.K.; Dhua, S.; Sahu, P.P.; Abate, G.; Mishra, P.; Mastinu, A. Variation in Phytochemical, Antioxidant and Volatile Composition of Pomelo Fruit (Citrus grandis (L.) Osbeck) during Seasonal Growth and Development. Plants 2021, 10, 1941. [Google Scholar] [CrossRef]
  19. Gupta, A.K.; Rather, M.A.; Jha, A.K.; Shashank, A.; Singhal, S.; Sharma, M.; Pathak, U.; Sharma, D.; Mastinu, A. Artocarpus lakoocha Roxb. and Artocarpus heterophyllus Lam. Flowers: New Sources of Bioactive Compounds. Plants 2020, 9, 1329. [Google Scholar] [CrossRef]
  20. Mastinu, A.; Bonini, S.A.; Premoli, M.; Maccarinelli, G.; Mac Sweeney, E.; Zhang, L.L.; Lucini, L.; Memo, M. Protective Effects of Gynostemma pentaphyllum (var. Ginpent) against Lipopolysaccharide-Induced Inflammation and Motor Alteration in Mice. Molecules 2021, 26, 570. [Google Scholar] [CrossRef]
  21. Zangani, E.; Afsahi, K.; Shekari, F.; Mac Sweeney, E.; Mastinu, A. Nitrogen and Phosphorus Addition to Soil Improves Seed Yield, Foliar Stomatal Conductance, and the Photosynthetic Response of Rapeseed (Brassica napus L.). Agriculture 2021, 11, 483. [Google Scholar] [CrossRef]
  22. Laribi, B.; Bettaieb, I.; Kouki, K.; Sahli, A.; Mougou, A.; Marzouk, B. Water deficit effects on caraway (Carum carvi L.) growth, essential oil and fatty acid composition. Ind. Crop Prod. 2009, 30, 372–379. [Google Scholar] [CrossRef]
  23. Zarrinabadi, I.G.; Razmjoo, J.; Mashhadi, A.A.; Mojeni, H.K.; Boroomand, A. Physiological response and productivity of pot marigold (Calendula officinalis) genotypes under water deficit. Ind. Crop Prod. 2019, 139. [Google Scholar] [CrossRef]
  24. Alinian, S.; Razmjoo, J.; Zeinali, H. Flavonoids, anthocynins, phenolics and essential oil produced in cumin (Cuminum cyminum L.) accessions under different irrigation regimes. Ind. Crop Prod. 2016, 81, 49–55. [Google Scholar] [CrossRef]
  25. Moinuddin, G.; Devi, K.; Khajuria, D.K. Evaluation of the anti-depressant activity of Myristica fragrans (Nutmeg) in male rats. Avicenna J. Phytomed. 2012, 2, 72–78. [Google Scholar]
  26. Askari, E.; Ehsanzadeh, P. Drought stress mitigation by foliar application of salicylic acid and their interactive effects on physiological characteristics of fennel (Foeniculum vulgare Mill.) genotypes. Acta Physiol. Plant. 2015, 37, 1–14. [Google Scholar] [CrossRef]
  27. Askari, E.; Ehsanzadeh, P. Osmoregulation-mediated differential responses of field-grown fennel genotypes to drought. Ind. Crop Prod. 2015, 76, 494–508. [Google Scholar] [CrossRef]
  28. Baghalian, K.; Abdoshah, S.; Khalighi-Sigaroodi, F.; Paknejad, F. Physiological and phytochemical response to drought stress of German chamomile (Matricaria recutita L.). Plant Physiol. Biochem. 2011, 49, 201–207. [Google Scholar] [CrossRef]
  29. Bahreininejad, B.; Razmjoo, J.; Mirza, M. Effect of Water Stress on Productivity and Essential Oil Content and Composition ofThymus carmanicus. J. Essent. Oil Bear. Plants 2014, 17, 717–725. [Google Scholar] [CrossRef]
  30. Jacob, B.; Narendhirakannan, R.T. Role of medicinal plants in the management of diabetes mellitus: A review. 3 Biotech 2019, 9, 4. [Google Scholar] [CrossRef]
  31. Darakhshan, S.; Pour, A.B.; Colagar, A.H.; Sisakhtnezhad, S. Thymoquinone and its therapeutic potentials. Pharm. Res. 2015, 95–96, 138–158. [Google Scholar] [CrossRef] [PubMed]
  32. Mohammad Reza Haj Seyed, H. Effects of irrigation treatment and Azospirillum inoculation on yield and yield component of black cumin (Nigella sativa L.). J. Med. Plants Res. 2012, 6, 4553–4561. [Google Scholar] [CrossRef]
  33. Ghoulam, C.; Foursy, A.; Fares, K. Effects of salt stress on growth, inorganic ions and proline accumulation in relation to osmotic adjustment in five sugar beet cultivars. Environ. Exp. Bot. 2002, 47, 39–50. [Google Scholar] [CrossRef]
  34. Heath, R.L.; Packer, L. Photoperoxidation in isolated chloroplasts. Arch. Biochem. Biophys. 1968, 125, 189–198. [Google Scholar] [CrossRef]
  35. Bates, L.S.; Waldren, R.P.; Teare, I.D. Rapid Determination of Free Proline for Water-Stress Studies. Plant Soil 1973, 39, 205–207. [Google Scholar] [CrossRef]
  36. DuBois, M.; Gilles, K.A.; Hamilton, J.K.; Rebers, P.A.; Smith, F. Colorimetric Method for Determination of Sugars and Related Substances. Anal. Chem. 2002, 28, 350–356. [Google Scholar] [CrossRef]
  37. Velikova, V.; Yordanov, I.; Edreva, A. Oxidative stress and some antioxidant systems in acid rain-treated bean plants. Plant Sci. 2000, 151, 59–66. [Google Scholar] [CrossRef]
  38. Frebort, I.; Haviger, A.; Jilek, M. A Kinetic Method for Assay of Plant Peroxidase and Catalase Activities by Chemiluminescence. Phytochem. Anal. 1992, 3, 55–60. [Google Scholar] [CrossRef]
  39. Kruger, N.J. The Bradford Method For Protein Quantitation. In The Protein Protocols Handbook; Springer: Berlin/Heidelberg, Germany, 2009; pp. 17–24. [Google Scholar] [CrossRef]
  40. Fischer, R.A.; Maurer, R. Drought Resistance in Spring Wheat Cultivars. 1. Grain-Yield Responses. Aust. J. Agric. Res. 1978, 29, 897–912. [Google Scholar] [CrossRef]
  41. Maghsoodi, M.; Razmjoo, J. Identify Physiological Markers for Drought Tolerance in Alfalfa. Agron. J. 2015, 107, 149–157. [Google Scholar] [CrossRef]
  42. Menconi, M.; Sgherri, C.L.M.; Pinzino, C.; Navariizzo, F. Activated Oxygen Production and Detoxification in Wheat Plants Subjected to a Water-Deficit Program. J. Exp. Bot. 1995, 46, 1123–1130. [Google Scholar] [CrossRef]
  43. Azizpour, K.; Shakiba, M.R.; Sima, N.A.K.K.; Alyari, H.; Mogaddam, M.; Esfandiari, E.; Pessarakli, M. Physiological Response of Spring Durum Wheat Genotypes to Salinity. J. Plant Nutr. 2010, 33, 859–873. [Google Scholar] [CrossRef]
  44. Singh, A.K.; Dubey, R.S. Changes in Chlorophyll-a and Chlorophyll-B Contents and Activities of Photosystem-1 and Photosystem-2 in Rice Seedlings Induced by Nacl. Photosynthetica 1995, 31, 489–499. [Google Scholar]
  45. Kaiser, W.M.; Kaiser, G.; Schoner, S.; Neimanis, S. Photosynthesis under Osmotic-Stress-Differential Recovery of Photosynthetic Activities of Stroma Enzymes, Intact Chloroplasts, Protoplasts, and Leaf Slices after Exposure to High Solute Concentrations. Planta 1981, 153, 430–435. [Google Scholar] [CrossRef]
  46. Anjum, S.A.; Xie, X.Y.; Wang, L.C.; Saleem, M.F.; Man, C.; Lei, W. Morphological, physiological and biochemical responses of plants to drought stress. Afr. J. Agric. Res. 2011, 6, 2026–2032. [Google Scholar]
  47. Mohammadkh, N.; Heidari, R. Effects of Water Stress on Respiration, Photosynthetic Pigments and Water Content in Two Maize Cultivars. Pak. J. Biol. Sci. 2007, 10, 4022–4028. [Google Scholar] [CrossRef] [Green Version]
  48. Raal, A.; Orav, A.; Nesterovitsch, J.; Maidla, K. Analysis of Carotenoids, Flavonoids and Essential Oil of Calendula officinalis Cultivars Growing in Estonia. Nat. Prod. Commun. 2016, 11, 1157–1160. [Google Scholar] [CrossRef] [Green Version]
  49. Waqas, M.A.; Kaya, C.; Riaz, A.; Farooq, M.; Nawaz, I.; Wilkes, A.; Li, Y. Potential Mechanisms of Abiotic Stress Tolerance in Crop Plants Induced by Thiourea. Front. Plant Sci. 2019, 10. [Google Scholar] [CrossRef]
  50. Golldack, D.; Li, C.; Mohan, H.; Probst, N. Tolerance to drought and salt stress in plants: Unraveling the signaling networks. Front. Plant Sci. 2014, 5, 151. [Google Scholar] [CrossRef] [Green Version]
  51. Moghadam, H.R.T.; Zahedi, H.; Ghooshchi, F. Qualidade De Óleo De Cultivares De Canola Em Resposta Ao Estresse HÍdrico E AplicaÇÃo De PolÍmero Hidroabsorvente. Pesqui. Agropecuária Trop. 2011, 41. [Google Scholar] [CrossRef]
  52. Silvente, S.; Sobolev, A.P.; Lara, M. Metabolite Adjustments in Drought Tolerant and Sensitive Soybean Genotypes in Response to Water Stress. PLoS ONE 2012, 7, e38554. [Google Scholar] [CrossRef] [PubMed] [Green Version]
  53. Slama, I.; Abdelly, C.; Bouchereau, A.; Flowers, T.; Savouré, A. Diversity, distribution and roles of osmoprotective compounds accumulated in halophytes under abiotic stress. Ann. Bot. 2015, 115, 433–447. [Google Scholar] [CrossRef] [PubMed] [Green Version]
  54. Kaur, G.; Asthir, B. Proline: A key player in plant abiotic stress tolerance. Biol. Plant. 2015, 59, 609–619. [Google Scholar] [CrossRef]
  55. Dien, D.C.; Mochizuki, T.; Yamakawa, T. Effect of various drought stresses and subsequent recovery on proline, total soluble sugar and starch metabolisms in Rice (Oryza sativa L.) varieties. Plant Prod. Sci. 2019, 22, 530–545. [Google Scholar] [CrossRef] [Green Version]
  56. Mittler, R. Oxidative stress, antioxidants and stress tolerance. Trends Plant Sci. 2002, 7, 405–410. [Google Scholar] [CrossRef]
  57. Arabzadeh, N. The Effect of Drought Stress on Soluble Carbohydrates (Sugars) in Two Species of Haloxylon persicum and Haloxylon aphyllum. Asian J. Plant Sci. 2011, 11, 44–51. [Google Scholar] [CrossRef]
  58. Tunc-Ozdemir, M.; Miller, G.; Song, L.H.; Kim, J.; Sodek, A.; Koussevitzky, S.; Misra, A.N.; Mittler, R.; Shintani, D. Thiamin Confers Enhanced Tolerance to Oxidative Stress in Arabidopsis. Plant Physiol. 2009, 151, 421–432. [Google Scholar] [CrossRef] [Green Version]
  59. Caverzan, A.; Passaia, G.; Rosa, S.B.; Ribeiro, C.W.; Lazzarotto, F.; Margis-Pinheiro, M. Plant responses to stresses: Role of ascorbate peroxidase in the antioxidant protection. Genet. Mol. Biol. 2012, 35, 1011–1019. [Google Scholar] [CrossRef] [Green Version]
  60. Shigeoka, S.; Ishikawa, T.; Tamoi, M.; Miyagawa, Y.; Takeda, T.; Yabuta, Y.; Yoshimura, K. Regulation and function of ascorbate peroxidase isoenzymes. J. Exp. Bot. 2002, 53, 1305–1319. [Google Scholar] [CrossRef]
  61. Dhanda, S.S.; Sethi, G.S.; Behl, R.K. Indices of drought tolerance in wheat genotypes at early stages of plant growth. J. Agron. Crop Sci. 2004, 190, 6–12. [Google Scholar] [CrossRef]
  62. Gawel, S.; Wardas, M.; Niedworok, E.; Wardas, P. Malondialdehyde (MDA) as a lipid peroxidation marker. Wiad. Lek. 2004, 57, 453–455. [Google Scholar] [PubMed]
  63. Garg, N.; Manchanda, G. ROS generation in plants: Boon or bane? Plant Biosyst. 2009, 143, 81–96. [Google Scholar] [CrossRef]
  64. Anjum, S.A.; Ashraf, U.; Tanveer, M.; Khan, I.; Hussain, S.; Shahzad, B.; Zohaib, A.; Abbas, F.; Saleem, M.F.; Ali, I.; et al. Drought Induced Changes in Growth, Osmolyte Accumulation and Antioxidant Metabolism of Three Maize Hybrids. Front. Plant Sci. 2017, 8. [Google Scholar] [CrossRef] [PubMed]
  65. Seleiman, M.F.; Al-Suhaibani, N.; Ali, N.; Akmal, M.; Alotaibi, M.; Refay, Y.; Dindaroglu, T.; Abdul-Wajid, H.H.; Battaglia, M.L. Drought Stress Impacts on Plants and Different Approaches to Alleviate Its Adverse Effects. Plants 2021, 10, 259. [Google Scholar] [CrossRef]
Figure 1. Projection (axis 1 and 2 of a principle component analysis) of physiological, biochemical, and morphological traits of black cumin under water stress (I3) condition.
Horticulturae 08 00193 g001
Figure 2. Dendrogram of 10 genotypes of black cumin based on the means of proline, TSC, RWC, H2O2, MDA, and SSI. Data collected from 2017 to 2018 and using Ward clustering.
Horticulturae 08 00193 g002
Table 1. Analyses of variance for different traits of ten black cumin genotypes (G) at three irrigation regimes (I) in two years (Y).
Sources of ChangesDFChl-a Chl-b Chl-a/bChl-a+bCarsProline TSC RWCH2O2 MDA CATAPX
I20.3050 **0.2527 **9.053 **1.1108 **0.0243 **27.10 **12.534 **1114.42 **2.117 **1377.4 **0.1271 **4.67 **
Y10.0081 ns0.0028 ns0.0144 *0.0207 ns0.000004 ns0.011 ns0.524 *8.97 ns0.0061 ns2.52 ns0.0005 ns0.015 ns
I × Y20.0023 ns0.0014 ns0.1309 ns0.0012 ns0.00003ns0.004 ns0.201 ns3.59 ns0.001 ns0.2290 ns0.0020 ns0.061 ns
Error120.00220.00220.26130.00500.00010.43760.1439.500.0032.210.00150.055
G90.0993 **0.0095 **1.1318 **0.1550 **0.0034 **8.52 **6.098 **125.77 **0.168 **302.18 **0.0860 **1.307 **
G × Y90.0205 ns0.0017 ns0.7795 ns0.0021 ns0.0001 **0.0565 ns0.096 ns13.53 ns0.0008 ns7.52 ns0.0018 ns0.029 ns
G × I180.0087 **0.0033 **0.3848 ns0.0185 **0.0002 **0.5589 **0.350 **17.39 **0.015 **8.927 **0.0061 **0.144 **
I × Y × G180.0026 ns0.0006ns0.1745 ns0.0038 ns0.00003 ns0.0715 ns0.114 ns9.81 ns0.001 ns6.545 ns0.0026 **0.053 ns
Error1080.00430.00200.00570.35290.000060.2310.1246.670.0074.3300.00090.062
DF, degrees of freedom; Chl-a, chlorophyll a concentration; Chl-b, chlorophyll b concentration; ratio of chlorophyll a and chlorophyll b concentrations; Cars, leaf carotenoids concentration; TSC, total soluble carbohydrates; RWC, relative water content; H2O2—hydrogen peroxide; MDA—malondialdehyde; CAT—catalase; APX—ascorbate peroxidase. ns, non-significant. * Significant at p ≤ 0.05. ** Significant at p ≤ 0.01.
Table 2. Mean comparison of the effect of irrigation regime (I), genotype (G), and their interaction on Cars and RWC of black cumin.
Cars (mg.g−1FW) RWC (%)
GenotypesI1 *I2I3Avg.I1I2I3Avg.
Afghanistan0.23 k †0.26 gh (+15) 0.26 hi (+12)0.256 F71.53 a–d68.66 a–e (−5)64.81 d–f (−10)68.33 AB
Pakistan0.23 k0.26 gh (+15)0.26 hi (+13)0.256 F70.60 a–d62.00 e–g (−12)54.84 g (−24)62.48 C
Syria0.23 k0.26 g–i (+14)0.26 i (+12)0.255 F71.17 a–d65.14 c–e (−9)59.78 fg (−16)65.37 BC
India0.26 hi0.28 ef (+15)0.27 fg (+5)0.266 DE73.02 a–c67.49 a–e (−8)65.03 b–g (−10)68.49 AB
Arak0.26 hi0.30 b (+16)0.29 cd (+12)0.286 B75.40 a68.23 a–e (−10)67.46 a–e (−11)70.36 A
Isfahan0.23 k0.26 g–i (+14)0.26 hi (+12)0.256 F73.29 ab68.43 a–e (−7)65.10 b–g (−12)68.94 AB
Semirom0.24 jk0.27 fg (+14)0.26 g–i (+11)0.261 EF73.30 a–c70.66 a–d (−4)68.28 a–e (−7)70.74 A
Shahreza0.24 j0.28 e (+14)0.30 bc (+22)0.277 C72.96 a–c68.60 a–e (−7)62.19 l–n (−15)68.91 AB
Shahrekord0.24 j0.27 ef (+13)0.29 d (+20)0.272 CD74.02 ab72.48 a–d (−3)67.48 a–f (−9)71.24 A
Mashhad0.26 hi0.30 bc (+14)0.31 a (+18)0.294 A74.75 ab67.48 a–f (−10)65.37 b–g (−13)69.20 A
Avg.0.245 B0.279 A0.280 A 73.02 A67.89 B64.33 C
* I1, I2, and I3 = 40, 60, and 80% depletion of available soil water, respectively. Means in columns and rows (interaction) for each trait followed by the same lowercase or uppercase letter(s) are not significantly different at the 5% probability level. Values in the parentheses show the percentage increase (+) or decrease (−) of the irrigation regime compared with the control (I1).
Table 3. Mean comparison of the effect of irrigation regime (I), genotype (G), and their interaction on Chl-a and Chl-a+b of black cumin.
Chl-a (mg g−1 FW) Chl-a+b (mg g−1FW)
GenotypesI1 *I2I3Avg.I1I2I3Avg.
Afghanistan0.410 mn †0.479 k–l (−14) 0.384 n (−19)0.424 C0.683 i–n †0.707 j–i (−4) 0.554 p (−11)0.648 C
Pakistan0.545 d–h0.449 lm (−17)0.411 mn (−25)0.668 C0.796 f–i0.660 l–n (−17)0.590 n–p (−25)0.682 C
Syria0.508 i–l0.399 mn (−21)0.374 n (−26)0.427 C0.786 g–i0.624 m–o (−20)0.530 p (−32)0.647 C
India0.662 b–d0.537 g–k (−18)0.497 j–l (−24)0.553 B0.918 de0.769 h–j (−16)664 l–n (−28)0.784 B
Arak0.739 a0.584 d–g (−20)0.505 i–l (−31)0.610 AB1.093 ab0.841 f–g (−23)0.649 l–n (−40)0.861 A
Isfahan0.641 b–d0.550 e–j (−14)0.522 h–k (−18)0.571 AB0.952 cd0.799 f–i (−16)0.708 j–l (−25)0.820 AB
Semirom0.611 c–e0.581 d–h (−5)0.533 j–k (−13)0.575 AB0.955 cd0.866 ef (−9)0.762 ij (−20)0.861 A
Shahreza0.673 bc0.562 e–i (−17)0.509 i–l (−24)0.581 AB0.973 cd0.811 f–i (−17)0.710 j–l (−28)0.277 C
Shahrekord0.683 ab0.592 d–g (−13)0.520 h–k (−24)0.598 AB1.020 bc0.848 e–g (−16)0.742 j–k (−27)0.870 A
Mashhad0.742 a0.606 d–f (−18)0.504 i–l (−32)0.618A1.100 a0.852 e–g (−18)0.651 l–n (−32)0.868 A
Avg.0.618 A0.534 B0.476 C 0.928 A0.787 B0.656 C
* I1, I2, and I3 = 40, 60, and 80% depletion of available soil water, respectively. Means in columns and rows (interaction) for each trait followed by the same lowercase or uppercase letter(s) are not significantly different at the 5% probability level. Values in the parentheses show the percentage increase (+) or decrease (−) of the irrigation regime compared with the control (I1).
Table 4. Mean comparison of the effect of irrigation regime (I) and genotype (G) on Chl-a, Chl-a, Chl-a/b, Chl-a+b, and Cars of black cumin in a two-year period (2017–2018).
Chl-a
(mg g−1 FW)
Chl-b
(mg g−1 FW)
Chl-a/b
(mg g−1 FW)
Chl-a+b
(mg g−1 FW)
Cars (mg g−1 FW)
Irrigation regime (I)
I10.618 a0.309 a2.003 b0.928 a0.245 b
I20.534 b (−14)0.243 b (−17) 2.260 a (+11)0.778 b (−16) 0.279 a (+14)
I30.476 c (−23)0.181 c (−33)2.792 a (+37)0.656 b (−280.280 a (+14)
Genotypes
Afghanistan0.424 c0.232 c–e2.046 c0.648 c0.256 f
Pakistan0.468 b0.214 e2.253 a–c0.682 c0.256 f
Syria0.427 c0.219 de2.081 bc0.647 c0.255 f
India0.553 b0.230 c–e2.549 ab0.784 b0.266 de
Arak0.610 ab0.251 bc2.490 c0.861 a0.286 b
Isfahan0.571 ab0.248 b–d2.315 a–c0.820 ab0.256 cd
Semirom0.575 ab0.286 a2.088 bc0.861 a0.261 ef
Shahreza0.581 ab0.250 b–d2.484 a–c0.832 ab0.277 c
Shahrekord0.598 ab0.271 ab2.260 a–c0.870 a0.272 cd
Mashhad0.618 a0.249 b–d2.738 a0.868 a0.294 a
In each column and within each experimental factor, means with at least one similar letter are not significantly different according to the LSD (p < 0.05).
Table 5. Mean comparison of the effect of irrigation regime (I), genotype (G), and their interaction on TSC and proline of black cumin.
TSC (mg/FW) Proline (μmol/g)
GenotypesI1 *I2I3Avg.I1I2I3Avg.
Afghanistan1.51 n–p †1.80 l–n (+20) 2.66 c–f (+70)1.99 D1.78 n †2.09 m–n (+18)2.41 l–n (+36)2.10 E
Pakistan1.17 p1.36 op (+16)1.48 n–p (+25)1.33 E2.51 l–m3.63 g–k (+45)4.44 b–d (+76)3.53 C
Syria1.16 p1.37 op (+18)1.65 m–o (+42)1.39 E2.02 m–n3.54 h–k (+74)3.73 f–j (+85)3.15 D
India1.93 j–m2.54 e–h (+31)2.64 c–h (+37)2.37 C2.54 l–m3.53 h–k (+39)3.86 d–g (+52)3.31 CD
Arak2.21 h–k2.73 c–f (+24)3.33 b (+50)2.76 B2.59 l–m3.83 e–g (+48)4.99 c–i (+95)3.50 C
Isfahan1.36 op1.59 m–o (+14)1.75 m–o (+28)1.56 E2.50 l–m3.35 j–k (+34)3.41 i–k (+37)3.09 D
Semirom2.14 i–l2.79 c–e (+31)3.07 bc (+44)2.67 B3.69 f–k3.97 d–j (+8)4.51 f–i (+22)4.06 B
Shahreza1.82 k–n2.33 f–j (+28)2.65 c–g (+45)2.27 C3.02 k–l3.50 h–k (+16)4.30 b–g (+43)3.61 C
Shahrekord2.40 e–i2.97 b–d (+24)4.22 a (+75)3.19 A4.15 c–h4.65 a–c (+12)5.26 a (+26)4.69 A
Mashhad2.26 g–j2.56 d–h (+14)3.07 bc (+35)2.63 B2.66 l–m4.34 b–d (+64)4.96 ab (+86)3.98 B
Avg.1.79 C2.21 B2.65 A 2.543.54.05
* I1, I2, and I3 = 40, 60, and 80% depletion of available soil water, respectively. Means in columns and rows (interaction) for each trait followed by the same lowercase or uppercase letter(s) are not significantly different at the 5% probability level. Values in the parentheses show the percentage increase (+) or decrease (−) of the irrigation regime compared with the control (I1).
Table 6. Mean comparison of the effect of irrigation regime (I), genotype (G), and their interaction on CAT and APX of black cumin.
CAT (Unit mg−1 Protein) APX (Unit mg−1 Protein)
GenotypesI1 *I2I3Avg.I1I2I3Avg.
Afghanistan0.143 p †0.229 i–o (+58) 0.217 j–o (+52)0.196 EF§1.23 k–n †1.50 h–k (+21)1.64 g–i (+33)1.46 C–E
Pakistan0.203 k–p0.256 f–l (+26)0.282 e–i (+38)0.247 CD1.21 mn1.47 i–n (+21)1.57 g–j (+28)1.42 DE
Syria0.145 p0.169 op (+16)0.187 m–p (+28)0.167 F1.19 n1.38 i–n (+14)1.49 i–l (+25)1.36 E
India0.195 l–p0.213 j–o (+9)0.226 i–o (+16)0.211 DE1.34 j–n1.60 g–j (+23)1.79 e–g (+32)1.57 B–D
Arak0.267 f–j0.299 d–g (+12)0.334 de (+25)0.300 B1.33 j–n1.66 f–i (+23)1.82 d–g (+35)1.42 DE
Isfahan0.151 p0.173 op (+15)0.180 n–p (+19)0.168 F1.22 l–n1.48 i–m (+21)1.58 g–j (+30)1.60 BC
Semirom0.257 f–k0.408 bc (+60)0.433 ab (+69)0.366 A1.54 g–j2.07 cd (+34)2.77 a (+79)2.13 A
Shahreza0.214 j–o0.309 d–f (+44)0.346 d (+62)0.346 B1.49 i–m1.78 e–h (+20)1.94 c–f (+31)1.73 B
Shahrekord0.236 h–n0.347 cd (+47)0.429 a (+81)0.290 B1.57 g–j2.17 c (+38)2.74 b (+75)2.07 A
Mashhad0.216 j–o0.242 g–m (+15)0.294 d–g (+37)0.250 C 1.44 i–n1.65 g–i (+15)2.03 c–e (+40)1.70 B
Avg.0.203 B0.264 A0.293 A 1.35 C1.67 B1.91 A
* I1, I2, and I3 = 40, 60, and 80% depletion of available soil water, respectively. Means in columns and rows (interaction) for each trait followed by the same lowercase letter(s) are not significantly different at the 5% probability level. Values in the parentheses show the percentage increase (+) or decrease (−) of the irrigation regime compared with the control (I1). § The means indicated with the same capital letters in the rows (main effect of the genotype) and in the columns (main effect of the irrigation regime) for each trait are not significantly different at the 5% probability level.
Table 7. Mean comparison of the effect of irrigation regime (I), genotype (G), and their interaction on H2O2 and MDA of black cumin.
H2O2 (μmol•g−1 FW) MDA (nmol•g−1 FW)
GenotypesI1 *I2I3Avg.I1I2I3Avg.
Afghanistan0.3916 lm †0.5526 d–g (+41) 0.7148 bc (+82)0.552 CD §28.86 d–j †35.67 ac (+24)40.07 (+39)34.87 A
Pakistan0.4033 h–m0.5688 d–f (+40)0.6871 bc (+70)0.553 CD26.03 f–l31.17 b–g (+20)35.97 a–c (+38)31.06 B
Syria0.3536 ml0.5405 d–g (+54)0.6990 bc (+95)0.531 D23.04 i–m30.27 b–h (+32)36.42 ab (+58)29.91 BC
India0.4516 g–l0.6420 cd (+42)0.7036 bc (+55)0.599 BC23.27 i–m29.22 d–i (+26)34.48 a–d (+48)28.99 BC
Arak0.4848 f–j0.6310 c–e (+32)0.7886 ab (+62)0.634 B26.82 d–l32.76 b–e (+22)37.95 b (+42)32.01 AB
Isfahan0.3488 ml0.3783 j–m (+10)0.5346 e–g (+55)0.420 E27.30 e–l34.99 a–d (+28)35.60 a–c (+31)32.63 AB
Semirom0.3253 m0.3543 k–m (+8)0.4081 h–m (+25)0.362 F21.12 k–m26.02 f–l (+23)29.83 d–h (+41)25.65 D
Shahreza0.3705 k–m0.4636 f–k (+27)0.5351 e–g (+46)0.456 E21.89 k–m24.90 g–l (+14)30.01 b–h (+37)25.60 D
Shahrekord0.3506 ml0.4246 h–m (+20)0.5010 f–h (+42)0.425 E17.72 m20.73 l–m (+16)24.28 i–l (+37)20.91 E
Mashhad0.4895 f–i0.7468 ab (+52)0.8276 a (+67)0.688 A22.41 j–m29.50 d–i (+32)31.81 b–f (+41)27.91 CD
Avg.0.3968 C0.5302 B0.6399 A 23.85 C29.32 B33.29 A
* I1, I2, and I3 = 40, 60, and 80% depletion of available soil water, respectively. Means in columns and rows (interaction) for each trait followed by the same lowercase letter(s) are not significantly different at the 5% probability level. Values in the parentheses show the percentage increase (+) or decrease (−) of the irrigation regime compared with the control (I1). § Averages of rows (main effect of genotype) and columns (main effect of irrigation regime) for each trait followed by the same uppercase letter(s) are not significantly different at the 5% probability level.
Table 8. Analyses of variance at three irrigation regimes (I) in two years (Y).
Sources of ChangesDFPlant Height
I23241.38 **
Y1307.91 ns
I × Y 227.33 ns
Error1211.63
G92296.89 **
G× Y936.97 ns
G × I18148.08 **
I × Y × G1845. 36 ns
Total error108867.99
* and **: significant at the 5% and 1% probability levels, respectively; ns: non-significant.
Table 9. Mean comparison of the effect of irrigation regime (I), genotype (G), and their interaction on plant height of black cumin.
Plant Height (cm)
GenotypesI1 *I2I3Avg.
Afghanistan36.69 e–h †34.56 g–i (−6) 31.47 hi (−15)34.90 G §
Pakistan36.35 e–h28.00 j–m (−23)27.15 l (−26)30.50 EF
Syria35.38 e–i31.55 g–i (−5)29.11 hi (−18)32.01 FG
India33.31 e–i30.25 hi (−10)27.22 i (−19)30.25 D
Arak61.75 a42.35 de (−32)33.27 f–i (−46)45.80 A
Isfahan59.33 a34.67 e–i (−42)32.13 g–k (−46)41.37 E
Semirom57.18 ab49.03 d (−15)31.30 d–g (−45)45.80 CD
Shahreza62.93 a48.74 b–d (−22)41.79 d–f (−34)59.90 B
Shahrekord55.88 a47.51 cd (−15)40.54 d–g (−28)48.00 BC
Mashhad58.68 a48.75 d (−17)30.29 hi (−48)45.90 A
Avg.49.74 A39.70 B32.20 C
* I1, I2, and I3 = 40, 60, and 80% depletion of available soil water, respectively. Means in columns and rows (interaction) for each trait followed by the same lowercase letter(s) are not significantly different at the 5% probability level. Values in the parentheses show the percentage increase (+) or decrease (−) of the irrigation regime compared with the control (I1). § The means indicated with the same capital letters in the rows (main effect of the genotype) and in the columns (main effect of the irrigation regime) for each trait are not significantly different at the 5% probability level.
Table 10. Mean comparison of the effect of irrigation regime (I), genotype (G), and their interaction on capsules number per plant and seeds per capsule of black cumin.
Seeds per Capsule Capsules Number per Plant
GenotypesI1 *I2I3Avg.I1I2I3Avg.
Afghanistan14.08 g–l11.32 i–n (−20)10.23 c (−28)10.43 F §57.33 g–i †47.50 k–m (−18) 35.00 o (−38)46.27 C
Pakistan19.31 c–f9.32 n–p (−52)6.66 o–p (−60)11.76 E–F72.16 c49.16 j–m (−32)38.0 no (−48)53.22 D
Syria19.25 c–f10.76 j–o (−44)6.97 o–p (−63)12.33 D–F61.00 e–g46.25 lm (−25)35.00 o (−43)47.50 C
India21.14 cd10.45 n–p (−51)8.50 n–p (−60)13.36 C–E76.33 c46.04 lm (−40)38.92 no (−49)53.90 B
Arak26.06 ab22.06 b–d (−16)10.61 j–o (−60)19.58 A95.0 a 59.00 fh (−38)37.82 no (−60)64.93 A
Isfahan18.33 d–g14.01 h–l (−24)11.61 k–n (−36)14.65 CD70.50 cd51.16 i–l (−28)35.50 o (−32)52.55 B
Semirom16.66 e–h14.40 g–k (−13)13.85 h–l (−17)14.97 BC70.83 cd60.16 e–g (−16)55.20 g–i (−22)62.11 A
Shahreza23.46 abc20.57 cde (−13)13.54 k–m (−40)19.17 A85.33 b65.33 de (−24)43.83 mn (−48)64.83 A
Shahrekord15.17 f–i 14.63 g–j (−4)12.10 k–n (−20)13.96 C–E71.66 e–f64.33 ef (−10)52.00 i–k (−27)62.94 A
Mashhad26.76 a14.79 g–j (−44)10.07 l–p (−65)17.21 AB90.16 ab54.83 h–j–f (−38)43.40 m–n (−53)62.61 A
Avg.19.96 A14.21 B10.39 C 75.03 A54.43 B41.51 C
* I1, I2, and I3 = 40, 60, and 80% depletion of available soil water, respectively. Means in columns and rows (interaction) for each trait followed by the same lowercase letter(s) are not significantly different at the 5% probability level. Values in the parentheses show the percentage increase (+) or decrease (−) of the irrigation regime compared with the control (I1). § The means indicated with the same capital letters in the rows (main effect of the genotype) and in the columns (main effect of the irrigation regime) for each trait are not significantly different at the 5% probability level.
Table 11. Rankings of ten black cumin genotypes based on the stress susceptibility index of seed yield under irrigation after 60% depletion of available soil water (I2) and under irrigation after 80% depletion of available soil water (I3).
Stress Susceptibility Index under I3 (SSI3) Stress Susceptibility Index under I2 (SSI2)
GenotypesSSI2RankingGroupSSI3RankingGroup
Afghanistan0.632Tolerant0.9894Moderate
Pakistan1.56210Susceptible1.18410Susceptible
Syria1.2528Susceptible1.1188Susceptible
India1.3799Susceptible1.16Susceptible
Arak0.7465Moderate1.1187Susceptible
Isfahan0.7486Moderate0.7483Tolerant
Semirom0.7234Tolerant0.5861Tolerant
Shahreza0.7133Tolerant15Moderate
Shahrekord0.5721Tolerant0.6212Tolerant
Mashhad1.2477Susceptible1.1379Susceptible
Publisher’s Note: MDPI stays neutral with regard to jurisdictional claims in published maps and institutional affiliations.

