Article

Slight Changes in Fruit Firmness at Harvest Determine the Storage Potential of the ‘Rojo Brillante’ Persimmon Treated with Gibberellic Acid

1
Postharvest Department, Instituto Valenciano de Investigaciones Agrarias, 46113 Valencia, Spain
2
Food Technology Department, Universitat Politècnica de València, 46022 Valencia, Spain
3
Cooperativa Agrícola Nuestra Señora del Oreto, 46250 Valencia, Spain
*
Author to whom correspondence should be addressed.
Horticulturae 2022, 8(2), 140; https://doi.org/10.3390/horticulturae8020140
Submission received: 11 January 2022 / Revised: 1 February 2022 / Accepted: 3 February 2022 / Published: 6 February 2022

Abstract

:
Today, the ‘Rojo Brillante’ persimmons undergoing prolonged storage are treated with giberellic acid, which allows the delay of the harvesting to November-December. Although during this period the fruit maintained high commercial firmness, practical experience indicates very different behavior during the posterior cold storage, depending on the harvest moment. To explain what leads to these differences, an in-depth study of the physicochemical and microstructural changes occurring in the fruit during five commercial harvest times from November to December was carried out. During this period, slight variations in firmness occurred, ranging from 48 to 40 N. Nevertheless, the fruit behavior under cold storage was strongly influenced by the harvest date, which was explained by the degradation of cell wall, cell membrane and tonoplast, mainly noted in fruit from the latest harvests. Therefore, the fruit harvested with firmness close to 48 N had a highly structured cell, which maintained firmness during cold storage for up to 90 days. The fruit harvested with 43 N presented a more degraded structure, while the fruit with initial firmness around 40 N underwent major ultrastructure cell wall and membranes modifications, which led to greater firmness loss. Therefore, the fruit firmness at harvest is decisive for its storage potential.

1. Introduction

‘Rojo Brillante’ is the main persimmon (Diospyros kaki Thunb) cultivar produced in Spain, whose production reached 590,000 tons in 2019. It is an astringent variety of the PVA type (pollination variant astringent) [1]. Although it is grown mainly in the Mediterranean region, this variety is highly valued commercially in other countries due to its high quality, which leads to the export of a large quantity of its production that is up to 210,000 tons during the 2019 season [2]. ‘Rojo Brillante’ maturation takes place between mid-October and the end of November. This short period involves having to introduce techniques that allow an extended harvest period to supply the market with fresh high-quality fruit for a longer period.
Flesh firmness is the most important quality attribute of ‘Rojo Brillante’ because this cultivar is commercialized as fruit with high firmness values after being subjected to deastringency treatment at high CO2 concentrations [3,4]. It is known that flesh firmness at harvest plays a crucial role in fruit quality during the post-harvest period [5,6,7]. Therefore, introducing pre- and post-harvest treatments to prolong commercial periods in order to maintain the fruit firmness during the post-harvest period has been a challenge in recent years.
Pre-harvest treatments with gibberellic acid (GA3) at fruit color-break are well established for persimmon; they delay fruit maturity, the green-to-orange color change and also flesh softening on trees by maintaining good fruit firmness at the end of the season [8,9]. Treatment is generally applied up to three times, with a separation of 15–20 days between applications, to enhance delayed fruit maturation. Cold persimmon storage is also necessary to manage today’s large production and to extend the commercial period, especially toward its end. Nevertheless, ‘Rojo Brillante’ is sensitive to low temperature and develops chilling injury symptoms when exposed to temperatures below 8 °C [10]. The main chilling injury manifestation is firmness loss, which certainly compromises final fruit quality. Therefore, to preserve ‘Rojo Brillante’, currently it is necessary to apply a treatment with 1-methylcyclopropene (1-MCP) before cold storage to delay flesh softening [11]. The combination of GA3 at pre-harvest and 1-MCP at post-harvest has been previously reported to prolong low-temperature storability [4].
Today, the ‘Rojo Brillante’ persimmons stored to be commercialized from January onward are the fruit treated with GA3 at pre-harvest, harvested from November to December, and treated with 1-MCP before storage, as this is a well-established practice for persimmon producers. Throughout this harvest period, fruit firmness values remain high, which seems suitable for conservation purposes. Nevertheless, practical experience indicates a very different post-harvest behavior between fruit harvested during this period.
Hence, the aim of this study is the physio-chemical and microstructural characterization at different harvest times of fruit destined to prolonged conservation, in order to explain the differences in fruit behavior during cold storage.

2. Materials and Methods

2.1. Fruit Material

This study was conducted in two commercial ‘Rojo Brillante’ persimmon orchards located in Alcudia (Valencia, Spain). In both orchards, three GA3 treatments (30 µL L−1) were applied under commercial conditions. The first GA3 treatment took place on 7 October and the following applications were performed every 15 days after the first one, on 21 October and 3 November.
Six trees per plot (three trees as one replicate) were previously marked. Five harvests of 140 fruit per replicate were performed, totalizing 280 fruit per orchard at each harvest moment.
The harvests took place from the time skin displayed a commercial uniform greenish-yellow tone, from 11 November to 9 December, with one harvest per week: H1 (11 November); H2 (18 November); H3 (25 November); H4 (2 December); H5 (9 December).
The harvested fruit were transported to the Instituto Valenciano de Investigaciones Agrarias (IVIA, Spain), where one lot of 20 fruit per replicate was characterized at harvest, and three lots of 40 fruit per replicate were stored for 30, 60 or 90 days at 0 °C, plus 5 more days at 20 °C, to simulate the shelf-life period. In all cases, fruit were treated with 1-MCP under commercial conditions (500 nL L−1 of 1-MCP for 24 h at 1 °C) before storage [5] and were submitted to the deastringency treatment after storage under standard conditions (95% CO2 for 24 h at 20 °C and 90% RH). These treatments aimed to reproduce in fruit the standard post-harvest practices adopted commercially.
In order to characterize fruit at the different harvest times, the following determinations were made: external color, flesh firmness, total soluble solids content and soluble tannins. Ethylene and CO2 production were measured in both the fruit and calyx once the calyx was carefully separated from the fruit. A microstructural study of fruit flesh was also performed by electronic cryo-scanning electron microscopy (Cryo-SEM), transmission electron microscopy (TEM) and confocal laser scanning microscopy (CLSM). Flesh firmness was also determined after each shelf-life period.

2.2. Determinations

Firmness was determined on the equatorial zone, from which skin had been previously removed, on each individual fruit per replicate using a texturometer (Instron Corp., mod. 4301, Canton, MA, USA) by making an 8-mm diameter punch on fruit samples. The results were expressed in Newton units (N) as the force needed to break the flesh [5].
The external color was evaluated with a colorimeter (Minolta, model CR-300, Ramsey, NY, USA) using the L, a, b Hunter parameters. The results were expressed as a color index (CI = 1000 a/Lb) [12].
Soluble tannins were measured according the Folin-Denis method [13], as described by Arnal and Del Río [10], of over 3 samples of 5 fruit per replicate. The results were expressed as a percentage of fresh weight. To determine total soluble solids, fruit juice was obtained from over 3 samples of 5 fruit per replicate using an electric juice extractor and filtered. To avoid the interference of tannins, their insolubilization was previously carried out using a 5% polyethyleneglycol solution (w/w) (PEG 6000, Panreac) to precipitate the tannins still present in juice [14]. Measurements were taken by a refractometer (Atagomod. PR1) and the results were expressed as %.
During each harvest, CO2 and ethylene production were evaluated in four whole fruit per replicate, and also in four calyxes that had been previously separated from fruit according to the method described by Fathi-Najafabadi [15]. The fruit and calyx samples were placed in 1 L and 100 mL jars, respectively. Jars were sealed and placed in a chamber at 20 °C for 24 h. The concentrations of CO2 and ethylene inside the jars were measured by taking 1 mL of gas sample from the headspace with a BD Plastic pack syringe, through a silicone septum fitted in the jar and injected into the gas chromatograph with a Poropak QS 80/100 column (model 2000, Perkin-Elmer, Norwalk, CONN, USA). The CO2 concentration was determined using a thermal conductivity detector. Helium was used as the carrier gas at 63.4 kPa. The injector, oven and detector temperatures were 115 °C, 35 °C and 150 °C, respectively. The ethylene concentration measurement was made using a flame ionization detector. Helium was the carrier gas at 55 kPa. The injector, oven and detector temperatures were 175 °C, 75 °C and 175 °C, respectively. The CO2 concentration was expressed as mmol kg−1 h−1, while ethylene concentration was expressed as nmol kg−1 h−1.
Microstructural study was performed on over two fruit per replicate. A cryo-scanning electron microscopy (Cryo-SEM, ZEISS ULTRA 55, Oxford Instruments, Abingdon, UK) was used to observe the flesh samples. They were placed in the holder, frozen by immersion in slush nitrogen and transferred to a cryogenic unit (CT 15,000 C; Oxford Instrument, Oxford, UK) connected to a scanning electron microscope (SEM) (JEOLJSM 5410, JEOL, Tokyo, Japan). After fracturing and being coated with platinum at 5 mA for 20 s, samples were observed at 2 kV at a working distance of 3–5 mm.
Confocal laser scanning microscopy (CLSM) was carried out with a ZEISS 780 microscope coupled to an Axio Observer Z1 inverted microscope (Carl Zeiss, Germany). A C-Apochromat 40X/1.2 W water immersion objective was used to visualize the samples. Images were obtained at a resolution of 1024 × 1024 pixels using the microscope software (ZEN). Calcofluor White (Fluka, Sigma-Aldrich, MO, USA) was used to stain polysaccharides and was excited with diode line 405 and detected at 410–477 nm. Moreover, carotenoid autofluorescence was observed at 515 nm. To observe and study samples, tissue sections (20 µm thick) were obtained with a cryostat (CM 1950, Leica Biosystems, Nussloch, Germany). The portion of tissue was placed on a slide, and 20 µL of Calcofluor White were added and left to rest for 5 min. Then, the samples were covered with a glass coverslip.
The samples’ ultrastructure was observed under a transmission electron microscopy (TEM) (HITACHI HT7800 120 kV, Hitachi, Japan). The fresh flesh samples were cut into cubes (3 mm3), which were fixed with 25 gL−1 glutaraldehyde solution (0.025 M phosphate buffer, pH 6.8, at 4 °C for 24 h), post-fixed with 20 gL−1 osmium tetroxide solution (1.5 h), dehydrated using a graded ethanol series (300, 500, 700 and 1000 g kg−1), contrasted with uranyl acetate solution (20 gL−1) and embedded in LR-white resin (Aname, Madrid, Spain). The obtained blocks were cut using a Reichert-Jung ULTRACUT ultramicrotome (Leica Microsystems, Wetzlar, Germany) in ultrathin sections (0.1 μm), collected in copper grids and stained with lead citrate (40 gL−1) to be observed at 100 kV.

2.3. Statistical Analysis

The data were analyzed following the analysis of variance (ANOVA) to evaluate the effect of harvest, orchard and storage time and their interaction. The mean values were compared by the least significant difference test (LSD) at a significance level of 5%. (p < 0.05). The analyses were carried out using the Statgraphics Centurion XVII.I software (Manugistics, Inc., Rockville, MD, USA).

3. Results and Discussion

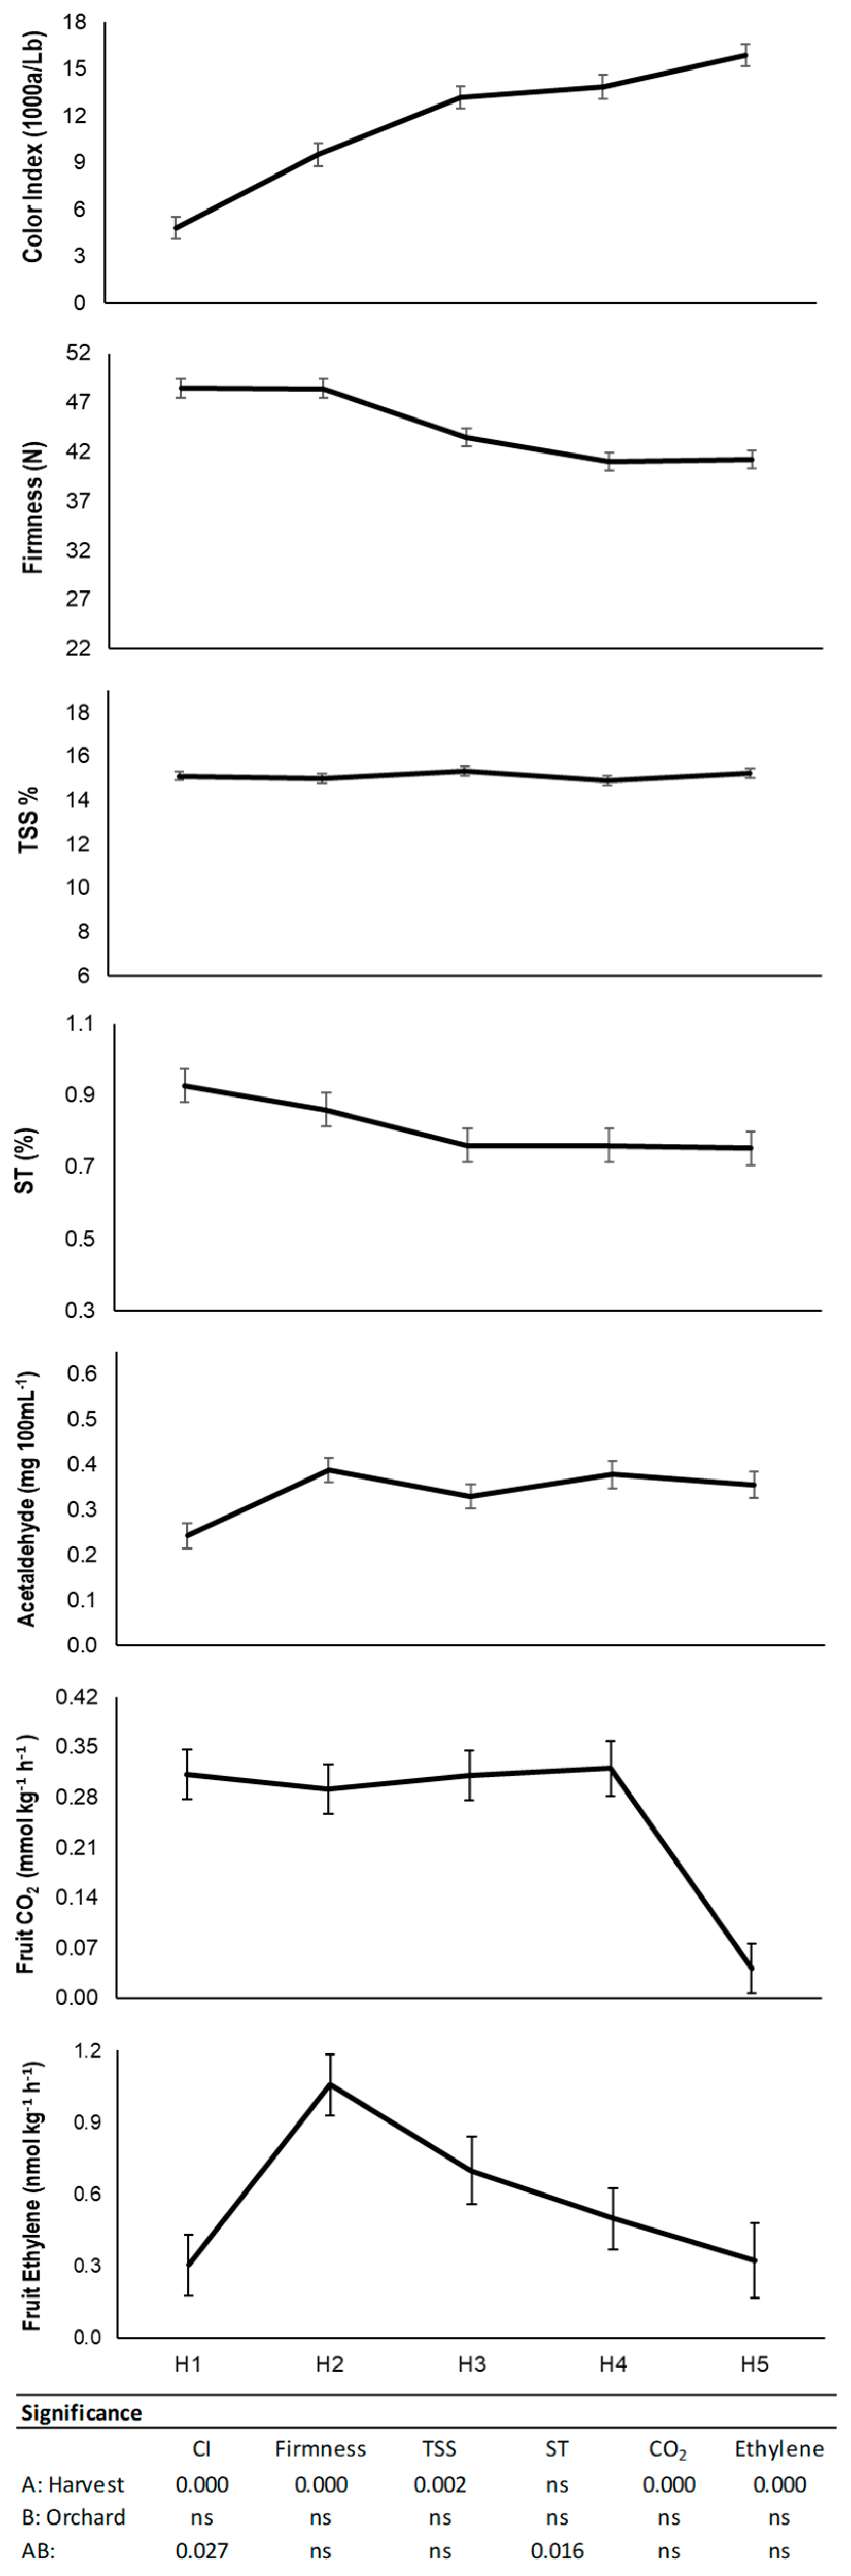
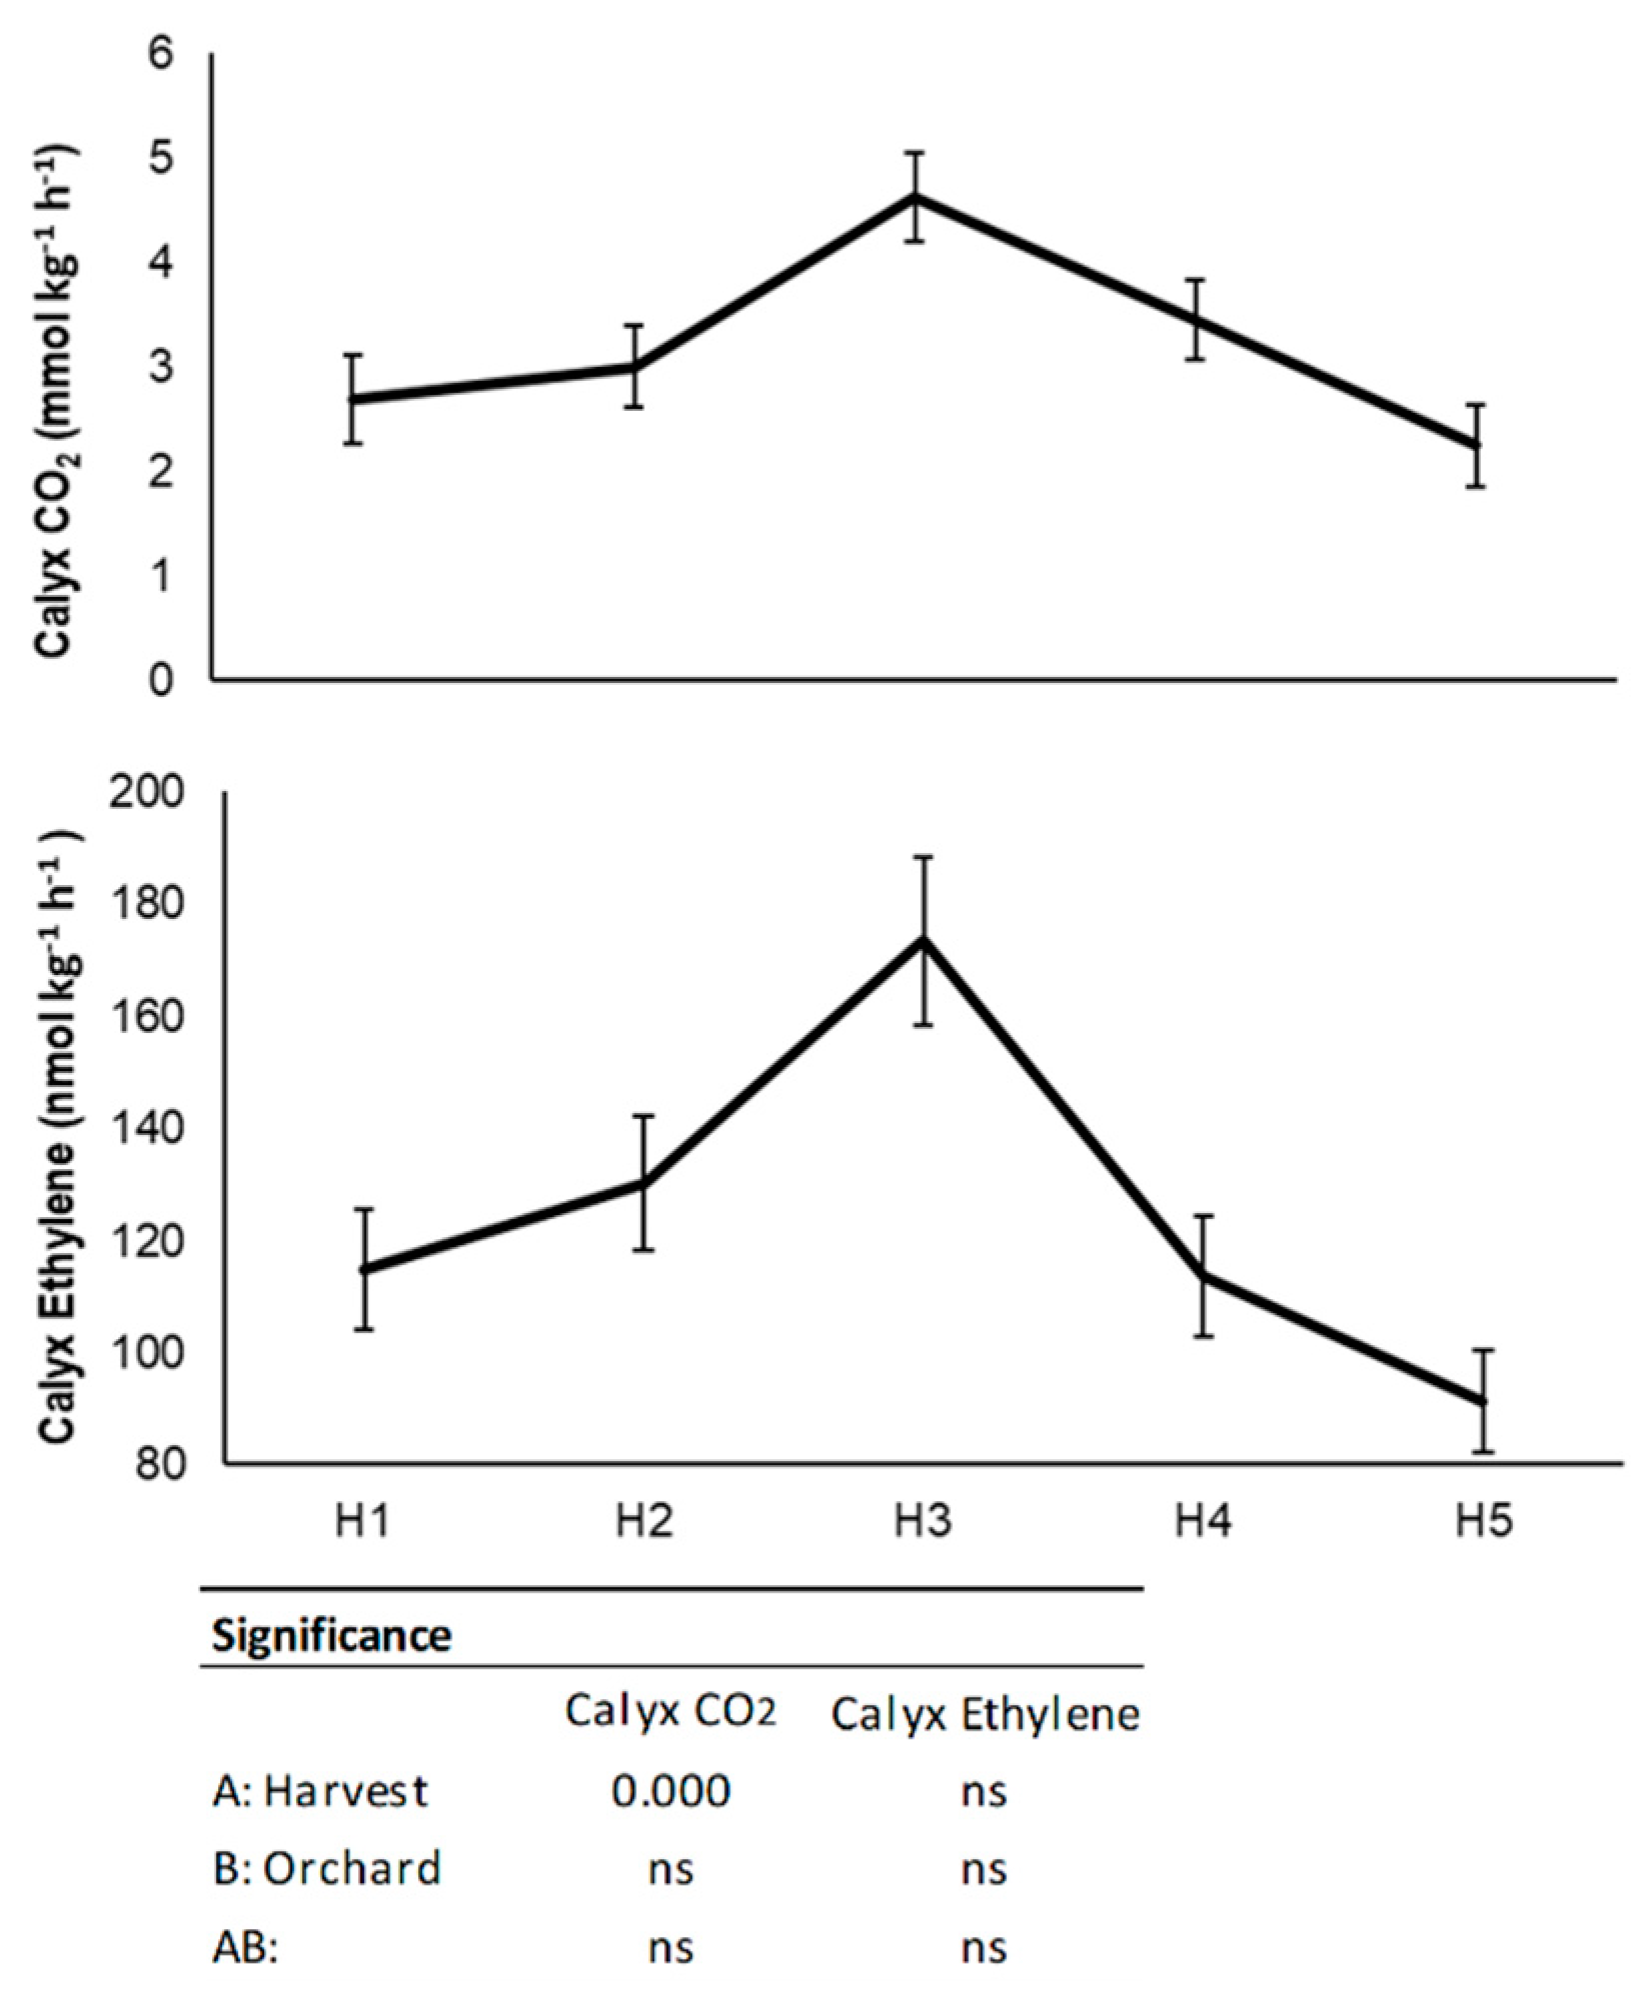
3.1. Physico-Chemical Characterization at Harvest

The physico-chemical fruit parameters at 5 harvesting weeks are shown in Figure 1. No influence of the orchard where fruit came from was found for any studied parameter at harvest.
Persimmon fruit are considered ready to harvest when they display a homogeneous orange or red color, depending on the cultivar, with no visible green background [16]. Therefore, the first harvest took place when fruit displayed the commercial external coloration with a color index close to 5. Over the next 4 weeks, a gradual increase in external coloration was shown until the CI values came close to 17, which corresponded to an orange-red stage.
Firmness is one of the main quality parameters to consider during the ‘Rojo Brillante’ persimmon commercialization. Nevertheless, the optimum firmness at harvest is not established and largely depends on the storage conditions to which fruit submit [5,6]. In accordance with company Agrofresh S.A. recommendations, which supplies the 1-MCP application for persimmon, a minimum of 40 N is necessary at harvest to keep fruit at 0–1 °C, with 1-MCP pretreatment guaranteeing commercial fruit firmness (above 20 N) after 40 storage days [17].
In the present study, the fruit demonstrated high flesh firmness values at all the harvests. On 11 November (H1), fruit firmness was 48.4 N. No changes were observed after 1 week (H2), but a decrease occurred at the following harvests to values of 43 N in H3, and of 40 N in H4 and H5.
In ‘Rojo Brillante’, a strong negative correlation between external color and flesh firmness during fruit maturation has been reported [18,19,20]. Nevertheless, in this study, only a correlation of −0.53 was found between these two parameters. This weak correlation could indicate that an increase in the color of GA3-treated fruit is not always accompanied by diminished firmness. Flesh firmness remaining while external color increases is beneficial from a commercial point of view.
During the study period, TSS content was around 15%, with no changes with harvest advance. Total soluble solids content is not a good maturity index for astringent persimmon cultivars because, when determined at harvest, this measurement includes not only sugar, but also soluble tannins [16]. In our case, the TSS determination was made after eliminating soluble tannins from samples so that it would indicate only sugar content. The values herein obtained fell within the range of the commercial values reported in previous studies [21,22,23].
At all the harvest times, high soluble tannin (ST) content was observed, which reflects this variety’s characteristic astringency [6]. Although a reduction in week 3 was detected, it did not suffice to cause astringency loss. The recorded values, between 0.9% and 0.7%, fell within the range reported for ‘Rojo Brillante’ persimmon at harvest throughout the season [16,19,24]. This high ST content involves having to apply deastringency treatment prior to the commercialization of astringent persimmon varieties, such as ‘Rojo Brillante’.
CO2 fruit production was similar from H1 to H4, with values close to 0.3 mmol kg−1 h−1, and drastically dropped at H5 to 0.04 mmol kg−1 h−1. Novillo et al. [22] recorded values within the same range for ‘Rojo Brillante’ and other cultivars when fruit had homogeneous external coloration.
For fruit ethylene production, very low values were detected at all the harvest times with a maximum peak of 1.06 nmol kg−1 h−1 at H2, which corresponds to an external CI of 9.5. According to Woolf and Ben-Arie [25], persimmon produces extremely low ethylene levels with peaks below 2.2 nmol kg−1 h−1. Previous studies conducted with ’Rojo Brillante´ have also obtained very low ethylene values during fruit maturation. In those studies, the maximum value came close to 1.76 nmol kg−1 h−1, which was observed when fruit had not yet reached commercial coloration (CI of −1) and indicates persimmon’s climacteric behavior [7,22]. In the present study, the GA3 treatment could have affected ethylene production by fruit by delaying its maximum production peak.
Persimmon calyx status is important from the visual point of view. Persimmon possesses a relatively large calyx compared to other fruit, which is considered a “gas exchange organ” [26]. The calyx darkens during fruit ripening, which affects external fruit quality. A recent study reports that GA3 treatment delayed calyx senescence, a process that occurs during fruit maturation, and external fruit quality improved [15]. In the present study, the calyx looked green and fresh and showed slight desiccation symptoms only after H3, which coincided with an increase in the CO2 and ethylene production values (Figure 2).
The maximum calyx CO2 production was reached at H3, with values of 4.6 mmol kg−1 h−1 before lowering in following weeks to similar values to those obtained at H1, close to 2.5 mmol kg−1 h−1 (Figure 3). The calyx ethylene production at H1 was 114.8 nmol kg−1 h−1 with a maximum value of 173.5 nmol kg−1 h−1 also at H3, which dropped at the following harvest times (Figure 3). These values are within the range recorded by Besada et al. [27]. Fathi-Najafabadi et al. [15] found lower ethylene values in the calyxes of the fruit treated with GA3 compared to untreated fruit.

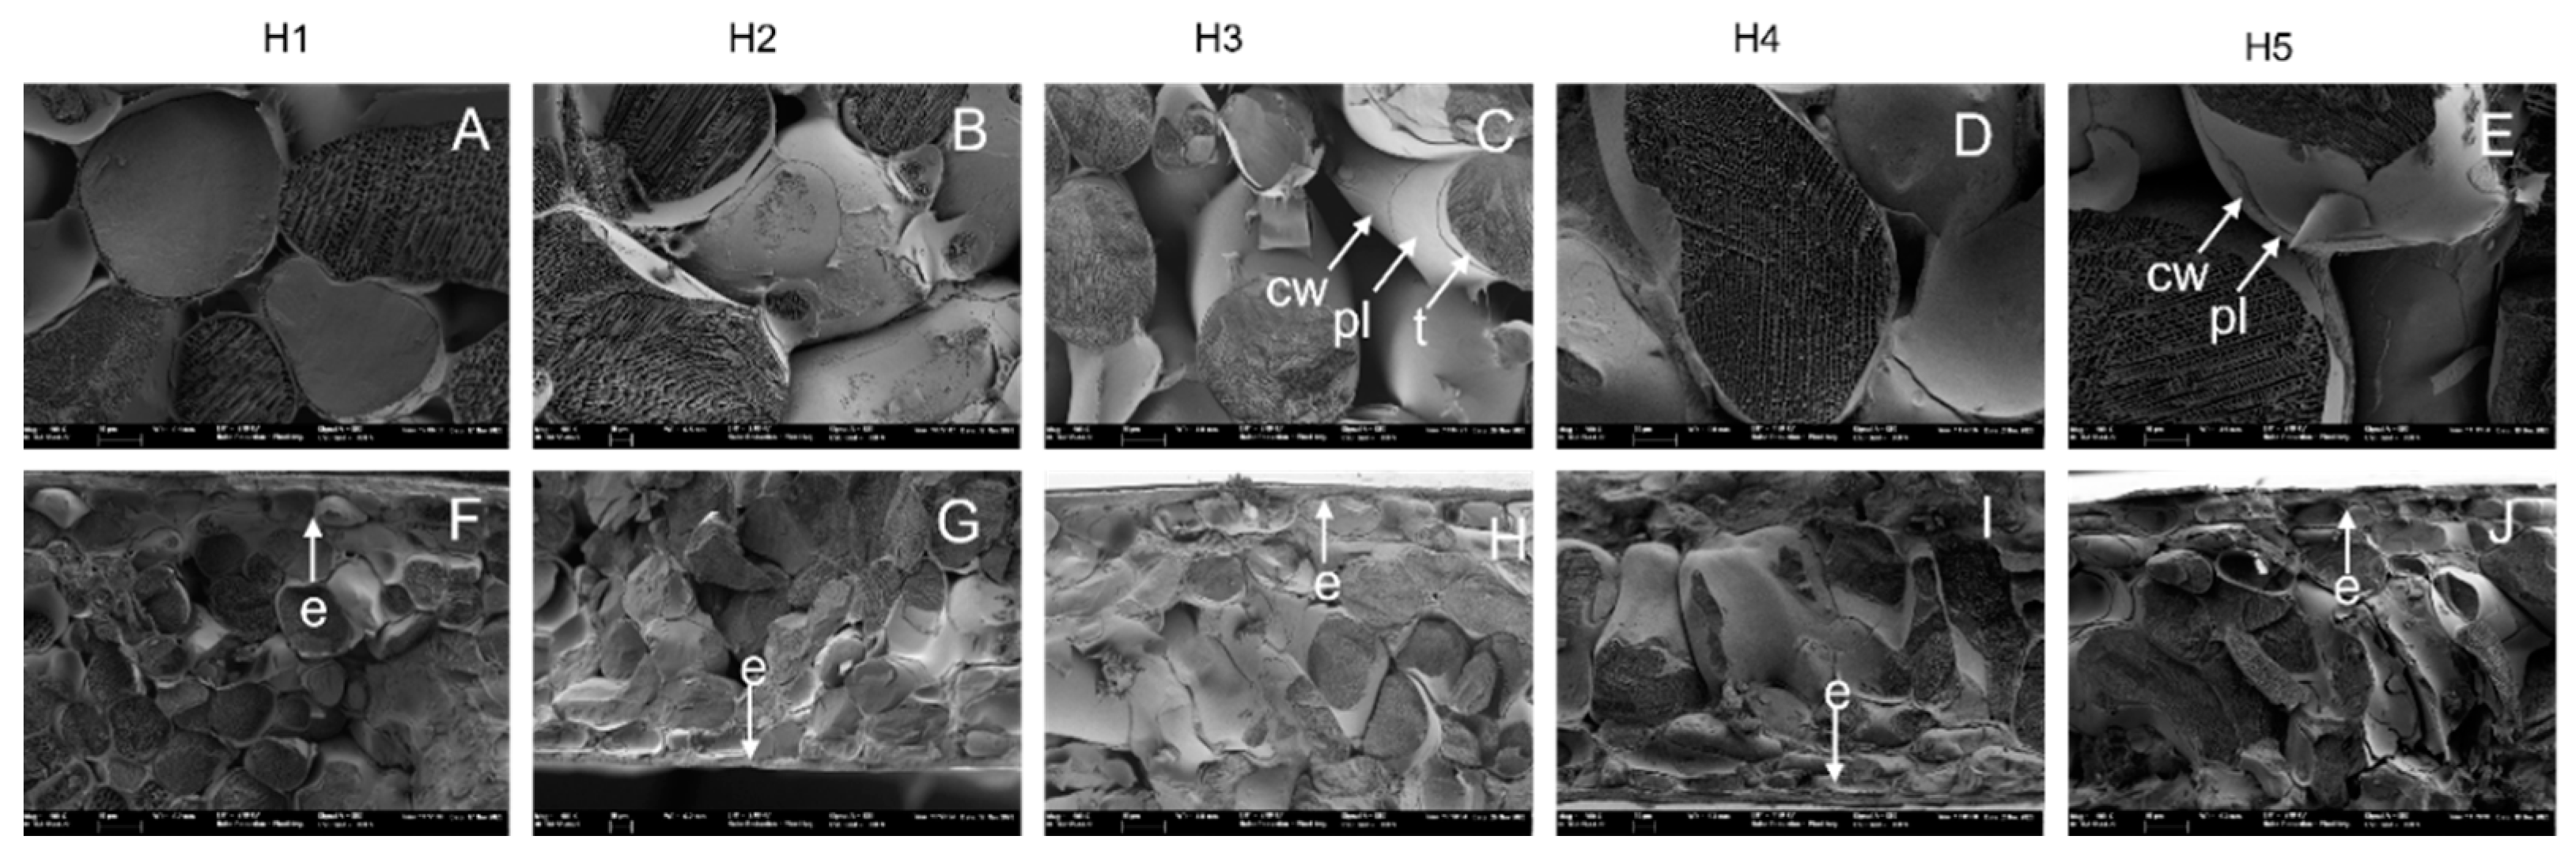
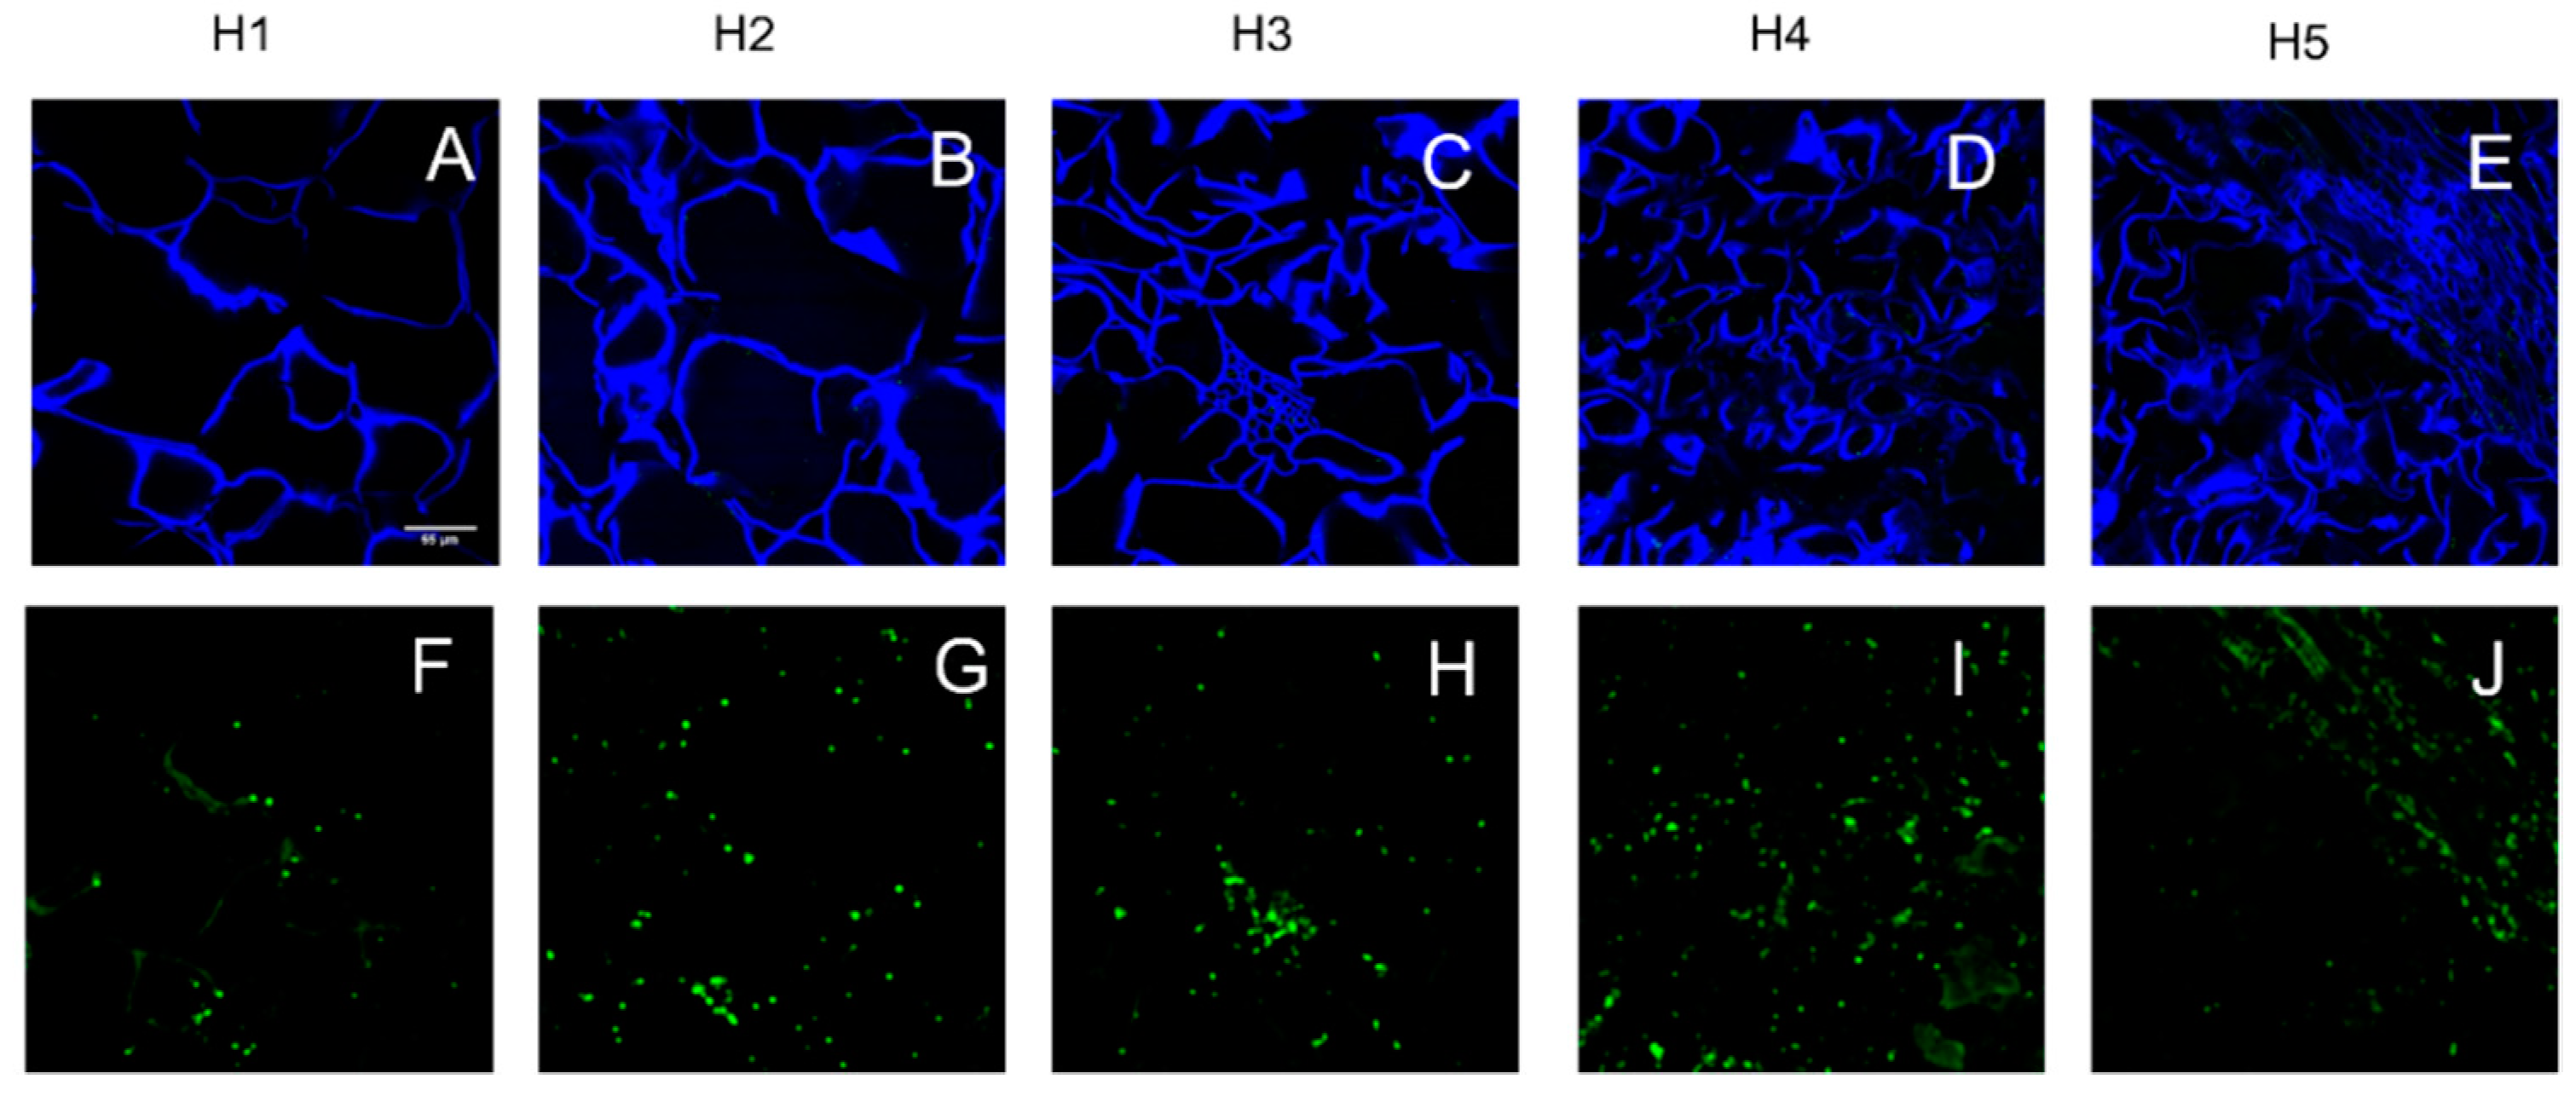
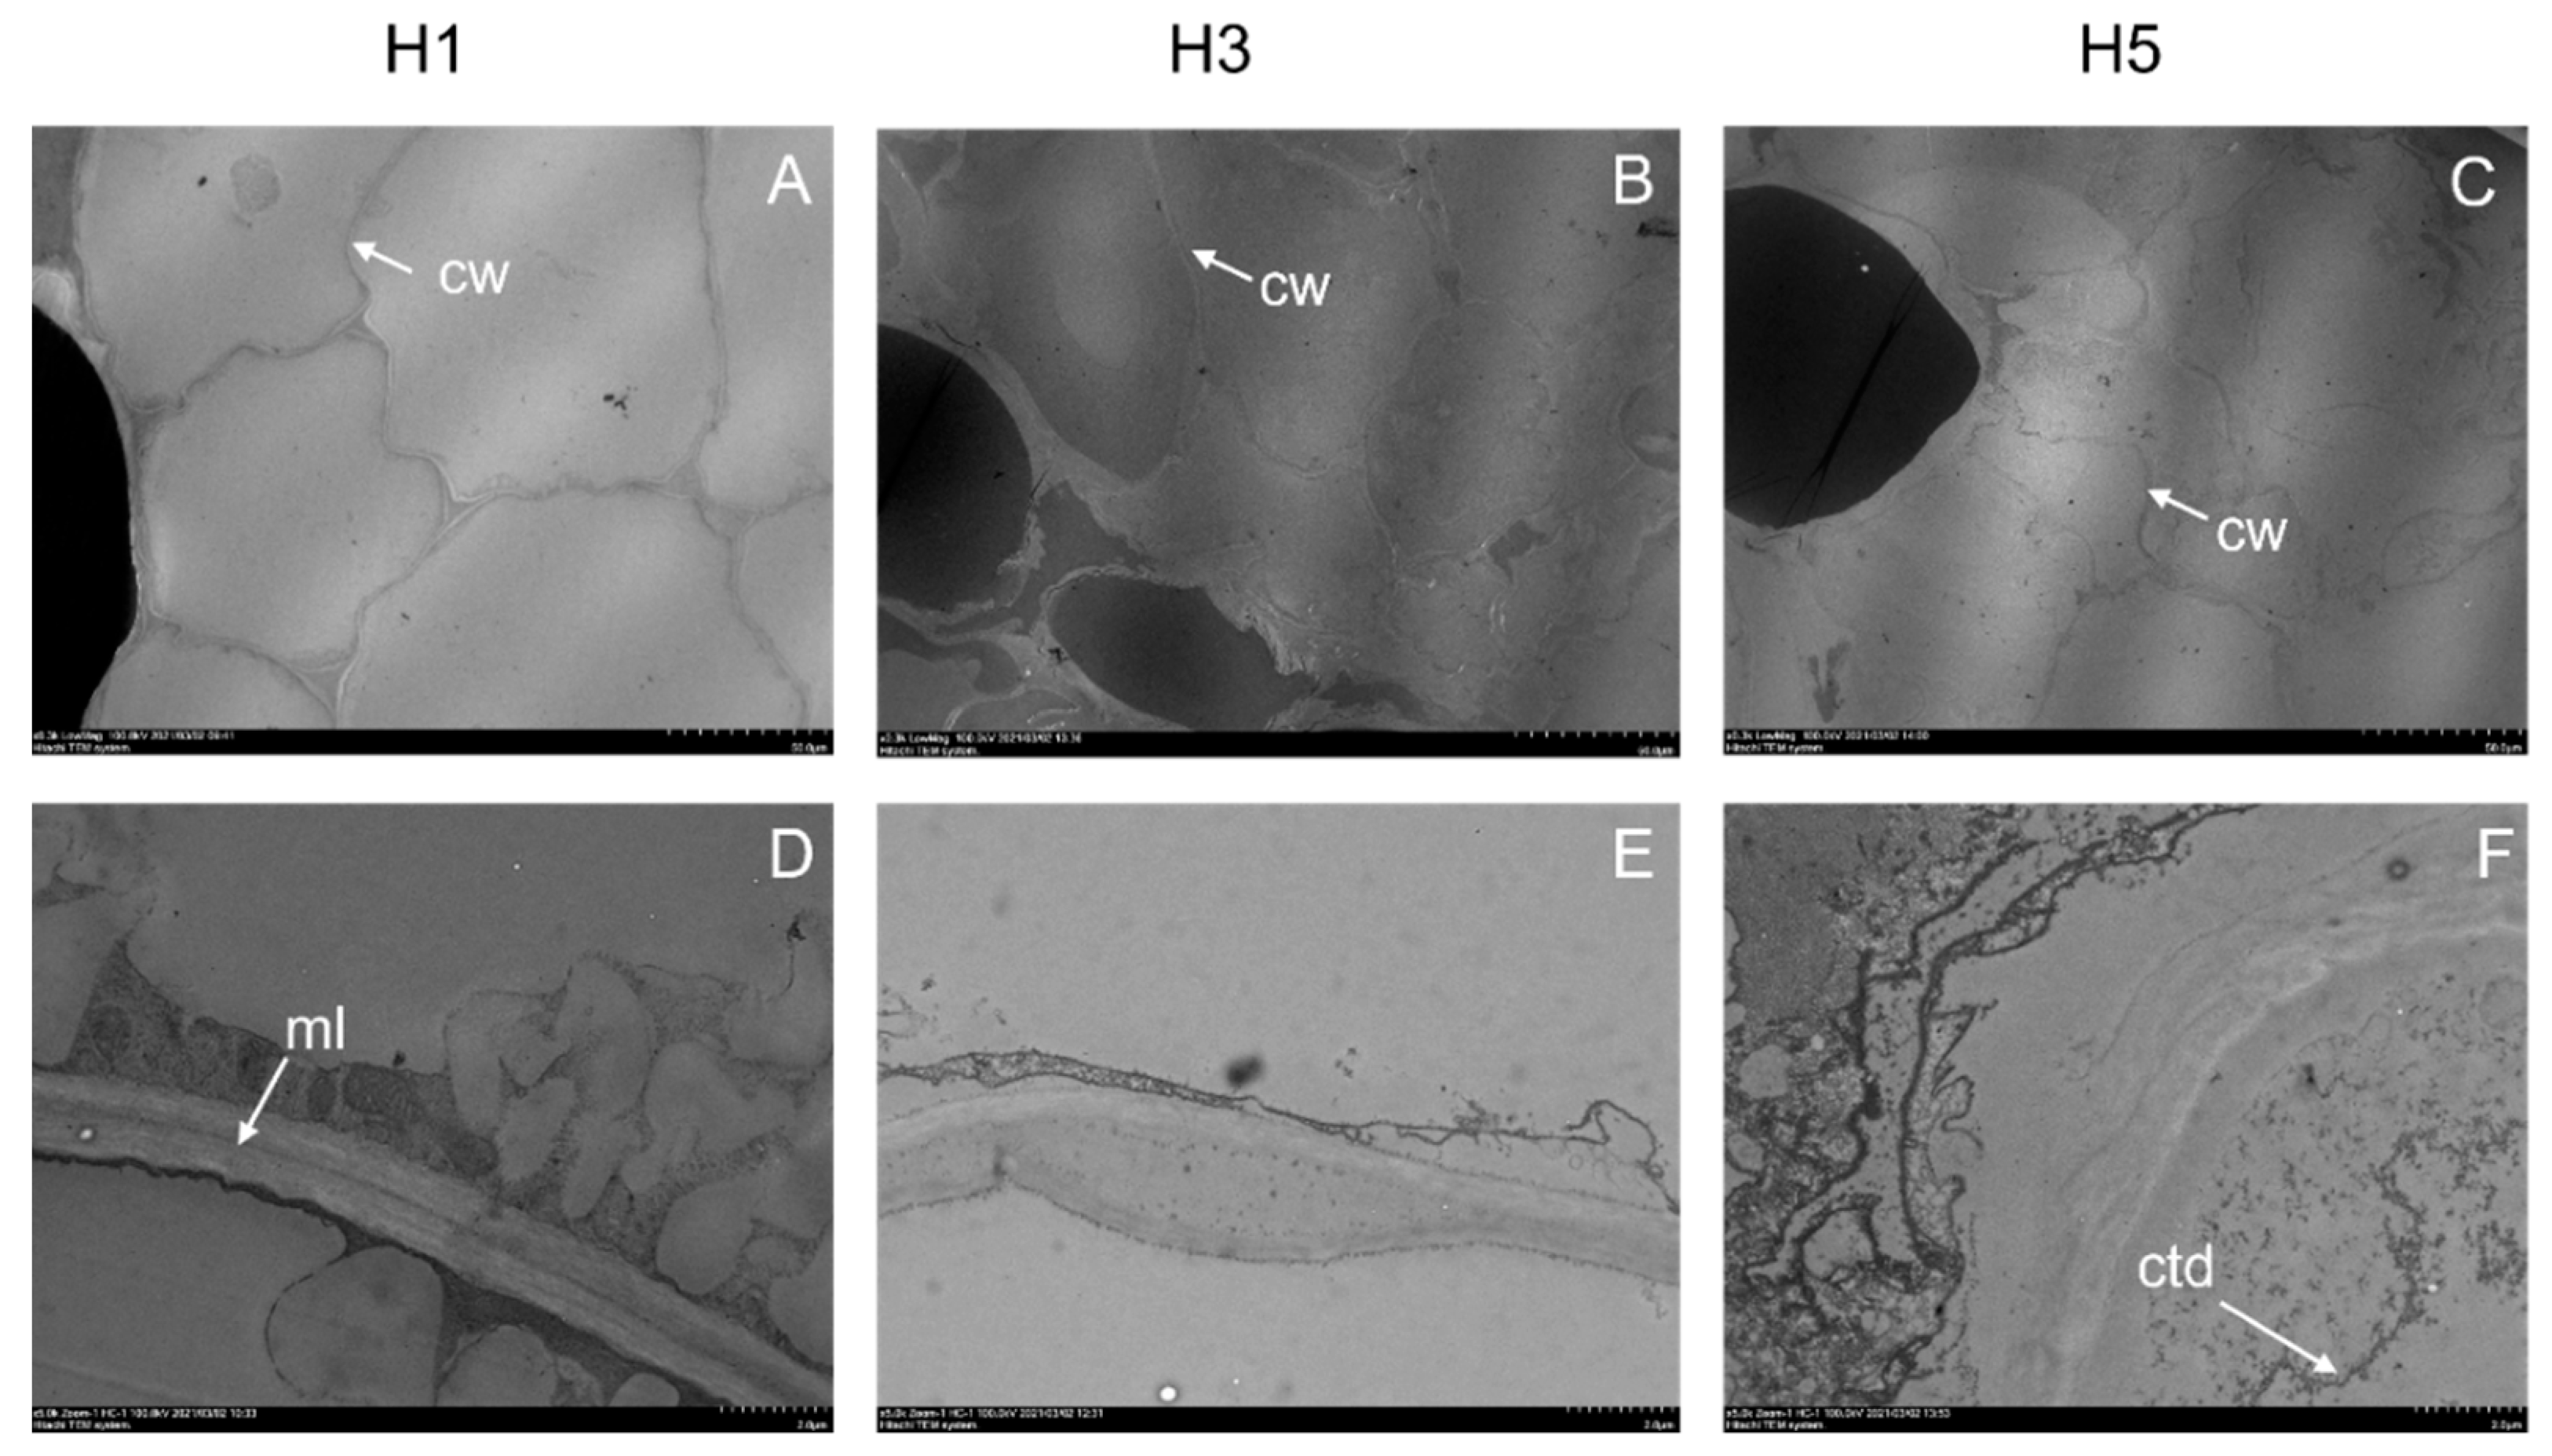
3.2. Parenchyma Structure at Harvest

The Cryo-SEM images depict the persimmon parenchyma microstructure of the samples collected from the different harvest times. The tissue of the persimmon harvested at H1 showed high structural integrity (Figure 4A,F). The parenchyma was compact with swollen cells that were turgid and closely bonded to one another. Inside cells, a large vacuole occupied most of the protoplast (Figure 4A). The vacuole was full of soluble material, which looked like a network. This eutectic artifact was generated during the sublimation process when preparing samples [28]. Some vacuoles are also observed with precipitated solutes, which are insoluble tannins [7]. The parenchyma of the fruit harvested at H2 was similar to that of H1. Only in some areas could very slight cell wall and plasmalemma degradation be observed (Figure 4B,G). Both samples from H1 and H2 had a thick homogeneous epidermis formed by small compact cells (Figure 4F,G).
The tissue of the flesh fruit from H3 (Figure 4C,H) presented some structural changes compared to the fruit samples harvested at H1 and H2, although the parenchyma was still compact. The plasmalemma and cellular wall were slightly degraded with an increased cell–cell separation in some areas, probably because cellular cement dissolution had taken place. (Figure 4C). The microstructural changes in the samples taken at H4 and H5 were more noticeable (Figure 4D,E) and, although the parenchyma was still structured, cells were slightly deformed and membranes seemed more degraded. Neighbor cells were observed further away from one another than in the other samples. Unlike H1 and H2, the tissue of the H3, H4 and H5 samples displayed a slightly homogeneous epidermis that was thin and constituted by large deformed cells (Figure 4H–J).
When flesh samples were observed by CLSM, major differences among them were noted. The CLSM images (Figure 5) displayed cell walls stained in blue by Calcofluor, a specific staining agent for cell walls (Figure 5A–E), and carotenoids were recorded as green (Figure 5F–J) because of their autofluorescence.
In the samples taken at H1 and H2 (Figure 5A,B), cell walls were clearly visible, and cells were relatively spherical and uniformly distributed throughout the parenchyma. In the samples from H3 (Figure 5C), cell walls appeared slightly degraded and tissue was less structured. This degradation was more evident in the samples from H4 and H5 (Figure 5D,E), where cells appeared more disorganized and their shape was more difficult to visualize. Carotenoids were associated mainly with cell walls in all samples. There were more carotenoids and deformed cells as the harvest advanced, which falls in line with Hernández-Carrión et al. [28].
The ultrastructure of samples can be observed in detail by TEM (Figure 6). The parenchyma tissue of the fruit harvested at H1 was structured and composed of numerous cells and intercellular spaces, which were mainly the result of joining three cells (Figure 6A). Neighboring cells were turgid and closely bonded to one another by a well-delimited medium lamella. Cellular walls appeared dense and were formed by closely packed cellulose fibrils. Inside cells, a large vacuole occupied most of the protoplast. Both the plasmalemma and tonoplast remained close to the cellular wall, and an intact cytoplasm was observed near the tonoplast and plasmalemma (Figure 6D).
In the samples from H3 (Figure 6B,E), the cell wall appeared swollen, which indicates the solubilization of cell wall components, and cellular cements were degraded and diluted (Figure 6E). Thus, neighboring cells were separated from one another and intercellular spaces increased. Cell walls were irregularly stained, which is related to fibrillar packaging loss. In some areas, cell walls had broken down, and the plasmalemma and tonoplast began to separate from the cell wall (Figure 6B).
The parenchyma of the H5 persimmons (Figure 6C) revealed major ultrastructure modifications. Cells were deformed, contracted and shrunken, and had collapsed in some areas. Intercellular spaces were wider compared to the other samples. The middle lamella had completely degraded. The plasmalemma was destroyed and was not observed in most tissue areas. The tonoplast was drawn away from the cell wall toward the center of the cell. A misstructured and disintegrated cytoplasm was observed inside cells.

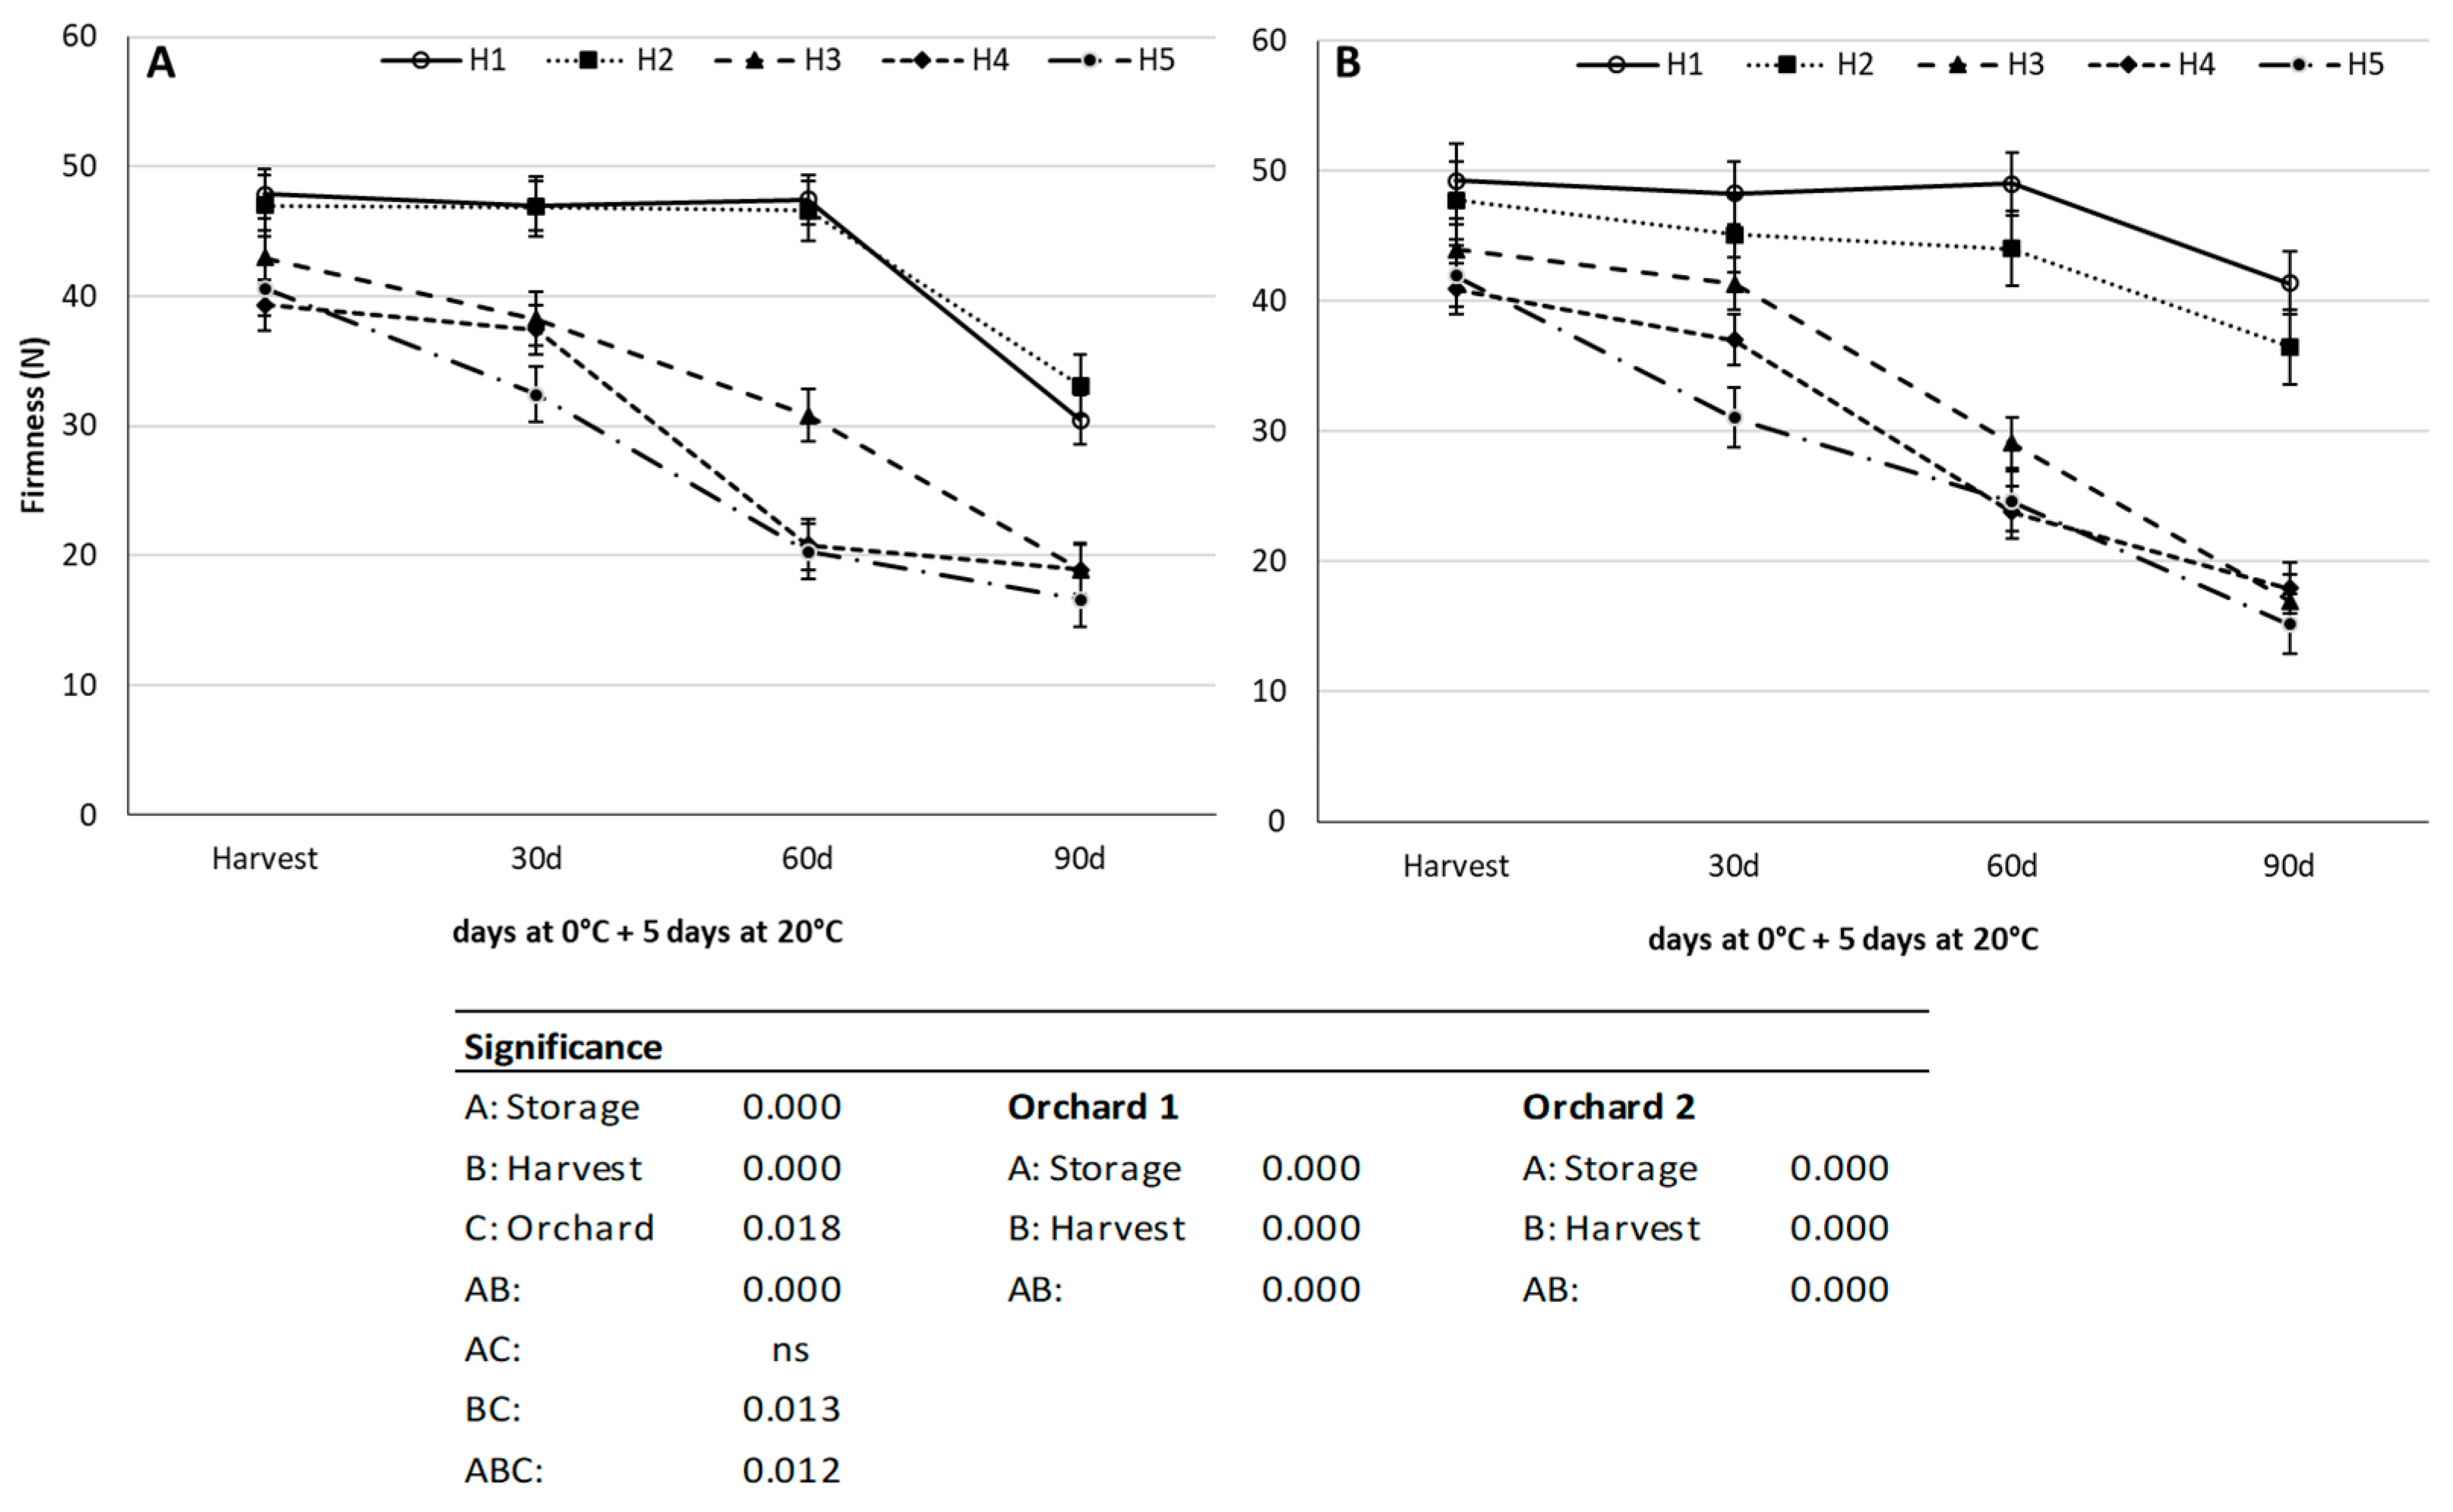
3.3. Firmness Loss during Cold Storage Depending on Harvest Time

‘Rojo Brillante’ persimmon cold storage is a common and necessary practice due to today’s high production and the need to extend the commercial period, especially at the end of the season. Commercially speaking, the fruit intended for conservation are those treated with GA3 at pre-harvest because they can be later harvested with good firmness values. This delays harvest until the middle or the end of the season. Fruit still has good firmness values that can be cold-stored for long periods at 0 °C and are combined with the 1-MCP treatment. However, during these periods, the optimal harvest time to allow the longest cold storage periods is not known. In the present study, the fruit collected at the five harvest times were stored at 0 °C for up to 90 days after being treated with 1-MCP. Despite all the fruit demonstrating high firmness values at harvest, the behavior during cold storage between 48 and 40 N was very different depending on the harvest time.
The fruit from the two orchards displayed a similar pattern for the firmness loss of the fruit harvested at the five evaluated times, but with statistical differences due mainly to the different behavior noted between the fruit from H1 and H2 (Figure 7A,B). In orchard 1, the fruit harvested on November 11 (H1) and November 18 (H2) had the highest firmness values that came close to 48 N, whose firmness remained stable up to 60 days before lowering to 36 N after 90 days. In orchard 2, the H2 fruit values were slightly lower than in the H1 fruit; however, after 90 days, they still presented firmness close to 40 N, which was higher than the values recorded for the orchard 1 fruit.
The fruit from H3, with 43.5 N at harvest, demonstrated a slight decrease in firmness in orchard 1 after 30 cold storage days, while the firmness in orchard 2 remained stable. From that time onward, a gradual firmness loss took place. After 90 days, firmness values were 17 N and 19 N in orchard 1 and orchard 2, respectively. The fruit harvested at H4 and H5 demonstrated similar values at harvest, close to 41.5 N, but exhibited different firmness loss values during cold storage. The firmness of the fruit from both orchards collected on December 2 (H4) slightly decreased after 30 days. From that point onward, it sharply dropped to average values close to 18 N. Faster gradual softening was demonstrated for the fruit harvested on December 9 (H5), with firmness values close to 32 N after storage 30 days, and the lowest values, close to 16 N, were obtained after 90 days, with no differences between the fruit from both orchards.
If we bear in mind the high firmness values obtained for fruit at all the harvests, a priori large differences in their behavior during cold storage were not expected. At all the harvest times, fruit obtained firmness values above 40 N, which are required for cold storage. Nevertheless, firmness loss very much depended on harvest date. The microstructural study performed with the fruit flesh at each harvest time could explain the differences in posterior behavior.
Although some changes were observed by Cryo-SEM in the general parenchyma structure of the fruit harvested during the study period, the fruit’s capacity to maintain good firmness values during prolonged storage was related mainly to the structural integrity of cell walls and membranes, as evidenced by the TEM ultrastructure study. Therefore, the firmness of the fruit with the highest structural integrity and dense fibrils (H1 and H2) remained above 30 N during storage and over a longer conservation period (up to 90 days). Although the parenchyma appeared well structured in the H3 fruit, an onset of degradation and dissolution of cell walls allowed the firmness to remain stable during storage for a shorter time.
The fastest firmness loss in the fruit harvested in H4 and H5 was related to marked ultrastructure modifications, with the degradation of the cell wall, plasmalemma and tonoplast. However, the parenchyma structure was still visible.
The microstructural changes that occurred concomitantly to firmness loss during persimmon maturation have also been reported in our previous studies [7,19,29]. In these studies, evident changes occurred in the parenchyma structure in the fruit with flesh firmness between 80 and 20 N. Nevertheless, the present study compared the fruit with firmness values within a narrow range, between 48 and 40 N. Very few microstructural differences can be expected in these stages. Nevertheless, according to the results, minor differences in fruit firmness at harvest led to a very different behavior under cold storage, which has been related to the microstructural parenchyma state, especially to the integrity of cell walls and membranes.
Of all the other parameters determined at harvest, it was worth noting the peaks of CO2 and ethylene production in the calyx observed at H3 (Figure 3), which seemed to coincide with the onset of cell wall and membrane degradation. In a previous study, the firmness loss occurring during the ripening process of ‘Rojo Brillante’ fruit was correlated with the calyx senescence process by measuring chlorophyll fluorescence (CFI) parameters [15]. This study led to the conclusion that these parameters could act as a potential non-intrusive tool for determining fruit quality at harvest. Accordingly, the results found in the present study reinforce the idea that the state of calyx in persimmon could be an indicator of the flesh structure.

4. Conclusions

Persimmon ‘Rojo Brillante’ treated with gibberellic acid maintained very high firmness values from 11 November to 9 December. During this period, slight firmness loss was observed, while a relevant increase in coloration took place, which led to a weak correlation between both parameters. The fruit firmness loss observed during cold storage very much depended on fruit firmness in each harvest moment. This is the first work to demonstrate that fruit with small differences in firmness at harvest can present major microstructural differences that significantly influence behavior during cold storage. In the fruit harvested with firmness around 48 N (11 or 18 November), these values remained for 60 cold storage days and presented high commercial values, over 30 N, after 90 days. The fruit harvested a week later (25 November) presented lower firmness values than those of earlier fruit after different cold storage periods. The firmness loss of the fruit harvested with around 40 N (on 2 or 9 December) was faster and demonstrated values close to 30 N only after 30 storage days. The different post-harvest behaviors of the fruit harvested during our study period can be explained by the degradation of cell wall, cell membrane and tonoplast, which came with harvest advance. Knowing these changes is essential for defining the optimum harvest time for prolonged conservation, and for guaranteeing a longer commercialization period with high-quality fruit.

Author Contributions

Conceptualization, A.S., M.V., A.Q. and E.L.; methodology, A.S., A.Q. and E.L.; formal analysis, N.Q.V., A.Q., R.G., E.L. and P.F.-S.; investigation, N.Q.V., A.Q., R.G., E.L., P.F.-S., M.V. and A.S.; resources, A.S., A.Q., E.L. and M.V.; data curation, N.Q.V. and R.G.; writing—original draft preparation, N.Q.V. and A.S.; writing—review and editing, N.Q.V. and A.S.; funding acquisition, A.S. All authors have read and agreed to the published version of the manuscript.

Funding

This research was funded by Instituto Nacional de Investigación y Tecnología Agraria y Alimentaria (INIA) and Fondo Europeo de Desarrollo Regional (FEDER), through Project RTA2017-00045-C02.

Institutional Review Board Statement

Not applicable.

Informed Consent Statement

Not applicable.

Data Availability Statement

Not applicable.

Acknowledgments

Nariane Quaresma Vilhena thanks the INIA for grant FPI-INIA (PRE2018-085833).

Conflicts of Interest

The authors declare no conflict of interest.

References

  1. Giordani, E.; Picardi, E.; Radice, S. Morfología y fisiología. In El Cultivo del Caqui; Badenes, M.L., Intrigliolo, D.S., Salvador, A., Vicent, A., Eds.; Generalitat Valenciana: Valencia, Spain, 2015; pp. 17–33. [Google Scholar]
  2. IndexBox. Global Persimmon Market Overview. 2020. Available online: App.indexbox.io. (accessed on 27 October 2021).
  3. Novillo, P.; Gil, R.; Besada, C.; Salvador, A. Astringency removal of “Rojo brillante” persimmon by combining CO2 and ethanol application. Acta Hortic. 2015, 1079, 599–604. [Google Scholar] [CrossRef]
  4. Besada, C.; Arnal, L.; Salvador, A. Improving storability of persimmon cv. Rojo brillante by combined use of preharvest and postharvest treatments. Postharvest. Biol. Technol. 2008, 50, 169–175. [Google Scholar]
  5. Salvador, A.; Cuquerella, J.; Martínez-Jávega, J.M.; Monterde, A.; Navarro, P. 1-MCP preserves the firmness of stored persimmon “Rojo brillante”. J. Food Sci. 2004, 69, 69–73. [Google Scholar] [CrossRef]
  6. Salvador, A.; Arnal, L.; Monterde, A.; Martínez-Jávega, J.M. Influence of ripening stage at harvest on chilling injury symptoms of persimmon cv. Rojo Brillante stored at different temperatures. Food Sci. Technol. Int. 2005, 11, 359–365. [Google Scholar] [CrossRef]
  7. Salvador, A.; Arnal, L.; Besada, C.; Larrea, V.; Quiles, A.; Pérez-Munuera, I. Physiological and structural changes during ripening and deastringency treatment of persimmon fruit cv. “Rojo brillante”. Postharvest. Biol. Technol. 2007, 46, 181–188. [Google Scholar] [CrossRef]
  8. Testoni, A. Post-harvest and processing of persimmon fruit Testoni. In CIHEAM—Options Méditerranéennes; CIHEAM: Zaragoza, Spain, 2002. [Google Scholar]
  9. Agustí, M.; Juan, M.; Martínez-Fuentes, A.; Mesejo, C.; Almela, V. Calcium nitrate delays climacteric of persimmon fruit. Ann. Appl. Biol. 2004, 144, 65–69. [Google Scholar] [CrossRef]
  10. Arnal, L.; Del Río, M.A. Effect of cold storage and removal astringency on quality of persimmon fruit (Diospyros kaki L.) cv. Rojo brillante. Food Sci. Technol. Int. 2004, 10, 179–185. [Google Scholar] [CrossRef]
  11. Pérez-Munuera, I.; Hernando, I.; Larrea, V.; Besada, C.; Arnal, L.; Salvador, A. Microstructural study of chilling injury alleviation by 1-methylcyclopropene in persimmon. HortScience 2009, 44, 742–745. [Google Scholar] [CrossRef] [Green Version]
  12. Jiménez-Cuesta, J.; Cuquerella, Y.J.M.J. Definition of a color index for citrus fruit degreening. Proc. Int. Soc. Citric. 1981, 2, 773–778. [Google Scholar]
  13. Taira, S.; Ono, M. Reduction of astringency in persimmon caused by adhesion of tannins to cell wall fragments. In I International Persimmon Symposium 436; ISHS: Chang Mai City, Thailand, 1996; pp. 235–242. [Google Scholar]
  14. Sugiura, A.; Kataoka, I.; Tomana, T. Use of refractometer to determine soluble solids of astringent fruits of Japanese persimmon (Diospyros kaki L.). J. Hortic. Sci. 1983, 58, 241–246. [Google Scholar] [CrossRef]
  15. Fathi-Najafabadi, A.; Besada, C.; Gil, R.; Calatayud, M.A.; Salvador, A. Chlorophyll fluorescence imaging as a tool to evaluate calyx senescence during the ripening of persimmon fruit treated with gibberellic acid. Postharvest. Biol. Technol. 2021, 179, 111582. [Google Scholar] [CrossRef]
  16. Besada, C.; Salvador, A. Postharvest biology and technology of persimmon. In Postharvest Biology and Technology of Temperate Fruits; Mir, S.A., Shah, M.A., Mir, M.M., Eds.; Springer: Cham, Switzerland, 2018; pp. 1–415. [Google Scholar]
  17. Besada, C.; Gil, R.; Fathi, A.; Navarro, P. Efecto de la temperatura de transporte en la calidad del caqui. Levante Agric. 2017, 3, 277–279. [Google Scholar]
  18. Salvador, A.; Arnal, L.; Carot, J.M.; Carvalho, C.P.; Jabaloyes, J.M. Influence of different factors on firmness and color evolution during the storage of persimmon cv. “Rojo brillante”. J. Food Sci. 2006, 71, S169–S175. [Google Scholar] [CrossRef]
  19. Tessmer, M.A.; Besada, C.; Hernando, I.; Appezzato-da-Glória, B.; Quiles, A.; Salvador, A. Microstructural changes while persimmon fruits mature and ripen. Comparison between astringent and non-astringent cultivars. Postharvest. Biol. Technol. 2016, 120, 52–60. [Google Scholar] [CrossRef]
  20. Zhang, J.; Lu, J.; Mantri, N.; Jiang, L.; Ying, S.; Chen, S.; Feng, X.; Cao, Y.; Chen, Z.; Ren, L.; et al. An effective combination storage technology to prolong storability, preserve high nutrients and antioxidant ability of astringent persimmon. Sci. Hortic. 2018, 241, 304–312. [Google Scholar] [CrossRef]
  21. Martínez-Las Heras, R.; Amigo-Sánchez, J.C.; Heredia, A.; Castelló, M.L.; Andrés, A. Influence of preharvest treatments to reduce the seasonality of persimmon production on color, texture and antioxidant properties during storage. CYTA-J. Food. 2016, 14, 333–339. [Google Scholar] [CrossRef]
  22. Novillo, P.; Salvador, A.; Crisosto, C.; Besada, C. Influence of persimmon astringency type on physico-chemical changes from the green stage to commercial harvest. Sci. Hortic. 2016, 206, 7–14. [Google Scholar] [CrossRef]
  23. Conesa, C.; Laguarda-Miró, N.; Fito, P.; Seguí, L. Evaluation of Persimmon (Diospyros kaki Thunb. cv. Rojo brillante) industrial residue as a source for value added products. Waste Biomass Valorization 2020, 11, 3749–3760. [Google Scholar] [CrossRef]
  24. Del Bubba, M.; Giordani, E.; Pippucci, L.; Cincinelli, A.; Checchini, L.; Galvan, P. Changes in tannins, ascorbic acid and sugar content in astringent persimmons during on-tree growth and ripening and in response to different postharvest treatments. J. Food Compos. Anal. 2009, 22, 668–677. [Google Scholar] [CrossRef]
  25. Woolf, A.B.; Ben-Arie, R. Persimmon (Diospyros kaki L.). In Postharvest Biology and Technology of Tropical and Subtropical Fruits; Yahia, E.M., Ed.; Woodhead Publishing Limited: Sawston, Cambridge, UK, 2011; Volume 4, pp. 166–194. [Google Scholar]
  26. Kitagawa, H.; Glucina, P. Persimmon culture in New Zealand. In DSIR Information Series 159; Science Information Publishing Centre: Wellington, New Zealand, 1984; p. 74. [Google Scholar]
  27. Besada, C.; Gil, R.; Bonet, L.; Quiñones, A.; Intrigliolo, D.; Salvador, A. Chloride stress triggers maturation and negatively affects the postharvest quality of persimmon fruit. Involvement of calyx ethylene production. Plant Physiol. Biochem. 2016, 100, 105–112. [Google Scholar] [CrossRef]
  28. Hernández-Carrión, M.; Vázquez-Gutiérrez, J.L.; Hernando, I.; Quiles, A. Impact of high hydrostatic pressure and pasteurization on the structure and the extractability of bioactive compounds of persimmon “Rojo brillante”. J. Food Sci. 2014, 79, C32–C38. [Google Scholar] [CrossRef] [PubMed] [Green Version]
  29. Vázquez-Gutiérrez, J.L.; Quiles, A.; Hernando, I.; Pérez-Munuera, I. Changes in the microstructure and location of some bioactive compounds in persimmons treated by high hydrostatic pressure. Postharvest Biol. Technol. 2011, 61, 137–144. [Google Scholar] [CrossRef]
Figure 1. Changes in the physico-chemical parameters of ‘Rojo Brillante’ persimmon fruit at the different harvest times. H: Harvest; H1: 11 November; H2: 18 November; H3: 25 November; H4: 2 December; H5: 9 December. Vertical bars represent the least significant differences (LSD) intervals (p ≤ 0.05). The table of significance shows the results of a full analysis of variance (ANOVA). No significant (“ns”) or the actual p-value whenever significant.
Horticulturae 08 00140 g001
Figure 2. Persimmon calyx aspect at the different harvest times. H: Harvest; H1: 11 November; H2: 18 November; H3: 25 November; H4: 2 December; H5: 9 December.
Horticulturae 08 00140 g002
Figure 3. Changes in the calyx CO2 and calyx ethylene productions of ‘Rojo Brillante’ persimmon fruit at the different harvest times. H: Harvest; H1: 11 November; H2: 18 November; H3: 25 November; H4: 2 December; H5: 9 December. Vertical bars represent the least significant differences (LSD) intervals (p ≤ 0.05). The table of significance shows the results of a full analysis of variance (ANOVA). No significant (“ns”) or the actual p-value whenever significant.
Horticulturae 08 00140 g003
Figure 4. Persimmon images at the different harvest times obtained by cryo-scanning electron microscopy (Cryo-SEM). H: Harvest; H1: 11 November; H2: 18 November; H3: 25 November; H4: 2 December; H5: 9 December. e: epidermis; cw: cell wall; pl: plasmalemma; t: tonoplast. (AE): Details of the innermost area of the flesh; (FJ): flesh area closest to the fruit epidermis. Magnification 500×.
Horticulturae 08 00140 g004
Figure 5. Persimmon images at the different harvest times obtained by confocal laser scanning microscopy. H: Harvest; H1: 11 November; H2: 18 November; H3: 25 November; H4: 2 December; H5: 9 December. Calcofluor-stained cell walls in blue (AE). Carotenoids are autofluorescens observed in green (FJ). Magnification 40×.
Horticulturae 08 00140 g005
Figure 6. Persimmon images at the different harvest times obtained by transmission electron microscopy (TEM). H: Harvest; H1: 11 November; H3: 25 November; H5: 9 December. cw: cell wall; ml: middle lamella; ctd: degraded cytoplasm. (AC): Magnification 0.3 kx; (DF): Magnification: 5 kx.
Horticulturae 08 00140 g006
Figure 7. Changes in flesh firmness of the ‘Rojo Brillante’ persimmons from two orchards (orchard 1 (A) and orchard 2 (B)) and harvested at five different harvest times (H) during 30-, 60- and 90-day storage periods at 0 °C, plus a subsequent shelf-life period of 5 days at 20 °C. H1: 11 November; H2: 18 November; H3: 25 November; H4: 2 December; H5: 9 December. Vertical bars represent the least significant differences (LSD) intervals (p ≤ 0.05). The table of significance shows the results of the full analysis of variance (ANOVA) for the full data and for orchards 1 and 2. No significant (“ns”) or the actual p-value whenever significant.
Horticulturae 08 00140 g007
Publisher’s Note: MDPI stays neutral with regard to jurisdictional claims in published maps and institutional affiliations.

