Article

“60 Years on”—Effects of Climatic Change on Tree Phenology—A Case Study Using Pome Fruit

1
CKA Klein-Altendorf, University of Bonn, Campus Klein-Altendorf 1, D-53359 Rheinbach, Germany
2
INRES—Horticultural Science, University of Bonn, Auf dem Hügel 6, D-53121 Bonn, Germany
*
Author to whom correspondence should be addressed.
Horticulturae 2022, 8(2), 110; https://doi.org/10.3390/horticulturae8020110
Submission received: 29 December 2021 / Revised: 19 January 2022 / Accepted: 22 January 2022 / Published: 26 January 2022
(This article belongs to the Special Issue Enhancing Fruit Crops Resilience and Productivity to Climate Change)

Abstract

:
Phenological records of apple and pear trees, including flowering, harvest and leaf drop, and concomitant weather records at Klein-Altendorf (50° N) near Bonn, Germany were correlated using two approaches: (a) linear curve fitting and (b) comparison of mean values of the first 30 years (1956–1988) versus the recent 30 years of climate change (1989–2017). The annual air temperature increased by 1.7 °C from 8.6 °C in 1958 to 10.3 °C in 2017 over the last 60 years and similarly in the vegetation period (1 April–30 October) from 13.7 °C in 1958 to 15.2 °C in 2017 by 1.5 °C. The combination of stronger increase in winter temperatures (by +1.2 °C) than in the summer (air +1.0 °C) with advanced bud break and −0.3 °C lower minimum temperatures in April during flowering resulted a continued risk of a late frost, as experienced in 2017. The strongest climate change effect, i.e., 11–14 days advanced flowering (in apple and pear) highly correlated (R2 −0.7) with the March/April temperature. Fruit ontogeny was 4 days shorter in cv. ‘Lucas’ pear, but 5 days longer in cv. ‘Cox’ and 10 days longer in cv. ‘Boskoop’, but remained unchanged in cv. ‘Golden Delicious’, irrespective of early or late ripening variety and contradictory climate effects, fruit matured 4–12 days earlier indicating its sole dependency on variety. Climate data and (earlier) harvest date closely correlated (R2: 0.6–0.7). The lowest correlation was between canopy duration (bloom to leaf fall), which was consistently extended by 6–10 days and the leaf drop stage beginning 2–4 days earlier. The correlations indicated that the Meckenheim fruit growing region is strongly affected by climate change and the comparison between two equally-balanced 30-year phases gave more realistic results than linear curve fitting.

1. Introduction

For the interpretation of climate change effects on fruit crops, long-term data sets are required but are also scarce [1,2]. For an unbiased interpretation, this contribution represents the ideal scientific situation with 30 years before and 30 years during climate change to achieve equal weighing of both periods. To our knowledge, the data presented here are the oldest/longest historic combined data sets of complete pome fruit phenology (flowering, frost and harvest leaf fall) and weather data at the same site, without change of variety or record site, followed by Angers (Britany, since 1963) and Forli (near Bologna, since 1970) (Legave et al., 2013 [3]), although single apple (Malus domestica Borkh.) flowering data have existed since 1760 (Chmielewski et al., 2004 [4]). Our location is representative of the 50–51° N pome fruit growing belt across Europe from southern England (Somerset and Kent), northern France (Brittany), Belgium, the Netherlands, parts of Germany (Jork/Altes Land, Niederrhein, Meckenheim and Saxony) and Poland (Kaufmann and Blanke, 2017 [1]).
The objective of the present work was to use this rich source of information to elaborate the effects of recent climate change using a unique combination of 60 years of phenological and meteorological data acquisition at the same location to quantify any effect on phenology viz flower advancement, fruit maturity and canopy duration, harvest viz fruit maturation and leaf drop in apple and pear using four varieties and four generations of fruit trees.

2. Materials and Methods

2.1. Orchard Location and Climate

Phenological data of pome fruit trees were recorded over 60 years from 1956–2017 at Klein-Altendorf Campus (50.5° N) of the University of Bonn, Germany in the foothills of the Eifel. The University Campus is located within one of the large fruit growing regions of Germany and representative of the 50–51° N pome fruit growing belt across Europe from southern England (Somerset and Kent), northern France (Brittany), Belgium, Netherland, parts of Germany (Jork/Altes Land, Niederrhein, Meckenheim and Saxony) and Poland. The temperate climate is dominated by Westerly Atlantic weather buffered by the mild Rhine river influence. The annual mean temperature is 9.5 °C with ca. 600 mm rainfall. The soil is a fertile luvisol on loess [1,2].

2.2. Choice of Fruit Trees

Phenological data were recorded over the 60 year period of apple trees cv. ‘Golden Delicious’, ‘Red Boskoop’ and ‘Cox‘s Orange Pippin’ on M 9 rootstock and pear cv. ‘A. Lucas’ on Quince A rootstock. Fruit trees were selected using 4 generations of fruit-bearing trees of these cultivars at least 4 years after planting. Trees were employed without alternate bearing, which is designated as the change between bearing and non-bearing years.

2.3. Phenological Records

Phenological records were first manually by hand and later by an automated weather station. They included dates for the beginning of flowering (BBCH 61, Fleckinger F, 930DD), full bloom (BBCH 65, Fleckinger F2, 1040DD) and end of flowering (BBCH 67, Fleckinger stage G or US 1170), begin of fruit harvest (BBCH 81), beginning (BBCH 93) and end (BBCH 97) (Meier et al., 1994 [5]) of leaf drop and canopy duration, defined as the start of flowering to the beginning of leaf drop.

2.4. Sourcing of Weather Data and Increase in Average Annual and Monthly Temp Veg Period

The concomitant weather records at Klein-Altendorf Campus included minimum, maximum and average air temperature in 2 m height according to international standards and precipitation over the same 60-year period. Heat days, defined as days with max temp >30 °C, were extracted and plotted for the figures. Precipitation was measured in 1 m height in the rain gauge after Professor Hellmann (and later by an automated electronic rain gauge) and days of heavy rain, defined incidences with >20 L/m2 rain per day; such an event led to the catastrophic Ahr valley flooding on 14–15 July 2021 only a few miles from Klein-Altendorf. Phenological records and weather data were correlated using two approaches: (a) linear curve fitting in Excel as a conservative approach and (b) comparison of mean values of the first 30 versus the recent 30 years.

3. Results

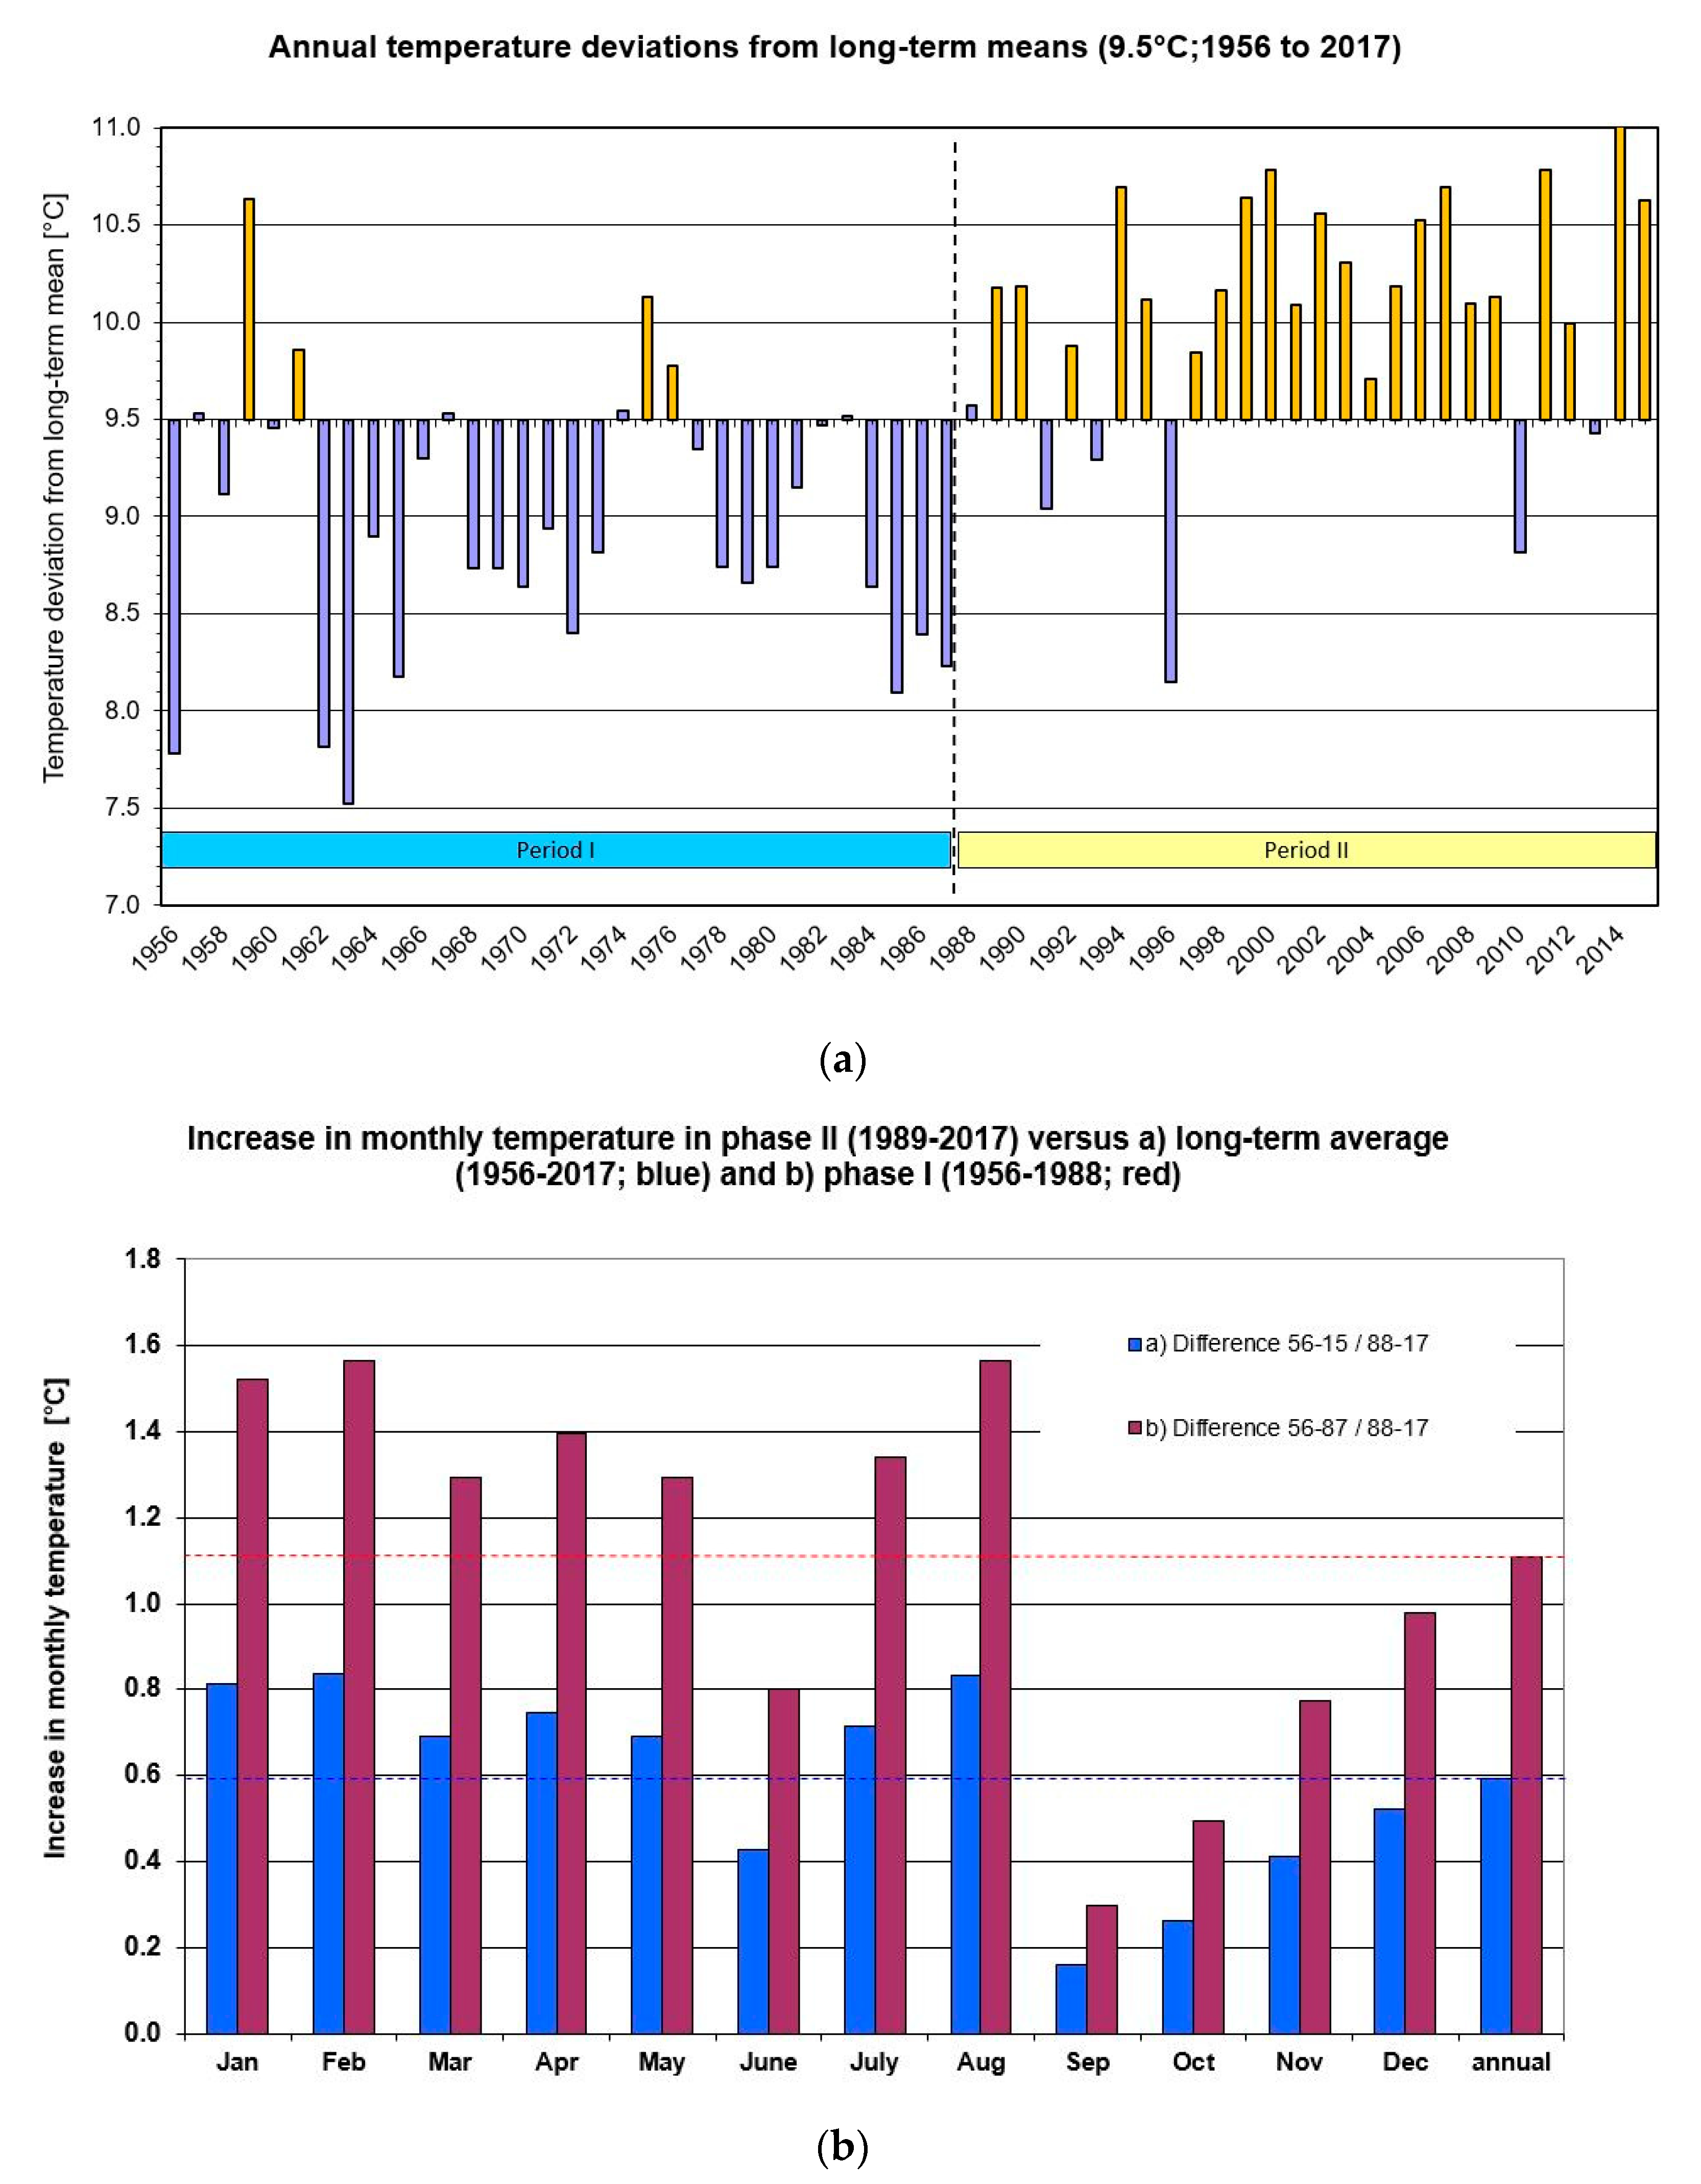
3.1. Increase in Average Annual and Monthly Temp Veg Period

Over the 60 years, the annual average of the air temperature at Klein-Altendorf Campus increased from 8.6 °C in 1956 to 10.3 °C in 2017, using endpoints from linear curve fitting (result not shown). This is equivalent to an increase in air temperature of 1.7 °C over the last long term, 60 years observations and yearly averages. In the vegetation period (1 April–31 October in the Northern Hemisphere), the average annual temperature increased similarly from 13.7 °C in 1956 to 15.2 °C in 2017, i.e., by 1.5 °C. For the majority of arable and perennial, woody crops, the vegetation period is the relevant growth period, which enables or disables crops to be successfully grown.
The arithmetical mean over 60 years (1956–2017) resulted in an annual temperature of 9.5 °C; this is used as a baseline in Figure 1 with annual differences from this long-term value. In ca. 69% (22 of 32 years) of the first 30 years, the annual temperature was considerably (>0.5 °C) below (i.e., cooler) the long-term, 60-year average (Figure 1a).
From the beginning of climate change, which was from 1988 onwards, 82% (23 of 30 years) of these annual temperatures were warmer than the long-term, 60-year temperature average of 9.5 °C (except for 1991, 1993, 1996 and 2010) (Figure 1a).
This finding was used to propose the second approach in this paper, i.e., distinguish a phase I (32 years before climate change, 1956–1987) and phase II (1988–2017) with a transition period between 1987–1989. These two phases are subsequently used throughout this manuscript to describe and compare potential weather impacts of global climate change.
An overall comparison between phase II (1988–2017) versus phase I (1956–1987) revealed a stronger increase in the winter (November to April) air temperature by 1.2 °C relative to the lesser increase in the vegetation period (May to October) of 1.0 °C with an intermediate overall annual increase of +1.1 °C (Table 1).
A comparison between phase I (before climate change, 1956–1987) with phase II (1988–2017) showed the largest monthly temperature increases in the 8 months from January to August (except June) (Figure 1b). The three largest temperature increases were in January, February and August with nearly +1.6 °C each, followed by March, April, May and July with 1.3–1.4 °C; smaller temperature rises were observed in the autumn and winter months from September–November (Figure 1b).

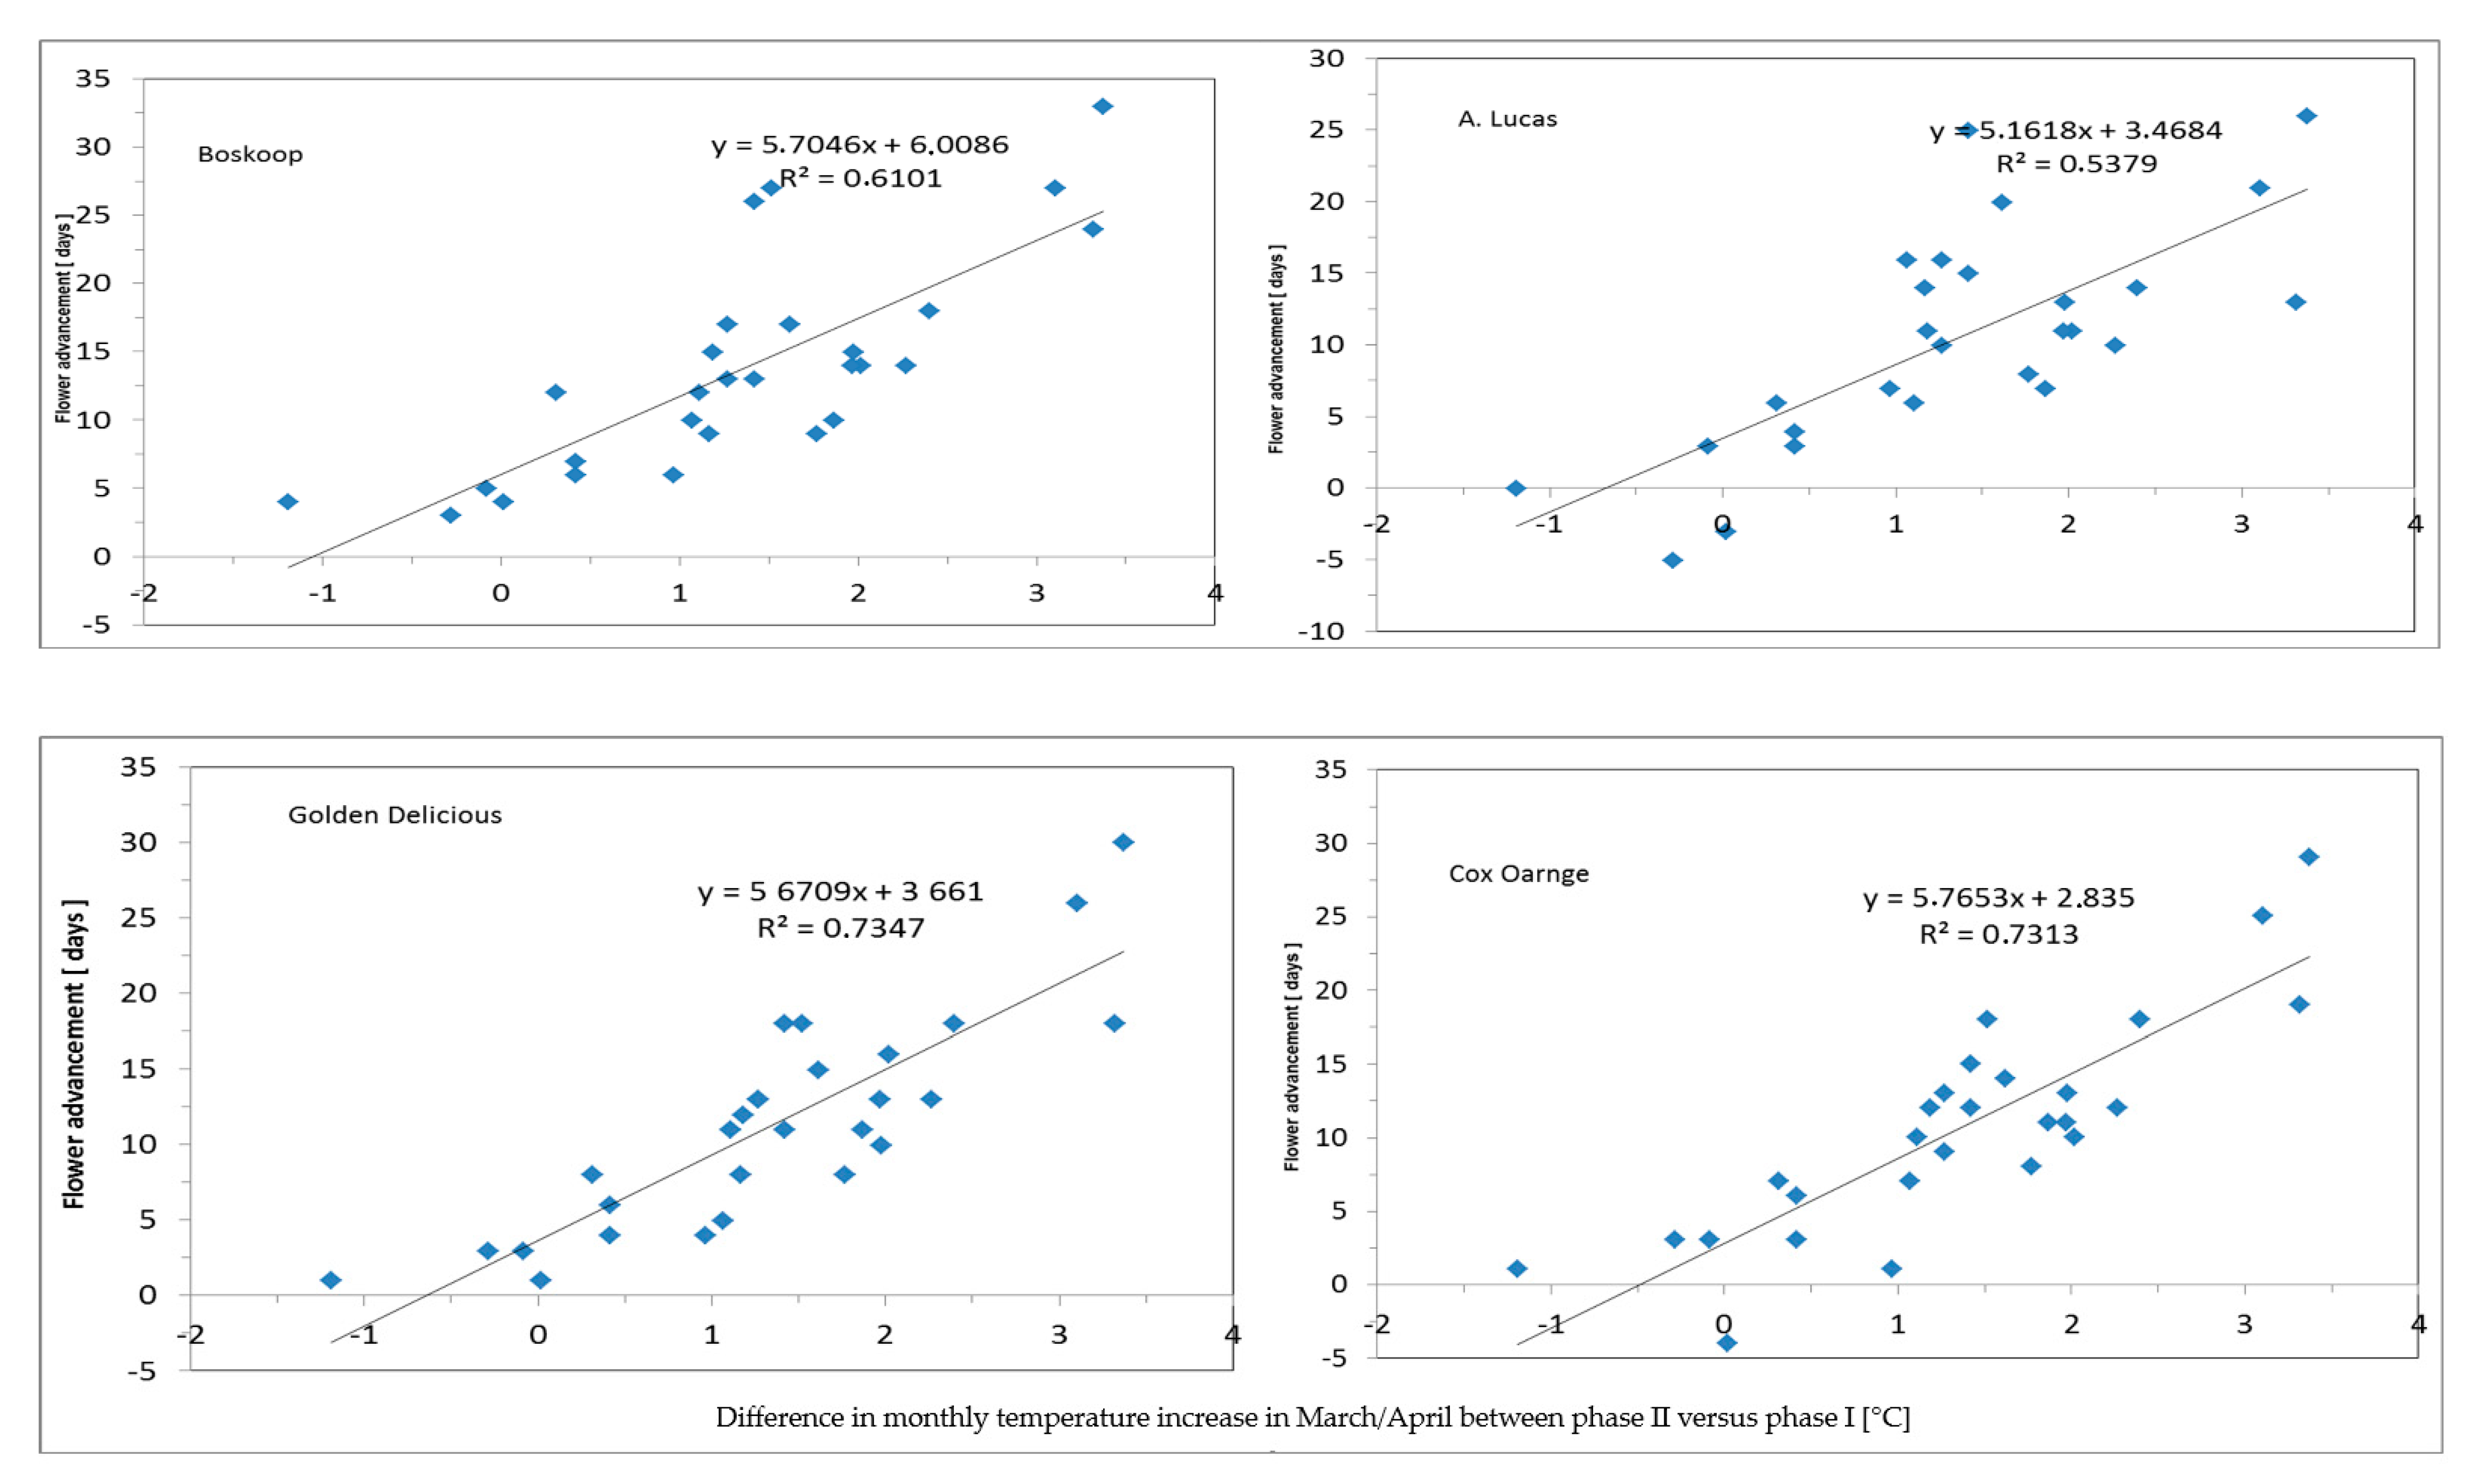
3.2. Correlation between Phenology and Climate Change—Flowering Advancement versus Monthly Spring Temperature (1956–2017)

The strongest climate change effect of these 60 years records, i.e., 11–14 days advanced flowering (in apple and pear) closely correlated (R2-0.7) with March/April temperature (Figure 2).

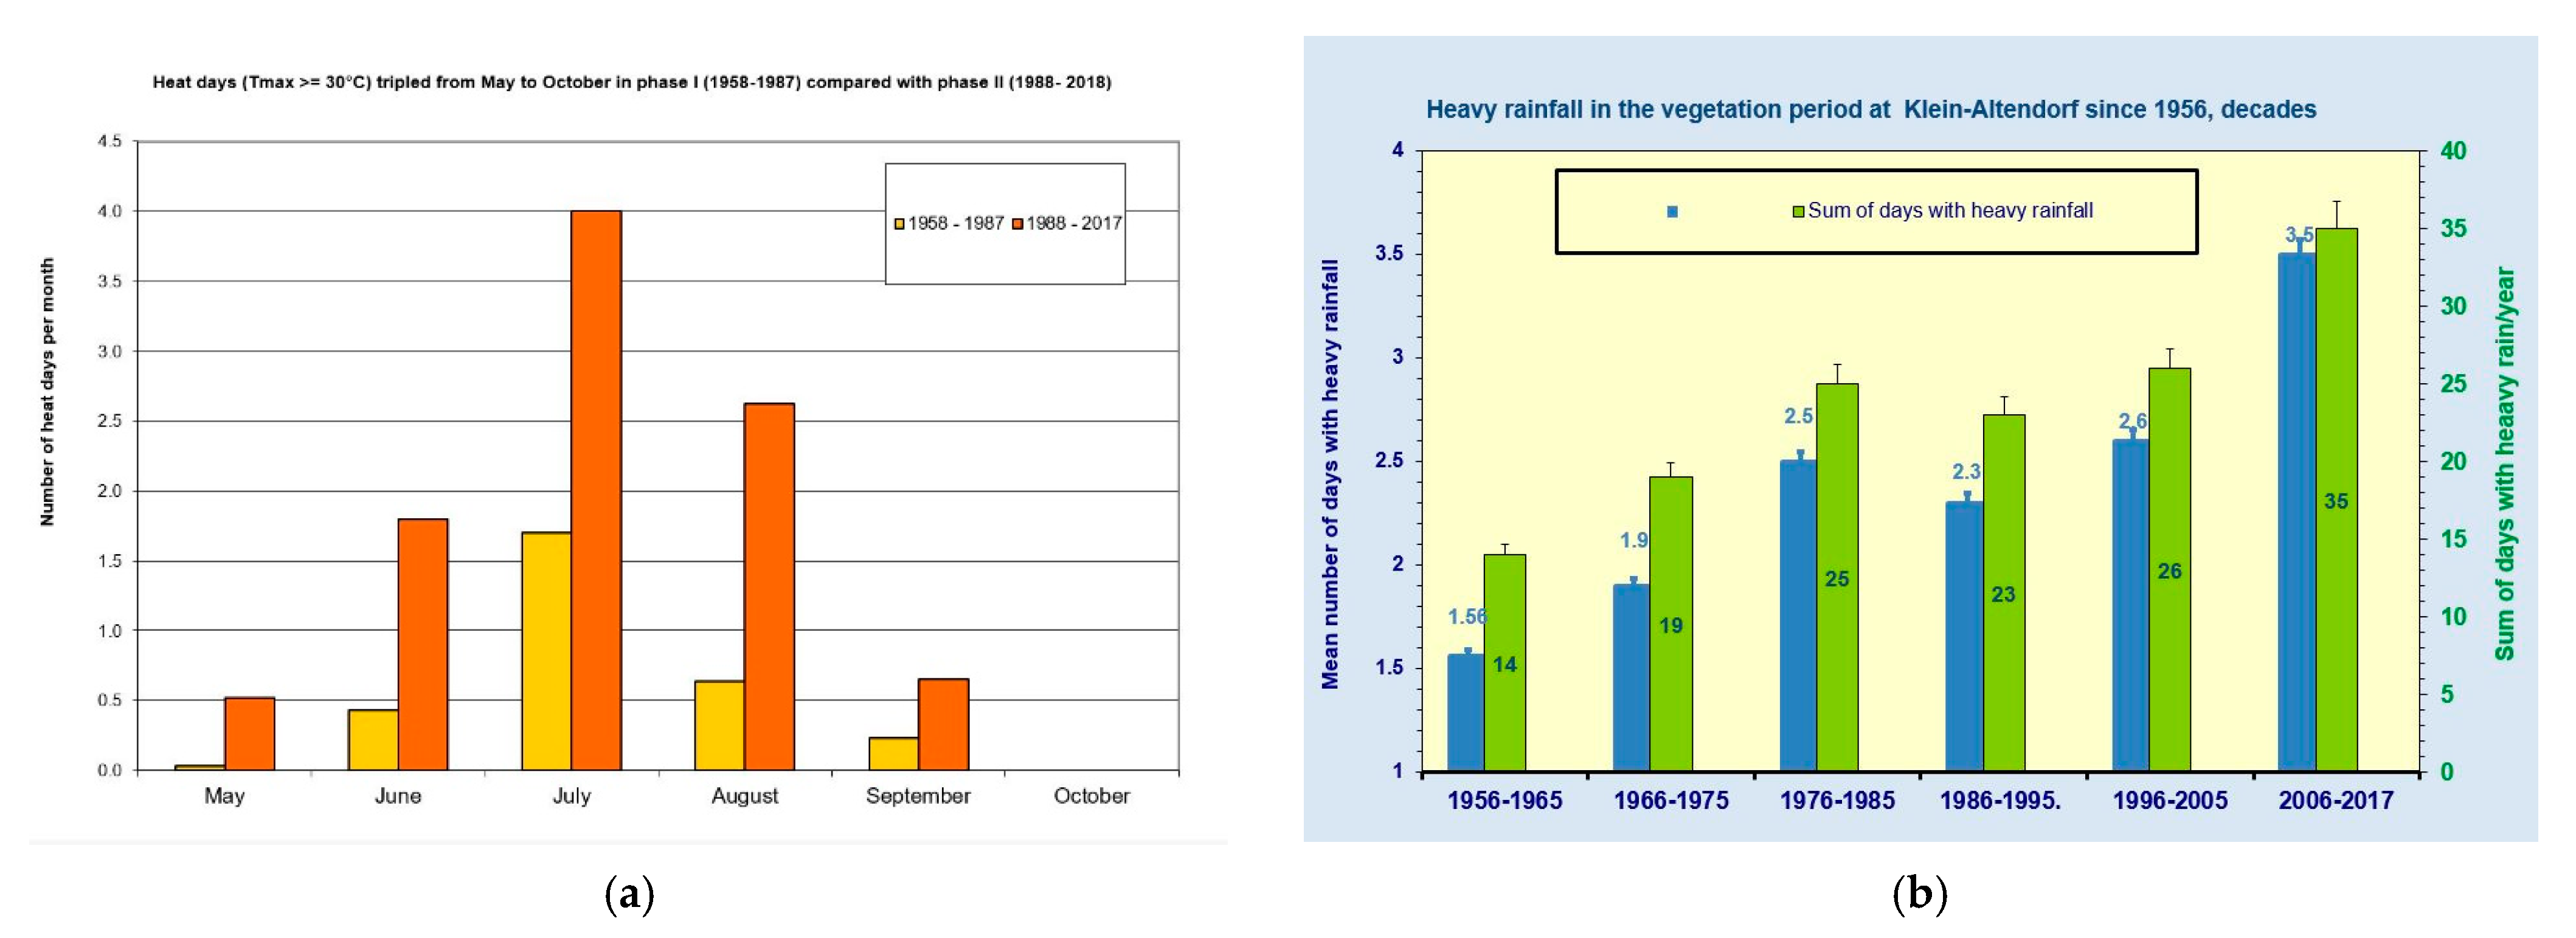
3.3. Increase in Heat Days and Heavy Rainfall

To investigate the development of extreme temperatures during the vegetation period, we compared the heat days in phase I and phase II. On average, the number of heat days tripled from May until September (Figure 3a) with the Tmax on most heat days being ca. 32 °C, with 36 °C as a one-off extreme value (result not shown).

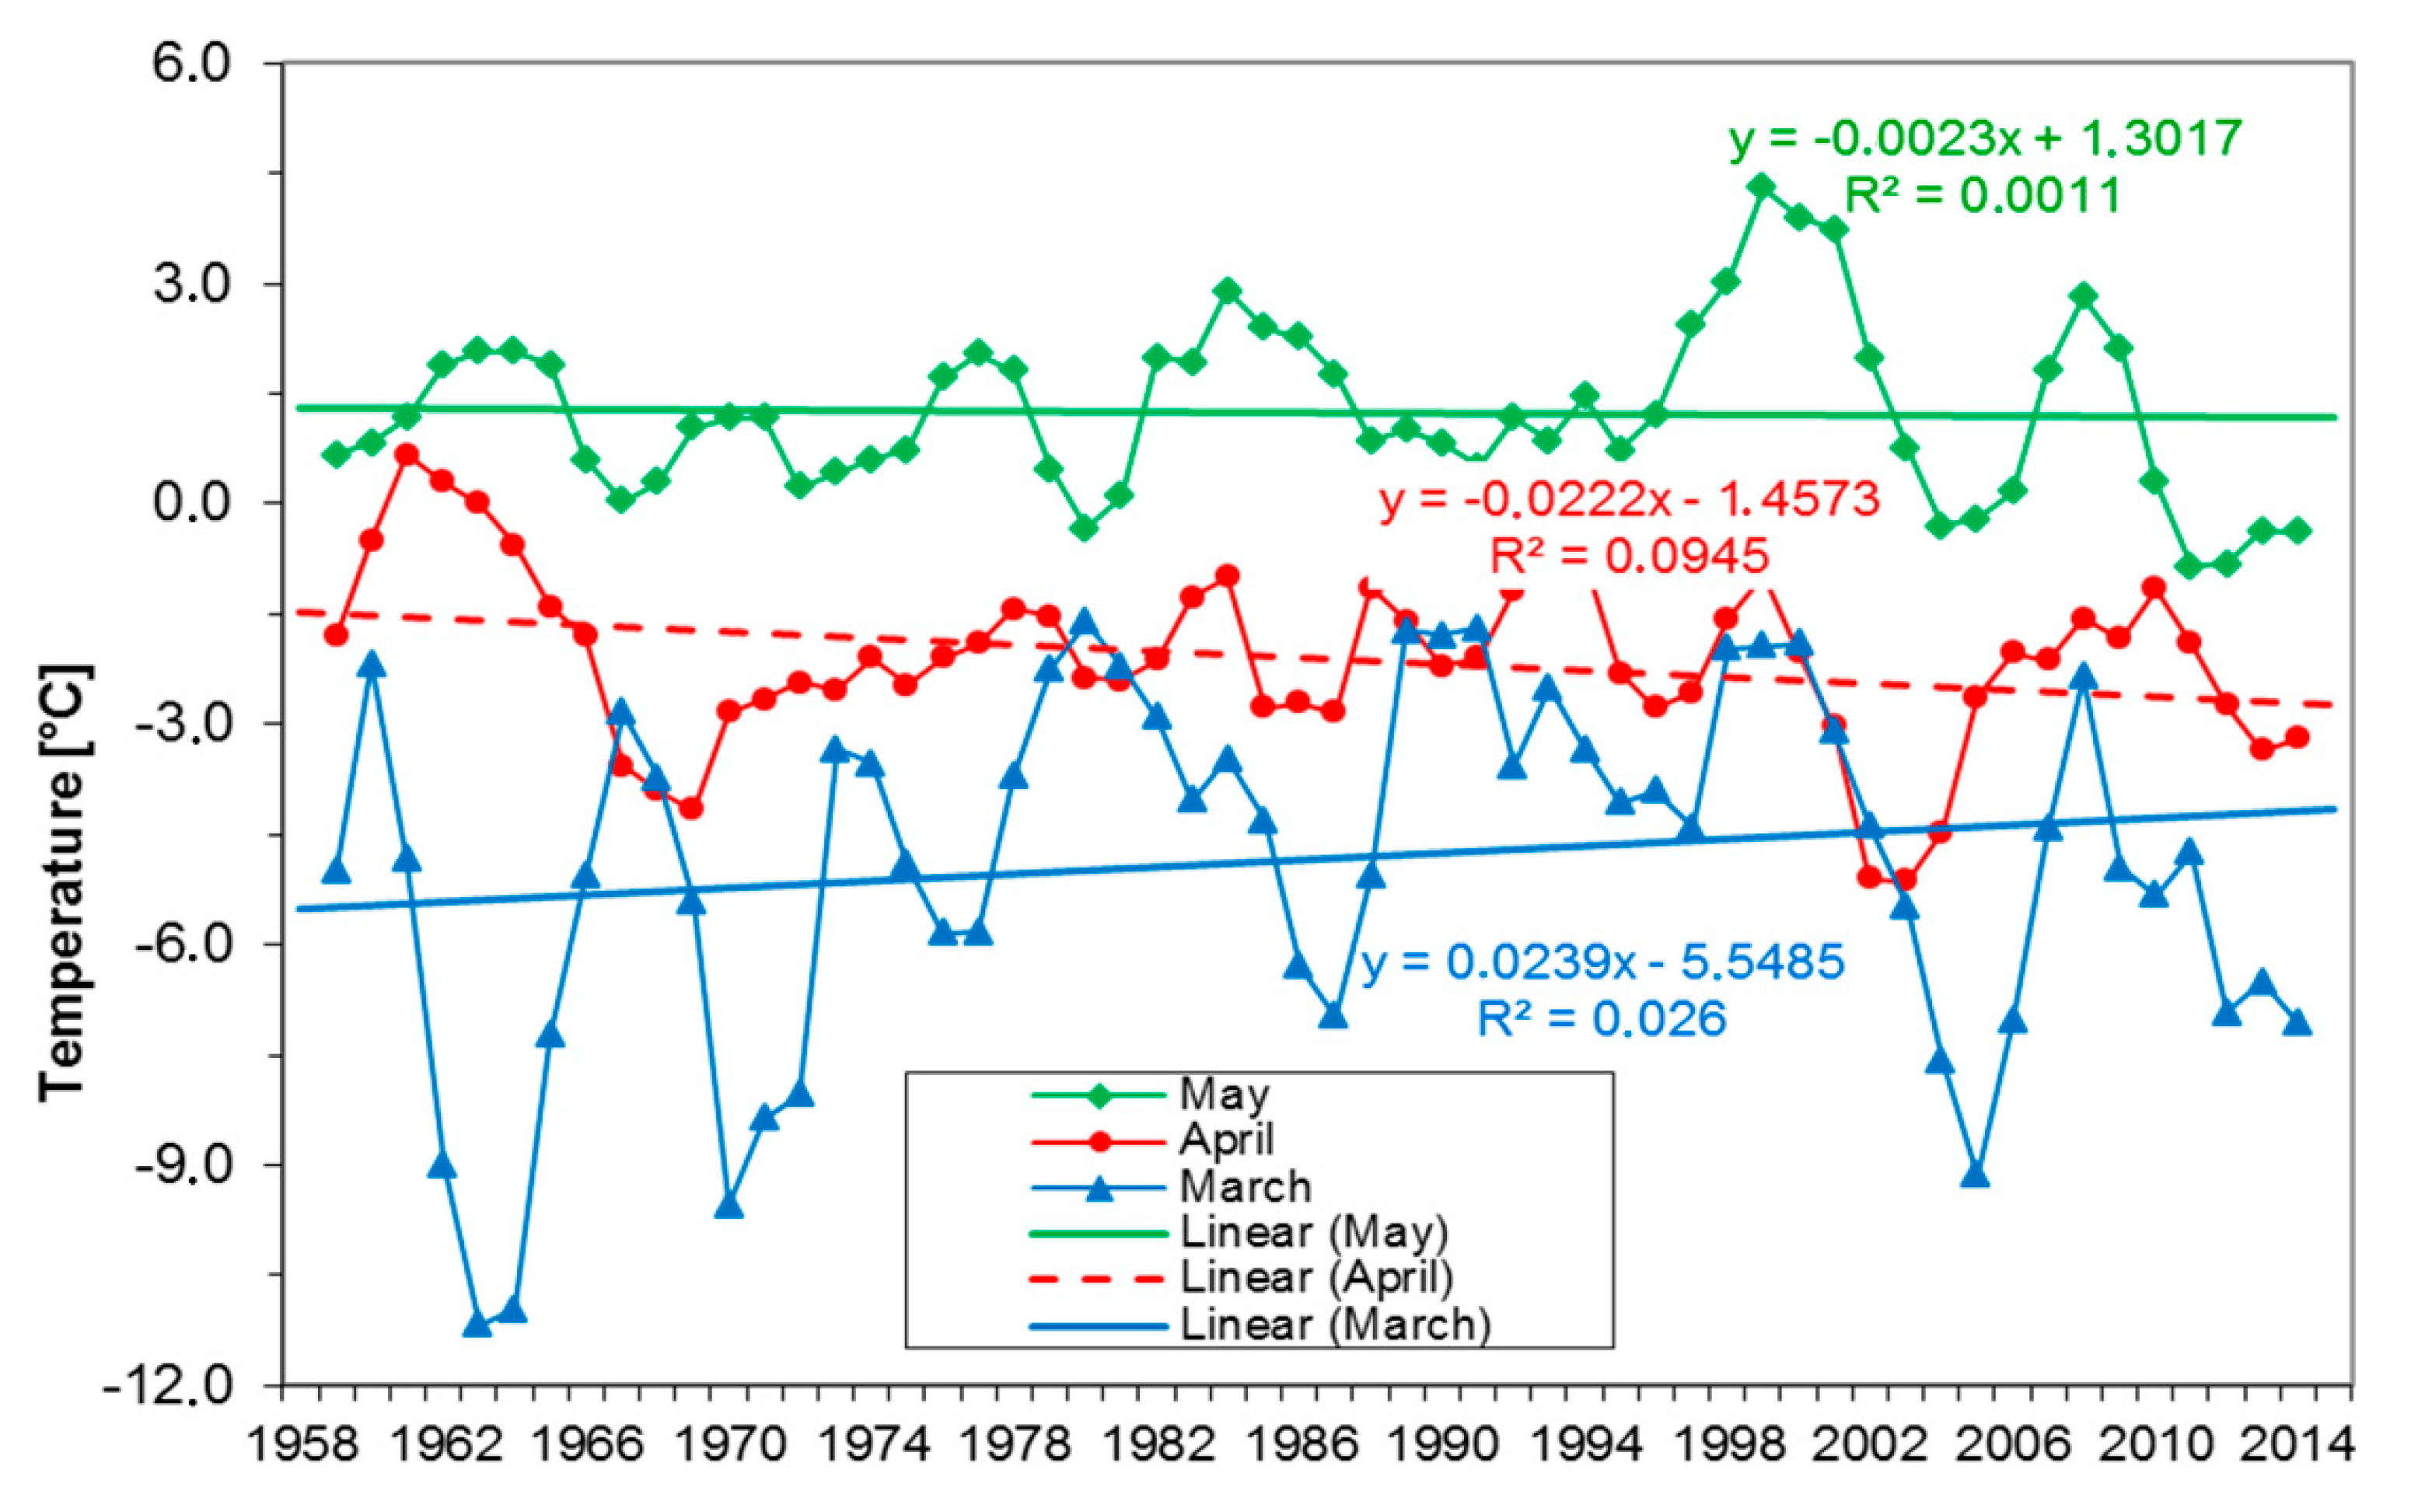
3.4. Development of Monthly Minimum Air Temperatures in the Flowering Time

Over the last 60 years, the most severe rise in minimum monthly temperature in spring was observed in March (Figure 4). The minimum temperature rose from −5.7 °C in March 1958 to −4.0 °C in March 2017, i.e., by ca. 1.7 °C over the 60 years, based on linear curve fitting. While the long-term (60 years) minimum monthly temperatures increased in March, they declined in April by ca. −1.4 °C and negligible change in May (Figure 4).

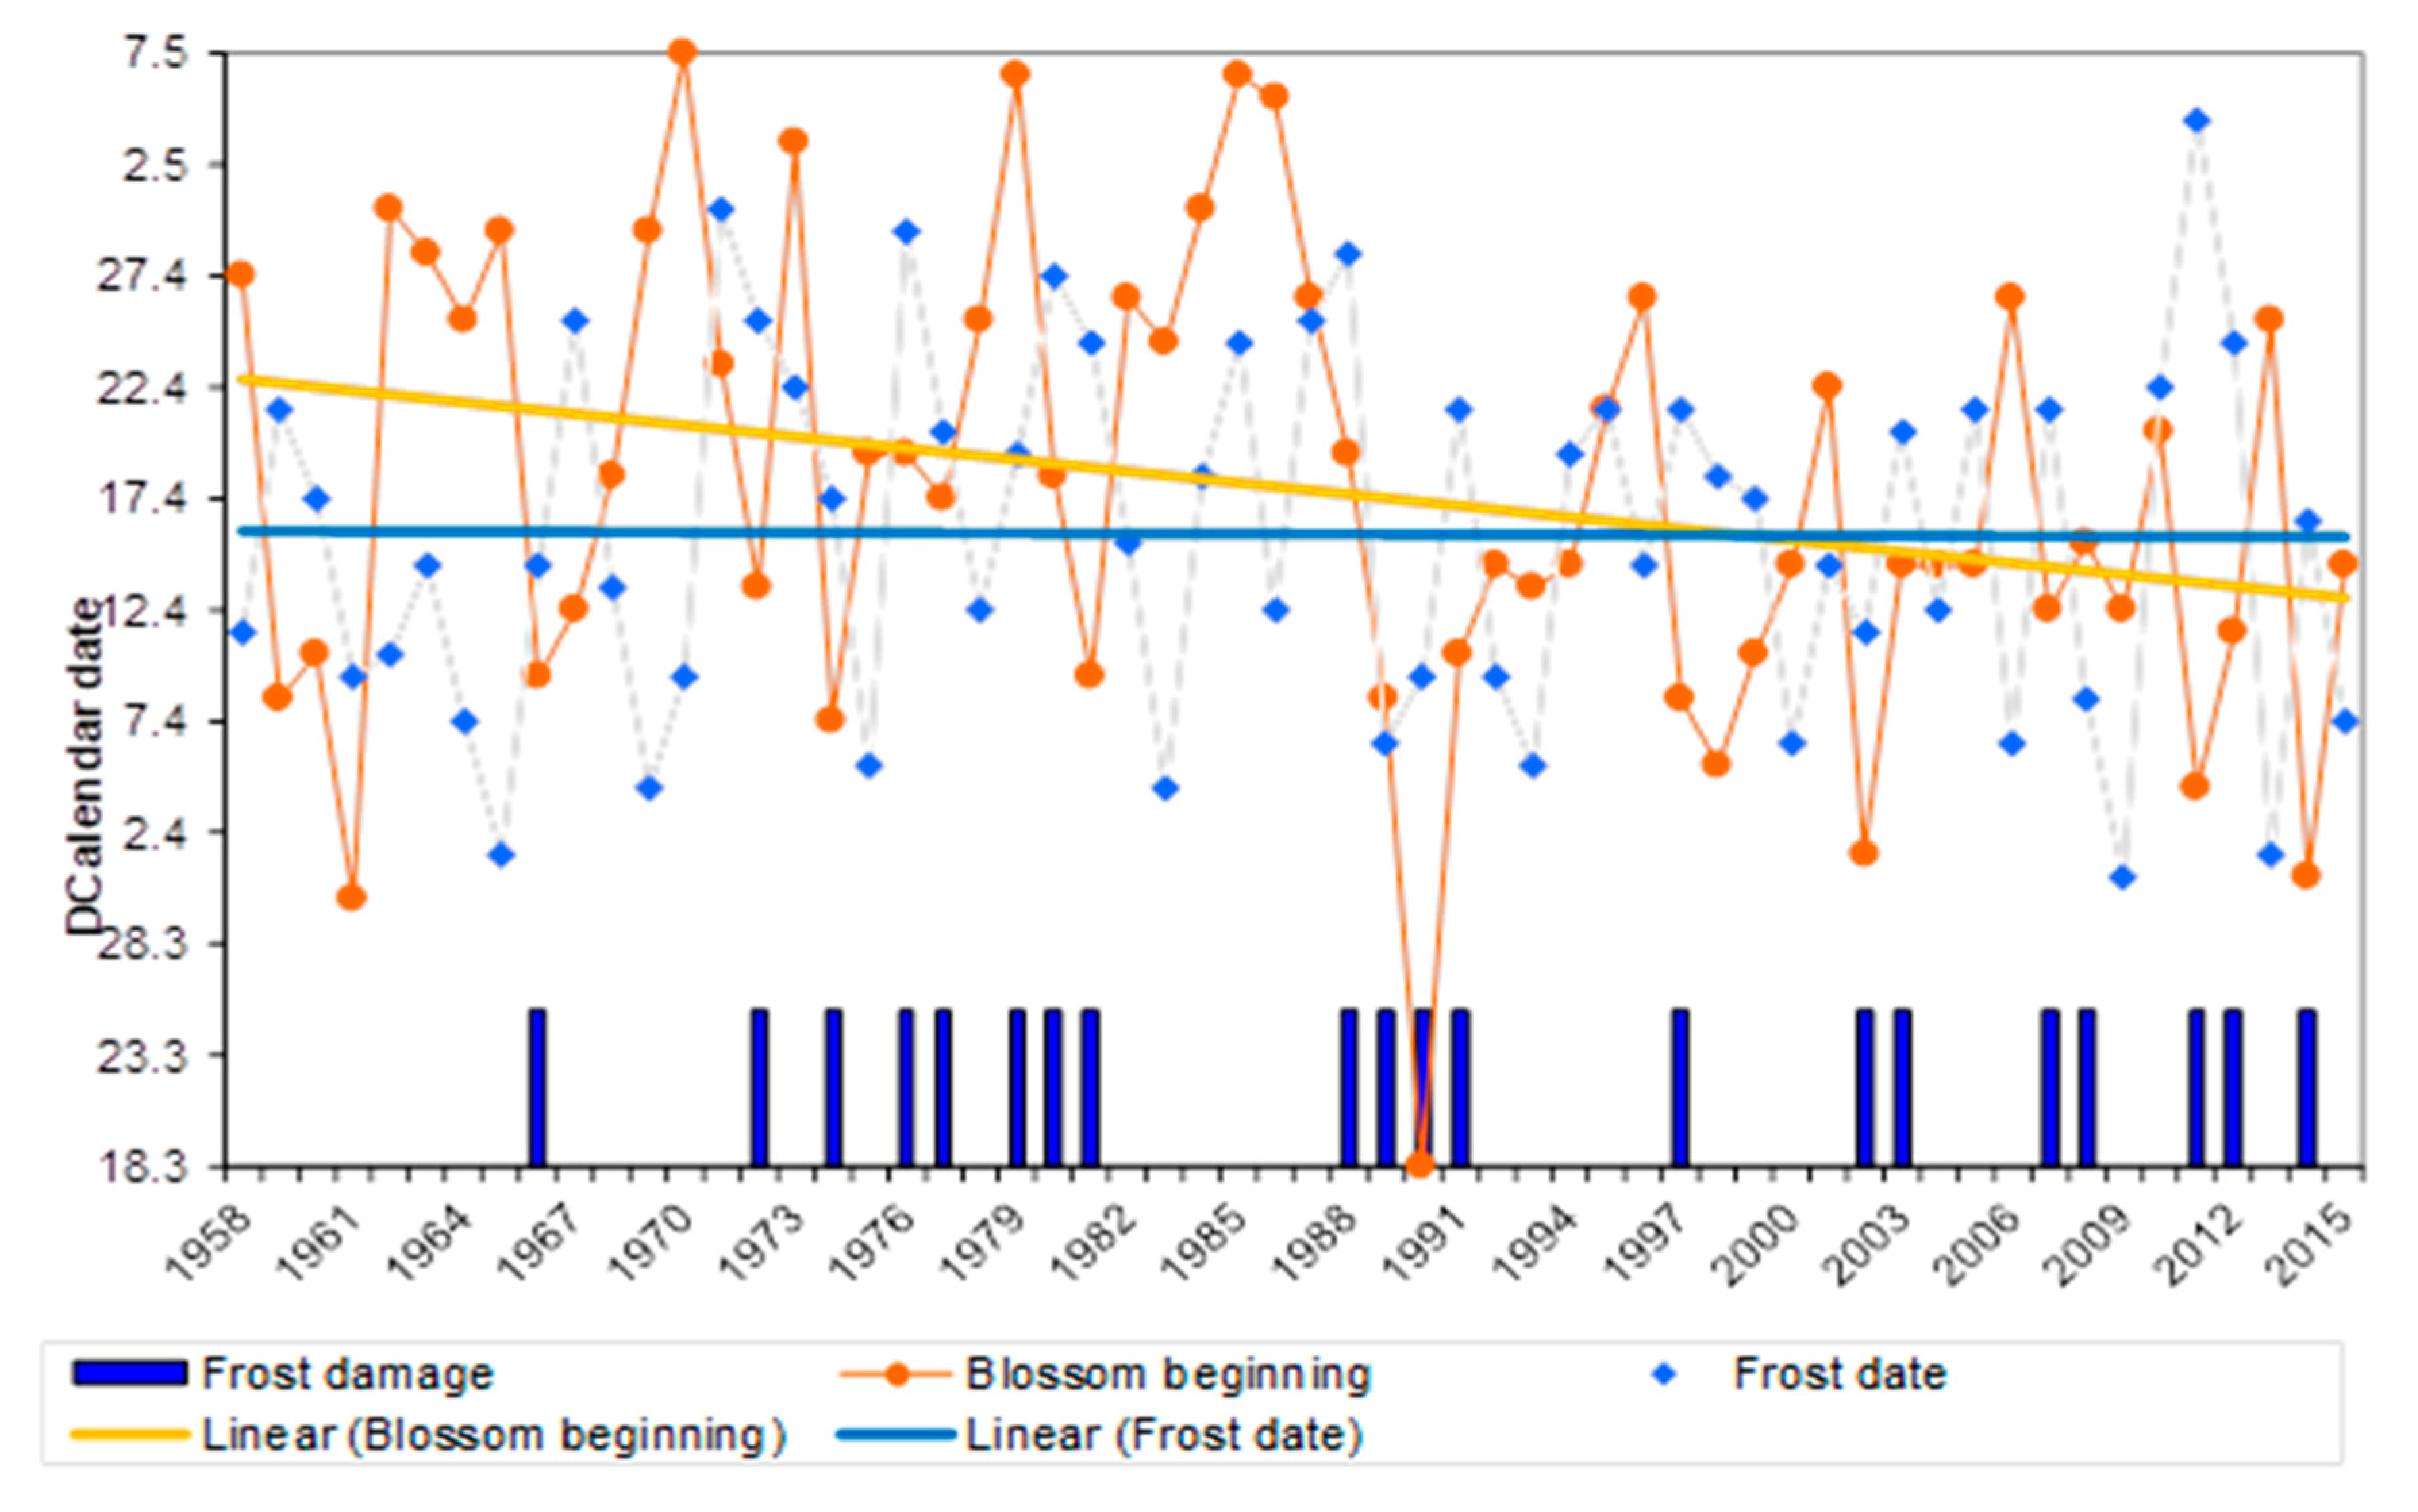
3.5. Effect of Climate Change on Risk of Late Spring Frost (and Flower Damage)

Minimum temperatures in April, associated with damaging late spring frost at the time of pome and stone fruit tree flowering, became colder by −0.3 °C from −2.0 °C (mean values of phase 1: 1958–1987) to −2.3 °C (phase II: 1988–2017). The number of days with severe frost, i.e., colder than −2 °C, increased, when the two phases were compared (Table 2). By contrast, minimum temperatures in March in the last 30 years rose by 1.3°C (from −5.5 in phase I to −4.2 °C in phase II), whereas no change was observed in May; similarly, the number of frost days declined in March, but was without change in May (Table 2).
In years, when the spring frost coincided with late pear flowering, the effects on fruit set and yield reductions were most severe (Figure 5). In phase I (1958–1987), the frost occurred before or during early flowering with little effect on fruit set and yield (27% of the years). However, the spring frost coincided with later flowering stages in the last ca. 30 years (phase II, 1989–2017) (43% frost damage of years), thereby increasing the risk of frost damage at the time, as with the continental European frost on 19–20 April 2017.

3.6. No Change in Overall Precipitation

While the amount of precipitation remained unchanged in the winter months, the summer precipitation slightly rose over the 60-year period of observation. The annual precipitation at this location of ca. 604 mm consisted of a larger portion of ca. 360 mm in the summer season between May and October and a smaller fraction of ca. 245 mm in the winter between November and April. The monthly precipitation decreased in May, followed by November and January, but increased in December, February, March, August and also in the autumn (September/October). The mean number of days with heavy rainfall (<20 mm/day) tripled during the vegetation period in phase II (Figure 3b).

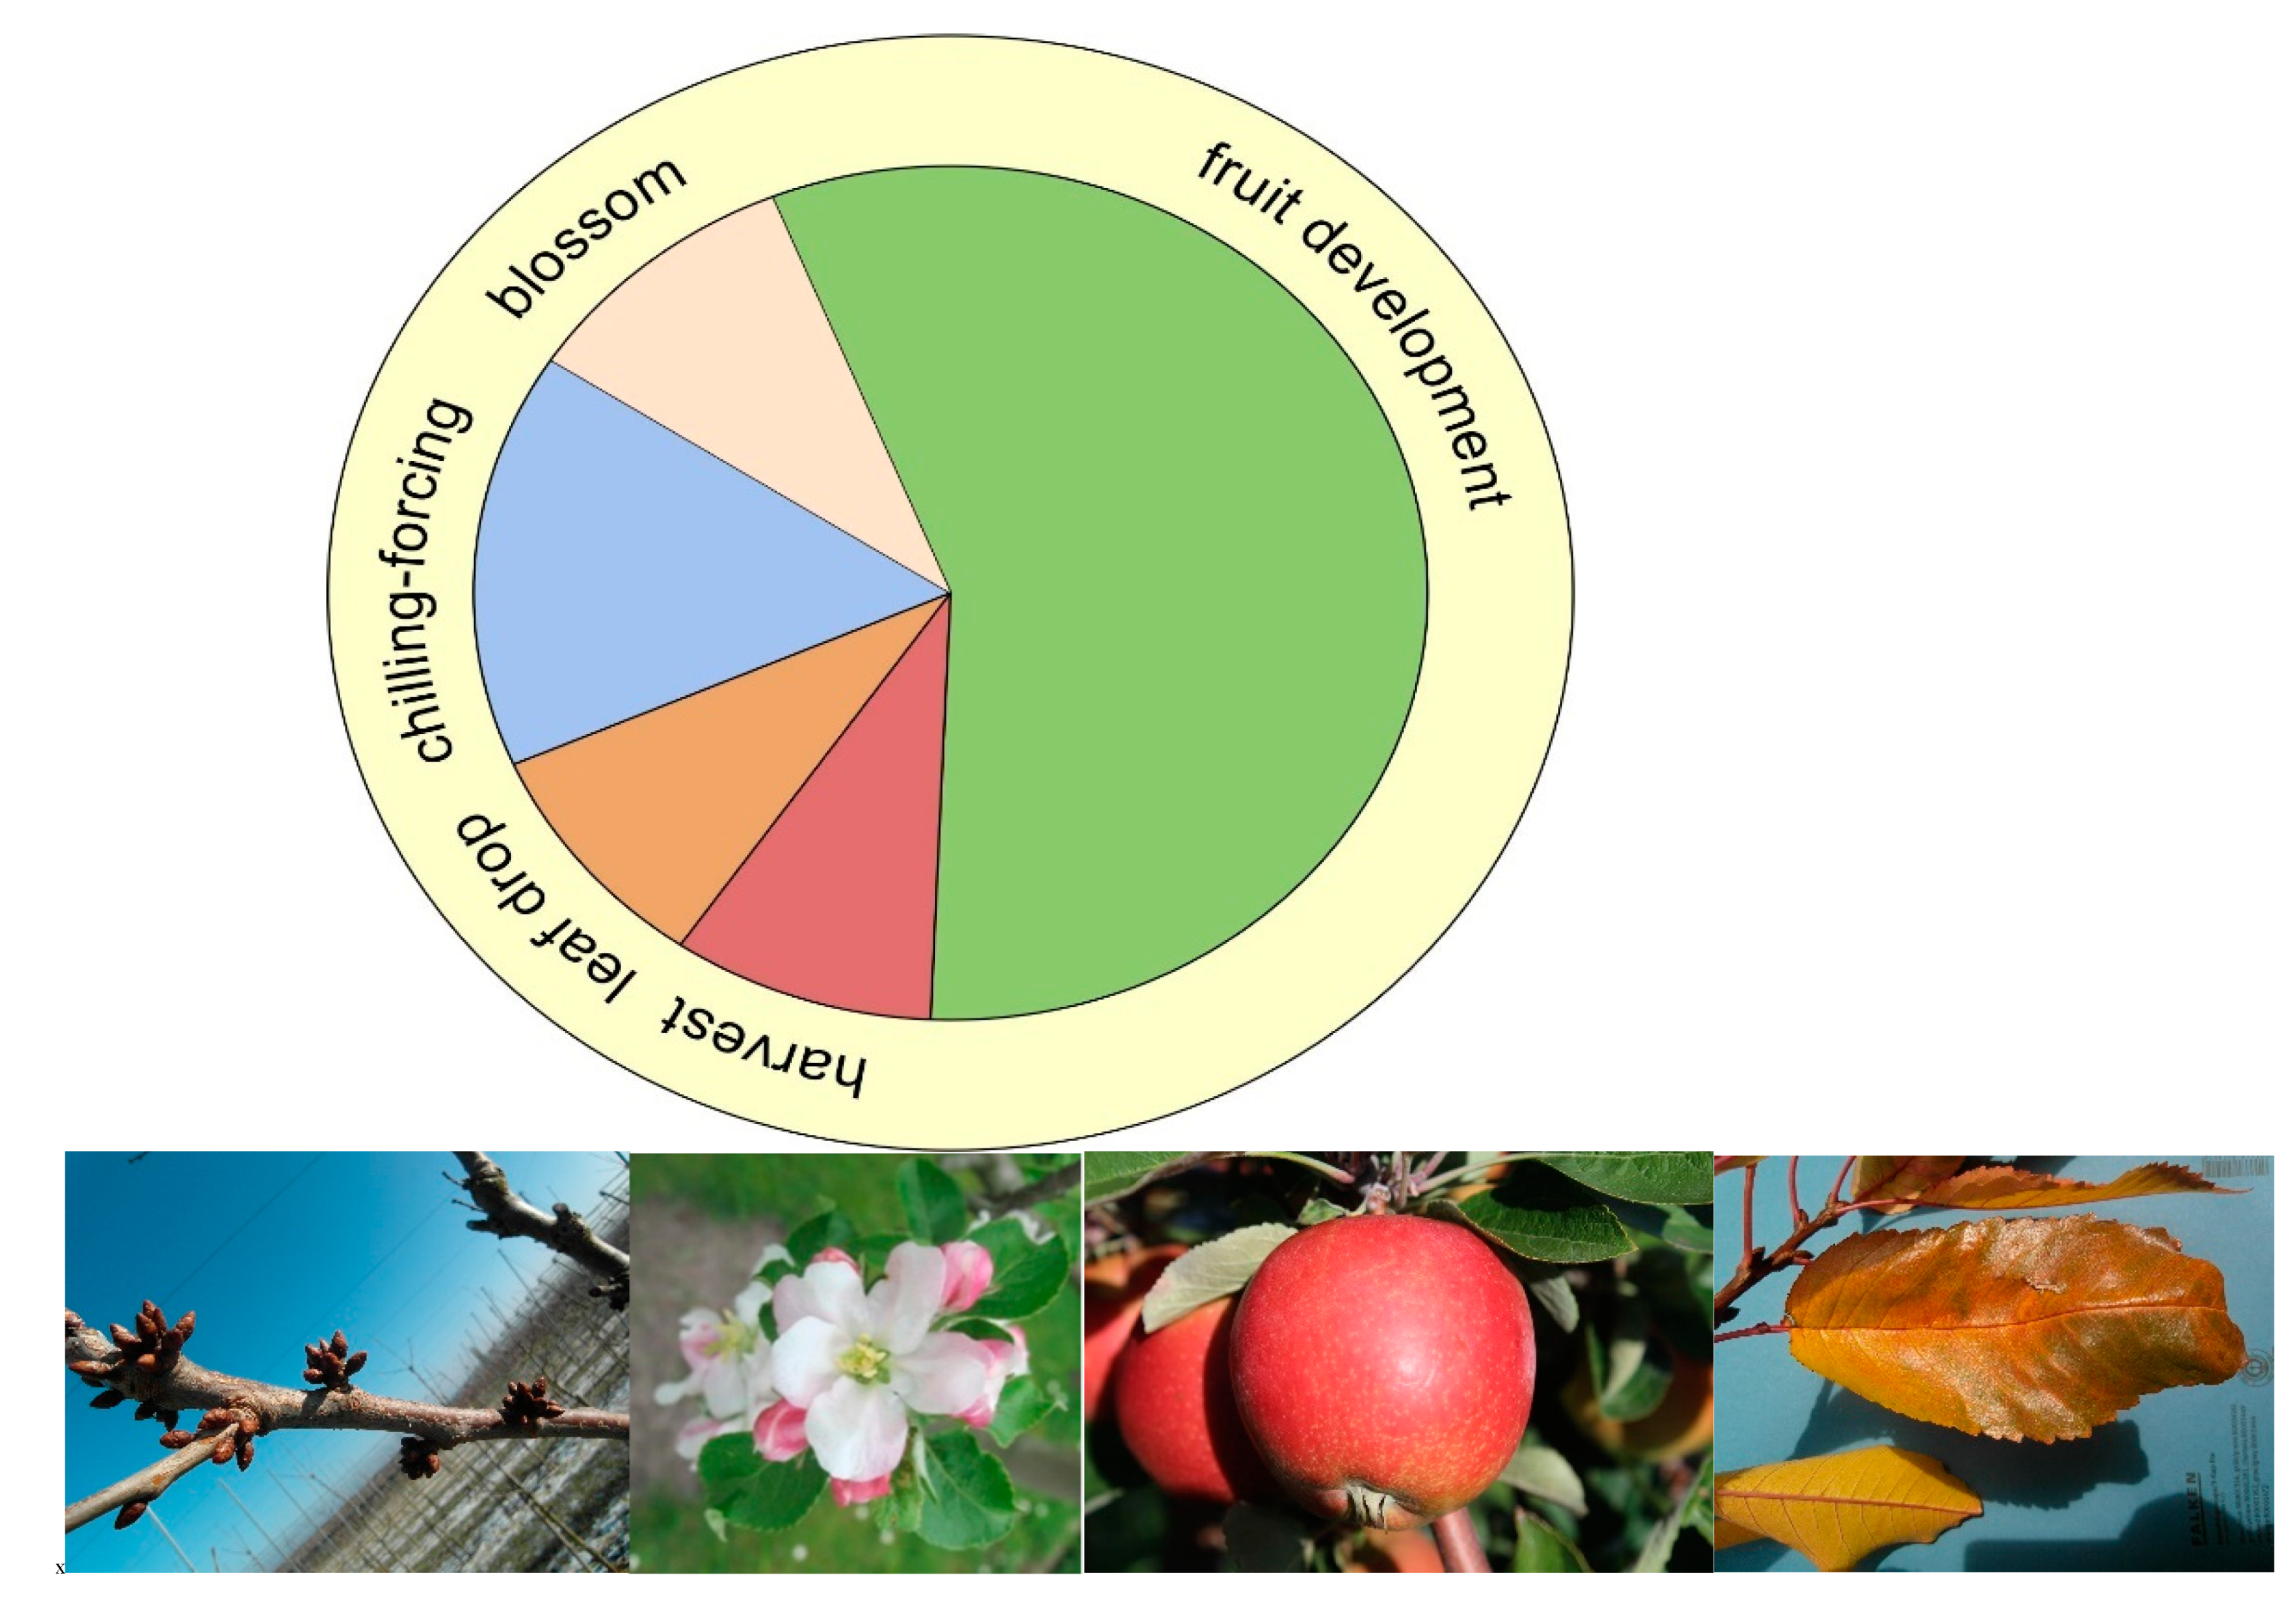
3.7. Flowering and Harvest Advancement as well as Extended Canopy Duration

Between 1958 and 1987, the date of pear cv. A. Lucas’ and three apple varieties flowering fluctuated regularly. However, from 1988 to date (phase II), flowering started (BBCH 61), 9–12 days earlier at Klein-Altendorf compared with the 30 earlier years (phase I) (Table 3). Similarly, full bloom was 11–14 days earlier in both apple (cv. ‘Boskoop’, ‘Cox’ and ‘GD’) and pear (cv. ‘A. Lucas’) comparing the last 30 years with the previous 30 years (Table 4).

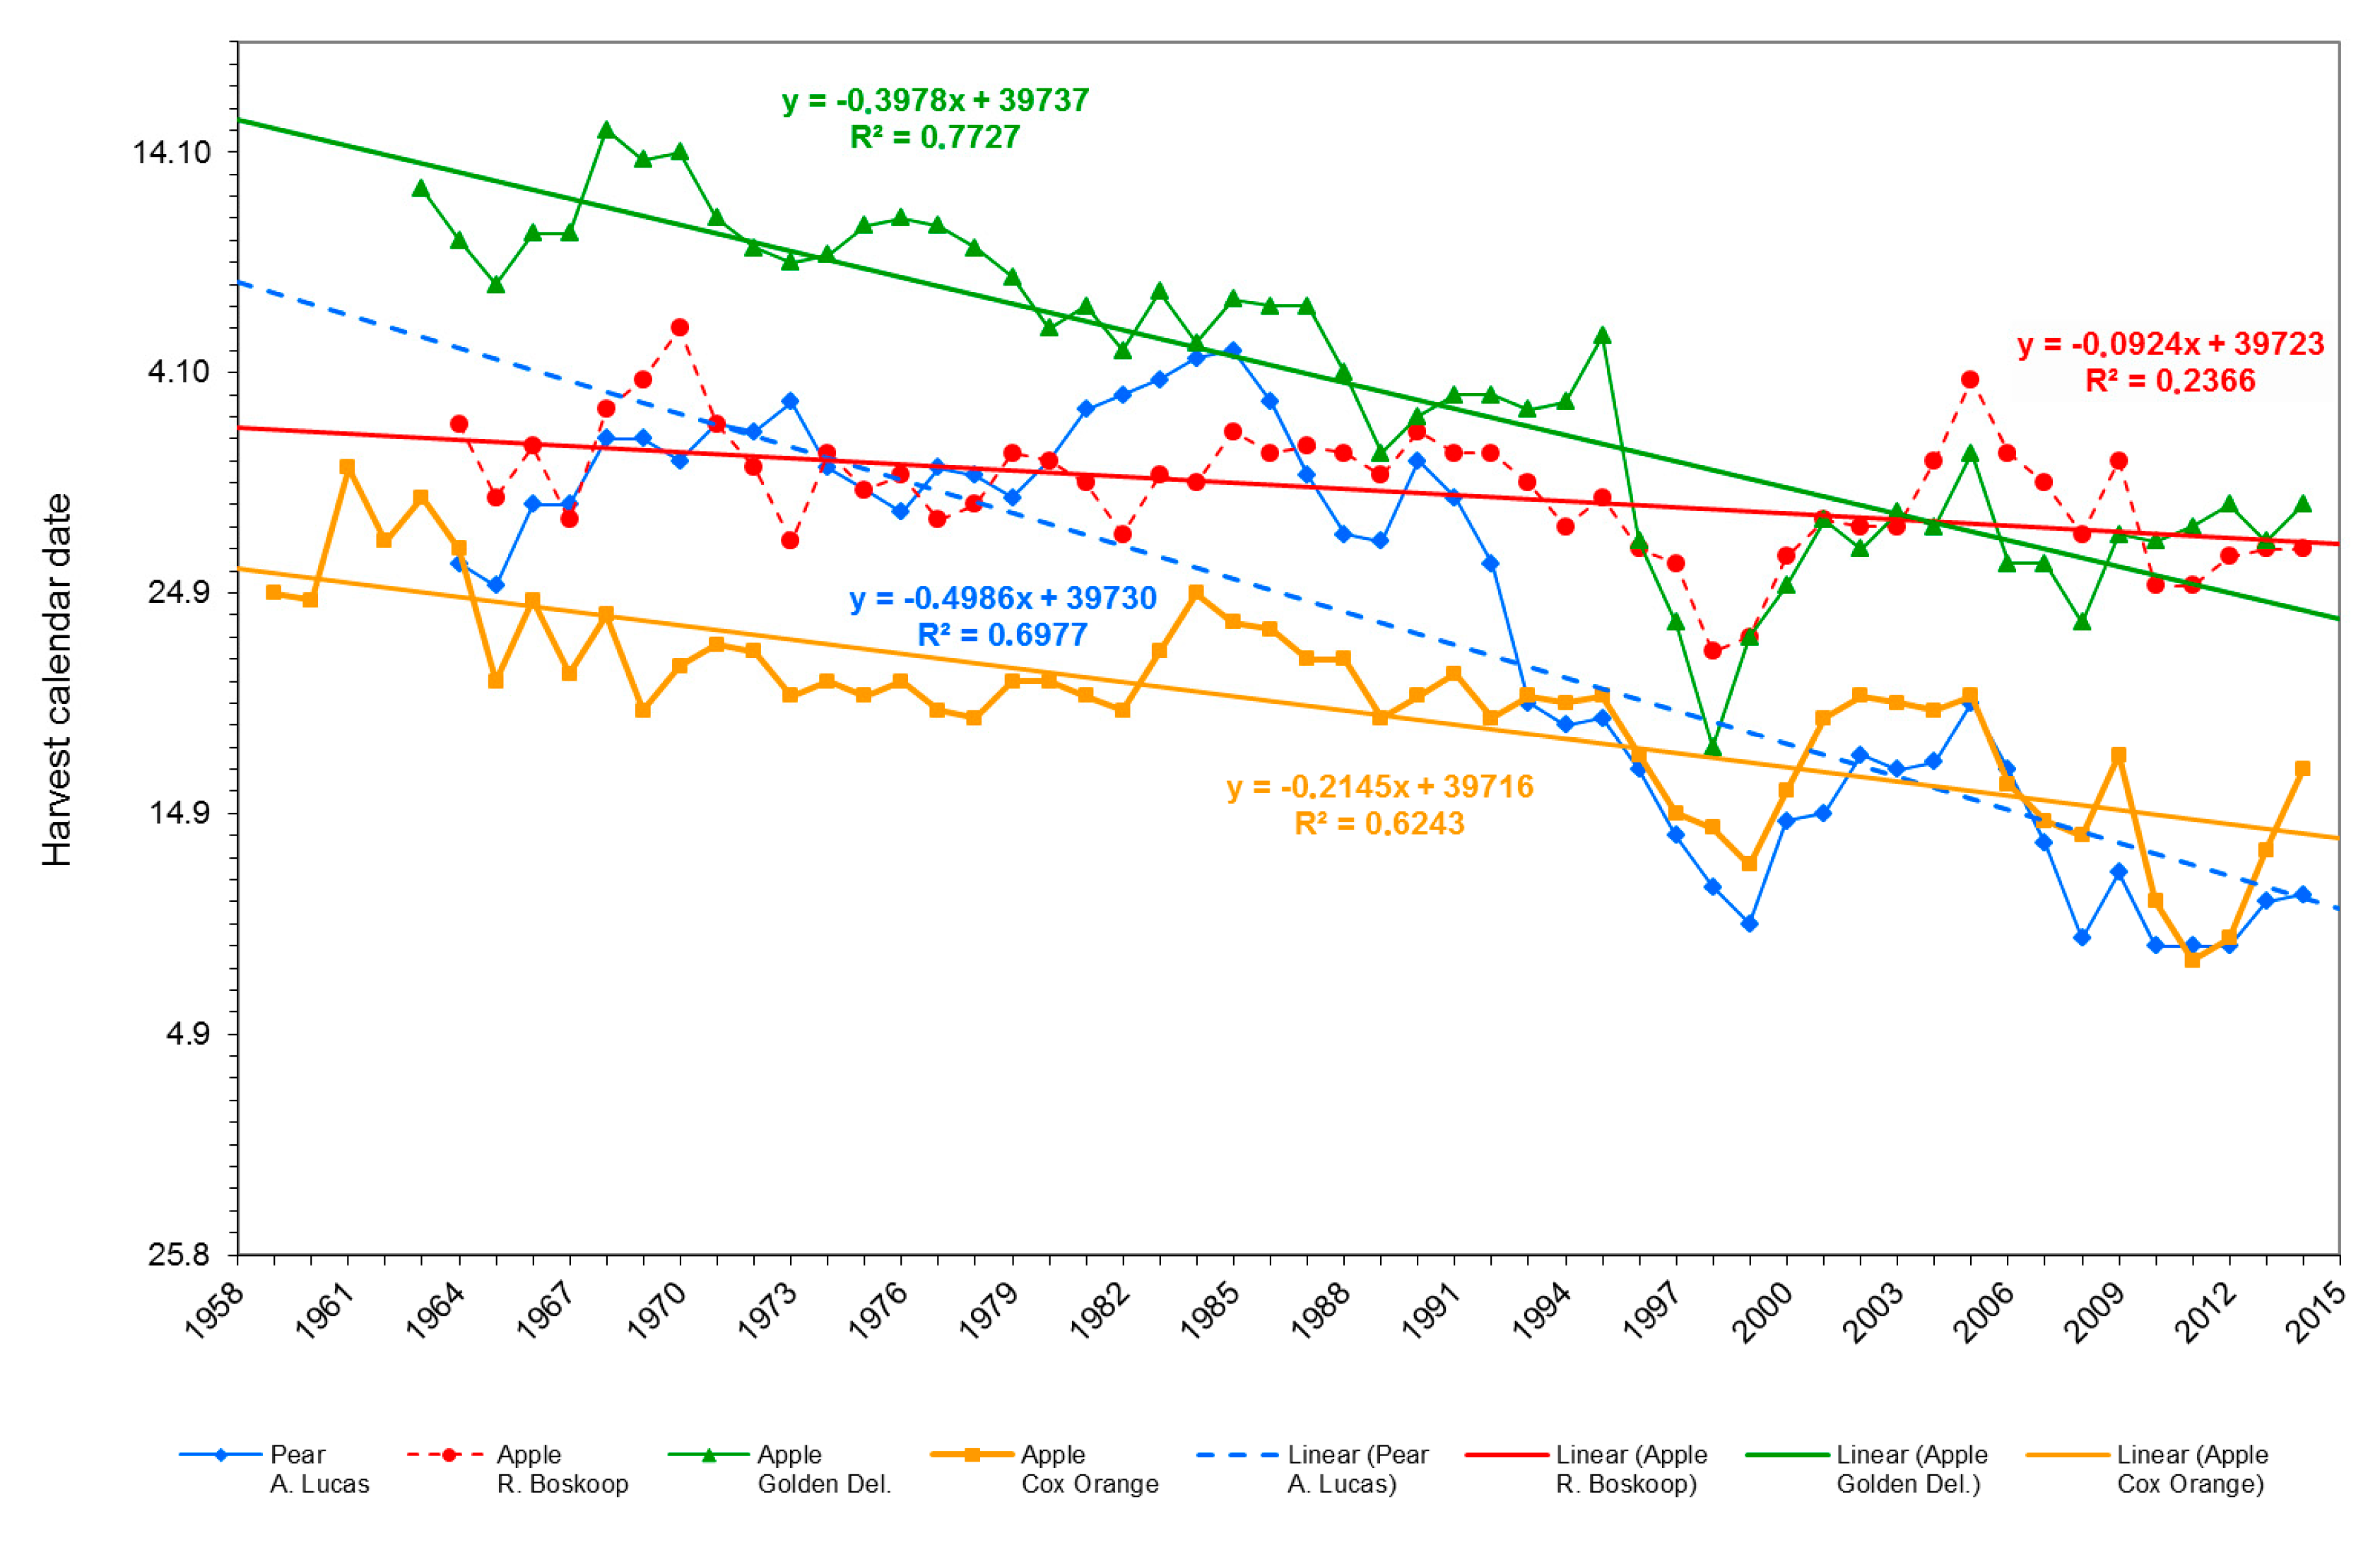
3.8. Advanced Harvest Date

Using linear regression and 3-year moving averages, three out of four varieties showed a close correlation (R2- 0.6 to 0.7) between climate data and harvest date (Figure 6). The harvest of apple cv. ‘Golden Delicious’ fruit was advanced by ca. 20 days over the last 60 years. However, when the means of the two 30 year phases (1956–1987 and 1988–2018) were compared, this advancement was only 12 days (Table 4). This apparent discrepancy is interpreted as an overestimate in the linear regression (Figure 6); the same situation was observed with pear cv. A. Lucas’, where the linear regression with 24 days overestimated the harvest advancement of 15 days shown in Table 4. The least harvest advancement of ca. 4 days was in apple cv. ’Boskoop’ and in line with the approach of the comparison of the latter 30 and former 30 years in Table 4.

3.9. Advanced and Extended Tree Canopy Duration

The canopy duration, i.e., the period from flowering to leaf drop, was extended by ca. 12 days in spring, but not extended into the autumn. Leaf drop started 1–4 days earlier in apple and pear (‘A. Lucas’) fruit in phase II (1988 to date) relative to that in phase I (1958–1987), in contrast to the more severely affected flowering (11–14 days) and harvest (4–15 days) advancement (Table 4); the range indicates that the observed phenological effects strongly depend on the variety and observations based on a single variety may be misleading.

4. Discussion

4.1. Temperature Rise Indicative of Climate Change and Physiological Consequences

Our distinction of two 30 year climatic phases coincided with the transition to recent climate change from ca. 1988/89, as observed by the National German Met office DWD as well as phenological observations with apple and peach in other locations [4,6,7,8,9]; the first 30 years in this study coincide with the international climatic reference period of the WMO.
The calculated temperature rise of 1.7 °C in the last 60 years resembles the nationwide average of 1.7 °C in the 45 years between 1955 und 2000 [7,8]) and is in the same order with the temperature increase of 0.2 °C/decade reported by Hansen et al. (2006 [10]). Our observed temperature rise of 1.6 °C/60 years is within the weakest IPCC Scenario B1 (1.1 to 2.9 °C temperature rise between 2000 and 2100) but below the modest Scenario A1F1 (2.4 to 6.4 °C) [11]; scenarios starting from 1990 often under-estimate climate change [12]).
Overall, the changes in weather pattern observed in the last 30 years at Klein-Altendorf, i.e., a warmer winter and spring (+1.2 °C) and less pronounced temperature rise in autumn, are in line with those in Jork in the north of Germany and stroner than at KOB near Lake Constance. The warmer spring is responsible for the flowering advancement of several days (Table 4), while the warmer autumn may reduce the formation of red colouration on bi-coloured apple and pear cultivars [13].
The increase in weather extremes, such as heavy rainfall and heat (Figure 3) extremes, has a negative effect on tree physiology. Heavy rainfall can induce fruit cracking, while under heat, photosynthesis of temperature zone fruit crops, such as apple and pear, comes to a standstill, since their temperature optimum of 23–25 °C is largely exceeded [14]. The larger number of heat days (by ca. 7 days; Figure 3) is responsible for sunburn in apple fruit exposed to direct sunlight and may be a possible cause for both the extended vegetation period (days > 5 °C) and canopy duration by 6–10 days (Table 4).

4.2. Climate Change Effects on Pome Fruit Phenology, Chilling and Flower Advancement

The warmer winter months in December–February (Figure 2) provide less winter chill for the fruit trees [1,15], while the warmer spring months (March and April) was the strongest effect in line with Chmielewski et al. (2004) [4] explain the 11–14 days earlier apple blossom (Table 4). This flowering advancement explains the 4–15 days earlier harvest; the advancement of bloom was stronger than that of the fruit harvest in most varieties (Table 4). The smallest changes in averaged monthly temperatures were observed in September–November (Figure 2). This interesting result explains two phenological findings, (a) the minute changes in the date of leaf drop of 1–4 days (Table 4), (b) the change in chilling for the tree fruit crops at this location [16]. The greater rises in monthly winter and spring temperatures from January to March (Figure 2) may contribute to tree/plant forcing after fulfilment of the chilling requirement resulting in the observed 9–12 days earlier beginning of flowering (BBCH 61; Table 3).
The 11–14 days earlier full bloom (BBCH 65) in apple and pear (Table 4) resembles the 14 days earlier flowering in Jork [8], 10–20 days in cv. ‘Golden Delicious’ in the foothills of Switzerland [17] and 7–9 days with cv. ‘Golden Delicious’ apple in southern France [3].
A comparison of the two phases over the 60 years showed an advancement of leaf drop by 1–4 days (Table 4). Similarly, the canopy duration, however, was prolonged by ca. 6–10 days in spring due to the 9–12 days earlier beginning of flowering (Table 4). With the early flowering apple cv. ‘Boskoop’, harvest was least advanced in contrast to the later flowering apple and pear cultivars (Table 4). Overall, fruit crops may, to some extent, benefit from climate change and ca. 6–8 days extended period between harvest and leaf fall in the autumn (Table 4 and Figure 7). At this time, the tree recovers, leaf photosynthesis supports both flower bud development and leaf drop signals the successful translocation of carbon and nitrogen skeletons from the leaves into the perennial parts of the tree (trunk, bark and root) for next year’s re-growth and flowering [18] and the beginning of chilling sensitivity of the tree [1].
The results are in line with other findings of generally earlier leaf drop throughout Europe, but different from the climate effects in the US.

4.3. No Negative Results

In contrast to Mediterranean climate locations, we have neither observed any extension of the flowering time, as indicative of a greater loss of chill, nor any late flowering at 50° N after harvest in the autumn, as reported from Turkey; such flowering is detrimental to the tree, which then loses its flowers for the next year.

4.4. Minimum Temperatures and Spring Frost

The persisting risk of a late frost is a combination of four moderate effects, which add up to: (a) warmer spring temperatures (Figure 2), (b) number of frost days (Table 2) and (c) lower minimum temperatures in April (Figure 4/Table 2), which (d) coincide with particularly frost-sensitive flowering stage of flower opening (BBCH 61–63, stage 9, 760DD) (Westwood, 1999 [19]). In the last 30 years, the flowering stage affected by spring frost shifted from balloon stage towards flower opening in apple due to climate change (Figure 5). Hence, the risk of a late spring frost in April remains or increases, as indicated by the minimum temperature (Figure 4/Table 2) despite the warming in spring, since the latter data are based on daily average temperatures (Figure 2). This confirms the general prediction for fruit cultivation throughout Europe [11,20,21], but in marked contrast to Eccel et al. (2009) [22] and Campoy et al. (2011) [23], who both reported a continued decrease in spring frost for Northern Italy alike Trentino and predicted a further decrease for the next years.

4.5. Precipitation

The drier May affects flowering and fruit set and may enhance post-bloom fruit drop, while the larger August to October precipitation is positive for fruit size and marketing/financial returns. The 2.7-fold increase in heavy rainfall over the last 60 years may largely affect open field crops, such as vegetables [24]. Open, field-grown cherries may be affected, if the heavy rainfall coincides with fruit maturation, when they are prone to cracking, rot and mould.

5. Conclusions

Correlations between 60 years of apple and pear phenology and concomitant climate records at Klein-Altendorf gave the following results:
A close correlation between March and April temperature increase and pome fruit flower advancement by 11–14 days in four cvs of apple and pear. Fruit ontogeny was 4 days shorter in cv. ‘A. Lucas’ pear, but 5 days longer in cv. ‘Cox Orange’ and 10 days in cv. ‘Roter Boskoop’, and remained unchanged in cv. ‘Golden Delicious’, irrespective of early or late ripening and the widest range of climate effects. A close correlation (R2- 0.6–0.7) between climate data and fruit maturation of 4–12 days earlier indicating its sole dependency on variety and excluding phenology results from climate change studies based on one single cultivar. Canopy duration (bloom to leaf fall) was consistently extended by 6–10 days, mostly in spring, and with a beginning 1–4 days earlier, leaf drop appeared least affected, possibly positive for the onset of the tree’s chilling accumulation [25].

Author Contributions

Conceptualisation, validation, writing and visualisation, M.B.; methodology, formal analysis, resources and data curation, A.K. All authors have read and agreed to the published version of the manuscript.

Funding

This research received no external funding.

Acknowledgments

We are grateful to Gustav Engel for initiating the long-term climate and phenology records in 1956 at Klein-Altendorf, H. Walbrühl for the manual data acquisition until 1994, Frau Förster for the phenological clock, Martina Ruland for digitising the filing cards, Ralf Pude for supporting this ongoing research and MDPI for the invite to contribute to this special edition and for waiving the APC.

Conflicts of Interest

The authors declare no conflict of interest.

References

  1. Kaufmann, H.; Blanke, M.M. Performance of three numerical models to assess winter chill in fruit trees- a case study using cherry as model crop in Germany. Reg. Environ. Change 2017, 17, 1–9. [Google Scholar] [CrossRef]
  2. Blanke, M.M.; Kunz, A. Einfluss rezenter Klimaveränderungen auf die Phänologie bei Kernobst am Standort Klein-Altendorf- anhand 50jähriger Aufzeichnungen. Erwerbs-Obstbau 2009, 51, 101–114. [Google Scholar] [CrossRef]
  3. Legave, J.M.; Blanke, M.M.; Christique, D.; Giovannini, D.; Matthieu, V.; Oger, R. A comprehensive overview of the spatial and temporal variability of apple bud dormancy release and blooming phenology in Western Europe. Int. J. Biometeorol. 2013, 57, 317–331. [Google Scholar] [CrossRef] [PubMed]
  4. Chmielewski, F.M.; Muller, A.; Bruns, E. Climate changes and trends in phenology of fruit trees and field crops in Germany, 1961–2000. Agric. Forest Meteorol. 2004, 121, 69–78. [Google Scholar] [CrossRef]
  5. Meier, U.; Graf, H.; Hack, H. Phänologische Entwicklungsstadien des Kernobstes. Nachr. Dtsch. Pflanzenschutzd. 1994, 46, 141–153. [Google Scholar]
  6. Bergamaschi, M.; Giovannini, D.; Liverani, A.; Sirri, S. Influence of climate on flowering phenology of pome and stone fruit in Romagna, Italy. In Book of Abstracts of the First ISHS European Hort. Congress She, Wien, Austria, 17–20 February 2008; Association of Food, Veterinary Science and Agriculture (ALVA): Vienna, Austria, 2008; pp. 111–112. ISSN 1996-9449. [Google Scholar]
  7. Chmielewski, F.M.; Müller, A.; Küchler, W. Climate change and frost hazards for fruit trees. Ann. Meteorol. 2005, 42, 488–491. [Google Scholar]
  8. Chmielewski, F.M.; Blanke, M.M.; Henniges, Y.; Blanke, M.; Weber, R.W.S.; Zoth, M. Phenological models for the beginning of apple blossom in Germany. Meteorol. Z. 2011, 20, 486–496. [Google Scholar] [CrossRef]
  9. Menzel, A.; von Vopelius, J.; Estrella, N.; Schleip, C.; Dose, V. Farmers’ annual activities are not tracking the speed of climate change. Clim. Res. 2006, 32, 201–207. [Google Scholar] [CrossRef]
  10. Hansen, J.; Sato, M.; Ruedy, R.; Lo, K.; Lea, D.W.; Medina-Elizade, M. Global temperature change. Proc. Natl. Acad. Sci. USA 2006, 103, 14288–14293. [Google Scholar] [CrossRef] [Green Version]
  11. IPCC. Climate Change 2013: Summary for Policy Makers (SPM). In The Physical Science Basis. Contribution of Working Group I to the Fifth Assessment Report of the Intergovernmental Panel on Climate Change; Stocker, T.F., Qin, D., Plattner, G.-K., Tignor, M., Allen, S.K., Boschung, J., Nauels, A., Xia, Y., Bex, V., Midgley, P.M., Eds.; Cambridge University Press: Cambridge, UK; New York, NY, USA, 2013; 1535p. [Google Scholar]
  12. Kromb-Kolb, H. The Causes and the Extent of Climate Change—Past and Present. She Congress Wien, Feb. 2008, Abstract page 86. Available online: www.she2008.org (accessed on 30 September 2021).
  13. Weber, S.; Damerow, L.; Kunz, A.; Blanke, M. Anthocyanin synthesis and light utilisation can be enhanced by reflective mulch—Visualisation of light penetration into a tree canopy. J. Plant Physiol. 2019, 233, 52–57. [Google Scholar] [CrossRef]
  14. Tartachnyk, I.; Blanke, M.M. Environmental effects on apple tree photosynthesis. Environmental Physiology ISHS Symposium, Nelson, New Zealand, 2000. Acta Hortic. 2000, 557, 465–472. [Google Scholar]
  15. Luedeling, E.; Guo, L.; Dai, J.; Leslie, C.; Blanke, M.M. Differential responses of trees to temperature variation during the chilling and forcing phases. Agric. Forest Meteorol. 2013, 181, 33–42. [Google Scholar] [CrossRef] [Green Version]
  16. Luedeling, E.; Kunz, A.; Blanke, M.M. Effect of recent climate change on cherry phenology. Int. J. Biometeorol. 2013, 57, 679–689. [Google Scholar] [CrossRef] [Green Version]
  17. Jüstrich, H. Klimawandel: Fakt oder Fiktion? Schweiz. Schweiz. Z. Obst-U. Weinbau 2013, 18, 4–7. [Google Scholar]
  18. Tartachnyk, I.; Blanke, M.M. Effect of delayed fruit harvest on photosynthesis, transpiration and nutrient remobilization of apple leaves. New Phytol. 2004, 164, 442–450. [Google Scholar] [CrossRef]
  19. Westwood, N. Temperate Zone Pomology, 3rd ed.; Timber Press: Portland, OR, USA, 1993. [Google Scholar]
  20. Grab, S.; Craparo, A. Advance of apple and pear tree full bloom dates in response to climate change in the southwestern Cape, South Africa: 1973–2009. Agric. Forest Meteorol. 2011, 151, 406–413. [Google Scholar] [CrossRef]
  21. Schleip, C.; Menzel, A.; Estrella, N.; Dose, V. The use of Bayesian analysis to detect recent changes in phenological events throughout the year. Agric. Forest Meteorol. 2006, 141, 179–191. [Google Scholar] [CrossRef]
  22. Eccel, E.; Rea, R.; Caffarra, A.; Crisci, A. Risk of spring frost to apple production under future climate scenarios: The role of phenological acclimation. Int. J. Biometeorol. 2009, 53, 273–286. [Google Scholar] [CrossRef]
  23. Campoy, J.A.; Ruiz, D.; Egea, J. Dormancy in temperate fruit trees in a global warming context: A review. Sci. Hortic. 2011, 130, 357–372. [Google Scholar] [CrossRef]
  24. Bisbis, M.; Gruda, N.; Blanke, M.M. Impacts of climate change on vegetable production and produce quality—A review. J. Clean. Prod. 2018, 170, 1602–1620. [Google Scholar] [CrossRef]
  25. Kaufmann, H.; Blanke, M.M. Substitution of winter chilling by spring forcing for flowering using sweet cherry as model crop. Sci. Hortic. 2019, 244, 75–80. [Google Scholar] [CrossRef]
Figure 1. (a) Annual deviation from the 60-year (1956–2017) temperature average (9.5 °C); the dotted vertical line indicates the transition between phase I and phase II and (b) increase in monthly temperatures of phase II (1988–2017) relative to phase I (1956–1987) and to the long-term average (1956–2017) (red horizontal line).
Horticulturae 08 00110 g001
Figure 2. Correlations between flowering advancement in apple cv. Boskoop (top left), Golden Delicious (bottom left), Cox Orange (Bottom right) and pear (top right) and monthly temperature increase in March and April (with R2) comparing phase II with phase I.
Horticulturae 08 00110 g002
Figure 3. Increase in (a) heat days (Tmax ≥ 30°C) and (b) days with heavy rain (>20 mm/day)—mean monthly breakdown; comparison phase I (1958–1987) with phase II (1988–2017).
Horticulturae 08 00110 g003
Figure 4. Averaged monthly minimum temperature (Tmin, 30 day average) in March (blue), April (red, dotted line) and May (green solid line) between 1958 to 2017 based on linear curve fitting (with moving averages and R2).
Horticulturae 08 00110 g004
Figure 5. Advancement in flowering at beginning phase for pear cv. ‘A Lucas’ during the last 60 years in comparison with the calendar dates of late spring frost at Klein-Altendorf Campus.
Horticulturae 08 00110 g005
Figure 6. Effect of recent climate change on fruit maturity, viz harvest calendar date of apple cvs ‘Golden. Delicious’ (green), ‘Boskoop’ (red), ‘Cox Orange’ (yellow) and pear cv. ‘A. Lucas’ (blue dotted line) fruit (with moving averages and R2).
Horticulturae 08 00110 g006
Figure 7. Phenological clock for fruit crops/trees and major climate change effects include an advanced flowering (rose), advanced and extended period of fruit development (flowering to harvest; green), earlier start of chilling and shorter time for chilling and forcing (blue).
Horticulturae 08 00110 g007
Table 1. Annual temperature means over 60 years (1956–2018) comparison of phase II (1988–2018) versus phase I (1956 -1987).
PeriodAnnual MeanSummer MonthsWinter Months
Period I (1956–1987)9.0 °C14.0 °C3.9 °C
Period II (1989–2017)10.1 °C15.0 °C5.1 °C
Period I + II (1956–2017)9.5 °C14.5 °C4.5 °C
Differences
Difference PII − PI+1.1 °C+1.0 °C+1.2 °C
Difference PII − (PI + PII)+0.6 °C+0.5 °C+0.6 °C
Table 2. Average monthly minimum temperature (Tmin) and frost days less than 0 °C and less than −2 °C from March to May in the last 60 years at Klein-Altendorf.
Month:MarchAprilMay
Average
Period
Minimum-TemperatureFrost Days
0 to −2 °C
Frost Days <−2 °CMinimum TemperatureFrost Days
0 to −2 °C
Frost Days <−2 °CMinimum TemperatureFrost Days
0 to −2 °C
Frost Days
<−2 °C
1958–2017 Phase I + II−4.9 °C4.55.1−2.1 °C2.51.21.2 °C0.40
1958–1987 (Phase I)−5.5 °C5.05.6−2.0 °C2.51.01.2 °C0.50
1988–2017 (Phase II)−4.2 °C4.04.5−2.3 °C2.61.41.2 °C0.40
Table 3. Phenological data of apple and pear trees from 1958 to 2017 in Klein-Altendorf.
Pheno Stage/Variety-PeriodBlossom StartFull BloomEnd of BloomFruit HarvestStart of Leaf DropEnd of Leaf DropFruit Developm. *Canopy Duration **
Pear
A. Lucas
1958–2017
17.04.21.04.30.04.22.09.28.10.10.11.154194
1958–198722.04.27.04.05.05.30.09.29.10.09.11.156190
1988–201713.04.16.04.24.04.15.09.26.10.11.11.152196
Apple
cv. Cox Orange
1958–201701.05.06.05.14.05.19.09.30.10.15.11.136182
1958–198706.05.11.05.18.05.22.09.30.10.14.11.134177
1988–201726.04.30.04.09.05.16.09.29.10.16.11.139186
Roter Boskoop
1958–201727.04.02.05.12.05.29.09.04.11.20.11.150191
1958–198703.05.09.05.18.05.01.10.05.11.18.11.145186
1988–201721.04.25.04.05.05.27.09.03.11.22.11.155196
Golden Delicious
1958–201701.05.05.05.14.05.04.10.07.11.26.11.152190
1958–198706.05.11.05.20.05.10.10.09.11.28.11.152187
1988–201726.04.29.04.09.05.28.09.05.11.26.11.152193
* Fruit development in days from full bloom (BBCH 65; Fleckinger F2) to harvest. ** Canopy duration as defined in days between the start of flowering (BBCH 61; F) and of leaf drop (BBCH 93).
Table 4. Advancement of phenological stages (comparison phase II with phase I) and vegetation period in days based on 60 years of records at Klein-Altendorf [days].
Phenology StageBBCH StageGolden DeliciousRoter BoskoopCox OrangeA. Lucas
Full bloom6512141111
Harvest starts87124615
Begin leaf drop
Begin of chilling
934213
Harvest to leaf dropn.a.82512
Tree canopy durationn.a.61096
n.a.—not applicable.
Publisher’s Note: MDPI stays neutral with regard to jurisdictional claims in published maps and institutional affiliations.

