Article

Morphological and Physiological Responses of In Vitro-Grown Cucurbita sp. Landraces Seedlings under Osmotic Stress by Mannitol and PEG

by
Rana Panahi Tajaragh
1,
Farzad Rasouli
1,*,
Mousa Torabi Giglou
2,
Seyed Morteza Zahedi
1,
Mohammad Bagher Hassanpouraghdam
1,
Mohammad Ali Aazami
1,
Anna Adámková
3 and
Jiří Mlček
3,*
1
Department of Horticulture, Faculty of Agriculture, University of Maragheh, Maragheh 55187-79842, Iran
2
Department of Horticulture, Faculty of Agriculture, University of Mohaghegh Ardabili, Ardabil 56199-11367, Iran
3
Department of Food Analysis and Chemistry, Faculty of Technology, Tomas Bata University in Zlin, Vavreckova 5669, 760 01 Zlin, Czech Republic
*
Authors to whom correspondence should be addressed.
Horticulturae 2022, 8(12), 1117; https://doi.org/10.3390/horticulturae8121117
Submission received: 2 November 2022 / Revised: 23 November 2022 / Accepted: 25 November 2022 / Published: 28 November 2022
(This article belongs to the Collection Application of Tissue Culture to Horticulture)

Abstract

:
Screening and identification of tolerant genotypes using osmotic materials under in vitro culture could be rapid, easy, and even accurate. In this research, three Iranian landraces of Cucurbita sp. included Tanbal Ajili (Cucurbita maxima Duch.), Ajili Razan (Cucurbita pepo L.), and Balghabakhi (Cucurbita moschata Duch.) seeds were cultured in ¼ MS medium. After germination, plantlets were transferred to MS media containing mannitol and PEG 6000. Mannitol and PEG at three concentrations of 0.1, 0.2, and 0.4 M and 0.009, 0.012, and 0.015 M, respectively, were added into the MS medium, while the MS medium without any adding was used as control. Our findings revealed that osmotic treatments significantly increased shoot and root dry weight (DW), malondialdehyde (MDA), and proline content, but significantly reduced coleoptile length, shoot and root fresh weight, and photosynthesis pigments content. Protein content, phenols, and flavonoids content, enzymatic and non-enzymatic antioxidant including ascorbate peroxidase (APX), guaiacol peroxidase (GPX), superoxide dismutase (SOD), catalase (CAT), glutathione reductase (GR) activity, reduced ascorbate (AsA), reduced ascorbate/dehydroascorbic acid (AsA/DHA), reduced glutathione (GSH), dehydroascorbic acid (DHA) and oxidized glutathione (GSSG), and reduced glutathione/oxidized glutathione (GSH/GSSG) were significantly increased at moderate osmotic stress induced by mannitol and PEG. In contrast, the previous physiological parameters were significantly reduced at higher water deficit conditions. With respect to most attributes and concentrations, mannitol simulated osmotic stress better than PEG. Our results revealed that applying PEG and mannitol under in vitro conditions could be an efficient way to evaluate and screen cucurbit genotypes for future breeding programs.

1. Introduction

Global food security is being troubled by a rapid upsurge in population and severe changes in the climate [1]. Drought stress is one of the most significant changes that can have adverse effects on plant growth and development and also influences morphological, physiological, and biochemical processes of plants [2,3], which leads to changes in some of the primary and secondary metabolites [4]. The first consequence of drought stress is reducing turgor pressure due to the exceeding transpiration rate [5,6]. Afterward, drought stress lessens plant size, height, and leaves number and reduces photosynthesis rate by decreasing leaf area and chlorophyll synthesis [7]. Drought stress leads to the production of reactive oxygen species (ROS) such as superoxide, hydroxyl, and hydrogen radicals in plants, limiting plant growth with oxidative damage. In study on Allium hirtifolium stated that plant response to drought depends on the duration and intensity of water deficit, genotype, and stage of plant development [8].
Given the environmental challenges encountering agriculture productions, the evaluation, screening, and identification of genotypes are critical for the genetic improvement of crops [9]. A valuable strategy is needed to sustain or enhance crops yield and quality [10] in abiotic and biotic conditions such as drought stress.
Identifying drought-tolerant plants through conventional methods (in field conditions) is time-consuming and sometimes impossible. Therefore, several techniques have been used to select drought-tolerant genotypes in plants such as in vitro culture, which is used to evaluate and identify drought-tolerant plants or other unfavorable conditions. Screening and identifying tolerant landraces by in vitro culture is a rapid, easy and accurate technique [11]. Then, in vitro culture may be a usable technique as an alternative to field assessment to appraise the effects of water-deficit on morphological and physiological traits plants response strategies and to select tolerant genotypes.
To simulate the drought stress in tissue culture conditions, osmotic materials such as polyethylene glycol (PEG), sorbitol, and/or mannitol can be applied [12]. PEG, mannitol, and other osmotic materials can decrease water potential and simulate water deficits in in vitro culture media. The high polarity of PEG increases hydrophilicity and then increases water solubility [13]. PEG does not react with chemicals, or biological compounds, is non-toxics, and cannot be absorbed by plants. Furthermore, its concentration stays constant during stress [14]. Mannitol is water-soluble polyhydric alcohol (polyols) with 60% sweetness of sucrose and is produced from corn syrup and synthesized from glucose. Still, it is also naturally detected in Rosaceae family plants such as apples, pears, peaches, and prunes [15].
The cucurbiaceae family are herbaceous plants, that are distributed in tropical and subtropical regions of the world. Cucurbita pepo L., Cucurbita maxima Duch, and Cucurbita moschata Duch. are all edible and represent some of most important species of this family. Many local varieties of these plants are diffused in Iran. These local varieties, cultivated under vastly different environmental conditions and selective pressure, might have plastic attributes such as tolerance to abiotic stress usable use for genetic improvement. Their evaluation and identification represent the first steps in breeding and genetic programs.
Although many researches have been accomplished on the effects of drought stress in cucurbitaceous family in field and greenhouse condition [16,17,18] as well as some studies have been conducted using osmotic agent by making of in vitro and in vivo culture drought stress condition in some plants [11,12,14]. However, no experiments have been carried out via assessment and screening of Cucurbita sp. to osmotic stress under in vitro culture.
This experiment aims to evaluate the morphological and physiological responses, focusing on the enzymatic and non-enzymatic antioxidant activities to the water deficit conditions induced by PEG and mannitol, using as tool for rapidly screening of a large number of plantlets. Therefore, the following objectives were addressed: (1) rapid and precise identification of the tolerant genotype that we assessed seven days after the use of the osmotic solution; (2) identification of morphological and physiological markers for selecting drought-tolerant cucurbits under tissue culture conditions; and (3) testing of two molecules capable of generating osmotic stress to evaluate which one is more efficient under the culture condition to be used as stressor. We selected three Iranian landraces of cucurbits with different characteristics to achieve these goals.

2. Materials and Methods

2.1. Plant Growth Condition, Experimental Design, and Treatments

Three Iranian landraces of Cucurbita sp. included Tanbal Ajili (TA) (Cucurbita maxima Duch.), Ajili Razan (RA) (Cucurbita pepo L.), and Balghabakhi (BG) (Cucurbita moschata Duch.), whose seeds were collected from Hamedan (34.7989° N, 48.5150° E), Razan (35.3925° N, 49.0329° E) and Ajbashir (37.4788° N, 45.8929° E), respectively. The seeds were collected from twenty plants of TA, twenty-six plants of RA, and forty plants of BG in local farms (Figure 1). Any time one hundred seeds were pre-treated with 10% sodium hypochlorite (NaClO, Merck, DarmStasdt, Germany) solution for 15 min, and then subsequently washed with distilled water, and air-dried to avoid fungal infection. Seeds were cultured in ¼ MS medium (Murashige and Skoog, 1962). After germination, seedlings were transferred into MS media containing mannitol (Merck, DarmStasdt, Germany) and PEG 6000 (Merck, DarmStasdt, Germany) with each seedling transferred in a vessel with 50 mL of the media and then moved to a growth chamber. The growth chamber condition had a photoperiod of 16/8 h of light/dark, a temperature of 25 °C, 16,000 lux light intensity, and a relative humidity of 70 ± 5%. The MS medium without any osmotic molecules added was used as control and it containing 8 g L−1 agar and 30 g L−1 sucrose at the value of medium osmotic potential of 0.4 MPa. The mannitol was added into the media at the concentrations of 0.1, 0.2, and 0.4 M, determining the following values of medium osmotic potentials −0.88, −1.12, and −1.80 MPa, respectively that estimated by Reid [19] formula. The PEG was also added into the media at three different concentrations of 0.009, 0.012, and 0.015 M, corresponding at the values of the medium osmotic potentials of−0.55, −0.87 and −1.2 MPa, as determined by Michel and Kaufmann [20] formula applied to MS medium. This experiment was laid out as factorial based on a completely randomized design (CRD) with three replications with three replicates and thirty seedlings in each experimental plot, and sampling was carried out seven days after transferring the seedling into the vessel, in other words the seedling placed under the PEG and mannitol treatments for seven days. To ensure the results each analysis was repeated thrice.

2.2. Hypocotyl Length, Shoot and Root Fresh and Dry Weight

The hypocotyl length (the part of embryonic axis between radicle and cotyledonary node) was determined using a digital caliper and recorded in mm. Shoot and root fresh weight (FW) was measured using a weighing scale in gram (A&D, GR-200, Japan, 0.01 accuracy), and then the samples were dried using an oven (ValadKhani, Tehran, Iran) at 70 °C for 24 h. Finally, the shoot and root dry weight (DW) percentage was estimated as the following formula:
% Shoot or root DW = (shoot or root DW/shoot and root FW) × 100.

2.3. Photosynthetic Pigments

Chlorophylls (Chl a and b) and carotenoids (CARs) were determined by spectrophotometer (UV-1800, Shimadzu, Tokyo, Japan), and using equations described by the Arnon method [21]. The leaf tissue (0.5 g) was homogenized by liquid nitrogen and extracted with 10 mL of 80% acetone (Dr. Mojallali, Iran) using a mortar and pestle. The absorbance was measured at 664 nm, 647 nm, and 470, and finally the photosynthesis pigments content was estimated with the following Equations (1)–(3).
Chlorophyll a mg/kg FW = [12.7(A663) − 2.69(A645)]
Chlorophyll b mg/kg FW = [21.50(A645) − 5.10(A663)]
Carotenoids = [1000(A470) − 1.82Chl a − 85.02Chl b]/198
where A663 = absorbance at 663 nm, A645 = absorbance at 645 nm, and A470 = absorbance at 470 nm. 12.7 and 5.10 are the absorbance coefficient for the red peak of Chl a; and 2.69 and 21.50 are the absorbance coefficient for the red peak of Chl b; 1000, 1.82, and 85.02 are the absorbance coefficient for the blue peak of carotenoids.

2.4. Total Proline Content

0.5. g of fresh leaf was homogenized in a 10 mL of 3% sulphosalicylic acid centrifuged (Hermel, Labortechnik, Wehingen, Germany) at 11,180× g for 20 min at 4 °C, then 2 mL of ninhydrin and 2 mL of glacial acetic acid were added to the supernatant. The mixture was heated in a water bath for 60 min, immediately cooled on ice for 5 min and 4 mL of toluene was added and vortexed (Dragon LAB-MAX-S, Beijing, China) for 20 s. The absorbance was read at 520 nm by a spectrophotometer [22]. Proline concentration was determined using a calibration curve and expressed as µmol g−1 FW. All of the reagents were purchased from Merck, DarmStasdt, Germany.

2.5. Malondialdehyde (MDA) Content

The MDA content was measured according to Heath and Packer method [23], and 0.5 g of fresh leaf tissue was homogenized in a 1.5 mL TCA (trichloroacetic acid %1 w/v, from Sigma Aldrich, St. Louis, MO, USA), then centrifuged at 11,180× g for 10 min at 4 °C and 1 mL TBA (thiobarbituric acid %0.1 w/v, from Sigma Aldrich) added to 500 μL of the supernatant. The mixture was heated at 95 °C for 30 min and cooled down on the ice for 15 min. Finally, the absorbance was spectrophotometrically detected at 532 and 600 nm. The molar extinction coefficient of MDA was 155 cm−1 mM−1 that strongly MDA absorbs light at 532 nm, per molar concentration and expressed as nmol g−1 FW.

2.6. Total Soluble Protein Content

Fresh leaf samples (0.2 g) were homogenized in 1.5 mL of 50 mM sodium buffer phosphate (pH = 7.8) including 1 mM EDTA and 2% (w/v, acquired from Merck, DarmStasdt, Germany) polyvinylpolypyrolidone (PVPP, purchased from Titrachem, Bazar Kimia Tehran, Iran). The homogenate was centrifuged at 16,099 rpm for 15 min at 4 °C. Supernatants were applied for total soluble protein and enzyme activity assay.
The Bradford method [24] was used for total soluble protein content. Bovine Serum Albumin (BSA, acquired from Sigma Aldrich) was employed as standard so that six standard solutions containing 0, 0.2, 0.4, 0.6, 0.8, and 1 mg ml−1 were prepared. 100 μL Bradford solution was added to each of the standards. For preparing the Bradford reagent, 50 mg of Coomassie Brilliant Blue G-250 was dissolved in 50 mL of methanol (Dr. Mojallali, Iran) and 100 mL 85% (w/v) phosphoric acid (Titracheme, Bazar Kimia Tehran, Iran). The solution was added into 850 mL H2O and filtered through Whatman filter paper #1. Finally, 1000 μL of the Bradford reagent was added to 50 μL buffer phosphate extract and incubated for 5 min. The absorbance was read at 595 nm and expressed as mg g−1 FW.

2.7. Total Phenol Content (TPC)

For measurement of TPC, 1 g of fresh leaf tissue was extracted by acidic methanol and centrifuged at 12,000 rpm for 10 min. Then, 1.59 mL of distilled water, 100 μL of 10% Folin-Ciocalteu and 20 μL of the extract were mixed and stored for 10 min. Finally, 300 μL of 7.5% sodium carbonate (Titracheme, Bazar Kimia Tehran, Iran) was added to the mixture and kept in the dark for 2 h. Ultimately, the absorbance was determined at 765 nm with a UV spectrophotometer that was calculated as mg g−1 FW [25].

2.8. Total Flavonoids Content (TFC)

For assessment of TFC, 1 g of fresh tissue was homogenized in methanol 80% and centrifuged at 21,913· g for 15 min. Then, 200 μL of the supernatant, 600 μL of 95% methanol, 40 μL of 10% aluminum chloride (Merck, DarmStasdt, Germany) 40 μL of 1 M potassium acetate, and 1120 μL of distilled water were mixed and kept at room temperature for 40 min. The absorbance was recorded at 415 nm, presented as mg g−1 FW [26].

2.9. H2O2 Content

To measure the H2O2 (Dr. Mojallali, Iran) content, 0.5 g of leaf fresh weight was extracted by 5 mL trichloroacetic acid (0.1% w/v) on ice bath. The homogenate was centrifuged at 16,099· g for 20 min and stored the supernatant. Then, 500 μL of the supernatant was mixed to 500 μL potassium phosphate buffer 10 mM (pH = 6.8) and 1000 μL KI (1 M). Later, the absorbance (UV-1800 Shimadzu, Japan) was determined spectrophotometrically at 390 nm. H2O2 content was measured through a standard calibration curve previously made from several H2O2 concentrations and calculated as μM g−1 FW [27].

2.10. Enzymatic Antioxidants Activity

2.10.1. Ascorbate Peroxidase Activity (APX)

APX activity was assayed according to the Nakano and Asada [28] method. The assay was determined with the oxidation of ascorbate by APX. The reaction mixture included 2550 μL 0.5 mM ascorbate, 450 μL 3% H2O2, and 50 μL extract recorded at 290 nm. The SOD activity was defined as µM min−1 mg−1 FW.

2.10.2. Guaiacol Peroxidase Activity (GPX)

GPX activity was measured by reducing H2O2 with the oxidation of guaiacol by Kumar and Khan [29] method. The reaction mixture was 1500 μL sodium buffer phosphate (100 mM) pH: 7, 120 μL H2O2 (15 mM), 480 μL guaiacol (20 mM) and 50 μL of enzyme extract. Subsequently, the increase in absorbance was recorded at 470 nm. The GPX activity was defined as µM min−1 mg−1 FW.

2.10.3. Superoxide Dismutase Activity (SOD)

SOD activity was determined according to the Nakano and Asada [28] method. The creation mixture was 100 μL sodium carbonate (1.5 mM), 200 μL methionine (0.2 M, acquired from LOBAcheme, Mombai, India), 100 μL EDTA (3 mM), 1500 μL sodium phosphate buffer (0.1 M), 900 μL distilled water, 100 μL nitro blue tetrazolium (2.25 mM, acquired from Merck, DarmStasdt, Germany) and 50 μL extract enzyme. Finally, the reaction was started by addition of 100 μL riboflavin (60 μM). The reaction mixture was treated at 25 °C for 15 min under the light. The absorbance was recorded at 560 nm and the reaction mixture without enzyme extract was used as control. SOD activity was defined as µM min −1 mg FW.

2.10.4. Glutathione Reductase (GR) Activity

Glutathione Reductase (GR) activity was measured by a reaction mixture including 200 mM phosphate buffer (pH = 7.5), 6.3 mM EDTA, 3 mM 5,5′-dithiobis-2-benzoic acid or DTNB dissolved in phosphate buffer, 2 mM NADPH, and 100 μL of the extract. The reaction was beginning with the addition of 2 mM glutathione oxide and the absorbance was read at 412 nm for 60 s. GR activity was measured based on the extinction coefficient for DTNB (14.15 mM−1cm−1) and was expressed as µM min−1 mg−1 FW [30]. All of the reagents were acquired from Sigma Aldrich.

2.11. Non-Enzymatic Antioxidants Activity

The leaf fresh tissue was extracted with 1 mL of metaphosphoric acid. The reduced ascorbate (AsA) was measured using 150 μM phosphate buffer (pH = 7.4) and 200 μL of distilled water. Then, 400 μL of 10% trichloroacetic acid, 400 μL of 44% phosphoric acid, 400 μL of 4% bipyridyl in 70% ethanol and 200 μL of 3% FeCl3 were added. The mixture was incubated at 37 °C for 60 min. The absorbance was read at 525 nm. For the total ascorbate assay, 100 μL of 10 mM dithiothreitol (DTT) was appended to the reaction mixture and measured concerning a standard AsA curve prepared in the same way above. The reduced AsA was calculated using the previous procedure, replacing 0.1 mL of DTT with 0.1 mL of distilled water. Finally, the dehydroascorbate (DHA) content was determined from the difference between total AsA and reduced AsA, and they were stated as nM g−1 FW [31]. All of the reagents were acquired from Sigma Aldrich.
The method is based on the oxidation of the reduced glutathione (GSH) by 5,5’-dithio-bisnitrobenzoic acid (DTNB), and oxidized glutathione (GSSG) is reduced to GSH by the action of GR and NADPH. The leaf fresh tissues were homogenized in 2 mL of 5% sulfosalicylic acid solution and then centrifuged at 15,000 rpm for 10 min and the supernatant was collected. Then, 700 μL of 0.3 mM NADPH, 100 μL of DTNB, 150 μL of 125 mM phosphate buffer (pH 6.5) containing EDTA 6.3 mM were mixed to 50 μL of the supernatant with triethanolamine. Finally, 0.1 unit of glutathione reductase enzyme was added. The absorbance was traced at 412 nm. The total glutathione, GSH, and GSSG were utilized for the standard curve calibration and were expressed as nmol g−1 FW [32]. All of the reagents were purchased from Sigma Aldrich.

2.12. Statistical Analysis

The analyses included different treatments, different concentrations of mannitol and PEG, and three Cucurbita species. The ANOVA of the experimental data was conducted by a general linear method (GLM) using the MSTAT-C software (ver. 2.10), and the mean comparison was performed using the multi-domain Duncan test at p ≤ 0.05. Pearson correlation and cluster dendrogram heat maps were performed in R foundation for statistical computing (version 4.1.2), Iran (2021). URL https://cran.um.ac.ir/, accessed on 3 June 2022.

3. Results

3.1. Hypocotyl Length

The ANOVA revealed that the induced osmotic stress by mannitol and PEG significantly affected the morphological traits of the seedlings of the three genotypes at p ≤ 0.01. The hypocotyl length showed a significant decrease in the genotypes treated with mannitol and PEG compared to the controls. The hypocotyl length was highest in the control of RA, and the lowest was the seedling of BG under 0.4 M of mannitol. The highest reduction was observed in TA by 486%, while the lowest belonged to RA by 219% when it was treated with 0.015 M of PEG in comparison with the control plants (Table 1).

3.2. Shoot and Root FW and DW

The results showed that shoot FW was reduced in all of the genotypes, enhancing the concentration of mannitol and PEG. The highest shoot fresh weight was observed in control of BG, and the least value was recorded in TA cultured under 0.015 M of PEG. Shoot FW reduced up to 161% in TA compared to the control and scored the highest decrement, while RA up to 127% had the lowest decrement (Table 1).
The results showed that shoot DW increased significantly compared to the control by applying mannitol and PEG. The highest shoot DW value was recorded in BG under 0.4 M of mannitol and the lowest value in control of RA. Shoot DW of BG was enhanced more than RA and TA under osmotic stress. Therefore, it was increased 165% and 92% with the application of 0.4 M of mannitol and 0.015 M of PEG, respectively (Table 1).
Osmotic stress induced by osmotic agents decreased the root FW of the cucurbit genotypes compared to control. The highest root FW value was revealed in control of BG and TA and the lowest was recorded in TA at 0.4 M of mannitol (Table 1). The highest and the most inferior decrement was recorded in TA up to 483% and RA up to 162% at 0.4 M mannitol and 0.015 M PEG compared to control, respectively (Table 1).
All of the genotypes treated with mannitol and PEG showed a significant increment in root DW over the controls. The highest root DW value was observed in BG under 0.2 M mannitol and the lowest was in control of TA. The results indicated that PEG treatment increased root DW more than mannitol in TA, while it was reduced in the other two genotypes. The highest and the lowest increase of root DW belonged to TA (94.19%) and RA (56.26%) at 0.015 M PEG and 0.4 M mannitol compared to control, respectively (Table 1).

3.3. Photosynthesis Pigments

The photosynthetic pigments content (i.e., Chl a, b, a + b) and CARs showed a decrement pattern in the genotypes treated with mannitol and PEG compared to control. Furthermore, PEG reduced the photosynthetic pigments more than mannitol. According to the results, the highest Chl a was observed in the control of BG and BG treated with 0.009 M of PEG, and the lowest data was observed in TA subjected to 0.015 M PEG. The least reduction of Chl a by 73% was shown in BG, while, a marked decrease (341%) was recorded in RA (Table 2). The maximum Chl b content was traced in the control of BG and, the lowest data was recorded in TA under 0.015 M of PEG. The content of Chl b in two genotypes of RA and TA was significantly lower than BG (Table 2). Furthermore, the lowest reduction of total Chl the same as Chl a and Chl b was observed in BG (100%) and the highest in RA (348%) (Table 2).
The highest CARs content was observed in control of TA and BG and the lowest in TA at 0.4 M of mannitol and RA at 0.015 M of PEG. TA treated with 0.4 M of mannitol and BG treated with 0.015 M of PEG attained the highest and the least CARs content by 376% and 236%, respectively (Table 2).

3.4. Total Proline Content

An increased proline content was recorded in all of the genotypes in MS medium exposed to mannitol 0.009 and 0.012 M PEG, but it was declined in 0.015 M PEG. The results showed that the highest amount of proline was observed in TA under 0.4 M mannitol treatment, and the lowest was observed in RA at 0.0015 M of PEG. BG had the minimum enhancement up to 139%, while TA attained the maximum increase up to 253% (Table 3).

3.5. Total Soluble Protein Content

The total protein content in the three cucurbit genotypes amplified in lower concentrations of mannitol (0.1 and 0.2 M) and PEG (0.009 and 0.012 M). It then declined in higher concentrations of mannitol (0.4 M) and PEG (0.015 M). The highest total protein content was observed in BG under 0.012 M PEG, and the lowest was observed in control of RA (Table 3).

3.6. Total Phenol and Flavonoid Content

TPC and TFC content in the plants boosted at mild stress and reduced at intense osmotic stress conditions. The highest level in both traits was obtained in BG genotype treated with 0.1 M of mannitol. The lowest of TPC and TFC content was observed in the uppermost PEG concentration in TA and RA, respectively. A marked enhancement of TPC content (66%) belonged to BG under 0.1 M of mannitol and the lowest was displayed in RA (37%) at 0.1 M of mannitol (Table 3).

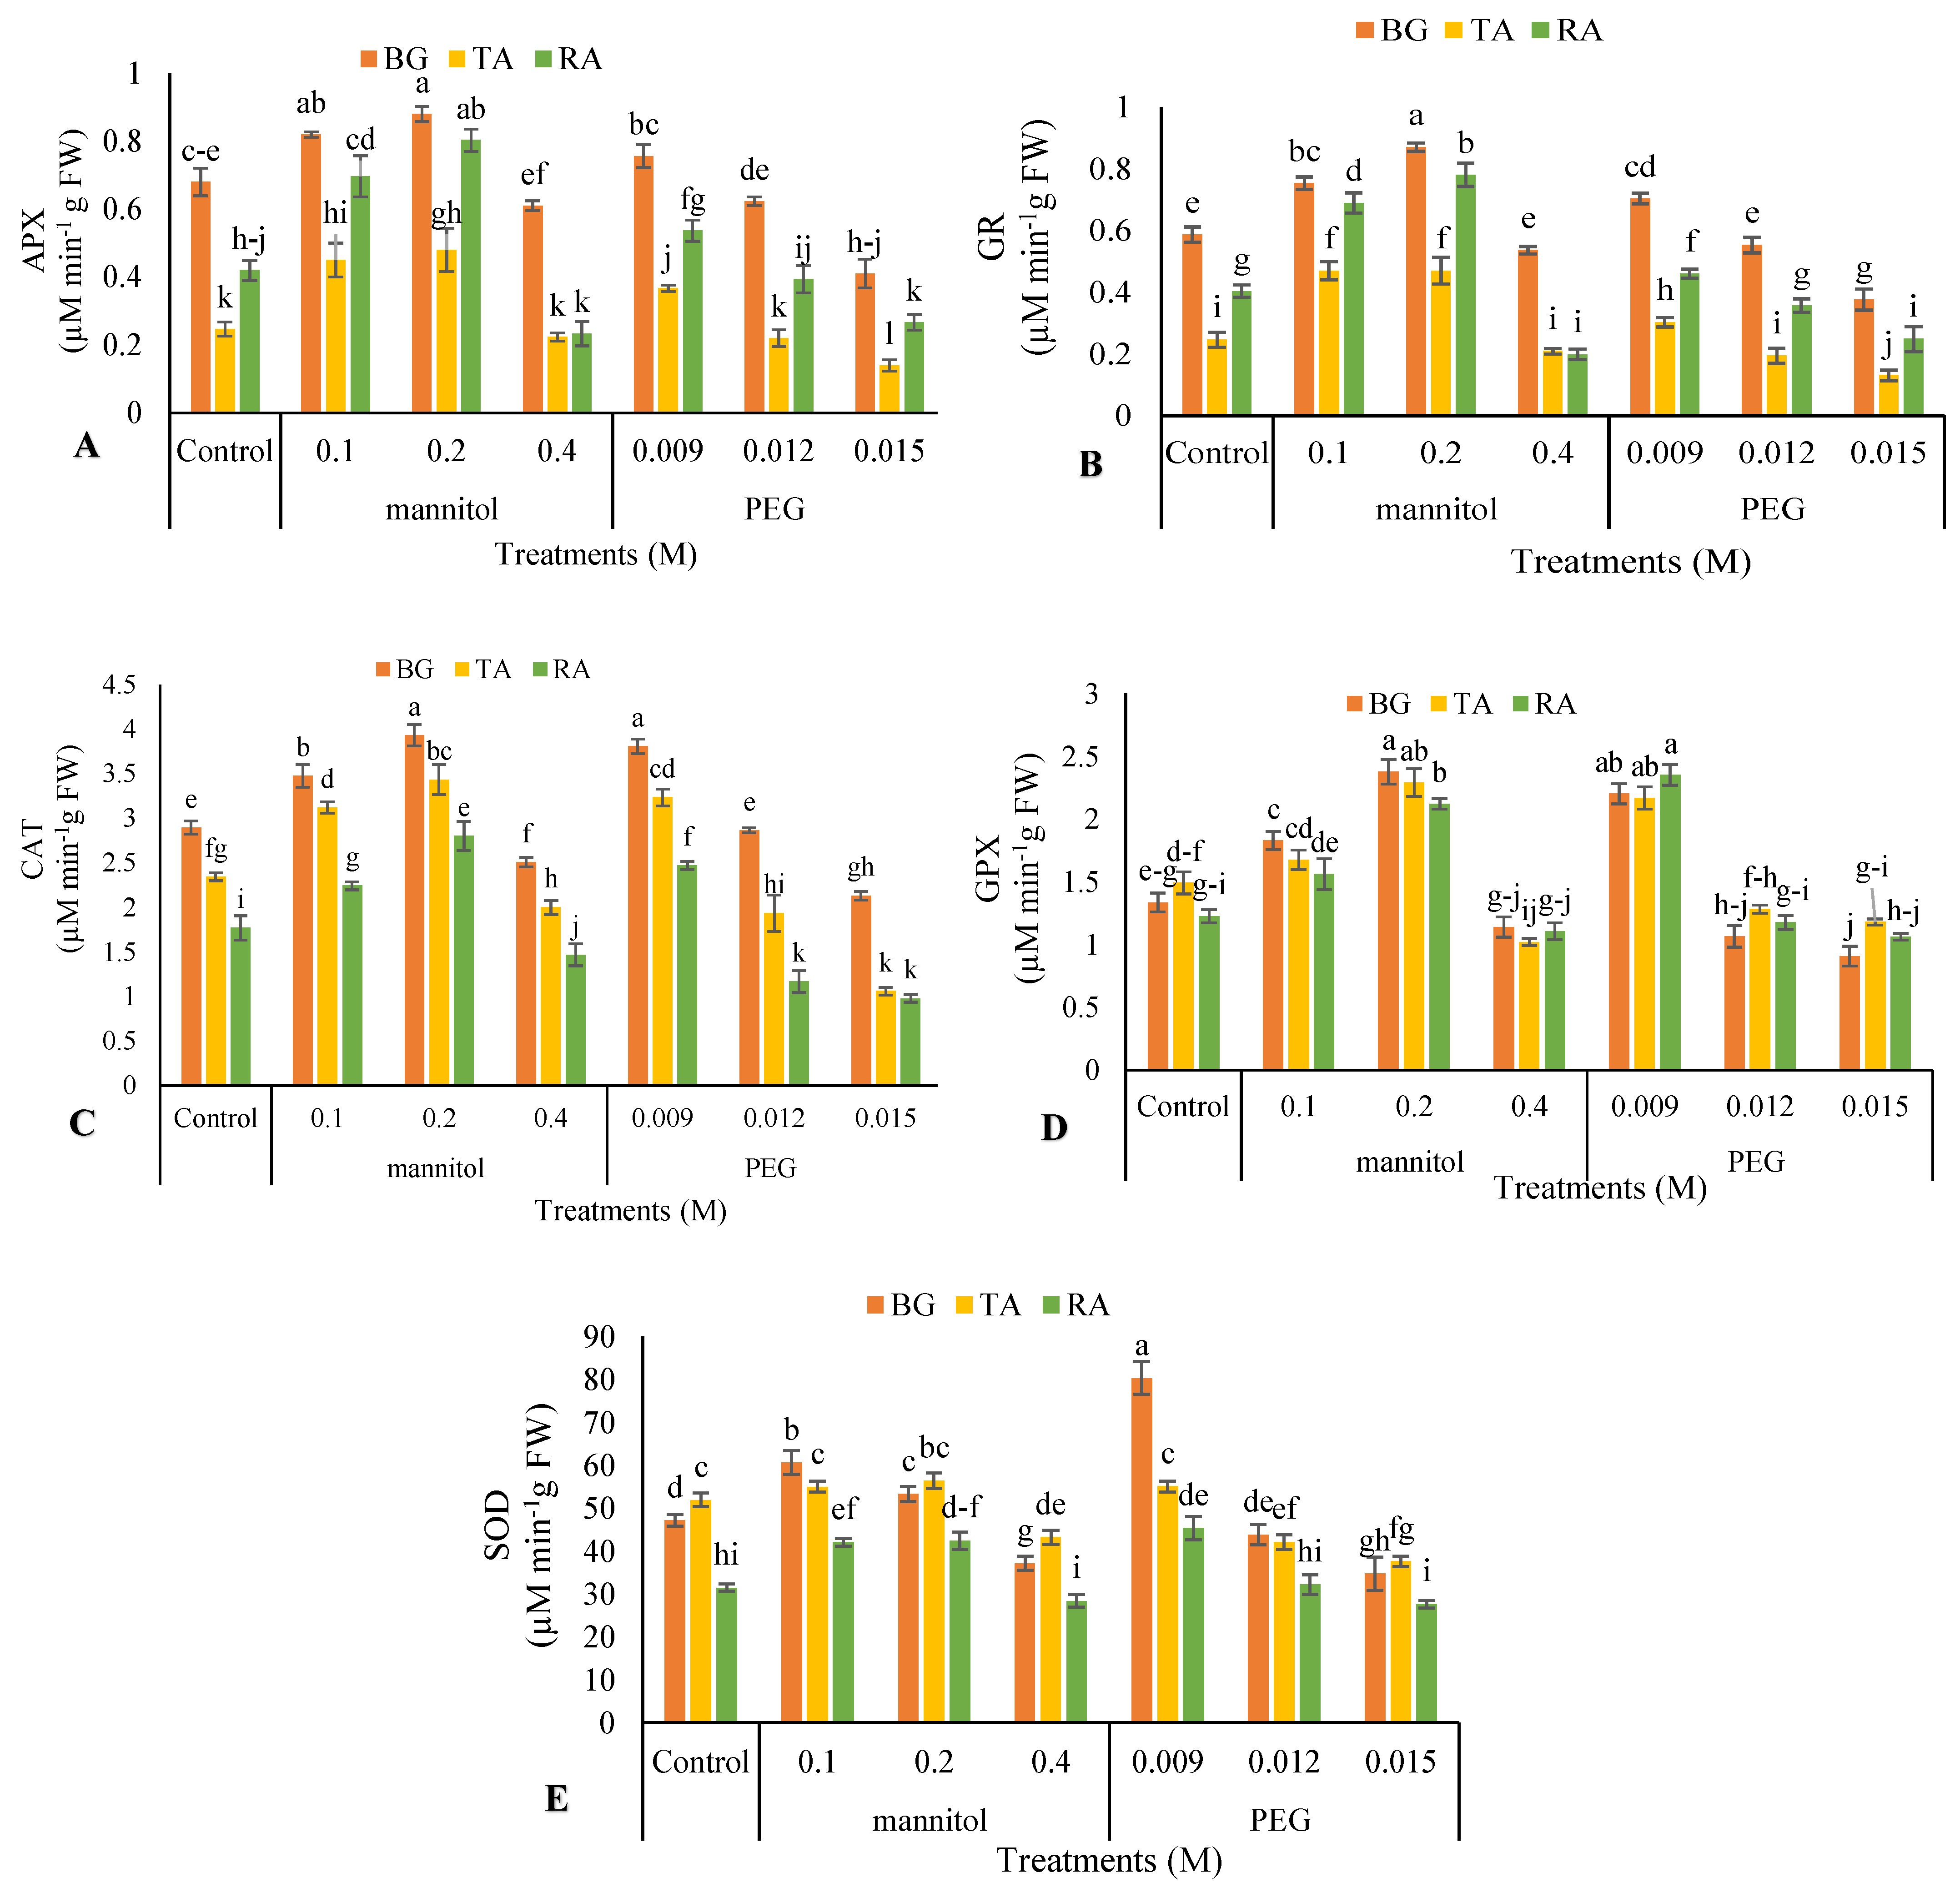
3.7. Enzymatic Antioxidant Activity

The antioxidant enzyme activity were significantly influenced using the osmotic materials and cucurbit varieties (Table 4). APX and GR activity in all of the genotypes boosted in 0.1 and 0.2 M of mannitol as well as in 0.009 M of PEG, but reduced in the higher concentrations of mannitol and PEG. The utmost APX and GR activity was detected in BG under 0.2 M of mannitol, while the lowest was detected in TA with 0.015 M of PEG. The uppermost increase of APX activity was traced in TA genotype (94%) and for GR activity was noted in RA genotype (93%), and the lowest was recorded in BG for APX activity (29%) and GR activity (48%) at 0.2 M of mannitol treatment (Figure 2A,B).
CAT activity in the genotypes was improved in 0.1 and 0.2 M of mannitol and in 0.009 M of PEG, but diminished in the higher concentrations of mannitol and PEG. The highest CAT activity was obtained in BG genotype under 0.2 M of mannitol and 0.009 M of PEG, while, the lowest activity was obtained in RA under 0.012 and 0.015 M of PEG and TA at 0.015 M of PEG treatment. Finally, the highest augmentation was recorded in RA genotype (58%), and the lowest was recorded in BG genotype (35%) at 0.2 M of mannitol treatment (Figure 2C).
GPX activity in all of the genotypes was increased in 0.1 and 0.2 M mannitol and in 0.009 M PEG, and then reduced in higher concentration. The most and least GPX activity was detected in BG under 0.2 M of mannitol and 0.015 M of PEG treatment, respectively. Our findings revealed that the highest increase was noted in RA genotype (91%) at 0.2 M of mannitol treatment and the lowest in TA (53%) at 0.009 PEG treatment (Figure 2D).
SOD activity in all of the genotypes was enhanced with 0.1 and 0.2 M of mannitol and in 0.009 M of PEG. Thereafter, it decreased in a higher concentration of the treatments. The utmost SOD activity was observed in BG under 0.009 M of PEG, while the least was observed in RA under 0.015 M PEG and 0.4 M mannitol. Our findings showed that the highest and lowest increase were obtained in BG (70%) at PEG of 0.009 M and TA (8%) at 0.2 M of mannitol, respectively (Figure 2E).

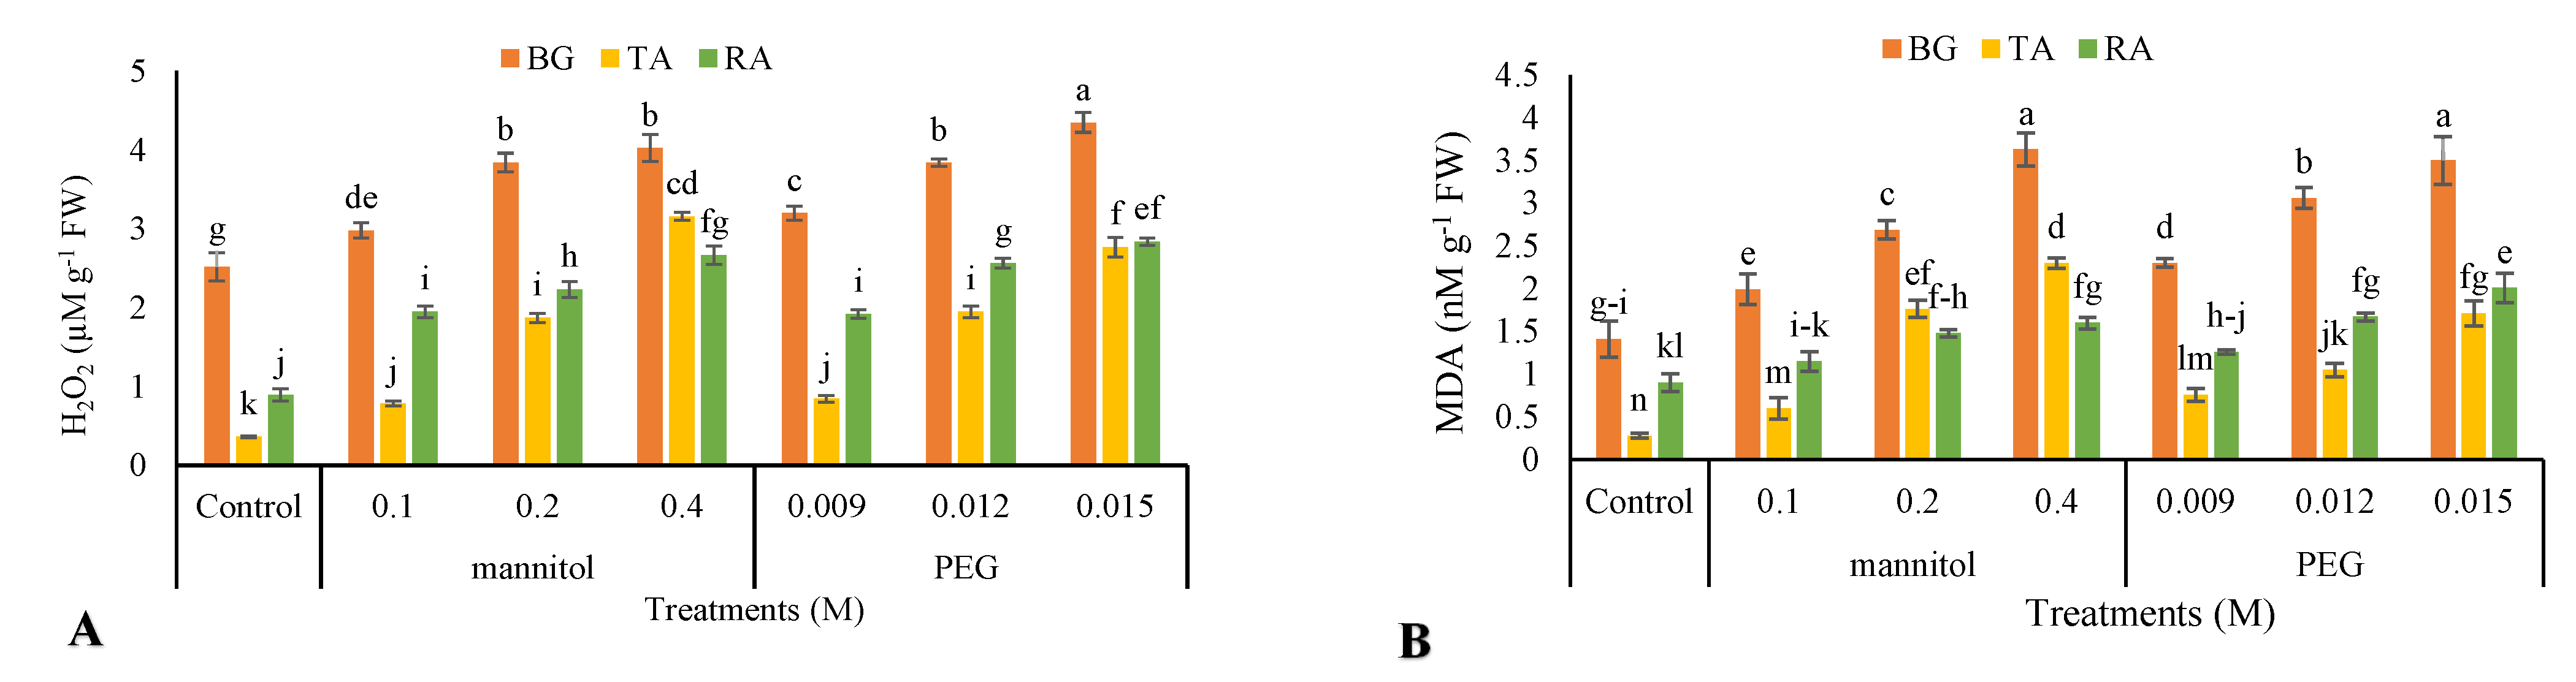
3.8. Malondialdehyde Content

Osmotic stress significantly increased MDA content relative to the control in the cucurbit species, and the highest MDA content was observed under the highest concentration of mannitol and PEG. The most MDA was observed in BG under 0.4 M mannitol and 0.015 M PEG, but the least was observed in control of TA. TA had the highest increase of MDA content (721%) under 0.4 M mannitol and RA revealed the least increasing (123%) cultured 0.015 M PEG compared to the control. In all genotypes, MDA content was increased more in the application of mannitol than PEG (Figure 3A).

3.9. Hydrogen Peroxide Content

H2O2 content was significantly affected by osmotic stress (Table 5). In all three genotypes, an increment was observed in H2O2 content by increasing osmotic materials over to the control. The highest H2O2 content was obtained under the highest PEG concentration added into the medium of BG species and, the lowest in species of TA control. The highest increase in H2O2 content was obtained in TA (769%) under the highest concentration of mannitol and the lowest belonged to BG (72%) at 0.15 M of PEG (Figure 3B).

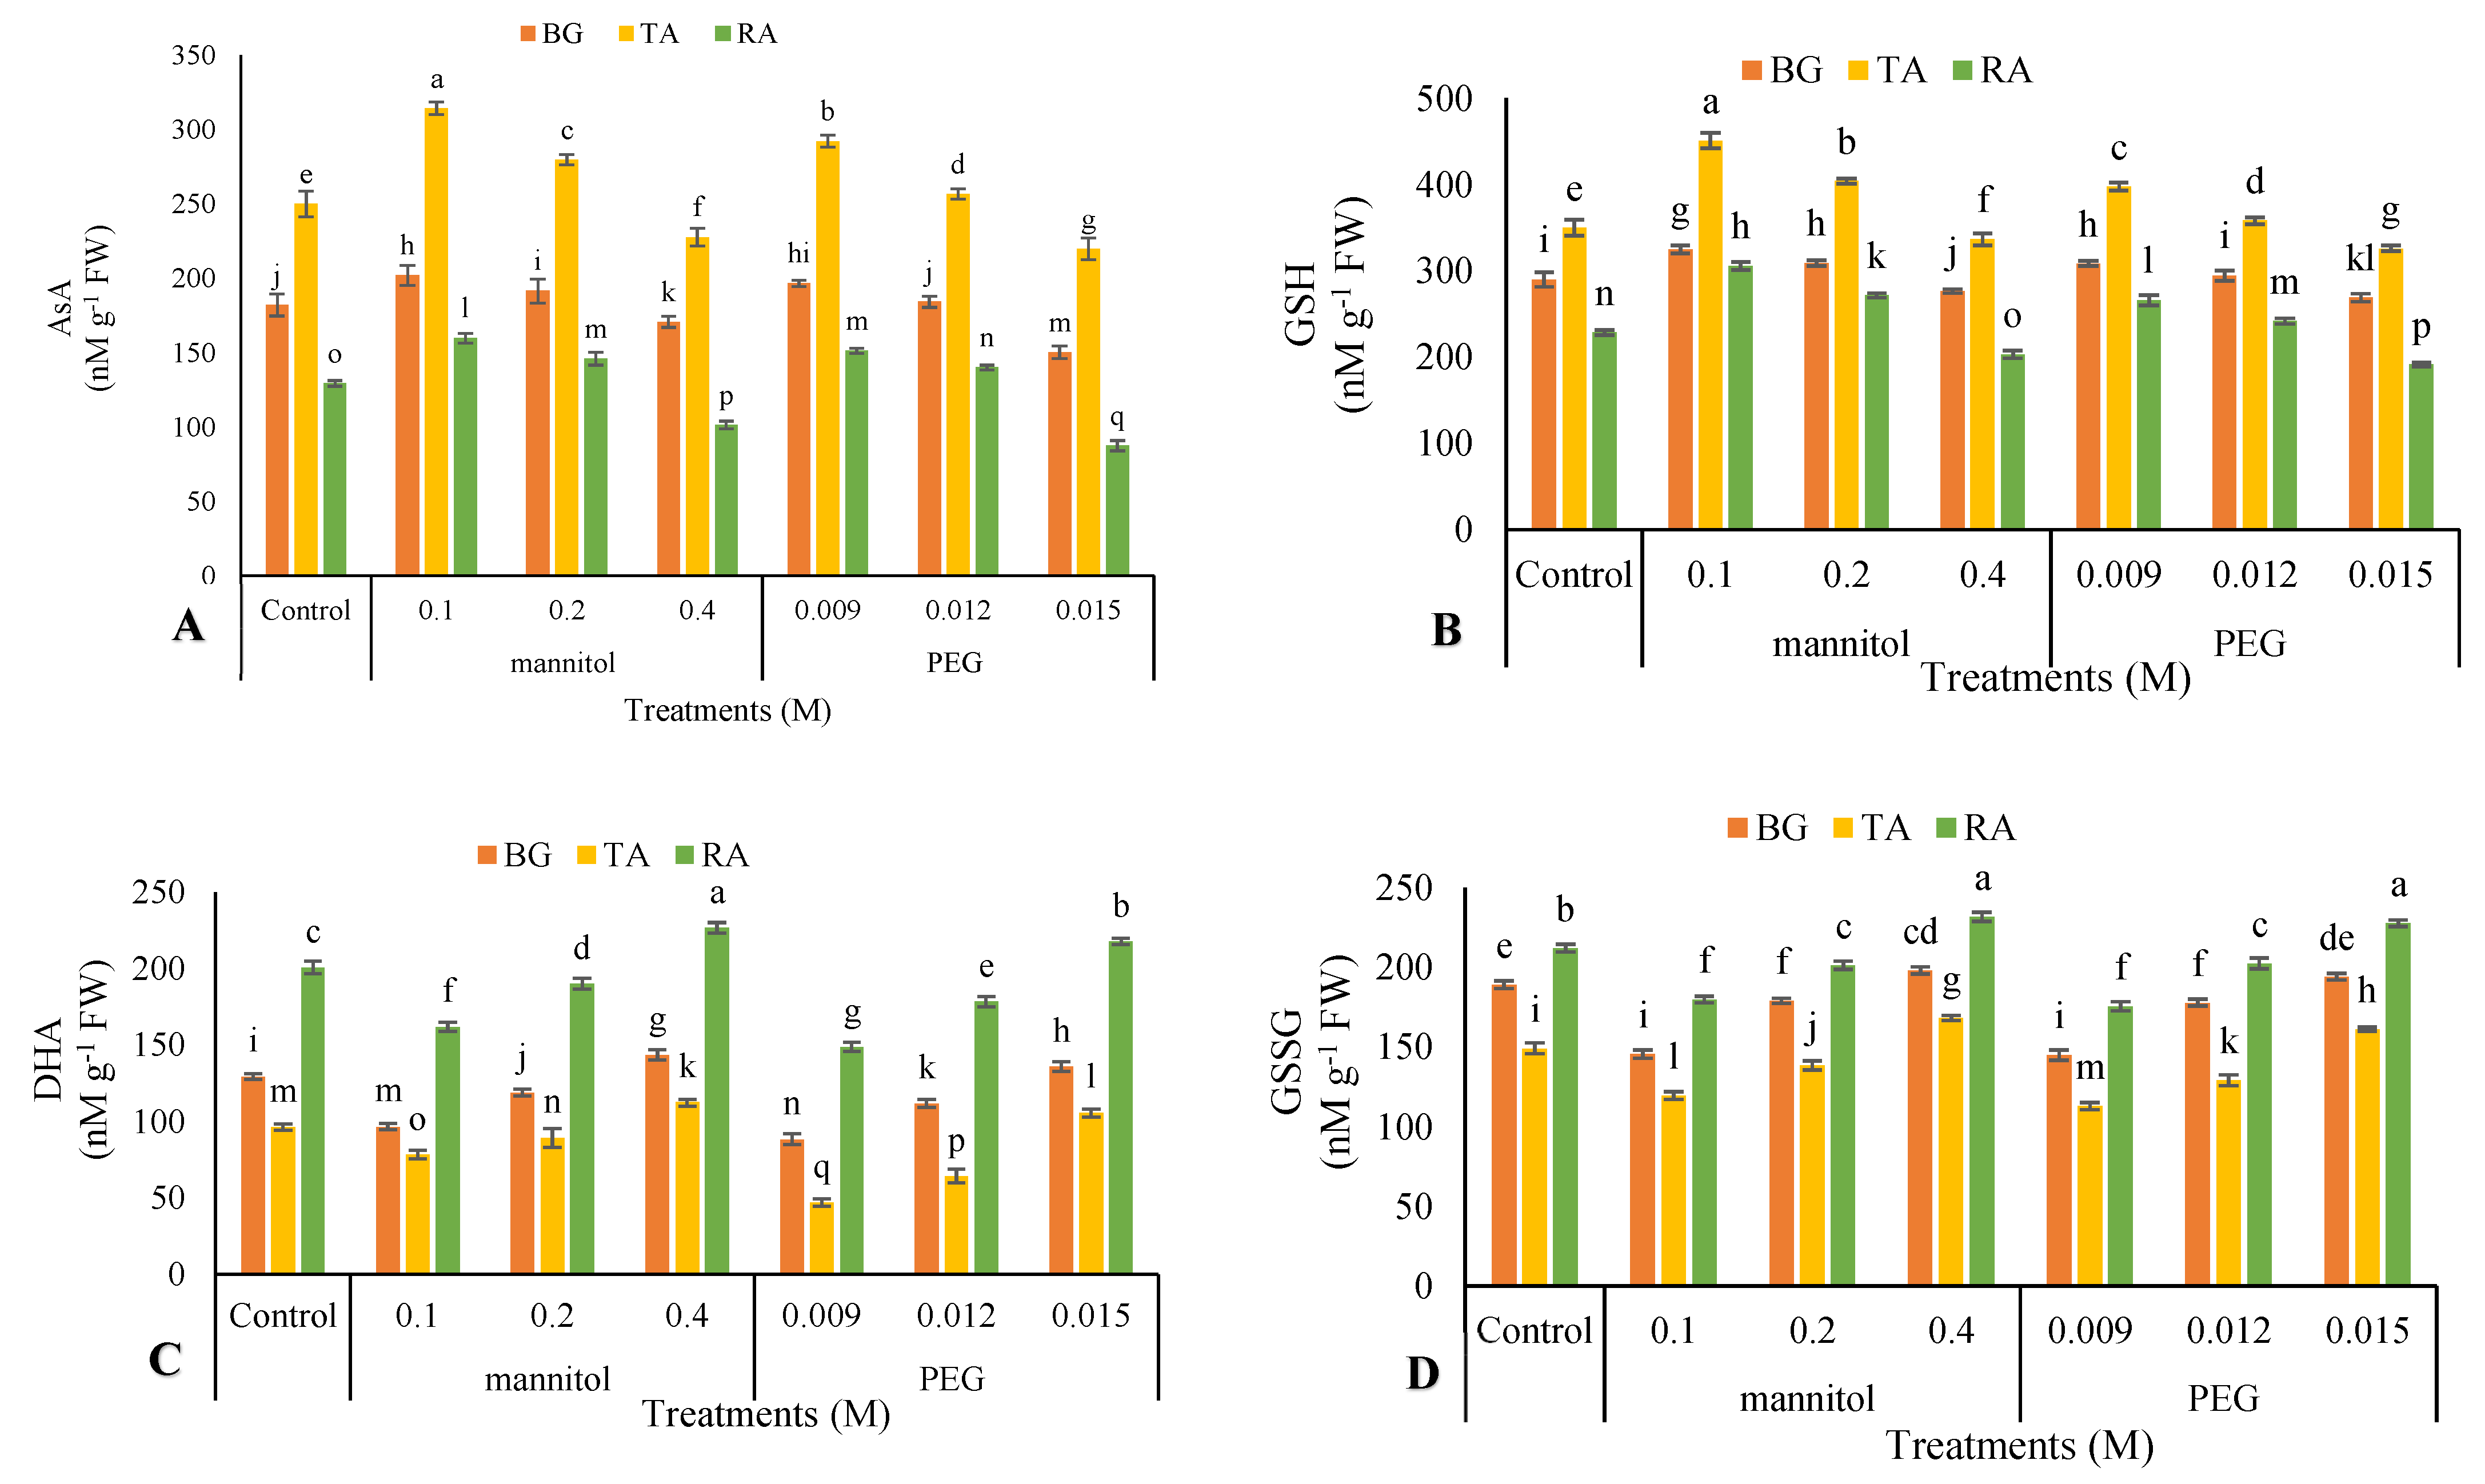
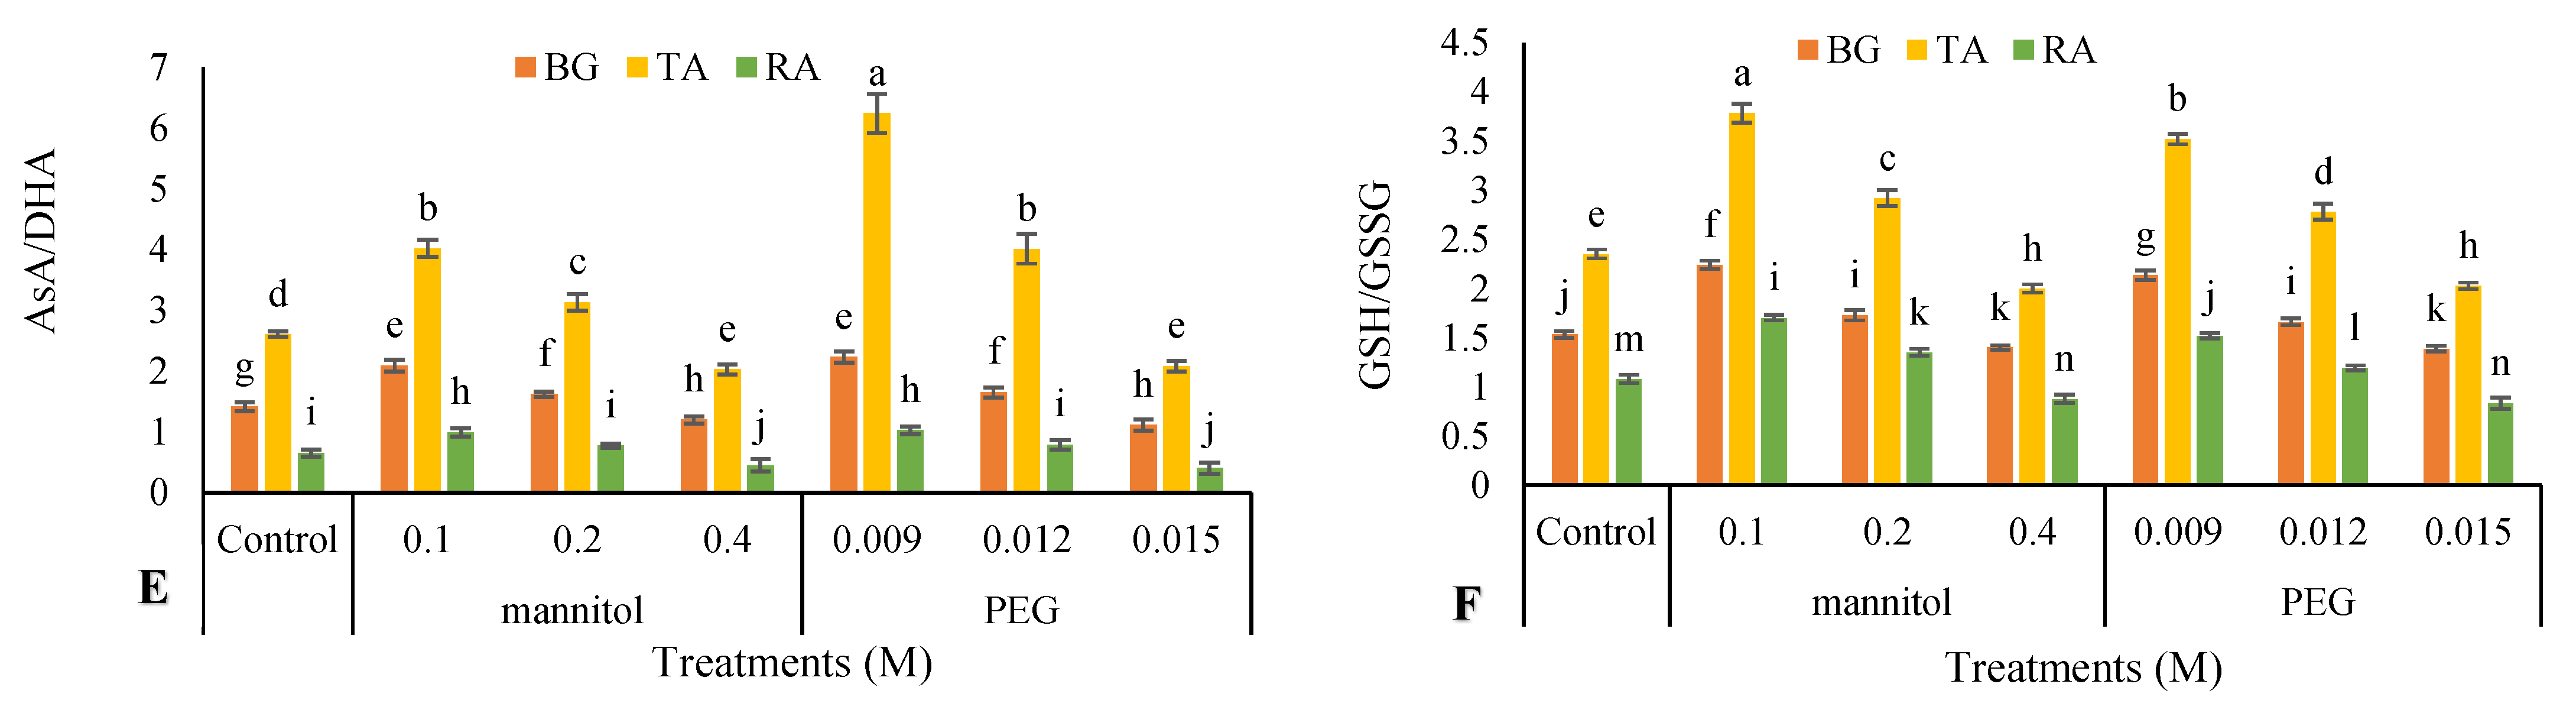
3.10. Nonenzymatic Antioxidants

The nonenzymatic antioxidants were significantly affected by the PEG, mannitol and cucurbit varieties (Table 5) Our results revealed that the content of AsA and GSH was enhanced at moderate stresses and reduced by increasing osmotic stress. The highest AsA and GSH content was observed in TA under 0.1 M of mannitol, while the lowest was observed in RA under 0.015 M of PEG added into the medium (Figure 4A,B).
DHA and GSSG were significantly affected by osmotic stress. In the seedlings of all three species, the content of DHA and GSSG decreased under moderate osmotic stress and increased under severe osmotic stress. The highest DHA and GSSG content were obtained in RA genotype at 0.4 M of mannitol and the lowest was observed in TA under 0.009 M of PEG (Figure 4C,D).
AsA/DHA activity in all three genotypes multiplied in lower concentrations of mannitol and PEG, but decreased under 0.2 M and 0.4 M of mannitol and 0.012 M and 0.015 M of PEG treatment. The TA species had the maximum enhancement up to 139% at 0.009 M of PEG, while the BG genotype attained the minimum enhancement of up to 57% at 0.009 M of PEG. The highest AsA/DHA content was observed at TA species under 0.009 M of PEG and the lowest at RA genotype under 0.015 M of PEG (Figure 4E).
GSH/GSSG content was affected by osmotic stress, and in all of the three species increased at mild stress and decreased with the intensification of osmotic stress. Our results showed that the highest and lowest contents were in TA under the lowest concentration of mannitol and the highest concentration of PEG, respectively (Figure 4F).

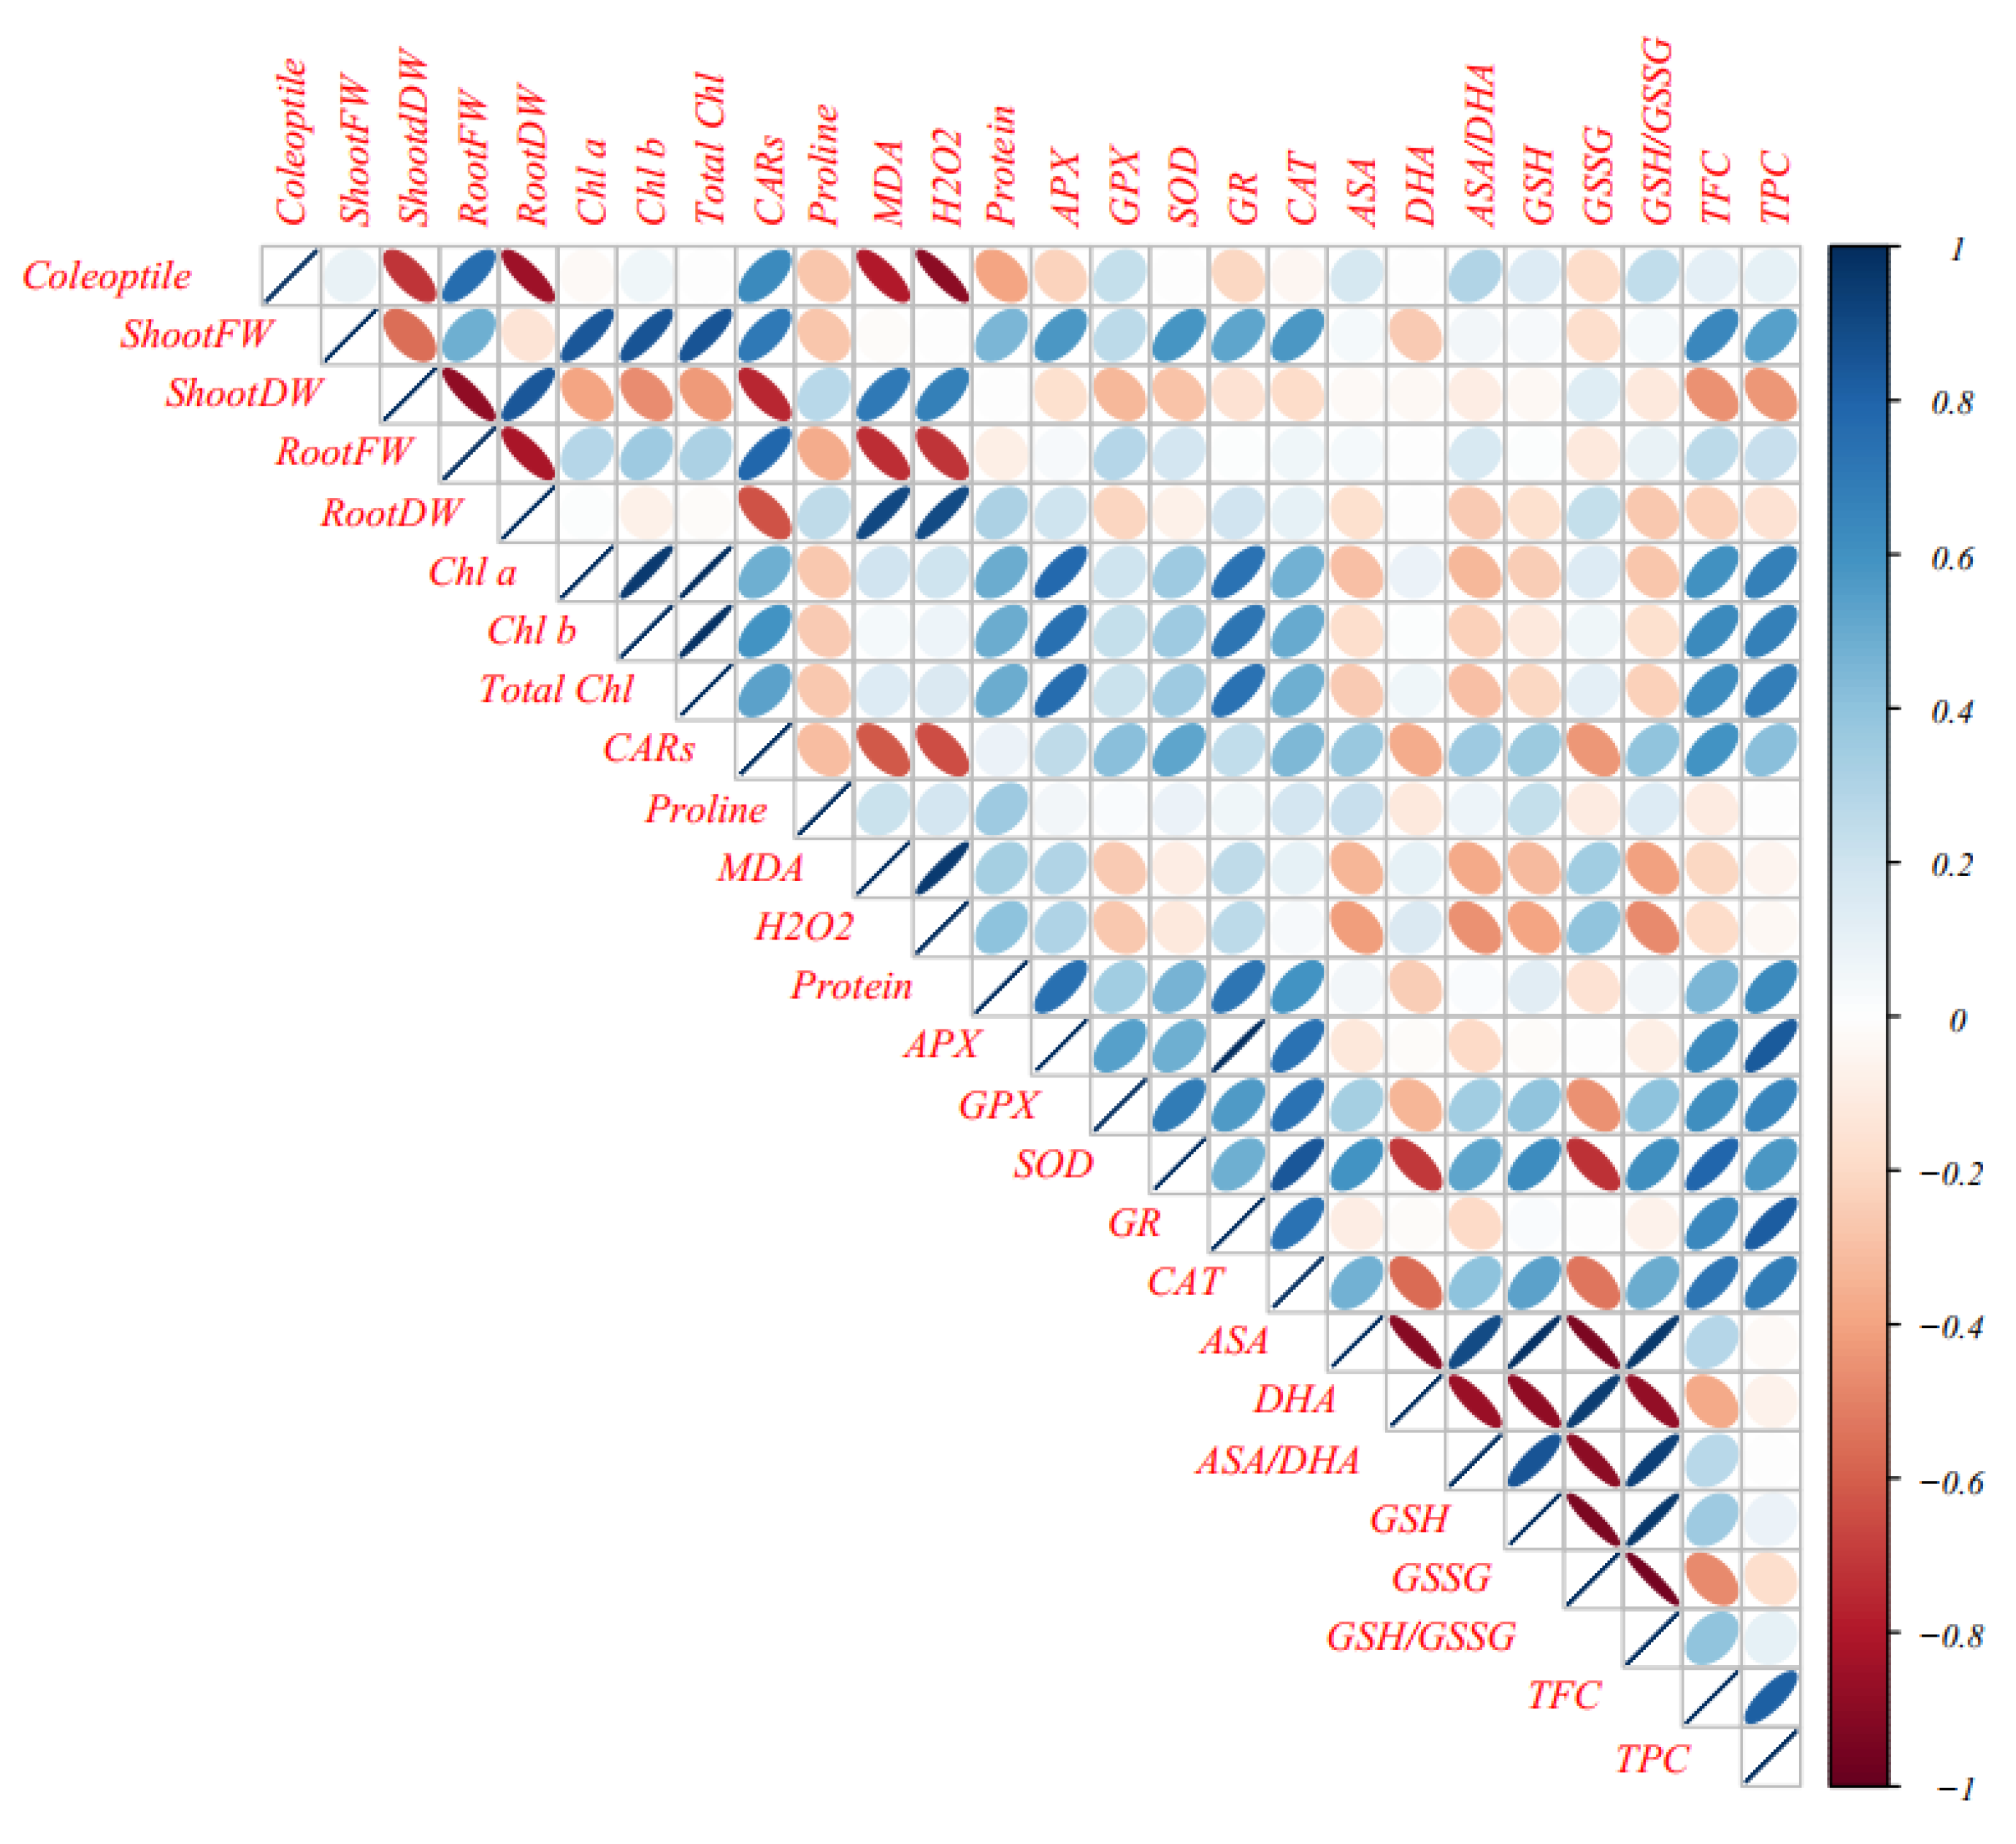
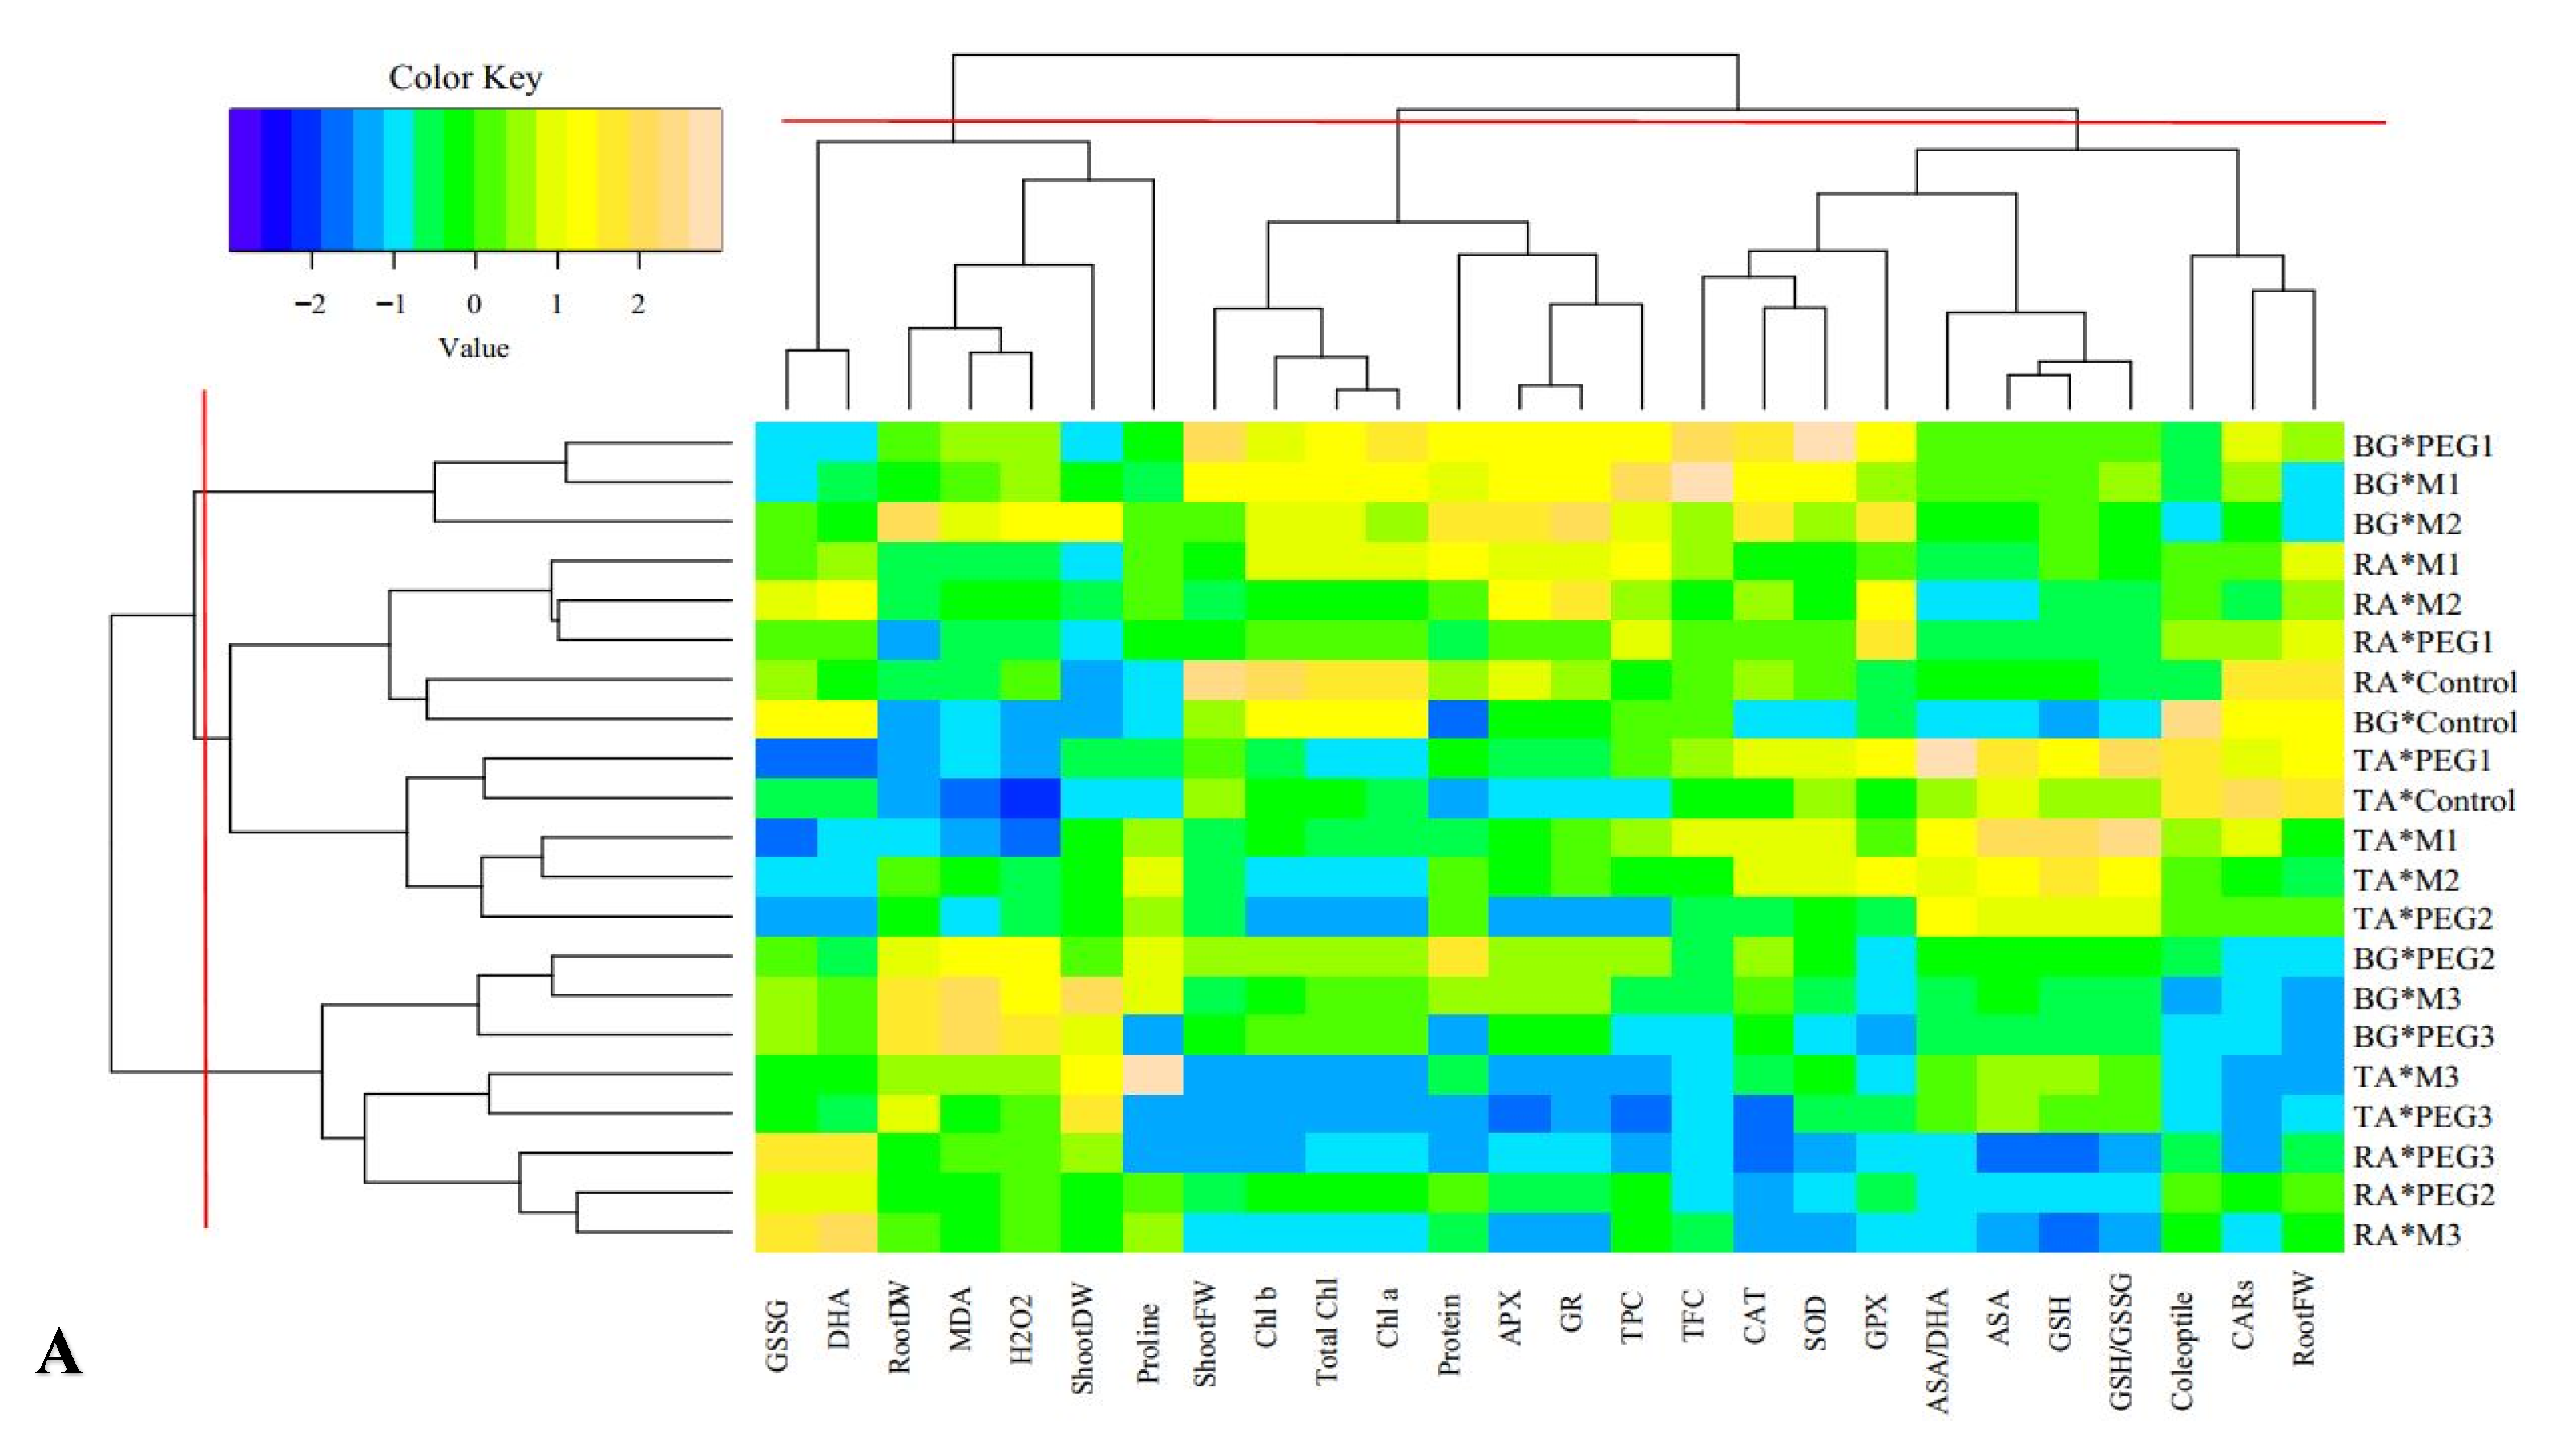
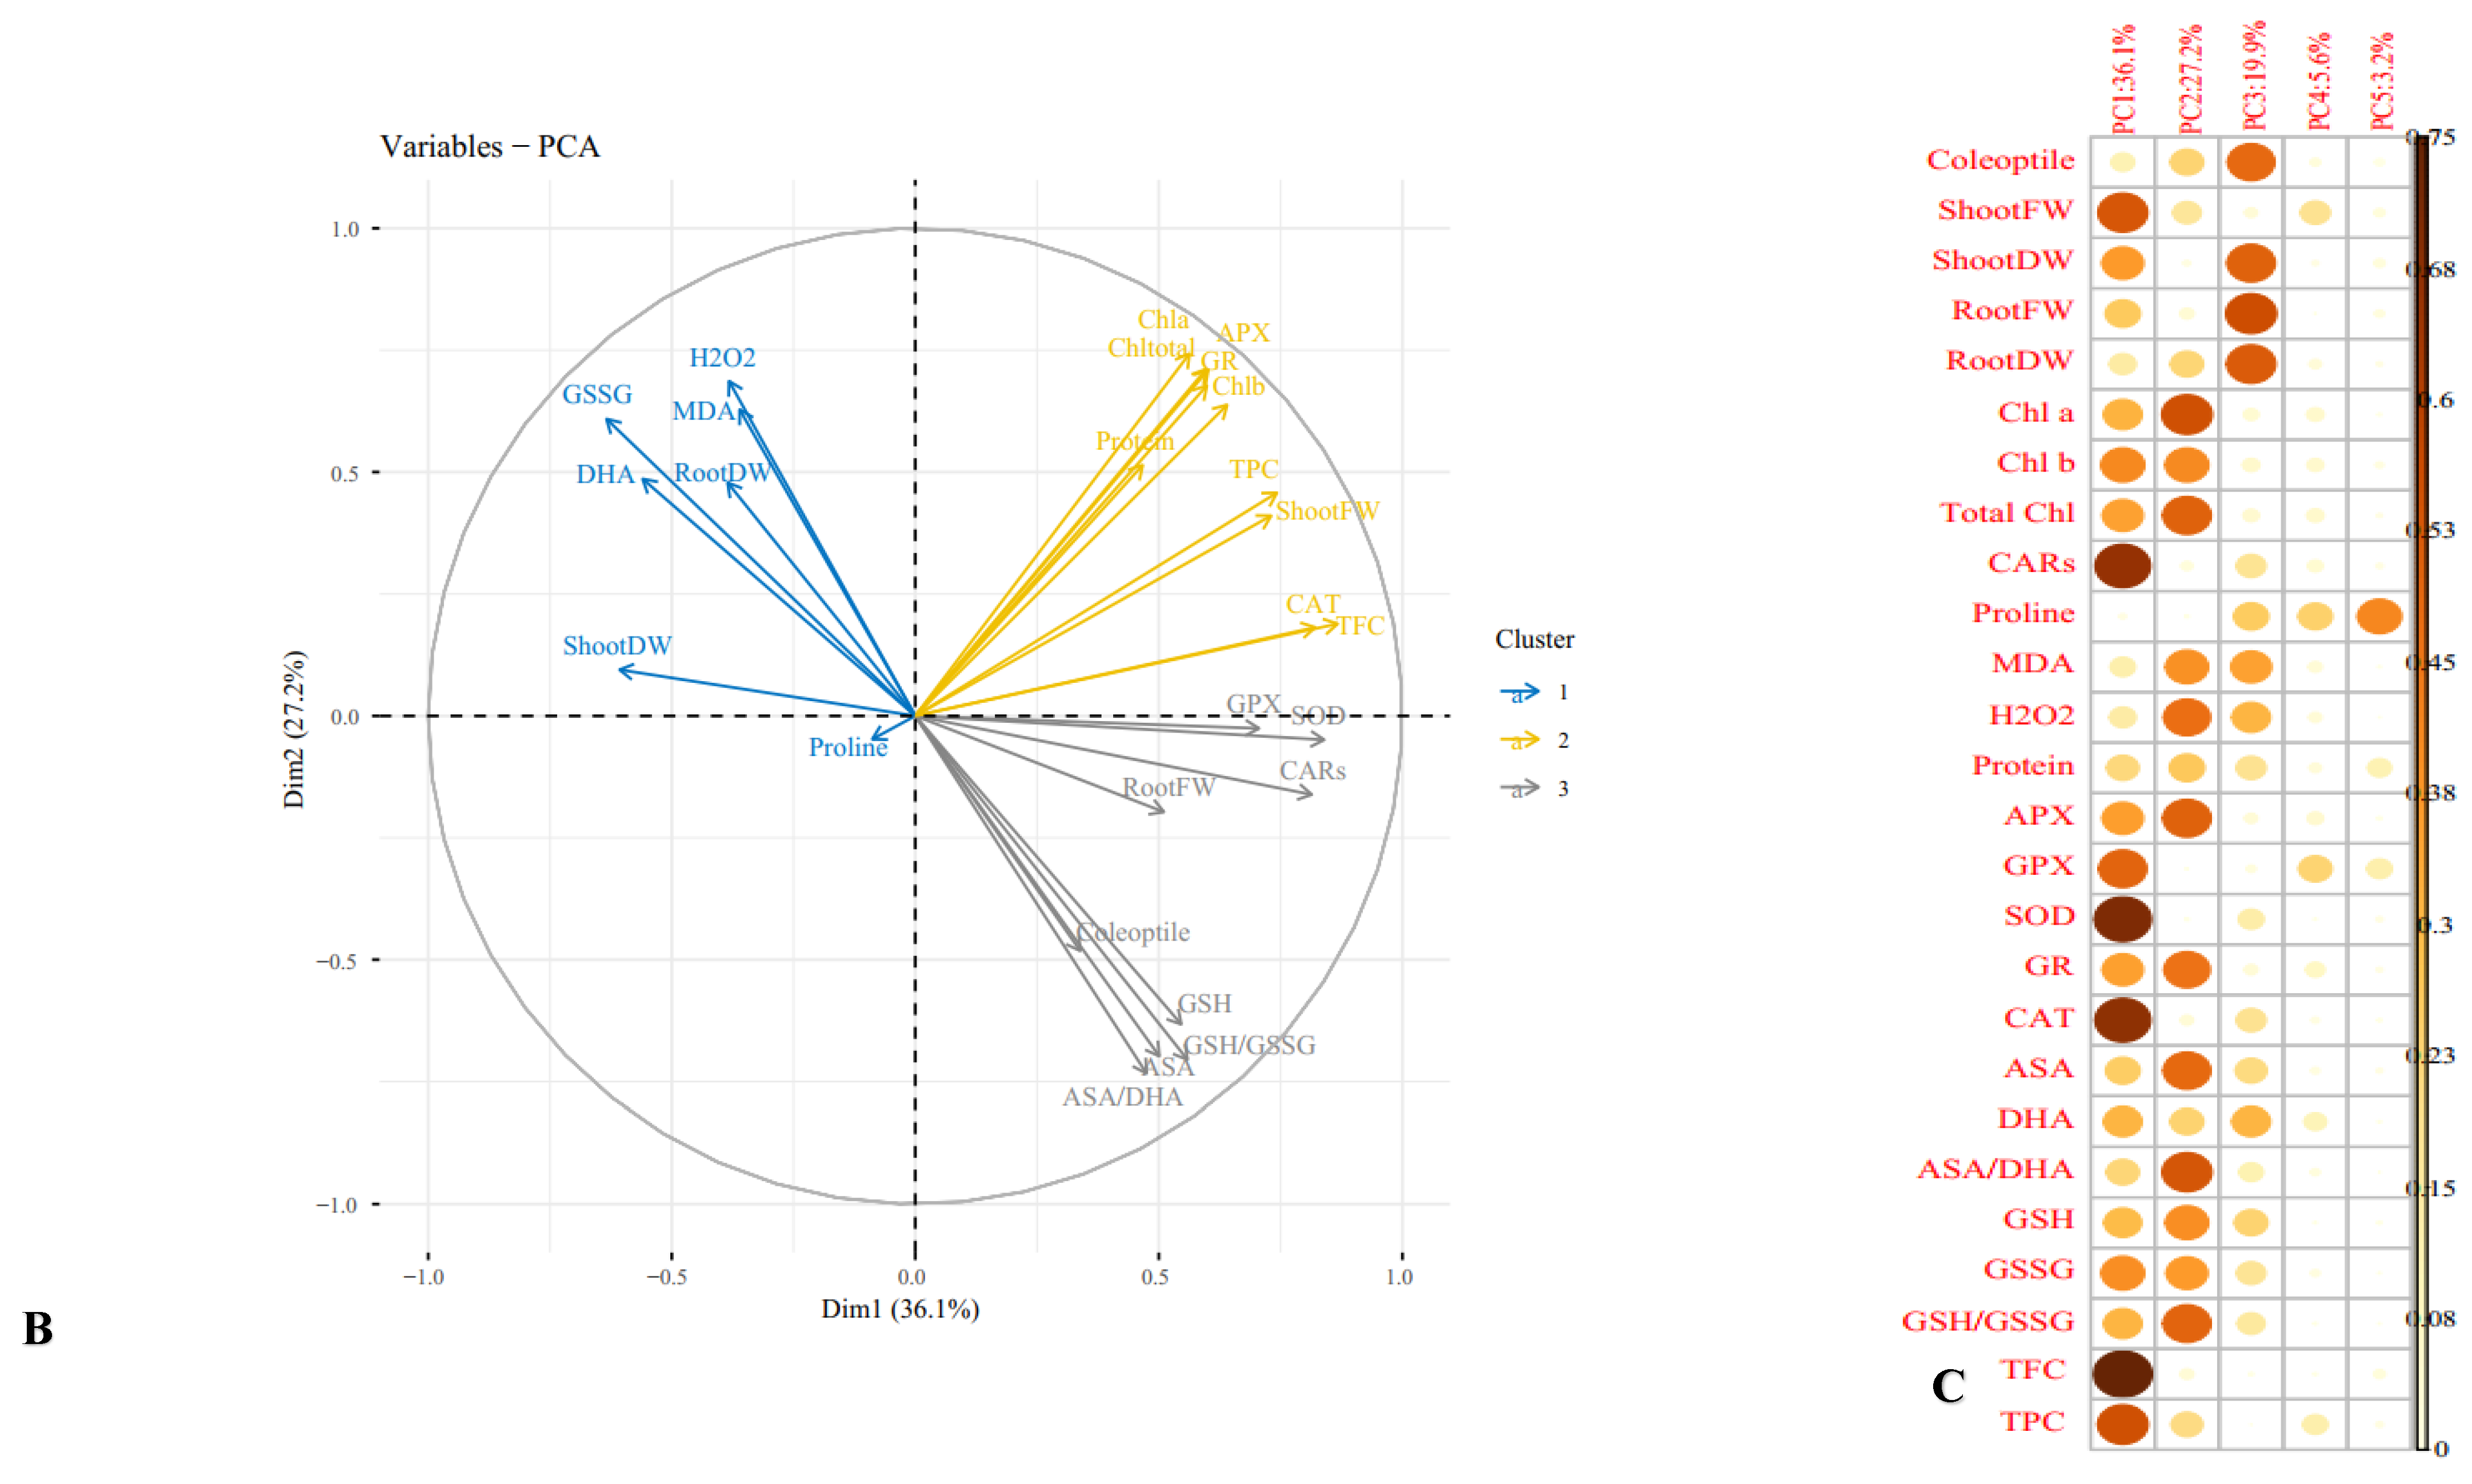
3.11. Multivariate Analysis of Cucurbits Landraces under Normal and Mannitol and PEG Treatments

The Pearson’s correlations of morphological, biochemical and antioxidant traits is exhibited in Figure 5 The findings showed that coleoptile length positively correlated with root FW and CARs, and negatively correlated shoot DW, root DW, MDA, and H2O2. A positive significant correlation was observed among shoot FW, Root FW, Chl a, Chl b, total Chl, APX, and GR activity. Shoot and root DW positively correlated to MDA and H2O2. Also, protein content, TPC, TFC, APX, GPX, SOD, CAT, and GR activity have a positive correlation together. A negative correlation was observed between non-enzymatic antioxidants viz. AsA, GSH, AsA/GSH with DHA, and GSSH.
Heat map analysis based on the response of cucurbit plants to osmotic stress induced by mannitol and PEG applications in in vitro condition revealed that the traits including shoot DW, root DW, H2O2, MDA, DHA, and GSSG had positive compliance to osmotic stress, and on the other hand, some traits such as shoot and root FW, proline, photosynthetic pigment, protein content and some non-enzymatic antioxidant such as AsA, GSH, and GSH/GSSG (Figure 6A).
Cluster analysis and dendrograms in the heat map (Figure 6A) revealed three major classes in the assessed traits of plants under osmotic stress. Class I contained GSSG, DHA, root DW, MDA, H2O2, shoot DW and proline content; class II contained shoot DW, Chl b, protein content, APX, GR and TPC, and class III contained TFC, CAT, SOD, GPX, AsA/DHA, GSH/GSSG, CARs and coleoptile length (Figure 6A). Moreover, biplot of variables confirmed the heat map cluster analysis in which traits classified in three groups (Figure 6B) In general, cluster analysis of heat maps for mannitol and PEG treatments indicated three classes. Class I contained the BG was treated by 0.1 and 0.2 M of mannitol and 0.009 M PEG. Class II contained all of the control of cucurbit genotypes, RA and TA were cultured under 0.1 and 0.2 mannitol, and TA cultured under 0.012. Finally, class III included cucurbit plants under severe osmotic stress which was induced by mannitol and PEG (Figure 6A).
The principal component analysis (PCA) and the proportion of total variance (Table 5) explained that three PCA were contributing 83.2% of total variation. The first PCA was the most influential with the variance of 36. 2% and contained the traits of shoot FW, CARs, TPD, TFC, GPX, SOD, and CAT activity. Root FW, CARs, and APX activity. The second PCA explained 27.2% of the total variance, and consisted of Chl a, total Chl, H2O2, GsH/GSSG, APX and GR activity. The third PCA explained 19.9% of the total variance with Coleoptile length, shoot DW, root FW, and root DW (Figure 6C).

4. Discussion

Under drought stress conditions, stem and root meristematic cells are influenced. Then, the cell division and elongation are disrupted, and this causes the declined stem and root length. Moreover, the turgor pressure decreases under water deficit needed for cell enlargement [33]. Furthermore, drought stress limits cytokinin and increases abscisic acid levels, affecting cell division [34]. Kavas et al. [35] have shown similar results to our findings in two melon cultivars.
One of the reasons for the improved dry matter biomass is the hydration and synthesis of new metabolites to preserve higher osmotic pressure and continue water absorption. As is well-know, growth potential decreases more rapidly than photosynthesis, resulting in the accumulation of assimilated metabolites [36].
Our results showed that photosynthetic pigments content decreased with mannitol and PEG treatment under in vitro culture. Photosynthetic pigments degradation and membrane instability under drought stress conditions reduce chlorophyll content [37]. One of the reasons for the chlorophyll reduction due to water shortage is that drought stress leads to lipid peroxidation by producing ROS such as peroxidase and hydrogen peroxidase [38]. Several studies have reported that the amount of chlorophyll under drought stress has decreased in several plant species that are attuned with our findings in cucurbits under in vitro culture conditions [39,40,41,42].
Proline is one of the most critical organic osmolytes that accumulate in response to environmental stresses such as drought and salinity in the plant [43]. The proline content increase in plants under abiotic stresses can be an adaptation to overcome stress conditions, which continuously provide the energy for survival and growth by osmotic regulation, as well as helping to control the entry and exit of water in cells, cytoplasm, and vacuoles [44,45]. Proline also plays a role in stabilizing the three-dimensional structure of proteins as an inhibitor of membrane lipid peroxidation and regulating cytosolic acidity [46]. One of the reasons for proline enhancement is ROS as a part of ABA signaling [47] and it has been proved that ABA increases under drought stress in plants. Khan et al. [48] reported an increase in the proline content under the influence of drought, which is consistent with our findings. Based these results, PEG simulated osmotic stress better than mannitol at the lower concentration since the proline content was more in the mannitol treatments, but the cucurbit plants at the highest concentration PEG has not induced proline production (Table 3).
In the present study, cucurbits seedlings grown in osmotic stress in vitro increased MDA content. MDA is a product of the peroxidation of unsaturated fatty acids. The amount of lipid peroxidation has been used to indicate free radical damage to cell membranes under stress [30,49]. Due to osmotic stress, peroxidation of thylakoid glycolipids and subsequent production of diacylglycerol, triacylglycerol, and free fatty acids occurs. As a result, the amount of MDA in plant tissue increases. Our results showed that increasing the MDA content under osmotic stress led to more production of H2O2, especially in susceptible genotypes, which is consistent with the reports of Khan et al. [48].
In the current research, total protein content increased under moderate osmotic stress but decreased at higher levels of mannitol and PEG. Also, the reduction of the total protein was more in PEG specially at the highest concentration. Environmental stresses change gene expression, which is characterized by the production of new proteins that did not exist before exposure to stress. The new proteins can help plant growth and membrane stability under stress conditions [50]. Many proteins are known in plants to be expressed in response to drought stress, and a lot of the proteins that are key plant metabolites show an upsurge under water-deficit [51]. Razavizadeh and Kumatsu [52], in agreement with our study, reported that mannitol-induced osmotic stress increases new proteins such as antioxidant enzyme, lipid transfer proteins, dehydrin proteins, and heat shock proteins.
The secondary metabolites such as phenols and flavonoids are involved in plant adaptation to environmental stresses and in oxidative damage response. These compounds play an essential role in protecting against free radicals [26,53]. However, it has been reported that the accumulation of the phenolic compounds maybe different under environmental stresses in different plant species such as rice [54], tomatoes [17], and beans [53] is highly dependent on environmental conditions, which probably reduce or increase the content of the phenolic compounds. In the present study, the content of TPC and TFC of three genotypes in both treatments increased at the weak stress conditions and decreased under severe stress, it shows that maybe these compounds have been destroyed in the severe stress. However, the decline was greater in the PEG treatments than mannitol, and it showed that mannitol would be induced osmotic stress better than PEG along with the lower TPC and TFC degradation. According to Josipović et al. [55], the number of polyphenols in plants and their antioxidant activity depends on biological factors such as genotype and organ and edaphic and environmental conditions such as temperature, salinity, water stress, and light intensity.
The current study showed that H2O2 content in the cucurbit genotypes increased in mannitol and PEG treatments. A certain amount of ROS produced under stress can be used as a signal molecule to activate related active substances or the immune system and reduce damage caused by abiotic stress [56]. Among ROS, H2O2 is mainly used as an essential signal molecule for plant cells to respond under various stresses since H2O2 is a very stable ROS with the most extended half-life and strong diffusion [57,58]. Increased H2O2 production in mitochondria may be an essential signal, regulate the antioxidant defense system, or cause programmed cell death when oxidative stress intensifies [59]. H2O2 concentration in Chinese potato leaf tissue increased with increasing PEG stress [60]. Zhu et al. [61] showed that H2O2 concentration increased in cassava cultivars under drought stress, and a further increase was observed in sensitive genotype, which is consistent with our findings. According to the current results, it was observed that H2O2 and MDA produced in PEG more than mannitol. These findings showed that PEG has simulated osmotic stress than mannitol if we used the traits as biomarker.
Plant cells need mechanisms to detoxify or remove ROS to keep cells in balance [35,62]. One of the mechanisms is increasing antioxidative enzymes such as APX, GPX, and SOD by activating the signal transduction pathways, promoting the antioxidant enzyme genes’ expression and improving their activity [63]. The present results indicate that APX, SOD, GPX enzymes can increase under slight drought stresses. The production of reactive oxygen species is correlated significantly with the severity of osmotic stress, which leads to enhanced reactive oxygen species, peroxidation of membrane lipids and degradation of nucleic acids, and both structural and functional proteins [64]. Still, it could be the case that the results related to the phenolic and flavonoids compound of these enzymes could be destroyed and cannot be sustained under higher osmotic stress. GR is the last enzyme in the AsA/GSH cycle and uses NADPH in the glutathione-ascorbate cycle to stimulate the conversion of glutathione oxide to reduced glutathione [65]. Thus, GR maintains GSH content, reduces oxidative stress damage, and maintains cellular integrity under osmotic stress [66,67]. Zhu et al. [61] reported an increase in the GR activity under the influence of drought, which is underpinned by our results. The results showed that the mannitol induced enzyme activity better than PEG especially in the higher osmotic stress (Figure 2A–E).
Compounds such as AsA and GSH are simple non-enzymatic antioxidants that can directly inhibit ROS function as cofactors of antioxidant enzymes [68]. In addition, AsA and GSH are non-enzymatic antioxidants produced by the AsA-GSH cycle [69] and play a vital role in reducing oxidative stress and improving plant drought tolerance [61]. GSH is commonly known as glutathione, scavenging free radicals in cells with toxic effects [70]. When a small amount of H2O2 is produced inside the cell, GSH reduces H2O2 to H2O under the influence of GPX and its own oxidizes to GSSG. Under the influence of glutathione reductase, GSSG receives hydrogen to reduce GSH, so that the scavenging reaction of free radicals can be carried out continuously, thus stabilizing the membrane structure [59]. GSH/GSSG ratio is a major indicator of oxidative stress in various biochemical processes [71]. An increase in AsA and GSH content due to water deficiency was observed in cassava seedling genotypes [61]. Drought and salt stress increased the activity of ascorbate-glutathione content and ascorbate-glutathione redox status in Arachis hypogaea [72], Catalpa bungee [7], and Amaranthus tricolor [42], especially for water-tolerant lines. Similarly, drought stress also increased the AsA and GSH content in squash. A further increase in AsA and GSH content was observed in the RA genotype, indicating that this genotype has a more efficient system for the biosynthesis of these antioxidants and could be more tolerant.

5. Conclusions

Our results revealed that applying PEG and mannitol under in vitro condition could be an efficient procedure to simulate, evaluate, and screen cucurbit genotypes under drought stress in cucurbitaceous family. BG was less affected by osmotic stress than other genotypes in most evaluated traits, whereas TA was more susceptible. According to the correlation and PCA results, some traits such as hypocotyl length, shoot FW, shoot and root DW, photosynthesis pigments, enzymatic antioxidant (GPX, SOD, CAT, APX and GR activity), TFC, TPC AsA/DHA and GSH/GSSG led to the most of variation end responses of these cucurbit species to osmotic stress induced by mannitol and PEG. Thus we can conclude that the mentioned traits can be used as biomarkers and tools. The results showed that PEG application decreased most of the traits higher compared to mannitol (especially in higher concentrations). Finally, we can conclude in the most evaluated traits mannitol simulated osmotic stress was more effective than PEG specially in severe stress, although at lower osmotic stress both are equally efficient.

Author Contributions

Writing original draft, data curation, visualization, R.P.T., project administration; software, supervision, validation, formal analysis investigation, visualization. F.R.; investigation, review and editing, M.T.G. and S.M.Z.; software, review and editing. M.A.A., M.B.H. and J.M.; supervision, A.A. and J.M. All authors have read and agreed to the published version of the manuscript.

Funding

This study was funded by the University of Maragheh, Iran and supported by the internal grant of TBU in Zlin, grant number IGA/FT/2022/004.

Data Availability Statement

The datasets generated and analyzed during the current study are available from the corresponding author upon reasonable request.

Acknowledgments

We thank Central Laboratory Maragheh University for providing material and instruments.

Conflicts of Interest

The authors declare no conflict of interest.

References

  1. Lesk, C.; Rowhani, P.; Ramankutty, N. Influence of extreme weather disasters on global crop production. Nature 2016, 529, 84–87. [Google Scholar] [CrossRef] [PubMed] [Green Version]
  2. Hoekstra, F.A.; Golovina, E.A.; Buitink, J. Mechanisms of plant desiccation tolerance. Trends Plant Sci. 2001, 6, 431–438. [Google Scholar] [CrossRef] [PubMed]
  3. Rahdari, P.; Hoseini, S. Drought stress: A review. Int. J. Agron. Plant Prod. 2012, 3, 443–446. [Google Scholar]
  4. Zayova, E.; Philipov, P.; Nedev, T.; Stoeva, D. Response of in vitro cultivated eggplant (Solanum melongena L.) to salt and drought stress. AgroLife Sci. J. 2017, 6, 276–282. [Google Scholar]
  5. Parry, M.A.; Andralojc, P.J.; Khan, S.; Lea, P.J.; Keys, A.J. Rubisco activity: Effects of drought stress. Ann. Bot. 2002, 89, 833–839. [Google Scholar] [CrossRef] [PubMed] [Green Version]
  6. Medeiros, M.J.; Oliveira, D.S.; Oliveira, M.T.; Willadino, L.; Houllou, L.; Santos, M.G. Ecophysiological, anatomical and biochemical aspects of in vitro culture of zygotic Syagrus coronata embryos and of young plants under drought stress. Trees 2015, 29, 1219–1233. [Google Scholar] [CrossRef]
  7. Li, J.; Cang, Z.; Jiao, F.; Bai, X.; Zhang, D.; Zhai, R. Influence of drought stress on photosynthetic characteristics and protective enzymes of potato at seedling stage. J. Saudi Soc. Agric. Sci. 2017, 16, 82–88. [Google Scholar] [CrossRef] [Green Version]
  8. Ghassemi-Golezani, K.; Farhadi, N.; Nikpour-Rashidabad, N. Responses of in vitro-cultured Allium hirtifolium to exogenous sodium nitroprusside under PEG-imposed drought stress. Plant Cell Tissue Organ Cult. PCTOC 2018, 133, 237–248. [Google Scholar] [CrossRef]
  9. Araus, J.L.; Slafer, G.A.; Royo, C.; Serret, M.D. Breeding for yield potential and stress adaptation in cereals. Crit. Rev. Plant Sci. 2008, 27, 377–412. [Google Scholar] [CrossRef]
  10. Forni, C.; Duca, D.; Glick, B.R. Mechanisms of plant response to salt and drought stress and their alteration by rhizobacteria. Plant Soil 2017, 410, 335–356. [Google Scholar] [CrossRef]
  11. Errabii, T.; Gandonou, C.B.; Essalmani, H.; Abrini, J.; Idaomar, M.; Skali-Senhaji, N. Growth, proline and ion accumulation in sugarcane callus cultures under drought-induced osmotic stress and its subsequent relief. Afr. J. Biotechnol. 2006, 5, 1488–1493. [Google Scholar]
  12. Gopal, J.; Iwama, K. In vitro screening of potato against water-stress mediated through sorbitol and polyethylene glycol. Plant Cell Rep. 2007, 26, 693–700. [Google Scholar] [CrossRef] [PubMed]
  13. D’souza, A.A.; Shegokar, R. Polyethylene glycol (PEG): A versatile polymer for pharmaceutical applications. Expert Opin. Drug Deliv. 2016, 13, 1257–1275. [Google Scholar] [CrossRef] [PubMed]
  14. Siaga, E.; Maharijaya, A.; Rahayu, M.S. Plant Growth of Eggplant (Solanum melongena L.) In Vitro in Drought Stress Polyethylene Glycol (PEG). BIOVALENTIA Biol. Res. J. 2016, 2, 10–17. [Google Scholar] [CrossRef] [Green Version]
  15. Godswill, A.C. Sugar alcohols: Chemistry, production, health concerns and nutritional importance of mannitol, sorbitol, xylitol, and erythritol. Int. J. Adv. Acad. Res. Sci. Technol. Eng. 2017, 3, 31–66. [Google Scholar]
  16. Mashilo, J.; Odindo, A.O.; Shimelis, H.A.; Musenge, P.; Tesfay, S.Z.; Magwaza, L.S. Photosynthetic response of bottle gourd [Lagenaria siceraria (Molina) Standl.] to drought stress: Relationship between cucurbitacins accumulation and drought tolerance. Sci. Hortic. 2018, 231, 133–143. [Google Scholar] [CrossRef]
  17. Kusvuran, S.; Dasgan, H.Y. Drought induced physiological and biochemical responses in Solanum lycopersicum genotypes differing to tolerance. Acta Sci. Pol. Hortorum Cultus 2017, 16, 2017. [Google Scholar] [CrossRef]
  18. Ouzounidou, G.; Giannakoula, A.; Ilias, I.; Zamanidis, P. Alleviation of drought and salinity stresses on growth, physiology, biochemistry and quality of two Cucumis sativus L. cultivars by Si application. Braz. J. Bot. 2016, 39, 531–539. [Google Scholar] [CrossRef]
  19. Reid, D.S. Water Activity. In Water Activity in Foods; Wiley: Hoboken, NJ, USA, 2020; pp. 13–26. [Google Scholar]
  20. Michel, B.E.; Kaufmann, M.R. The osmotic potential of polyethylene glycol 6000. Plant Physiol. 1973, 51, 914–916. [Google Scholar] [CrossRef]
  21. Arnon, D.I. Copper enzymes in isolated chloroplasts. Polyphenoloxidase in Beta vulgaris. Plant Physiol. 1949, 24, 1. [Google Scholar] [CrossRef] [Green Version]
  22. Bates, L.S.; Waldren, R.P.; Teare, I. Rapid determination of free proline for water-stress studies. Plant Soil 1973, 39, 205–207. [Google Scholar] [CrossRef]
  23. Heath, R.L.; Packer, L. Photoperoxidation in isolated chloroplasts: I. Kinetics and stoichiometry of fatty acid peroxidation. Arch. Biochem. Biophys. 1968, 125, 189–198. [Google Scholar] [CrossRef]
  24. Bradford, M.M. A rapid and sensitive method for the quantitation of microgram quantities of protein utilizing the principle of protein-dye binding. Anal. Biochem. 1976, 72, 248–254. [Google Scholar] [CrossRef]
  25. Singleton, V.L.; Rossi, J.A. Colorimetry of total phenolics with phosphomolybdic-phosphotungstic acid reagents. Am. J. Enol. Vitic. 1965, 16, 144–158. [Google Scholar]
  26. Chang, C.-C.; Yang, M.-H.; Wen, H.-M.; Chern, J.-C. Estimation of total flavonoid content in propolis by two complementary colorimetric methods. J. Food Drug Anal. 2002, 10, 3. [Google Scholar]
  27. Sinha, S.; Saxena, R.; Singh, S. Chromium induced lipid peroxidation in the plants of Pistia stratiotes L.: Role of antioxidants and antioxidant enzymes. Chemosphere 2005, 58, 595–604. [Google Scholar] [CrossRef]
  28. Nakano, Y.; Asada, K. Hydrogen peroxide is scavenged by ascorbate-specific peroxidase in spinach chloroplasts. Plant Cell Physiol. 1981, 22, 867–880. [Google Scholar]
  29. Kumar, K.; PA, K. Peroxidase & polyphenol oxidase in excised ragi (eleusine coracana cv pr 202) leaves during senescence. Indian J. Exp. Biol. 1982, 20, 412–416. [Google Scholar]
  30. Sairam, R.; Srivastava, G.; Saxena, D. Increased antioxidant activity under elevated temperatures: A mechanism of heat stress tolerance in wheat genotypes. Biol. Plant. 2000, 43, 245–251. [Google Scholar] [CrossRef]
  31. Law, M.; Charles, S.A.; Halliwell, B. Glutathione and ascorbic acid in spinach (Spinacia oleracea) chloroplasts. The effect of hydrogen peroxide and of paraquat. Biochem. J. 1983, 210, 899–903. [Google Scholar] [CrossRef] [Green Version]
  32. Griffith, O.W. Determination of glutathione and glutathione disulfide using glutathione reductase and 2-vinylpyridine. Anal. Biochem. 1980, 106, 207–212. [Google Scholar] [CrossRef] [PubMed]
  33. Hellal, F.; El-Shabrawi, H.; Abd El-Hady, M.; Khatab, I.; El-Sayed, S.; Abdelly, C. Influence of PEG induced drought stress on molecular and biochemical constituents and seedling growth of Egyptian barley cultivars. J. Genet. Eng. Biotechnol. 2018, 16, 203–212. [Google Scholar] [CrossRef] [PubMed]
  34. Alexieva, V.; Sergiev, I.; Mapelli, S.; Karanov, E. The effect of drought and ultraviolet radiation on growth and stress markers in pea and wheat. Plant Cell Environ. 2001, 24, 1337–1344. [Google Scholar] [CrossRef]
  35. Kavas, M.; Baloğlu, M.C.; Akca, O.; Köse, F.S.; Gökçay, D. Effect of drought stress on oxidative damage and antioxidant enzyme activity in melon seedlings. Turk. J. Biol. 2013, 37, 491–498. [Google Scholar] [CrossRef]
  36. Hughes, S.G.; Bryant, J.A.; Smirnoff, N. Molecular biology, application to studies of stress tolerance. In Plants under Stress. Biochemistry, Physiology and Ecology and Their Application to Plant Improvement; Cambridge University Press: Cambridge, UK, 1989; pp. 131–155. [Google Scholar]
  37. Saeidi, M.; Abdoli, M. Effect of drought stress during grain filling on yield and its components, gas exchange variables, and some physiological traits of wheat cultivars. J. Agric. Sci. Technol. 2015, 17, 885–898. [Google Scholar]
  38. Shivakrishna, P.; Reddy, K.A.; Rao, D.M. Effect of PEG-6000 imposed drought stress on RNA content, relative water content (RWC), and chlorophyll content in peanut leaves and roots. Saudi J. Biol. Sci. 2018, 25, 285–289. [Google Scholar]
  39. Agastian, P.; Kingsley, S.; Vivekanandan, M. Effect of salinity on photosynthesis and biochemical characteristics in mulberry genotypes. Photosynthetica 2000, 38, 287–290. [Google Scholar] [CrossRef]
  40. Ahmad, M.A.; Murali, P.; Marimuthu, G. Impact of salicylic acid on growth, photosynthesis and compatible solute accumulation in Allium cepa L. subjected to drought stress. Int. J. Agric. Food Sci. 2014, 4, 22–30. [Google Scholar]
  41. Cechin, I.; Cardoso, G.S.; Fumis, T.d.F.; Corniani, N. Nitric oxide reduces oxidative damage induced by water stress in sunflower plants. Bragantia 2015, 74, 200–206. [Google Scholar] [CrossRef] [Green Version]
  42. Sarker, U.; Oba, S. Drought stress enhances nutritional and bioactive compounds, phenolic acids and antioxidant capacity of Amaranthus leafy vegetable. BMC Plant Biol. 2018, 18, 258. [Google Scholar] [CrossRef] [Green Version]
  43. Verbruggen, N.; Hermans, C. Proline accumulation in plants: A review. Amino Acids 2008, 35, 753–759. [Google Scholar] [CrossRef]
  44. Ashraf, M.; Foolad, M.R. Roles of glycine betaine and proline in improving plant abiotic stress resistance. Environ. Exp. Bot. 2007, 59, 206–216. [Google Scholar] [CrossRef]
  45. Jaleel, C.A.; Manivannan, P.; Sankar, B.; Kishorekumar, A.; Panneerselvam, R. Calcium chloride effects on salinity-induced oxidative stress, proline metabolism and indole alkaloid accumulation in Catharanthus roseus. Comptes Rendus Biol. 2007, 330, 674–683. [Google Scholar] [CrossRef]
  46. Gill, S.S.; Tuteja, N. Reactive oxygen species and antioxidant machinery in abiotic stress tolerance in crop plants. Plant Physiol. Biochem. 2010, 48, 909–930. [Google Scholar] [CrossRef] [PubMed]
  47. Jariteh, M.; Ebrahimzadeh, H.; Niknam, V.; Mirmasoumi, M.; Vahdati, K. Developmental changes of protein, proline and some antioxidant enzymes activities in somatic and zygotic embryos of Persian walnut (Juglans regia L.). Plant Cell Tissue Organ Cult. PCTOC 2015, 122, 101–115. [Google Scholar] [CrossRef]
  48. Khan, M.N.; Zhang, J.; Luo, T.; Liu, J.; Ni, F.; Rizwan, M.; Fahad, S.; Hu, L. Morpho-physiological and biochemical responses of tolerant and sensitive rapeseed cultivars to drought stress during early seedling growth stage. Acta Physiol. Plant. 2019, 41, 25. [Google Scholar] [CrossRef]
  49. Hessini, K.; Martínez, J.P.; Gandour, M.; Albouchi, A.; Soltani, A.; Abdelly, C. Effect of water stress on growth, osmotic adjustment, cell wall elasticity and water-use efficiency in Spartina alterniflora. Environ. Exp. Bot. 2009, 67, 312–319. [Google Scholar] [CrossRef]
  50. Bartels, D.; Salamini, F. Desiccation tolerance in the resurrection plant Craterostigma plantagineum. A contribution to the study of drought tolerance at the molecular level. Plant Physiol. 2001, 127, 1346–1353. [Google Scholar] [CrossRef]
  51. Pareek, S.; Notterpek, L.; Snipes, G.J.; Naef, R.; Sossin, W.; Laliberte, J.; Iacampo, S.; Suter, U.; Shooter, E.M.; Murphy, R.A. Neurons promote the translocation of peripheral myelin protein 22 into myelin. J. Neurosci. 1997, 17, 7754–7762. [Google Scholar] [CrossRef] [PubMed] [Green Version]
  52. Razavizadeh, R.; Komatsu, S. Changes in essential oil and physiological parameters of callus and seedlings of Carum copticum L. under in vitro drought stress. J. Food Meas. Charact. 2018, 12, 1581–1592. [Google Scholar] [CrossRef]
  53. Abid, G.; Ouertani, R.N.; Muhovski, Y.; Jebara, S.H.; Hidri, Y.; Ghouili, E.; Abdelkarim, S.; Chaieb, O.; Souissi, F.; Zribi, F. Variation in antioxidant metabolism of faba bean (Vicia faba) under drought stress induced by polyethylene glycol reveals biochemical markers associated with antioxidant defense. Plant Biosyst.-Int. J. Deal. All Asp. Plant Biol. 2021, 155, 797–806. [Google Scholar] [CrossRef]
  54. Quan, N.T.; Anh, L.H.; Khang, D.T.; Tuyen, P.T.; Toan, N.P.; Minh, T.N.; Minh, L.T.; Bach, D.T.; Ha, P.T.T.; Elzaawely, A.A. Involvement of secondary metabolites in response to drought stress of rice (Oryza sativa L.). Agriculture 2016, 6, 23. [Google Scholar] [CrossRef] [Green Version]
  55. Josipović, A.; Sudar, R.; Sudarić, A.; Jurković, V.; Matoša Kočar, M.; Markulj Kulundžić, A. Total phenolic and total flavonoid content variability of soybean genotypes in eastern Croatia. Croat. J. Food Sci. Technol. 2016, 8, 60–65. [Google Scholar] [CrossRef] [Green Version]
  56. Miller, G.; Shulaev, V.; Mittler, R. Reactive oxygen signaling and abiotic stress. Physiol. Plant. 2008, 133, 481–489. [Google Scholar] [CrossRef] [PubMed]
  57. Kohli, S.K.; Khanna, K.; Bhardwaj, R.; Abd_Allah, E.F.; Ahmad, P.; Corpas, F.J. Assessment of subcellular ROS and NO metabolism in higher plants: Multifunctional signaling molecules. Antioxidants 2019, 8, 641. [Google Scholar] [CrossRef] [PubMed] [Green Version]
  58. Singh, A.; Kumar, A.; Yadav, S.; Singh, I.K. Reactive oxygen species-mediated signaling during abiotic stress. Plant Gene 2019, 18, 100173. [Google Scholar] [CrossRef]
  59. Yang, X.; Lu, M.; Wang, Y.; Wang, Y.; Liu, Z.; Chen, S. Response Mechanism of Plants to Drought Stress. Horticulturae 2021, 7, 50. [Google Scholar] [CrossRef]
  60. Sahoo, M.R.; Devi, T.R.; Dasgupta, M.; Nongdam, P.; Prakash, N. Reactive oxygen species scavenging mechanisms associated with polyethylene glycol mediated osmotic stress tolerance in Chinese potato. Sci. Rep. 2020, 10, 5404. [Google Scholar] [CrossRef] [Green Version]
  61. Zhu, Y.; Luo, X.; Nawaz, G.; Yin, J.; Yang, J. Physiological and biochemical responses of four cassava cultivars to drought stress. Sci. Rep. 2020, 10, 6968. [Google Scholar] [CrossRef] [Green Version]
  62. Karuppanapandian, T.; Moon, J.-C.; Kim, C.; Manoharan, K.; Kim, W. Reactive oxygen species in plants: Their generation, signal transduction, and scavenging mechanisms. Aust. J. Crop Sci. 2011, 5, 709–725. [Google Scholar]
  63. Mittler, R. Oxidative stress, antioxidants and stress tolerance. Trends Plant Sci. 2002, 7, 405–410. [Google Scholar] [CrossRef] [PubMed]
  64. Farooq, M.; Wahid, A.; Kobayashi, N.; Fujita, D.; Basra, S. Plant drought stress: Effects, mechanisms and management. In Sustainable Agriculture; Springer: Cham, Switzerland, 2009; pp. 153–188. [Google Scholar]
  65. Noctor, G.; Reichheld, J.-P.; Foyer, C.H. ROS-related redox regulation and signaling in plants. Semin. Cell Dev. Biol. 2018, 80, 3–12. [Google Scholar]
  66. Labudda, M.; Azam, F.M.S. Glutathione-dependent responses of plants to drought: A review. Acta Soc. Bot. Pol. 2014, 83, 3–12. [Google Scholar] [CrossRef]
  67. Young, S.-J.; Chu, Y.-L. Hydrothermal synthesis and improved CH3OH-sensing performance of ZnO nanorods with adsorbed Au NPs. IEEE Trans. Electron Devices 2021, 68, 1886–1891. [Google Scholar] [CrossRef]
  68. Dietz, K.-J.; Mittler, R.; Noctor, G. Recent progress in understanding the role of reactive oxygen species in plant cell signaling. Plant Physiol. 2016, 171, 1535–1539. [Google Scholar] [CrossRef] [Green Version]
  69. Bartoli, C.G.; Buet, A.; Gergoff Grozeff, G.; Galatro, A.; Simontacchi, M. Ascorbate-glutathione cycle and abiotic stress tolerance in plants. In Ascorbic Acid in Plant Growth, Development and Stress Tolerance; Springer: Berlin/Heidelberg, Germany, 2017; pp. 177–200. [Google Scholar]
  70. Musgrave, W.B.; Yi, H.; Kline, D.; Cameron, J.C.; Wignes, J.; Dey, S.; Pakrasi, H.B.; Jez, J.M. Probing the origins of glutathione biosynthesis through biochemical analysis of glutamate-cysteine ligase and glutathione synthetase from a model photosynthetic prokaryote. Biochem. J. 2013, 450, 63–72. [Google Scholar] [CrossRef] [Green Version]
  71. Rahman, A.; Hossain, M.; Mahmud, J.-A.; Nahar, K.; Hasanuzzaman, M.; Fujita, M. Manganese-induced salt stress tolerance in rice seedlings: Regulation of ion homeostasis, antioxidant defense and glyoxalase systems. Physiol. Mol. Biol. Plants 2016, 22, 291–306. [Google Scholar] [CrossRef]
  72. Chakraborty, K.; Bishi, S.K.; Goswami, N.; Singh, A.L.; Zala, P.V. Differential fine-regulation of enzyme driven ROS detoxification network imparts salt tolerance in contrasting peanut genotypes. Environ. Exp. Bot. 2016, 128, 79–90. [Google Scholar] [CrossRef]
Figure 1. The Iranian landraces of Cucurbita sp. seeds were collected: Bagabakhi (BG) (A), Tanbal Ajili (TA) (B), Razan (RA) (C).
Horticulturae 08 01117 g001
Figure 2. Effects of PEG and mannitol on ascorbate peroxidase (APX) activity (µM min−1 mg FW) (A), glutathione reductase (GR) activity (µM min−1 mg FW) (B), catalase (CAT) activity (µM min−1 mg FW) (C), guaiacol peroxidase (GPX) activity (µM min−1 mg FW) (D), and superoxide dismutase (SOD) activity (µM min−1 mg FW) (E) in Cucurbita sp. genotypes under in vitro condition. The different letters are significantly different based on Duncan’s multiple range test (p ≤ 0.05).
Horticulturae 08 01117 g002
Figure 3. Effects of PEG and mannitol on H2O2 (µM g−1 FW) (A), malondialdehyde (MDA) (nM g−1 FW) (B) in Cucurbita sp. genotypes under in vitro conditions. Different letters are significantly different based on Duncan’s multiple range test (p ≤ 0.05).
Horticulturae 08 01117 g003
Figure 4. Effects of PEG and mannitol on (AsA) (nM g−1 FW) (A), reduced glutathione (GSH) (nM g−1 FW) (B), dehydroascorbate (DHA) (nM g−1 FW) (C), oxidized glutathione (GSSG) (nM g−1 FW) (D), ASA/DHA) (E), and GSH/GSSG (F) in Cucurbita sp. genotypes under in vitro conditions. Different letters are significantly different based on Duncan’s multiple range test (p ≤ 0.05).
Horticulturae 08 01117 g004aHorticulturae 08 01117 g004b
Figure 5. Heat map of Pearson’s correlation analysis for the response of Cucurbita sp. to induced-osmotic stress by mannitol and PEG application under in vitro condition. The heat map represents of Coleoptile length, Shoot and Root FW and DW, Chlorophyll a (Chl a), Chlorophyll b (Chl b), Total chlorophyll (Total Chl), Carotenoids (CARs), Proline content, Malondialdehyde (MDA), H2O2 content, Total soluble protein content, Guaiacol peroxidase (GPX) activity, ascorbate peroxidase (APX) activity, Superoxide dismutase (SOD) activity, Reduced ascorbate (AsA), dehydroascorbate (DHA), AsA/DHA, Reduced glutathione (GSH), Oxidized glutathione (GSSG), GSH/GSSG, Total flavonoids content (TFC) and Total phenol content (TPC).
Horticulturae 08 01117 g005
Figure 6. Heat map (A), loading biplot of the evaluated traits (B) and principal component analysis heat map (C) of the enzymatic and non-enzymatic antioxidants pool, the morphological and the biochemical changes in Cucurbita sp. genotypes under induced-osmotic stress by mannitol and PEG application in in vitro condition. Heat map representing of Coleoptile length, Shoot and Root FW and DW, Chlorophyll a (Chl a), Chlorophyll b (Chl b), Total chlorophyll (Total Chl), Carotenoids (CARs), Proline content, Malondialdehyde (MDA), H2O2 content, Total soluble protein content, Guaiacol peroxidase (GPX) activity, Ascorbate peroxidase (APX) activity, Superoxide dismutase (SOD) activity, Reduced ascorbate (AsA), Rehydroascorbate (DHA), AsA/DHA, Reduced glutathione (GSH), Oxidized glutathione (GSSG), GSH/GSSG, Total flavonoids content (TFC) and Total phenol content (TPC).
Horticulturae 08 01117 g006aHorticulturae 08 01117 g006b
Table 1. Effect of osmotic stress induced by mannitol and PEG on morphological traits of Cucurbita sp. under in vitro culture condition.
SpeciesOsmotic AgentConcentration (M)Plant Characters
Hypocotyl Length (mm)Shoot FW
(g Seedling−1)
Shoot DW
(%)
Root FW
(g Seedling−1)
Root DW
(%)
BGControl024.38 ± 0.33 gh2.71 ± 0.20 a7.78 ± 0.40 k0.71 ± 0.11 a7.85 ± 0.30 g–i
Mannitol0.118.05 ± 1.29 h–j2.02 ± 0.29 b12.57 ± 1.05 f0.20 ± 0.03 ij9.09 ± 0.50 ef
0.213.47 ± 1.32 jk1.45 ± 0.24 cd18.13 ± 0.47 bc0.15 ± 0.03 j14.18 ± 0.33 a
0.47.20 ± 1.30 k1.12 ± 0.21 e–g20.66 ± 0.77 a0.13 ± 0.02 j13.52 ± 0.96 ab
PEG0.00920.90 ± 0.88 hi2.50 ± 0.10 a9.23 ± 0.13 i–k0.52 ± 0.07 cd9.912 ± 0.45 de
0.01217.69 ± 0.68 h–j1.75 ± 0.11 bc14.25 ± 1.17 de0.18 ± 0.04 ij11.31 ± 0.40 c
0.01515.06 ± 0.47 ij1.26 ± 0.12 d–f16.69 ± 0.33 c0.13 ± 0.02 j12.83 ± 0.42 b
TAControl070.72 ± 2.30 b1.65 ± 0.09 c9.04 ± 0.80 jk0.70 ± 0.06 a5.68 ±0.19 l
Mannitol0.143.73 ± 4.46 cd1.07 ± 0.07 e–g11.96 ± 0.32 fg0.30 ± 0.09 f–i7.04 ± 0.64 i–k
0.236.10 ± 5.83 ef1.00 ± 0.06 f–h12.71 ± 0.73 f0.25 ± 0.07 g–j9.17 ± 0.64 ef
0.413.05 ± 3.71 jk0.69 ± 0.10 i17.50 ± 1.08 bc0.12 ± 0.03 j10.79 ± 0.59 cd
PEG0.00969.83 ± 1.69 b1.45 ± 0.08 cd10.66 ± 0.34 g–i0.66 ± 0.11 ab6.25 ± 0.44 j–l
0.01233.46 ± 6.56 ef1.11 ± 0.10 e–g12.92 ± 0.98 ef0.37 ± 0.05 e–g8.19 ± 0.63 f–i
0.01512.06 ± 1.70 jk0.63 ± 0.09 i18.82 ± 0.41 b0.21 ± 0.04 ij11.03 ± 0.96 c
RAControl079.63 ± 8.64 a1.66 ± 0.13 c7.90 ± 0.42 k0.63 ± 0.02 a–c6.15 ± 0.61 kl
Mannitol0.139.52 ± 1.07 de1.22 ± 0.14 d–f9.79 ± 0.71 h–j0.54 ± 0.00 b–d7.31 ± 0.43 h–j
0.236.64 ± 2.32 d–f1.05 ± 0.13 e–g10.85 ± 1.03 gh0.47 ± 0.02 de8.12 ± 0.23 f–i
0.429.43 ± 0.65 fg0.87 ± 0.06 g–i12.57 ± 0.16 f0.34 ± 0.03 f–h9.61 ± 0.39 e
PEG0.00947.99 ± 3.47 c1.34 ± 0.07 de9.81 ± 0.43 h–j0.55 ± 0.04 b–d5.96 ± 0.38 kl
0.01238.30 ± 1.93 de1.08 ± 0.12 e–g12.52 ±1.00 f0.39 ± 0.10 ef8.33 ± 0.19 f–h
0.01524.91 ± 2.22 gh0.73 ± 0.04 hi15.20 ± 0.56 d0.24 ± 0.04 h–j8.95 ± 0.33 e–g
S.O.V.
Species
Osmotic agent
Species × Osmotic agent
Error
4207.017 **3.642 **48.868 **0.141 **73.052 **
2035.468 **1.614 **98.948 **0.312 **31.913 **
368.631 *0.096 **10.950 *0.025 **2.185 **
16.4720.0280.7530.0050.406
C.V. (%)12.3112.266.7119.087.00
* and ** indicated significant at 5% and 1% probability level, respectively. Mean with the same letter are not significantly different by Duncan grouping at (p ≤ 0.05) in each column. Balgabaghi (BG), Tanbal Ajili (TA), Razan (RA). S.O.V. and C.V. refers to the source of variation and coefficient of variation.
Table 2. Effect of osmotic stress induced by mannitol and PEG on photosynthesis pigments of Cucurbita sp. under in vitro culture conditions.
SpeciesOsmotic AgentConcentration (M)Character
Chl a
(mg kg−1 FW)
Chl b
(mg kg−1 FW)
Chl a + b
(mg kg−1 FW)
CARs
(mg kg−1 FW)
BGControl034.43 ± 0.44 a21.86 ± 2.38 a56.29 ± 2.80 a8.68 ± 0.33 a
Mannitol0.131.53 ± 3.27 b17.98 ± 0.59 b49.51 ± 3.55 b5.88 ± 1.04 c–e
0.223.87 ± 0.87 c15.48 ± 0.61 c39.35 ± 1.26 c4.83 ± 0.33 ef
0.420.17 ± 0.27 d7.94 ± 0.02 g28.12 ± 0.26 e3.30 ± 0.32 hi
PEG0.00934.23 ± 0.53 a15.68 ± 0.99 c49.91 ± 0.56 b6.96 ± 0.69 bc
0.01223.47 ± 0.93 c12.52 ± 0.99 d36.00 ± 0.91 d3.29 ± 0.15 hi
0.01519.79 ± 0.50 d9.71± 0.36 ef29.51 ± 0.76 e2.58 ± 0.29 ij
TAControl013.44 ± 0.91 f8.39 ± 0.42 fg21.84 ± 0.54 fg9.25± 0.57 a
Mannitol0.110.99 ± 0.49 g8.09 ± 0.44 fg19.09 ± 0.93 g7.04 ± 0.64 bc
0.27.84 ± 0.76 h–j4.83 ± 0.56 hi12.68 ± 0.47 hi4.61 ± 0.99 e–g
0.44.10 ± 0.68 kl2.67 ± 0.57 jk6.77 ± 1.10 kl1.94 ± 0.14 j
PEG0.0098.78 ± 0.66 g–i6.03 ± 0.71 h14.81 ± 1.27 h6.82 ± 0.26 b–d
0.0126.06 ± 0.46 jk3.02 ± 0.33 jk9.08 ± 0.79 jk4.96 ± 0.57 ef
0.0153.22 ± 0.17 l1.72 ± 0.23 k4.94 ± 0.41 l2.45 ± 0.16 ij
RAControl030.44 ± 2.41 b17.77 ± 0.45 b48.21 ± 2.57 b7.50 ± 1.41 b
Mannitol0.125.28 ±0.51 c14.79 ± 0.55 c40.08 ± 0.53 c5.61 ± 0.28 de
0.216.17 ± 0.71 e8.10 ± 0.25 fg24.27 ± 0.95 f3.45 ± 0.05 g–i
0.46.90 ± 0.35 ij3.83 ± 0.51 ij10.74 ± 0.84 ij2.49 ± 0.60 ij
PEG0.00920.63 ± 0.56 d10.38 ± 0.88 e31.01 ± 1.39 e6.31 ± 0.53 b–d
0.01213.96 ± 0.72 ef8.45 ± 0.80 fg22.41 ± 1.27 f4.21 ± 0.35 f–h
0.0159.69 ± 1.85 gh2.38 ± 0.06 jk12.08 ± 1.80 h–j1.98 ± 0.14 j
S.O.V.
Species1896.903 **473.298 **4262.121 **3.489 **
Osmotic agent328.683 **163.292 **946.994 **45.801 **
Species × Osmotic agent24.221 **9.261 **51.632 **1.077 *
Error1.9190.8863.1500.490
C.V. (%)7.979.806.5814.10
* and ** indicated significant at 5% and 1% probability level, respectively. Mean with the same letter are not significantly different by Duncan grouping at (p ≤ 0.05) in each column. Balgabaghi (BG), Tanbal Ajili (TA), Razan (RA). Chl a, Chl b, Chl a + b, CARs, S.O.V., and C.V. refers to chlorophyll a, chlorophyll b, chlorophyll a + b, carotenoids content, source of variation and coefficient of variation.
Table 3. Effect of osmotic stress induced by mannitol and PEG on proline, total protein, TPC, and TFC traits of Cucurbita sp. under in vitro condition.
SpeciesOsmotic AgentConcentration (M)Character
Proline
(µm g−1 FW)
Total Protein
(mg g−1 FW)
TPC
(mg g−1 DW)
TFC
(mg g−1 DW)
BGControl06.75 ± 0.13 gh1.60 ± 0.12 b–e33.67 ± 1.25 gh5 ± 0.82 de
Mannitol0.18.21 ± 1.44 fg1.73 ± 0.22 a–d56 ± 2.45 a11.67 ± 1.25 a
0.212.26 ± 0.92 c–e1.97 ± 0.21 a46 ± 1.41 c5.333 ± 0.47 d
0.416.17 ± 1.68 b1.56 ± 0.39 c–e29.67 ± 1.25 ij2.167 ± 0.45 g–i
PEG0.00910.30 ± 0.71 ef1.80 ± 0.20 a–c51 ± 2.16 b9.667 ± 0.47 b
0.01214.76 ± 1.91 b–d1.98 ± 0.26 a41.67 ± 1.25 de2.333 ± 0.47 gh
0.0154.23 ± 0.69 h0.81 ± 0.05 h–j25.67 ± 2.49 kl1.433 ± 0.17 h–j
TAControl06.83 ± 1.83 gh0.81 ± 0.01 h–j27 ± 2.16 jk3.733 ± 0.38 f
Mannitol0.112.92 ± 0.54 b–e0.99 ± 0.01 g–i41 ± 1.41 de6.667 ± 0.47 c
0.215.45 ± 0.39 bc1.30 ± 0.05 e–g33.67 ± 1.70 gh4.067 ± 0.25 ef
0.424.11 ± 4.71 a1.11 ± 0.09–h20 ± 0.82 mn1.533 ± 0.21 h–j
PEG0.0098.00 ± 0.81 fg1.29 ± 0.17 e–g38.33 ± 0.94 ef5.400 ± 0.43 d
0.01213.10 ± 0.89 b–e1.33 ± 0.15 e–g22.67 ± 1.70 lm2.633 ± 0.45 g
0.0154.52 ± 1.89 h0.82 ± 0.05 h–j17.67 ± 1.25 n1.167 ± 0.13 ij
RAControl05.96 ± 0.71 gh0.61 ± 0.15 j36 ± 1.63 fg4.267 ± 0.38 ef
Mannitol0.111.57 ± 0.41 de1.34 ± 0.05 e–g49.67 ± 0.47 b5.7 ± 0.36 d
0.212.48 ± 0.33 c–e1.92 ± 0.12 ab43 ± c2.45 d3.8 ± 0.16 f
0.414.46 ± 0.68 b–d1.07 ± 0.07 g–i32.33 ± 0.47 g–i2.1 ± 0.22 g–i
PEG0.00910.05 ± 0.45 ef1.09 ± 0.15 gh45.67 ± 2.06 c4.3 ± 0.16 ef
0.01211.87 ± 0.56 de1.45 ± 0.16 d–f32 ± 1.63 hi1.767 ± 0.21 g–j
0.0153.81 ± 0.65 h0.72 ± 0.06 ij23 ± 2.16 lm1.033 ± 0.13 j
S.O.V.
Species26.633 **1.815 **799.302 **26.634 **
Osmotic agent198.032 **0.865 **850.106 **56.207 **
Species × Osmotic agent15.362 **0.182 **21.431 **5.423 **
Error3.1130.0364.2700.316
C.V. (%)16.2614.605.8213.76
** indicated significant at 1% probability level. Mean with the same letter are not significantly different by Duncan grouping at (p ≤ 0.05) in each column. Balgabaghi (BG), Tanbal Ajili (TA), Razan (RA). TPC, TFC, Chl a + b, CARs, S.O.V. and C.V. refers total phenol content, total flavonoid content, and source of variation and coefficient of variation.
Table 4. The ANOVA analysis of the effects of PEG and mannitol on enzyme activity in Cucurbita sp. genotypes under in vitro conditions.
Mean Square
dfCAT ActivityGR ActivityAPX ActivityGPX ActivitySOD Activity
Species28.137 **0.595 **0.756 **0.027 ns1449.242 **
Osmotic agent64.809 **0.252 **0.237 **2.464 **850.888 **
Species × Osmotic agent120.092 **0.011 **0.011 **0.043 *111.711 **
Error420.0160.0010.0020.0227.190
C.V. (%) 5.108.429.039.485.94
*, **, and ns significant at p ≤ 0.05 and p ≤ 0.01, and non-signifcant respectively. S.O.V., df, and C.V. refer to the source of variation, degree of freedom, and coefficient of variation, respectively.
Table 5. The ANOVA analysis of the effects of PEG and mannitol on biochemical and non-enzymes activity in Cucurbita sp. genotypes under in vitro conditions.
Mean Square
dfAsADHAASA/DHAGSHGSSGGSH/GSSGH2O2MDA
Species2120,832.68 **56,691.4836.608 **91879 **24,595.85 **16.07 **19.583 **12.708 **
Osmotic agent69104.22 **15,851.959.536 **10,168.21 **5246.95 **2.711 **5.294 **3.335 **
Species × Osmotic agent12756.35 **896.862.373 **682.037 **240.63 **0.095 **0.314 **0.323 **
Error4213.95214.630.0199.09511.060.0040.0130.026
C.V. (%) 22.717.390.992.052.904.649.12
** significant at p ≤ 0.01, respectively. S.O.V., df and C.V. refer to the source of variation, degree of freedom and coefficient of variation, respectively.
Publisher’s Note: MDPI stays neutral with regard to jurisdictional claims in published maps and institutional affiliations.

