Article

The Impact of Viticulture on Soil Characteristics and Microbial Communities in the Ningxia Region of Northwest China

1
School of Food & Wine, Ningxia University, Yinchuan 750021, China
2
Engineering Research Center of Grape and Wine, Ministry of Education, Yinchuan 750021, China
3
Ningxia Grape and Wine Engineering Technology Center, Yinchuan 750021, China
4
School of Agriculture, Ningxia University, Yinchuan 750021, China
*
Authors to whom correspondence should be addressed.
Horticulturae 2022, 8(12), 1097; https://doi.org/10.3390/horticulturae8121097
Submission received: 9 October 2022 / Revised: 10 November 2022 / Accepted: 16 November 2022 / Published: 22 November 2022

Abstract

:
Winegrape cultivation has become increasingly common throughout northwest China over the past 20 years, and such viticulture can profoundly impact the properties of the utilized soil and the associated soil microbial communities. To explore these effects in the present study, samples of soil were collected from control desert soil and from vineyards planted in different years: Cabernet Sauvignon (CS, 2014), Merlot (M, 2012), and Italian Riesling (IR, 2008). The properties of this soil and the microbial communities therein were assessed through a series of physicochemical, enzymatic, and high-throughput sequencing analyses. Compared to the control soil, respective 1033.06 U/g, 398.28 U/g, and 240.56 U/g increases in alkaline phosphatase activity levels were observed in the CS, M, and IR soil samples. Stable soil bacterial richness was observed in the control, CS, and M samples, but decreased in the 11-years old IR soil, whereas no noticeable changes in soil fungi were observed across these samples. The network analyses highlighted correlations among soil microbes, and soil organic carbon and microbial biomass carbon were found to strongly influence variability in these soil microbial communities. Overall, these findings thus provide strong evidence that the prolonged monoculture of winegrapes can contribute to the deterioration of soil quality.

1. Introduction

The total viticultural area in China, as of 2021, was estimated to exceed 8.30 × 10⁵ ha, with the majority of such winegrape growth being focused in the northwest of the country. The arid Hongsibu District, located in Ningxia in Northwest China, exhibits substantial differences between daytime and nighttime temperatures that, together with the dry climatic conditions in this area, make winegrapes one of the few crops that can be reliably cultivated in this area. Accordingly, large swathes of desertified land in this region have been reclaimed for viticulture over the past two decades, with an estimated winegrape planting area of 7067 ha in 2018 [1]. The important winegrowing region, located at the eastern foot of Helan Mountain, has been given a national geographic indication and is home to six different winegrape-producing regions, among which the Hongsibu District is ranked first. The wine industry in this area has expanded significantly since 2007, with chateaus and growers having increasingly leveraged the appropriate climatic conditions of this region and the high levels of cultivatable area to pursue viticulture. Wine industry planning efforts forecast that the winegrape-producing area in Hongsibu will expand to ~15,200 ha as of 2025. Most studies of wine production conducted to date have analyzed specific winegrape cultivars [2], anthocyanin [3], polymeric polyphenols [4], irrigation technology [5,6], soil types and fertilization management [7], the biocontrol of pest species [8], wine quality [9,10], and wine regions [11]. In contrast, there have been few studies of the impacts of viticulture on soil characteristics and the composition and diversity of soil microbial communities over time.
Several different biological, physical, and chemical properties ultimately determine the overall quality of soil [12], with pH, available nutrient levels, soil organic carbon (SOC), soil bulk density, and porosity, all being commonly utilized quality indices [13,14]. Decreases in any of these indices can be indicative of a risk to the long-term integrity of the soil in a given site [15]. The prolonged cultivation of crops can adversely impact many of these parameters, including soil nitrogen content, SOC [16], and soil enzyme activities [17]. Such agricultural activity can also negatively affect the microbial communities present within the soil [18,19]. However, changes in the composition and diversity of these soil microbial communities as a result of crop cultivation in desertified areas have not been fully characterized to date. Studies of the impact of winegrape planting on soil enzyme activity and microbial community composition in semi-arid regions are thus warranted to provide insight into the long-term effects of viticulture on overall soil quality.
Levels of soil enzyme activity are important to the transformation of soil carbon, phosphorus, and ammonia, and can reflect the microbial communities, soil organic matter content, and other soil properties that may be impacted by agricultural management practices [20]. Accordingly, soil enzymes are frequently evaluated when assessing soil quality [21]. While the physicochemical and biological characteristics of soil have been studied in a diverse range of ecosystems [22,23,24], how soil enzyme activity levels respond to long-term crop planting has yet to be clearly established [25]. Soil urease activity can serve as an indicator of the nitrogen supply in the soil, while higher levels of sucrase activity generally coincide with elevated microbial content and higher levels of soil organic matter, phosphorus, and nitrogen availability [26]. Moreover, alkaline phosphatase activity is associated with soil fertility, bioactivity, and organophosphate mineralization [27]. Consistent with these characteristics, changes in soil quality can profoundly impact the levels of soil urease, sucrase, and alkaline phosphatase activity [28]. Activity levels for all three of these enzymes are reportedly higher in soil from cultivated farmland as compared to desert soil [29]. Data examining the time-dependent changes in soil enzyme activity levels following desertified land reclamation and prolonged winegrape cultivation, however, are lacking at present.
The communities of microbes within the soil are extremely sensitive to shifts in local physicochemical properties [30] or altered land use [31,32,33]. The cultivation of winegrapes can reportedly contribute to increases in soil pH, root-zone microbial diversity, and other soil physicochemical properties, with these effects being largely mediated by SOC and available nitrogen content [34]. The richness and diversity of bacterial communities in soil samples gradually increased from desertified land to land that had been used to grow cotton for 5 years, with such diversity remaining stable after 5 years, although the number of years of cotton planting had no corresponding impact on the richness or diversity of soil fungal communities [29]. Changes in land use in desert-oases can reportedly alter soil chemical characteristics, thereby significantly altering the diversity and overall composition of soil bacterial communities [35]. In light of the above evidence, the present study was conducted based on the hypotheses that: (1) winegrape planting will enhance soil properties and enzyme activity levels and will alter the diversity and composition of soil microbial communities; and (2) prolonged winegrape planting will contribute to the progressive deterioration of soil quality and concomitant reductions in soil microbial diversity.

2. Materials and Methods

2.1. Study Area

This study was conducted in the Hongsibu District of Ningxia located at 37°28′08″–37°37′23″ N and 105°43′45″–106°42′50″ E. The region exhibits a typical temperate continental climate, with an average annual precipitation of 251 mm and an average annual evaporation of 2387 mm. The region is exposed to 2900–3500 h of sunshine per year, and is subject to average annual accumulated temperatures (≥10 °C) of over 3200 °C. Vineyards included in this study were maintained with conventional management practices and were arranged with grapevines that had been planted in a north-south orientation with 0.5 m vine spacing and 3 m row spacing. Cultivation strategies used for Merlot (M), Italian Riesling (IR), and Cabernet Sauvignon (CS) winegrapes in these vineyards included crawled cordon training, single cane ‘Dulonggan’, and horizontal cordon training, respectively. The average amount of organic fertilizer applied to these vineyards per year was 30.00 t·hm−2, with an annual topdressing of 0.55 kg of pure nitrogen, 0.32 kg of P2O5, and 0.78 kg of K2O. The annual irrigation amount was 3900 t·hm−2.

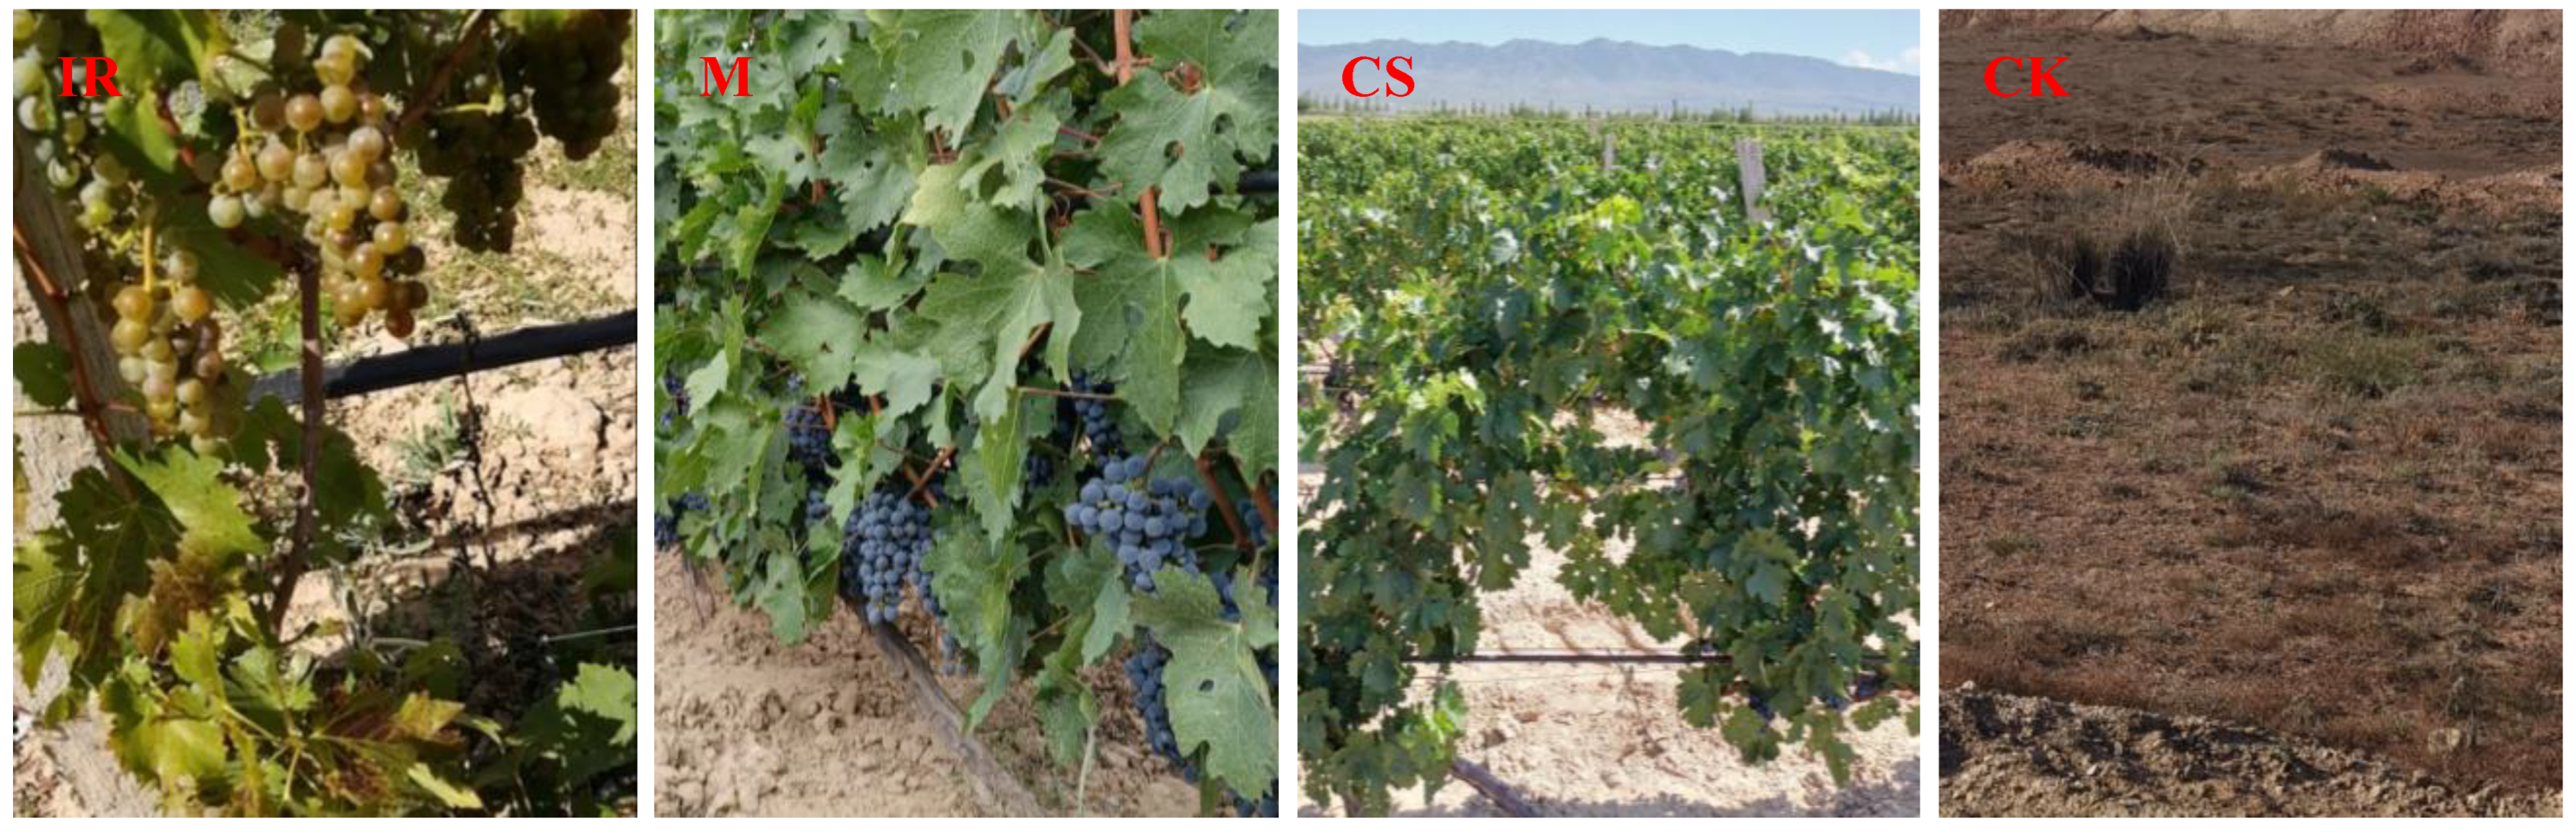
2.2. Experimental Design and Soil Collection

Winegrape plots and counterplots were selected in September 2019, and included IR, M, and CS vineyards that had been respectively established in 2008, 2012, and 2014; corresponding to 11, 7, and 5 years of continuous viticulture (Figure 1). The IR soil samples were collected from Ningxia Red Carrin Winery, while the M and CS soil samples were from the Xiaojiayao winegrapes planting area. Control (CK) uncultivated soil samples were collected from two study sites and adjacent vineyards, and were evenly mixed in equal amounts.
A serpentine sampling approach was used to collect eight grapevines root-zone soil samples and eight control samples from all selected sample plots (667 m2). Briefly, a soil drill (diameter: 5 cm) was used to remove surface litter from the sampling site, after which the 0–20 cm soil layer was collected. Then, five samples of undisturbed soil at a depth of ~10 cm were collected from these cores, and a corer (diameter: 5 cm; 100 cm3) was used to measure soil bulk density. Samples were transported to the laboratory in a cooler in sealed plastic bags, and were then passed through a 2 mm sieve to eliminate any large debris or roots. Each of the remaining three soil samples were then separated into two subsamples, one of which was used to analyze soil enzyme activity levels and physicochemical properties, while the other was stored at −80 °C for subsequent analyses of microbial community structure.

2.3. Soil Physicochemical Analyses

After measuring soil total carbon content, soil inorganic carbon levels were measured, and the difference between these two values was used to compute SOC content. Soil samples were soaked for 20 min in water at a 2.5:1 water-to-soil ratio, after which soil was extracted using ultrapure water and the potentiometric method was used to measure soil pH. Elimination boiling and flow injection were employed to measure soil total nitrogen and total phosphorus levels [36,37], while alkaline hydrolysis diffusion was used to measure soil available nitrogen, and a molybdenum antimony anti-colorimetric method was used to measure soil available phosphorus [37]. Soil ammonium nitrogen and nitrate nitrogen levels were detected by extracting samples using 2 mol/L KCl followed by flow injection analysis [38]. NaOH alkali melting and flame photometry were used to measure total potassium, while available potassium was assessed via ammonium acetate leaching and flame photometry [37]. Chloroform fumigation and K2SO4 extraction were used to examine soil microbial biomass carbon (MBC) [39], while soil dissolved organic carbon (DOC) was determined via extraction and TOC [40].

2.4. Soil Enzyme Activity Analyses

Soil urease activity (mg of NH4+-N per g of soil after culture for 24 h) was measured via the phenol-sodium hypochlorite colorimetric method. Commercial kits were used to measure soil alkaline phosphatase, sucrase, amylase, ligninase, cellulase, and β-glucosidase activity levels (Beijing Solebo Biotechnology Co., Ltd., Beijing, China). One unit of alkaline phosphatase activity was defined as 1 nmol phenol released per g of soil per day at 37 °C [21]. Soil sucrase and cellulase activity levels were analyzed with a 3, 5-dinitrosalicylic acid-based colorimetric technique [41]. The sucrase activity was expressed as the number of glucose milligrams per g of dry soil in 24 h, and one unit of cellulase activity was defined per g of soil sample per day with 1 mg glucose.

2.5. DNA Extraction, Amplification and Sequencing

Total DNA was isolated from 0.5 g of soil per sample with the OMEGA Soil DNA Kit (catalog No. D5625-01) based on provided directions. PCR amplification was then performed for the bacterial 16S rRNA V3-V4 region using the following primers: 338F (5′-ACTCCTACGGGAGGCAGCA-3′) and 806R (5′-GGACTACHVGGGTWTCTAAT-3′). The ITS5F (5′-GGAAGTAAAAGTCGTAACAAGG-3′) and ITS2R (5′-GCTGCGTTCTTCATCGATGC-3′) primers were used for PCR amplification of the fungal ITS V1 hypervariable region [42]. Thermal cycling consisted of initial denaturation at 98 °C for 5 min, followed by 28 cycles consisting of denaturation at 98 °C for 30 s, annealing at 52 °C for 45 s, and extension at 72 °C for 45 s, with a final extension of 5 min at 72 °C. After amplification these samples were separated via 2% agarose gel electrophoresis, and target bands were excised and purified with the Axygen gel recovery kit. Samples were then mixed and a library was established with the Illumina TruSeq Nano DNA LT Library Prep Kit, followed by the sequencing of qualified libraries with the Illumina MiSeq platform by Shanghai Pasenol Biotechnology Co., LTD., Shanghai, China.

2.6. Sequencing Data Processing

Raw sequencing data were screened for quality, separated into individual samples based on barcodes, and barcode sequences were removed. Unqualified sequences (<200 bp, no fuzzy bases, average quality score <20) were eliminated by filtering linker sequences. Primer removal, quality filtering, denoising, and chimeric sequence removal were performed with DADA2. Similarity clustering was not performed, with de-duplication instead being conducted to cluster at a 100% similarity level. Amplicon Sequence Variants (ASVs) were generated based on quality control criteria using QIIME2 DADA2 [43]. Samples were flattened to the same depth (95% of the minimum sample sequence volume), and numbers of ASVs and relative richness in each sample were then assessed at the defined sequencing depth [44]. The Silva database was used to annotate bacterial species based on 16S rRNA sequences [45], while the UNITE database was used to annotate fungi based on ITS sequences [46].

2.7. Statistical Analyses

Soil bacterial and fungal community diversity at the ASVs level was analyzed with the Chao1, Observed species, Shannon, and Simpson indices using QIIME2 (2019.4) and the R GgploT2 package (v3.2.0). A Venn diagram was constructed from a flattened ASVs table and used to assess similarities among the bacterial and fungal communities in different samples of soil using the R Venn Diagram package. The R Vegan package was used to conduct a principal coordinate analysis (PCoA) assessing differences in these soil microbial communities according to Bray-Curtis distance values. The similarity of communities across soil types was evaluated with a hierarchical clustering analysis using the R pheatmap package. A Linear Discriminant Analysis (LDA) Effect Size (LEfSe) approach was used to define plot-related biomarkers using the Python LEfSe and R ggtree packages [47]. The correlation matrix was conducted using the SparCC algorithm, and the construction of the correlation network was employed by the igraph software package. Canoco 5.0 was used to assess correlations between soil properties and microbial communities via a Redundancy Analysis (RDA) and Canonical Correspondence Analysis (CCA) approach. Associations between soil properties and microbial communities were analyzed with Pearson’s correlation analyses in SPSS 24.0, and the normality of data distributions and linear correlation analyses were performed.

3. Results

3.1. Soil Properties and Enzyme Activities

Initial analyses revealed that differences in winegrape planting years had a significant impact on soil available nitrogen, available phosphorus, available potassium, SOC, DOC, and bulk density (Table 1). Specifically, soil total nitrogen, total phosphorus, and DOC rose in response to winegrape cultivation, whereas significantly lower levels of available phosphorus and available potassium levels were evident in the soil from the three analyzed vineyards (p < 0.05). Significantly higher levels of available nitrogen (35.88 mg/kg) were evident in CS soil relative to other soil samples (p < 0.05), with these levels being 2.66-fold and 4.14-fold higher than the respective levels in M and IR soil samples. The SOC levels in vineyard soils were significantly higher than in CK soil (p < 0.05), with levels rising from CK (1.83 g/kg) to CS (3.86 g/kg) soil before declining slightly in IR soil (2.29 g/kg). DOC levels exhibited trends consistent with the SOC trends. Viticulture was also associated with increases in soil pH and significant reductions in soil bulk density. Overall, these results suggested that winegrape planting was associated with improvements in soil nutrient levels but that these benefits declined as the number of planting years increased.
Viticulture also impacts the soil enzyme activity levels in these study sites, contributing to increases in soil alkaline phosphatase, sucrase, and amylase activities (Table 2). Significantly higher levels of alkaline phosphatase and amylase activity were measured in vineyard soil samples relative to CK samples (p < 0.05), with alkaline phosphatase levels in the CS, M, and IR samples being 1033.06 U/g, 398.28 U/g, and 240.56 U/g higher than in CK samples, respectively. Decreases in alkaline phosphatase and sucrase activity were observed from the CS to the M and IR samples, suggesting that these activity levels trended downwards with increasing winegrape planting age. Pearson correlation analyses showed that an extremely significant positively correlation was observed between soil urease and ammonium nitrogen (r = 0.88, p < 0.01). Alkaline phosphatase activity was significantly positive correlated with the total nitrogen (r = 0.60, p < 0.05) and SOC (r = 0.92, p < 0.01). A significantly positive correlation was also evident between sucrase and both total nitrogen, total phosphorus, total potassium and SOC, whereas ligninase and β-Glucosidase were significant negative correlated with available phosphorus (Table S1).

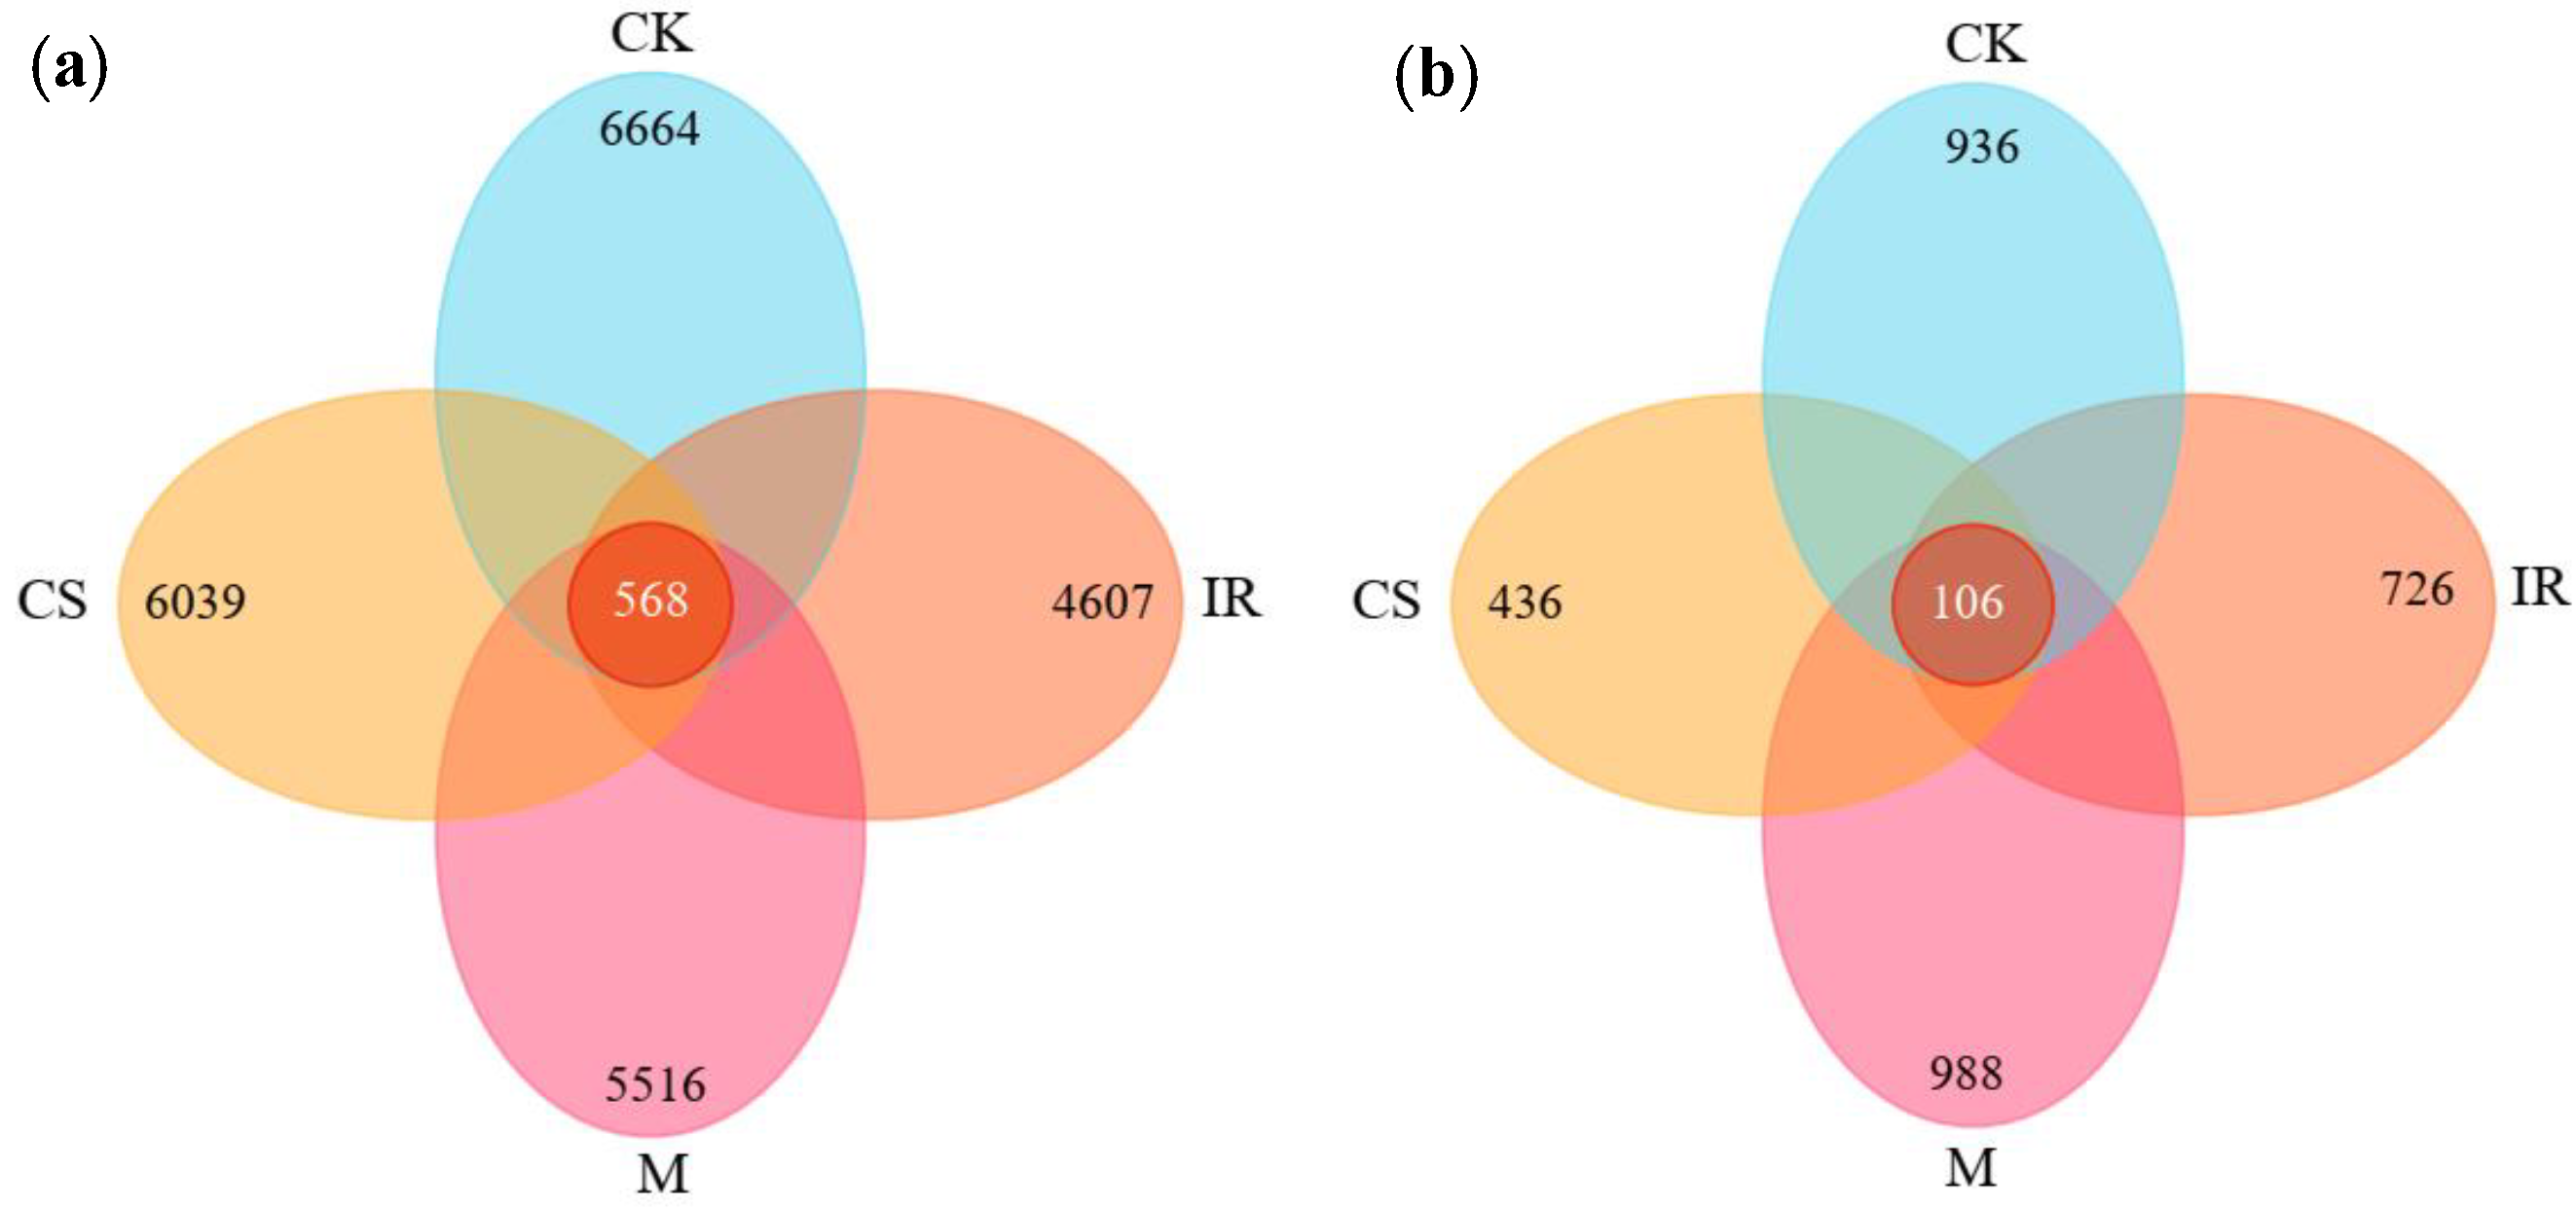
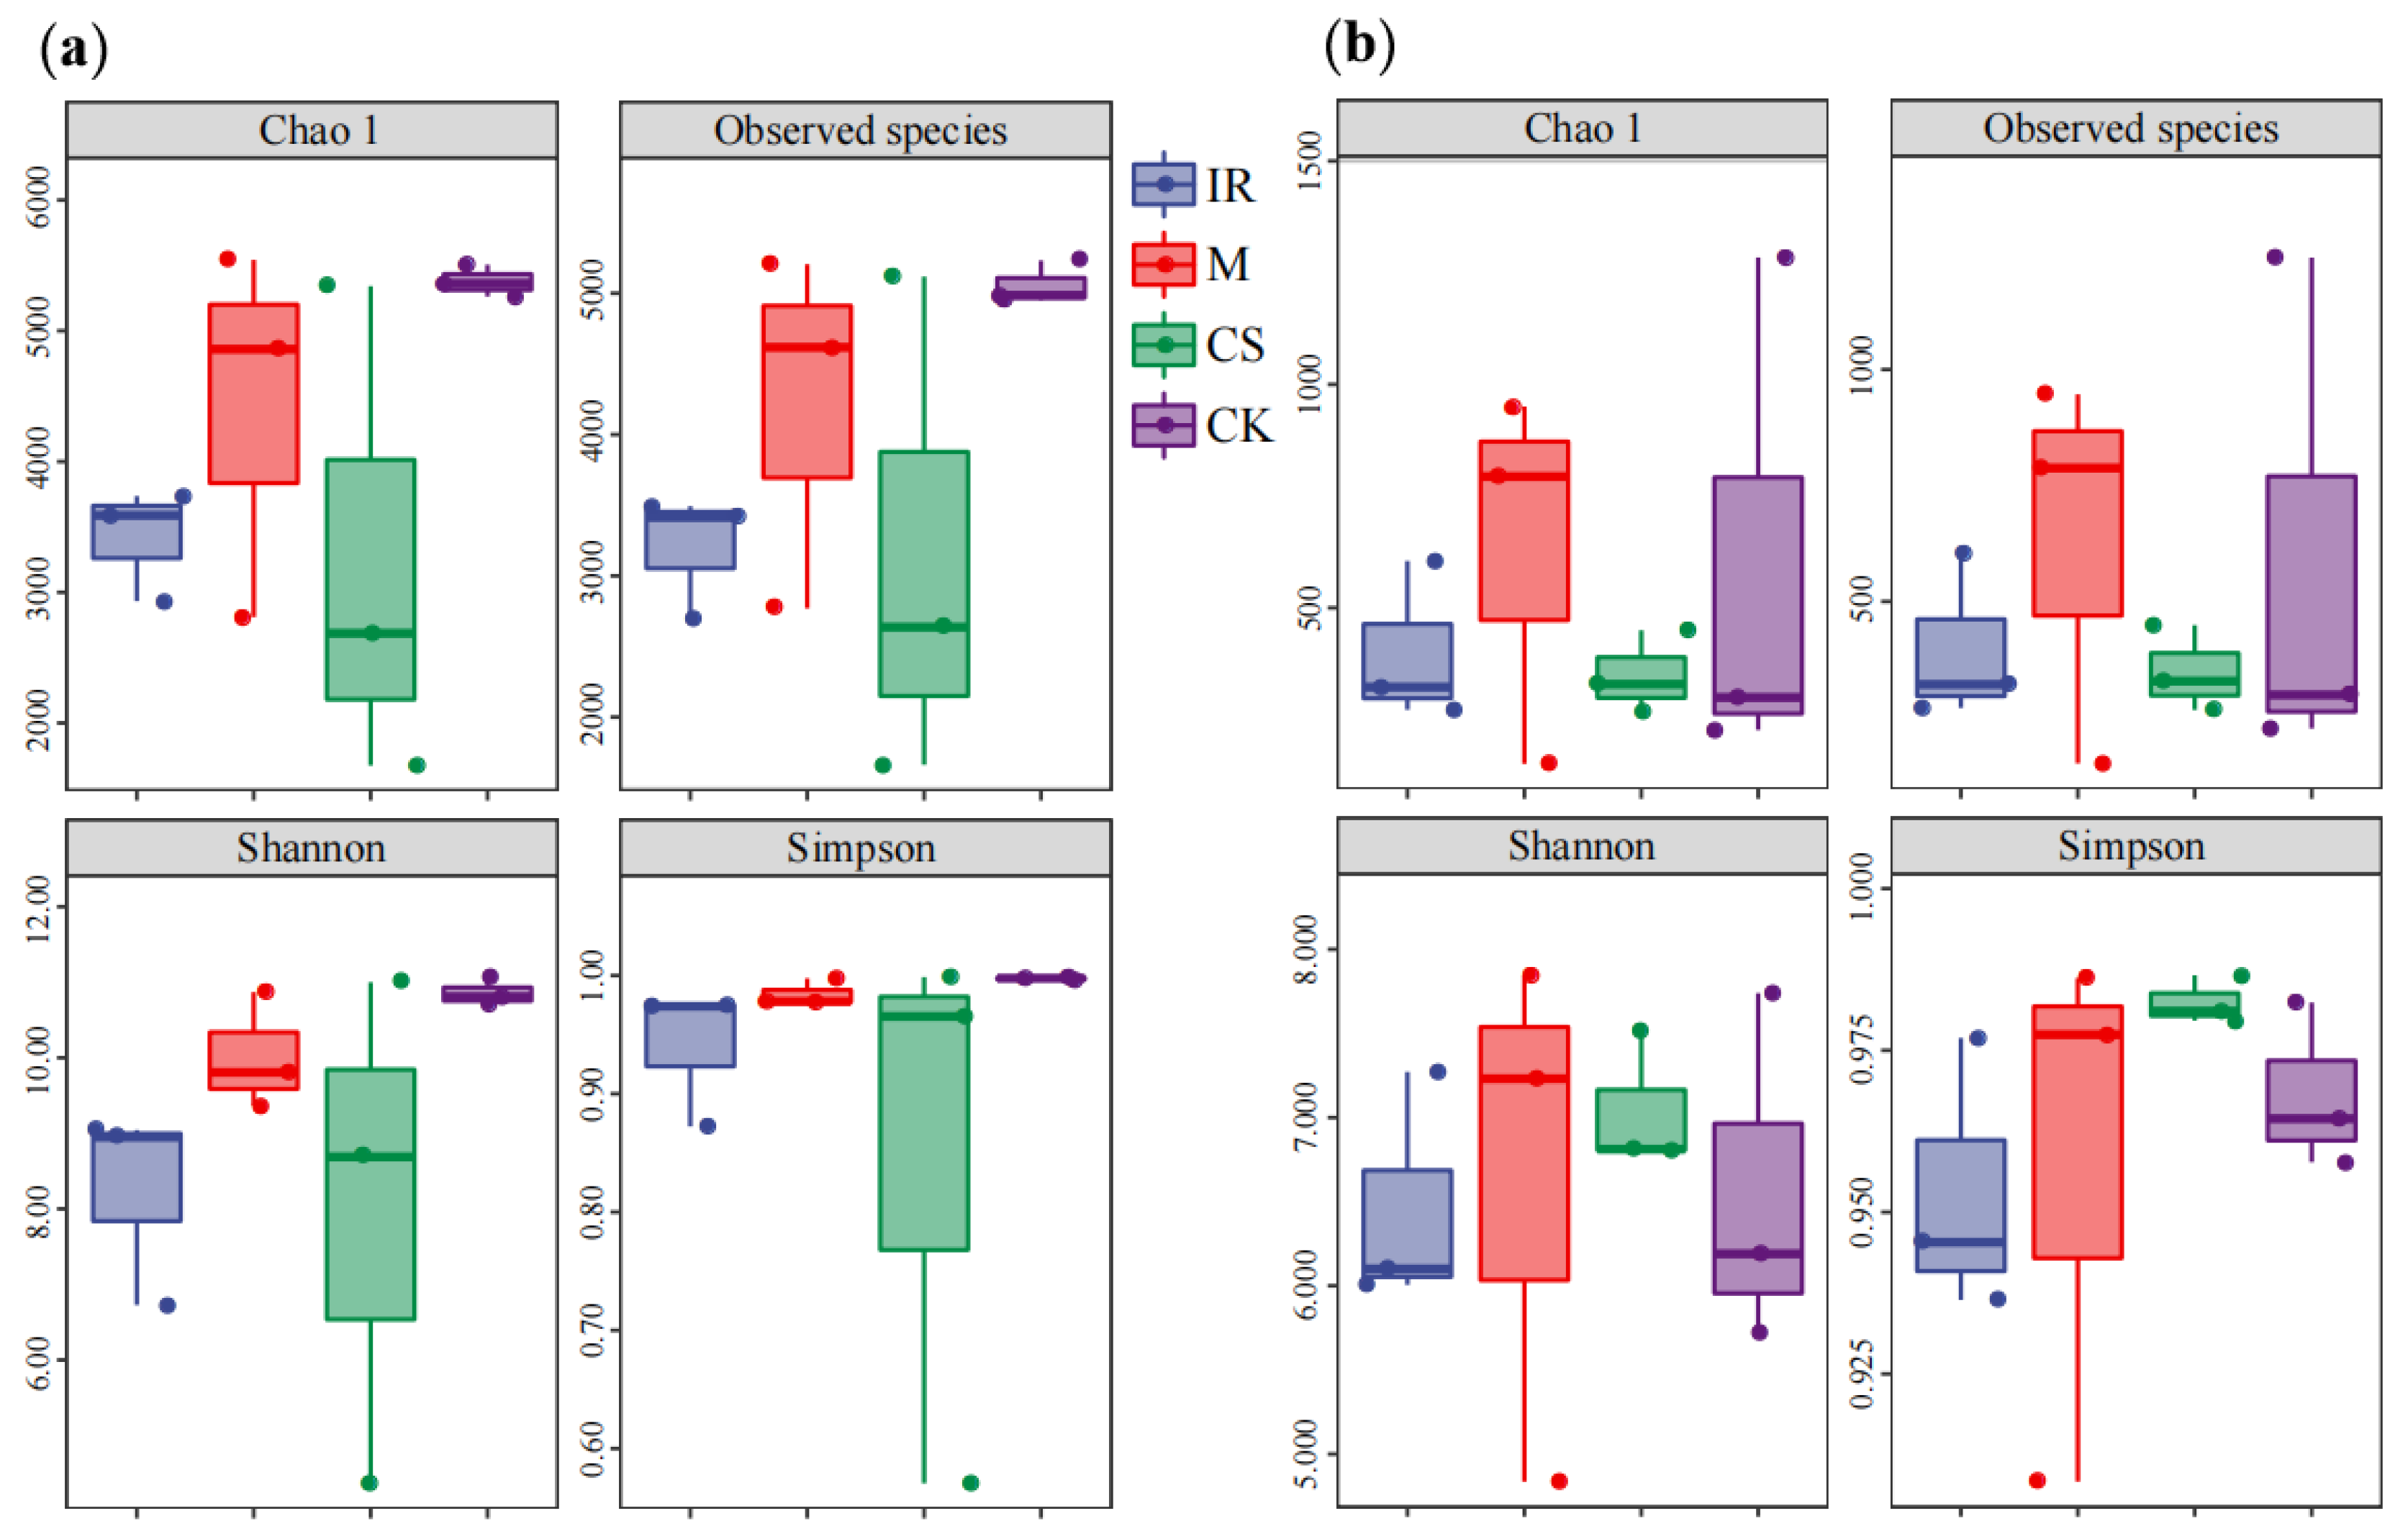
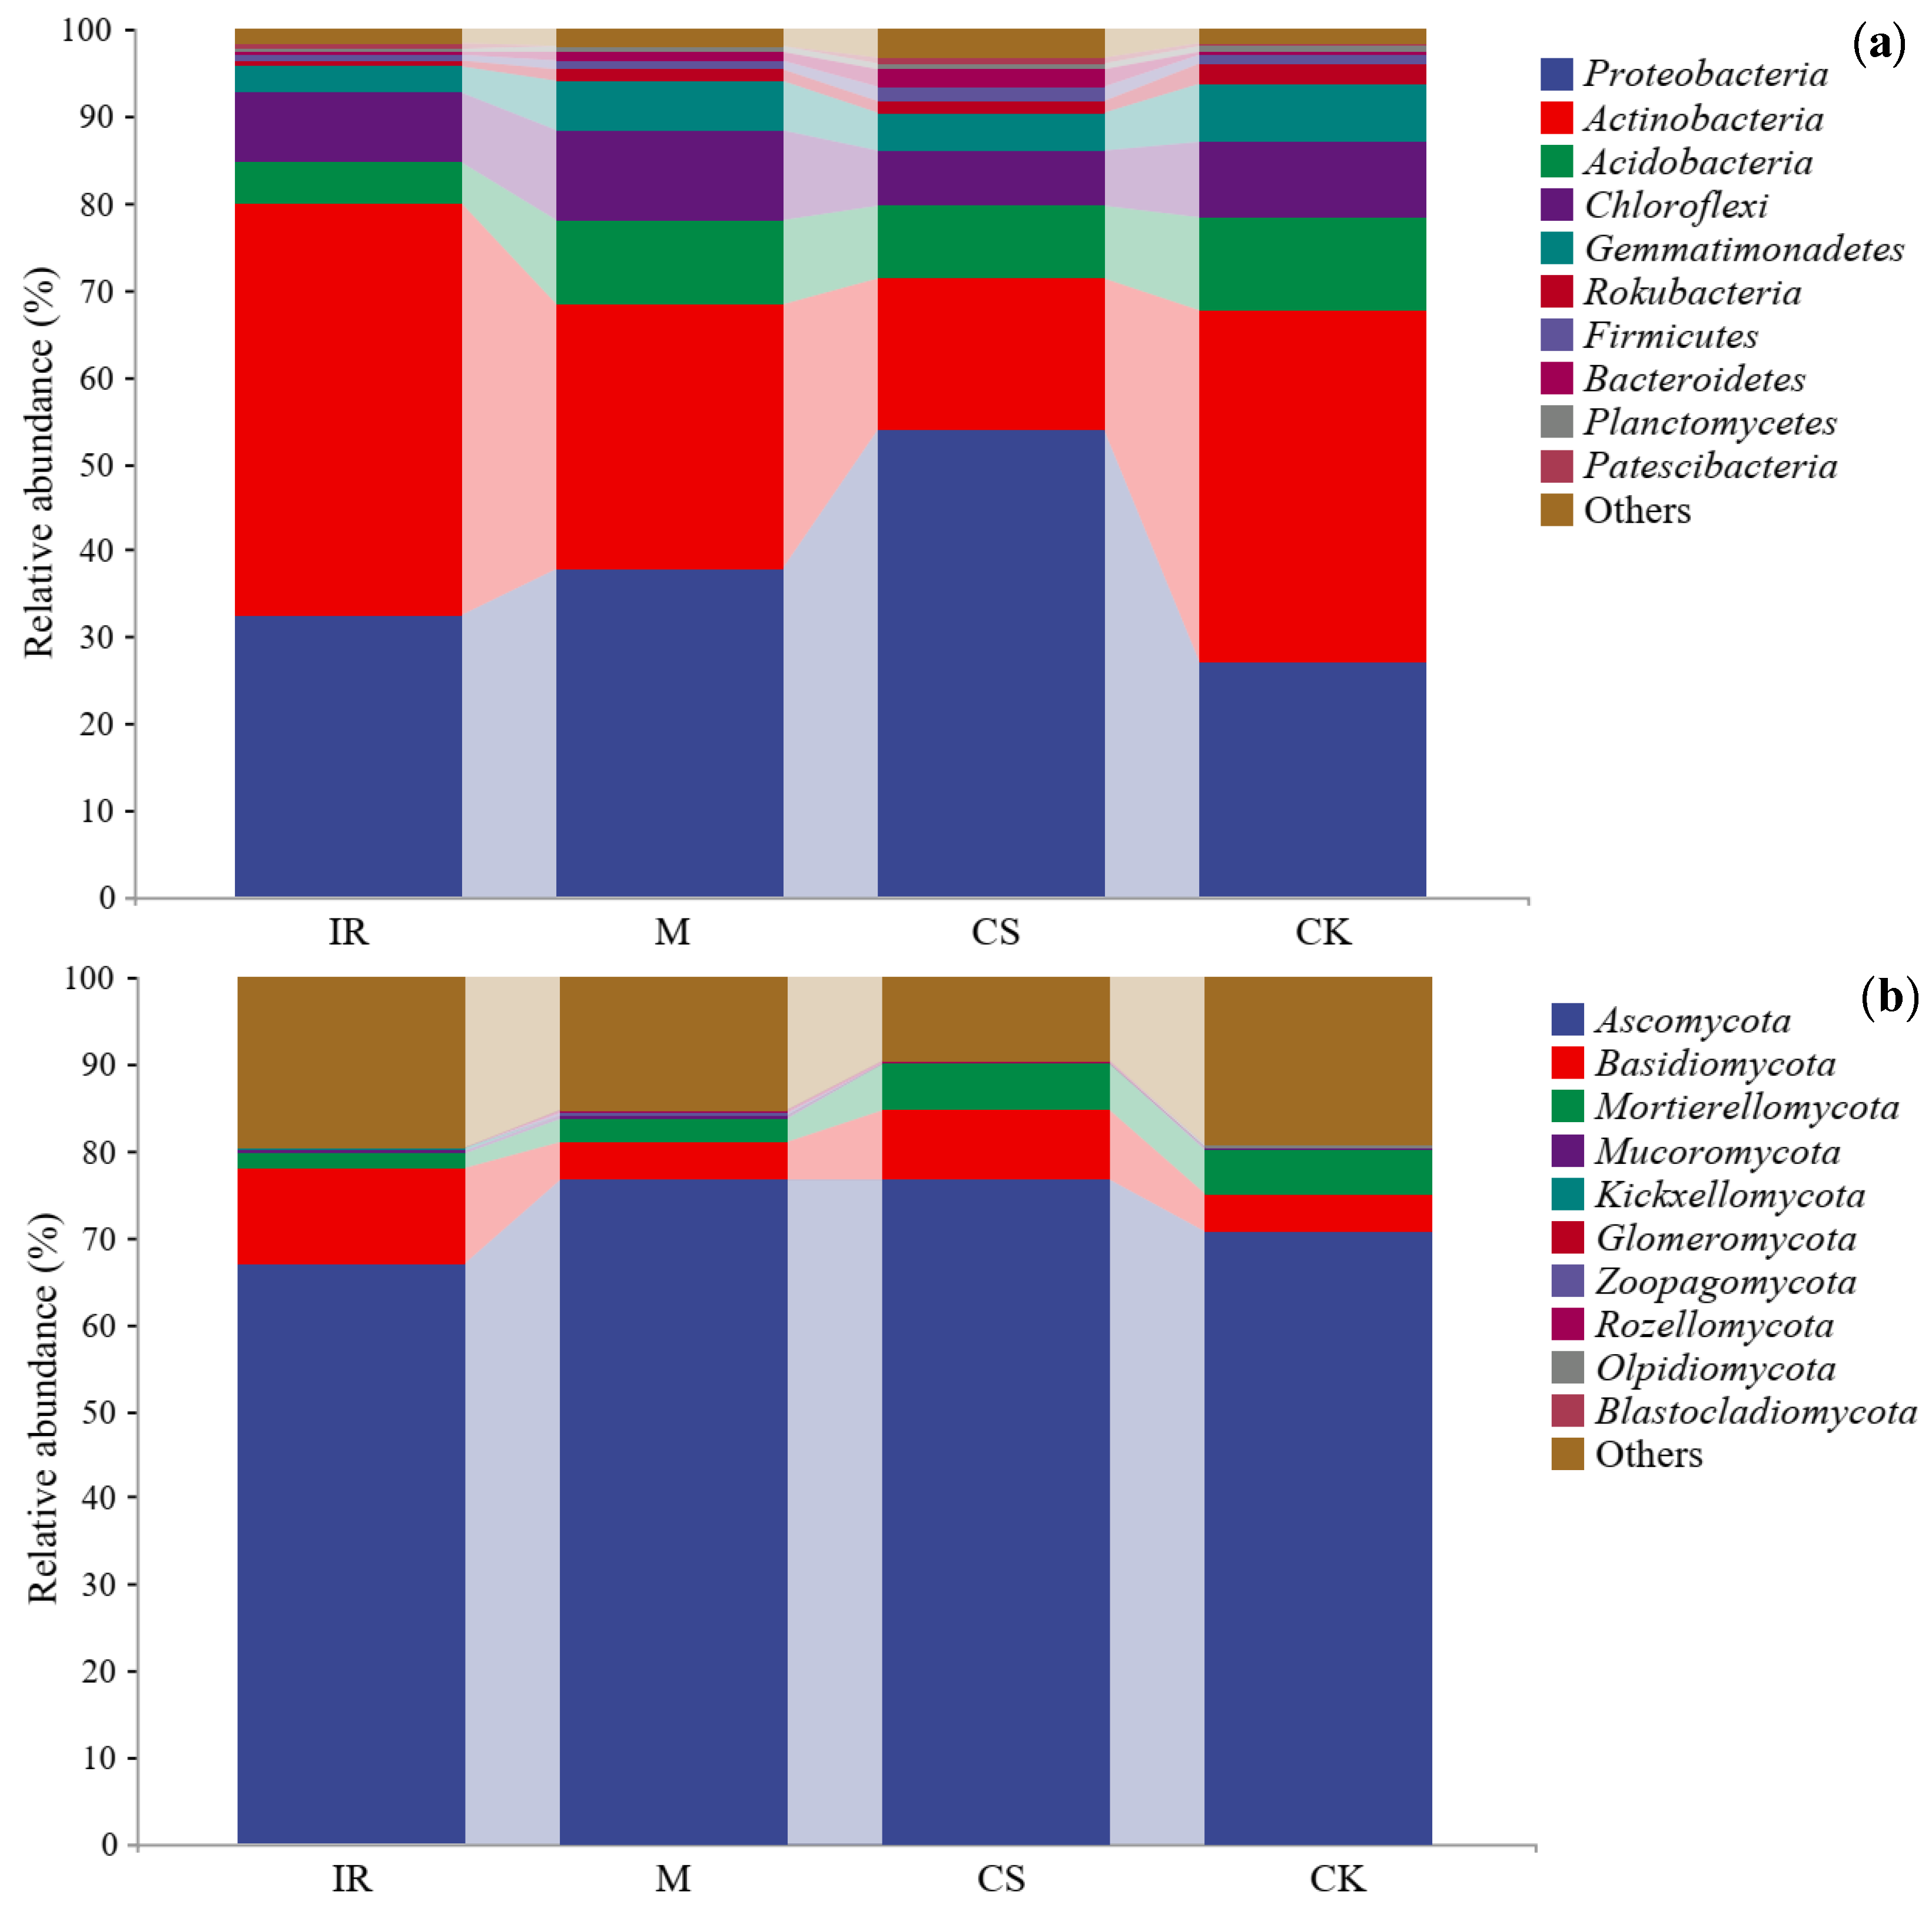
3.2. Characterization of the Soil Bacterial and Fungal Communities in Different Sample Plots

In total, 1,619,263 sequences were obtained from the bacterial 16S sequencing of the V3-V4 region in these soil samples, with 1,405,764 sequences ranging from 263–402 bp in length remaining following denoising. At a sequence similarity level of 100%, 6918, 9734, 8554, and 10,382 ASVs were, respectively, detected in the IR, M, CS, and CK soil samples. In total, 568 ASVs were shared across all four sample types, and the rank-ordering for the numbers of unique bacterial ASVs in these samples was as follows: CK > CS > M > IR (Figure 2a). The sequencing of the fungal ITS V1 hypervariable region in these samples yielded 1,025,579 sequences of which 879,133 from 114–403 bp in length were retained for analysis. In total, 1030, 1577, 838, and 1572 fungal ASVs were detected in the IR, M, CS, and CK soil samples, respectively, and the rank-ordering for the numbers of unique fungal ASVs in these samples was as follows: M > CK > IR > CS (Figure 2b).
Significantly lower levels of bacterial richness (Chao1 and Observed species) were evident in IR soil samples relative to CK samples (p < 0.05), although no differences were observed in M or CS soil samples (p > 0.05). Similarly, IR sample bacterial diversity (Shannon) was reduced relative to CK samples (p < 0.05) (Figure 3a). No differences in soil fungal diversity or richness were observed in any samples relative to CK samples (p > 0.05). Viticulture was associated with reductions in soil fungal richness in all soil samples other than M samples relative to CK samples (Figure 3b). These findings suggest that while winegrape planting significantly impacted soil bacterial community structures, it largely failed to impact soil fungal communities in a similar manner.
The bacteria detected in these soil samples were attributed to 332 phyla, 957 classes, 1945 orders, 2830 families, and 4265 genera. At the phylum level, Proteobacteria exhibited the highest levels of relative abundance (23.15–78.71%) followed by Actinobacteria (5.08–55.88%) and Acidobacteria (3.12–11.48%). Other phyla exhibiting relative abundance levels >1% included Chloroflexi (2.99–12.70%) and Gemmatimonadetes (2.05–7.36%). Higher levels of relative Proteobacteria abundance were observed in vineyard soil samples relative to CK samples, although such relative abundance declined as the number of planting years rose (Figure 4a). The fungi detected in 12 soil samples were attributed to 89 phyla, 225 classes, 465 orders, 766 families, and 1266 genera. Dominant phyla in these soil plots included Ascomycota (60.96–91.77%), Basidiomycota (1.03–26.07%), and Mortierellomycota (0.46–10.28%). There were no significant differences in the relative abundance of dominant fungal phyla among analyzed sample plots (p > 0.05), although a downward trend in relative Ascomycota abundance was evident as the number of planting years rose (Figure 4b).

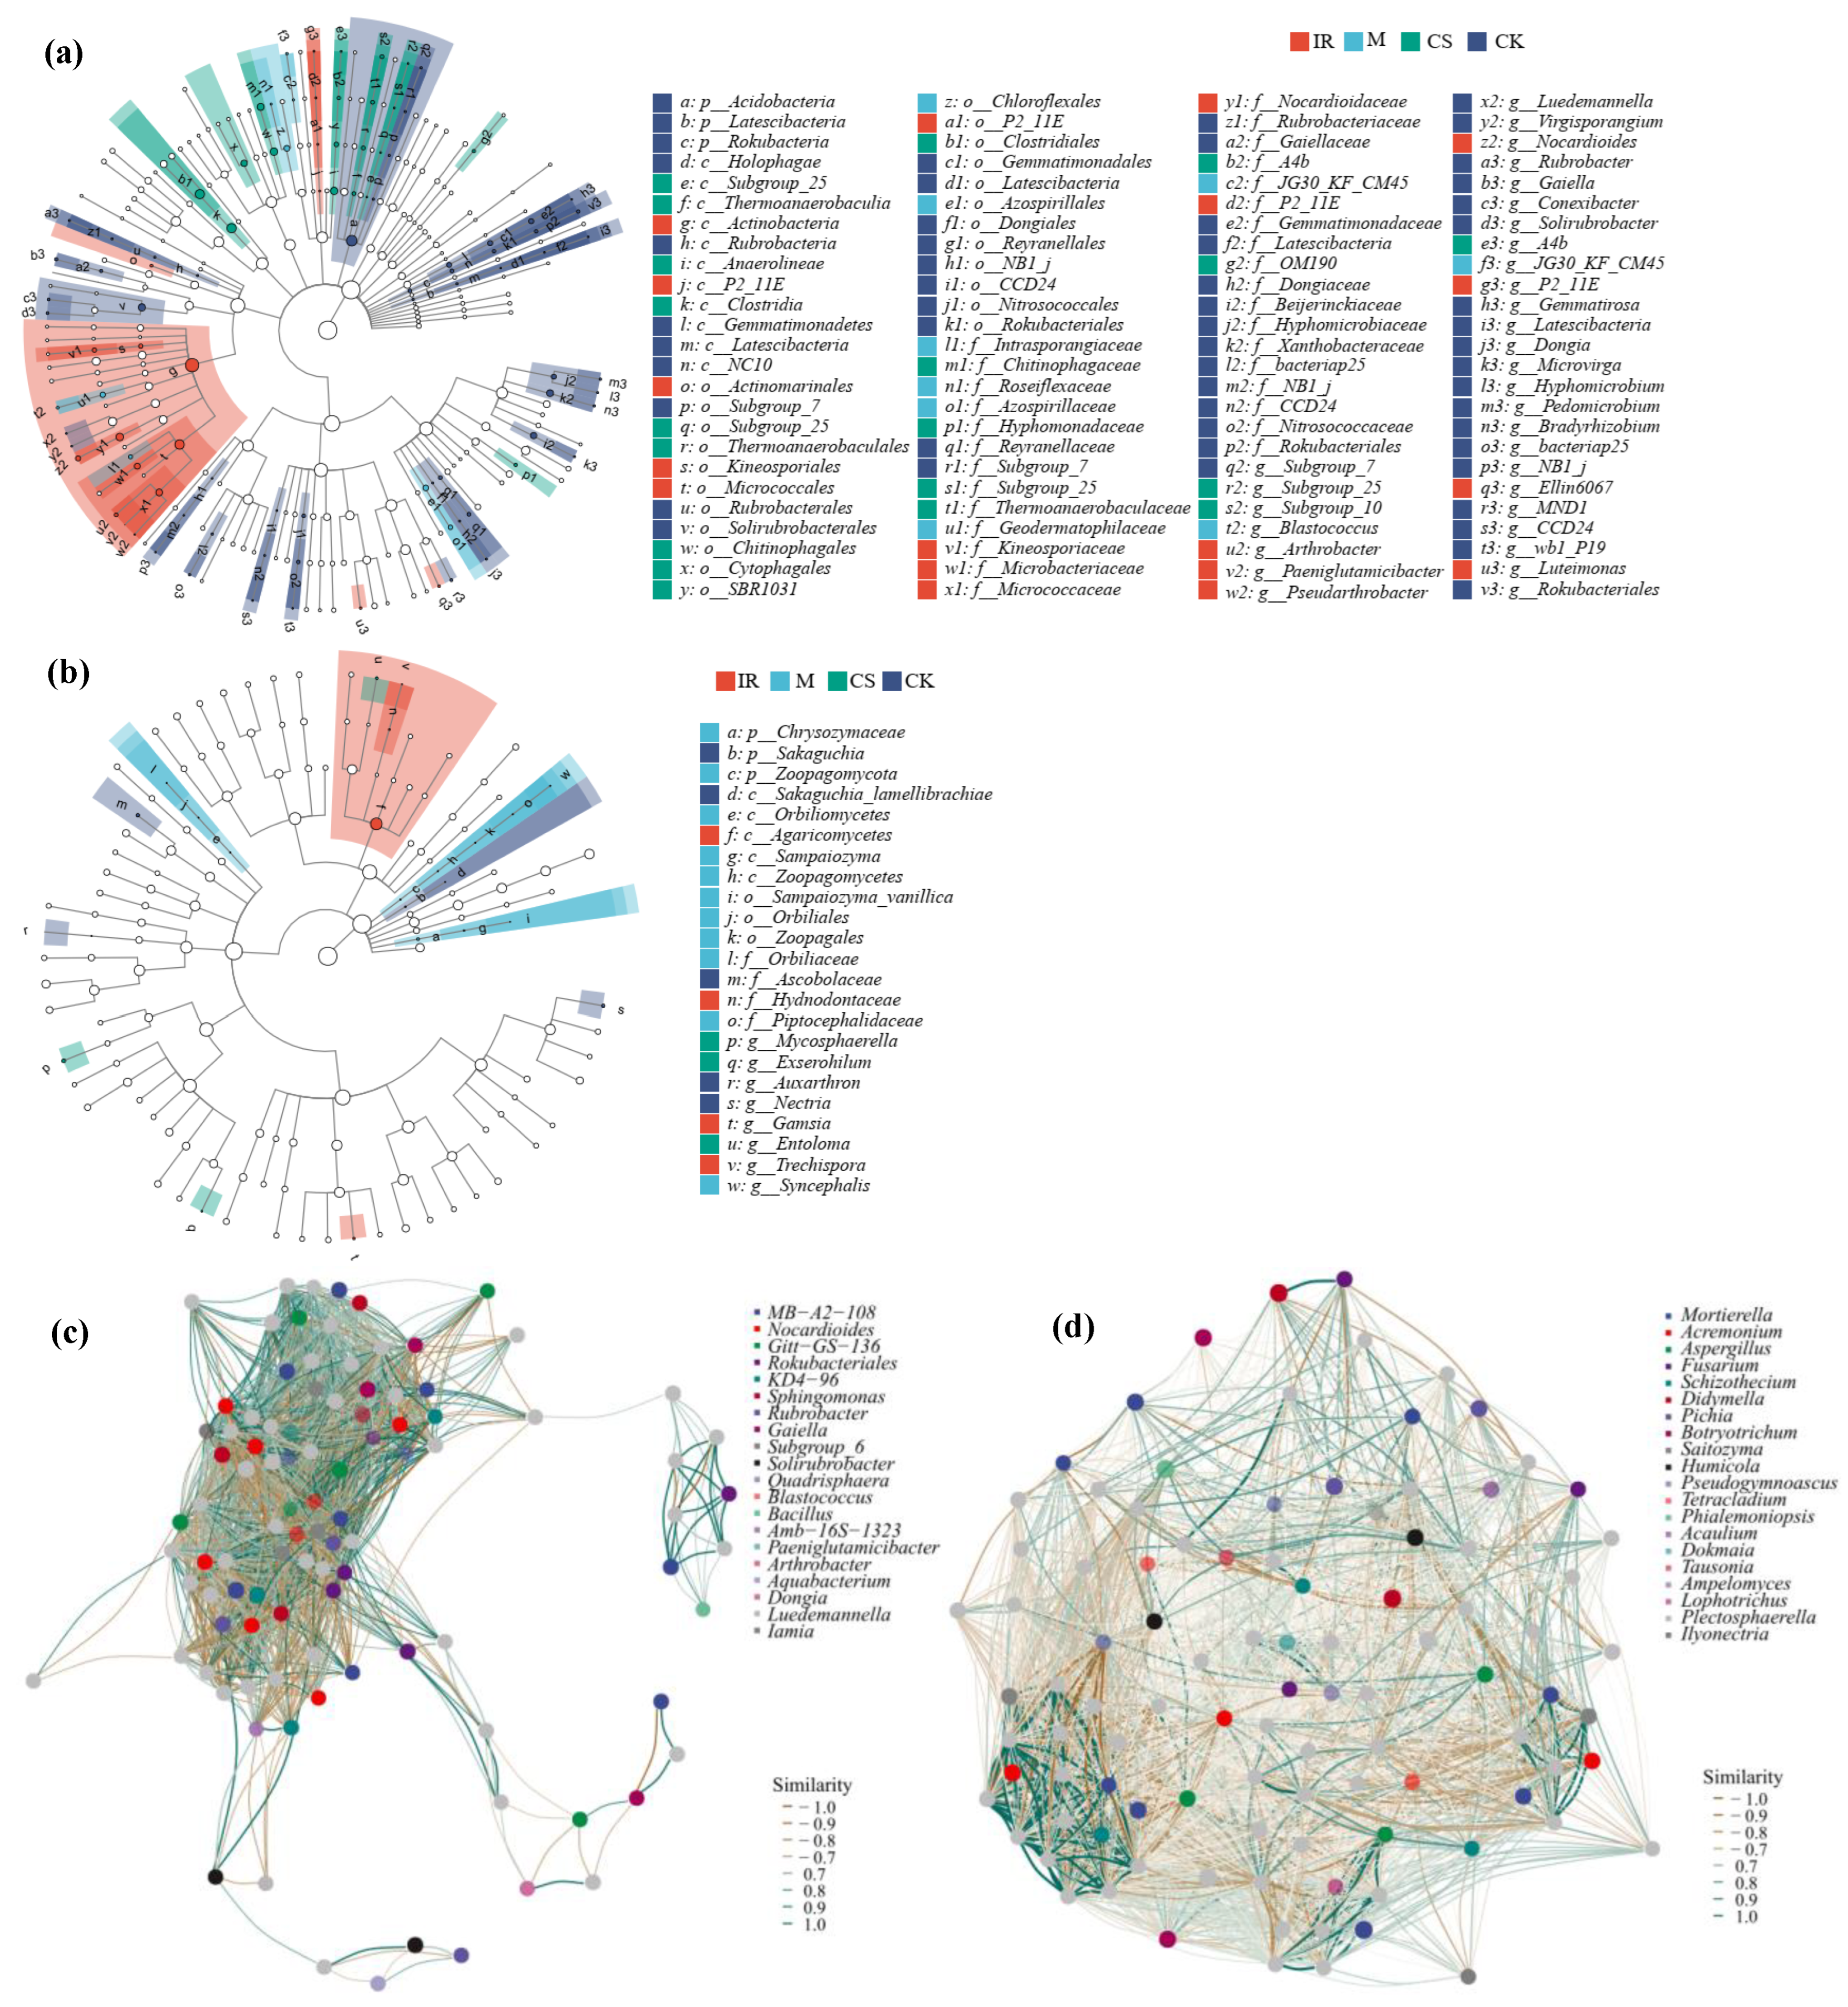
3.3. Differences in Soil Bacterial and Fungal Community Structures in Different Sample Plots

Differences in soil bacterial and fungal community structure were measured using the PCoA and Hierarchical clustering analysis (Figure S1 and Figure 5). In a PCoA analysis of soil bacterial communities, vineyard soil samples were effectively separated from CK samples along principal component 1 (Figure 5a). Similarly, in a PCoA analysis of soil fungal communities, vineyard soil samples were separated from CK samples along principal component 2 (Figure 5b). The first two principal components in these analyses accounted for 55.10% and 47.90% of the total variation in bacterial and fungal communities, respectively. Hierarchical clustering heat maps revealed that there were significant differences in bacterial community structure, as assessed based on the 20 most abundant bacterial genera, among these different sample plots. Specifically, vineyard soil samples and CK samples were separated into two distinct clusters, suggesting that the bacterial community structure in these different vineyard soil samples was largely consistent. Relative Gaiella, Solirubrobacter, 67–14, and Rubrobacter richness in CK samples was higher, while it was lower in vineyard soil samples (Figure 5c). No differences in soil fungal communities were observed when comparing vineyard and CK soil samples (Figure 5d).
LEfSe analyses revealed significant class-level differences among sample plots for classes including Acidobacteria, Latescibacteria, and Rokubacteria (Figure 6a), with corresponding differences at other taxonomic levels also being represented. At the class level, fungi that differed significantly among these groups included Chrysozymaceae, Sakaguchia, and Zoopagomycota (Figure 6b). A correlation threshold of 0.6 was used for the screening of bacteria in different groups, with a correlation network containing 100 nodes ultimately being established to assess the relationships among the 100 most abundant bacteria at the genus level (Figure 6c). The screening threshold used for fungi was 0.305, and a similar correlation network was established for the 100 most abundant fungi at the genus level (Figure 6d).

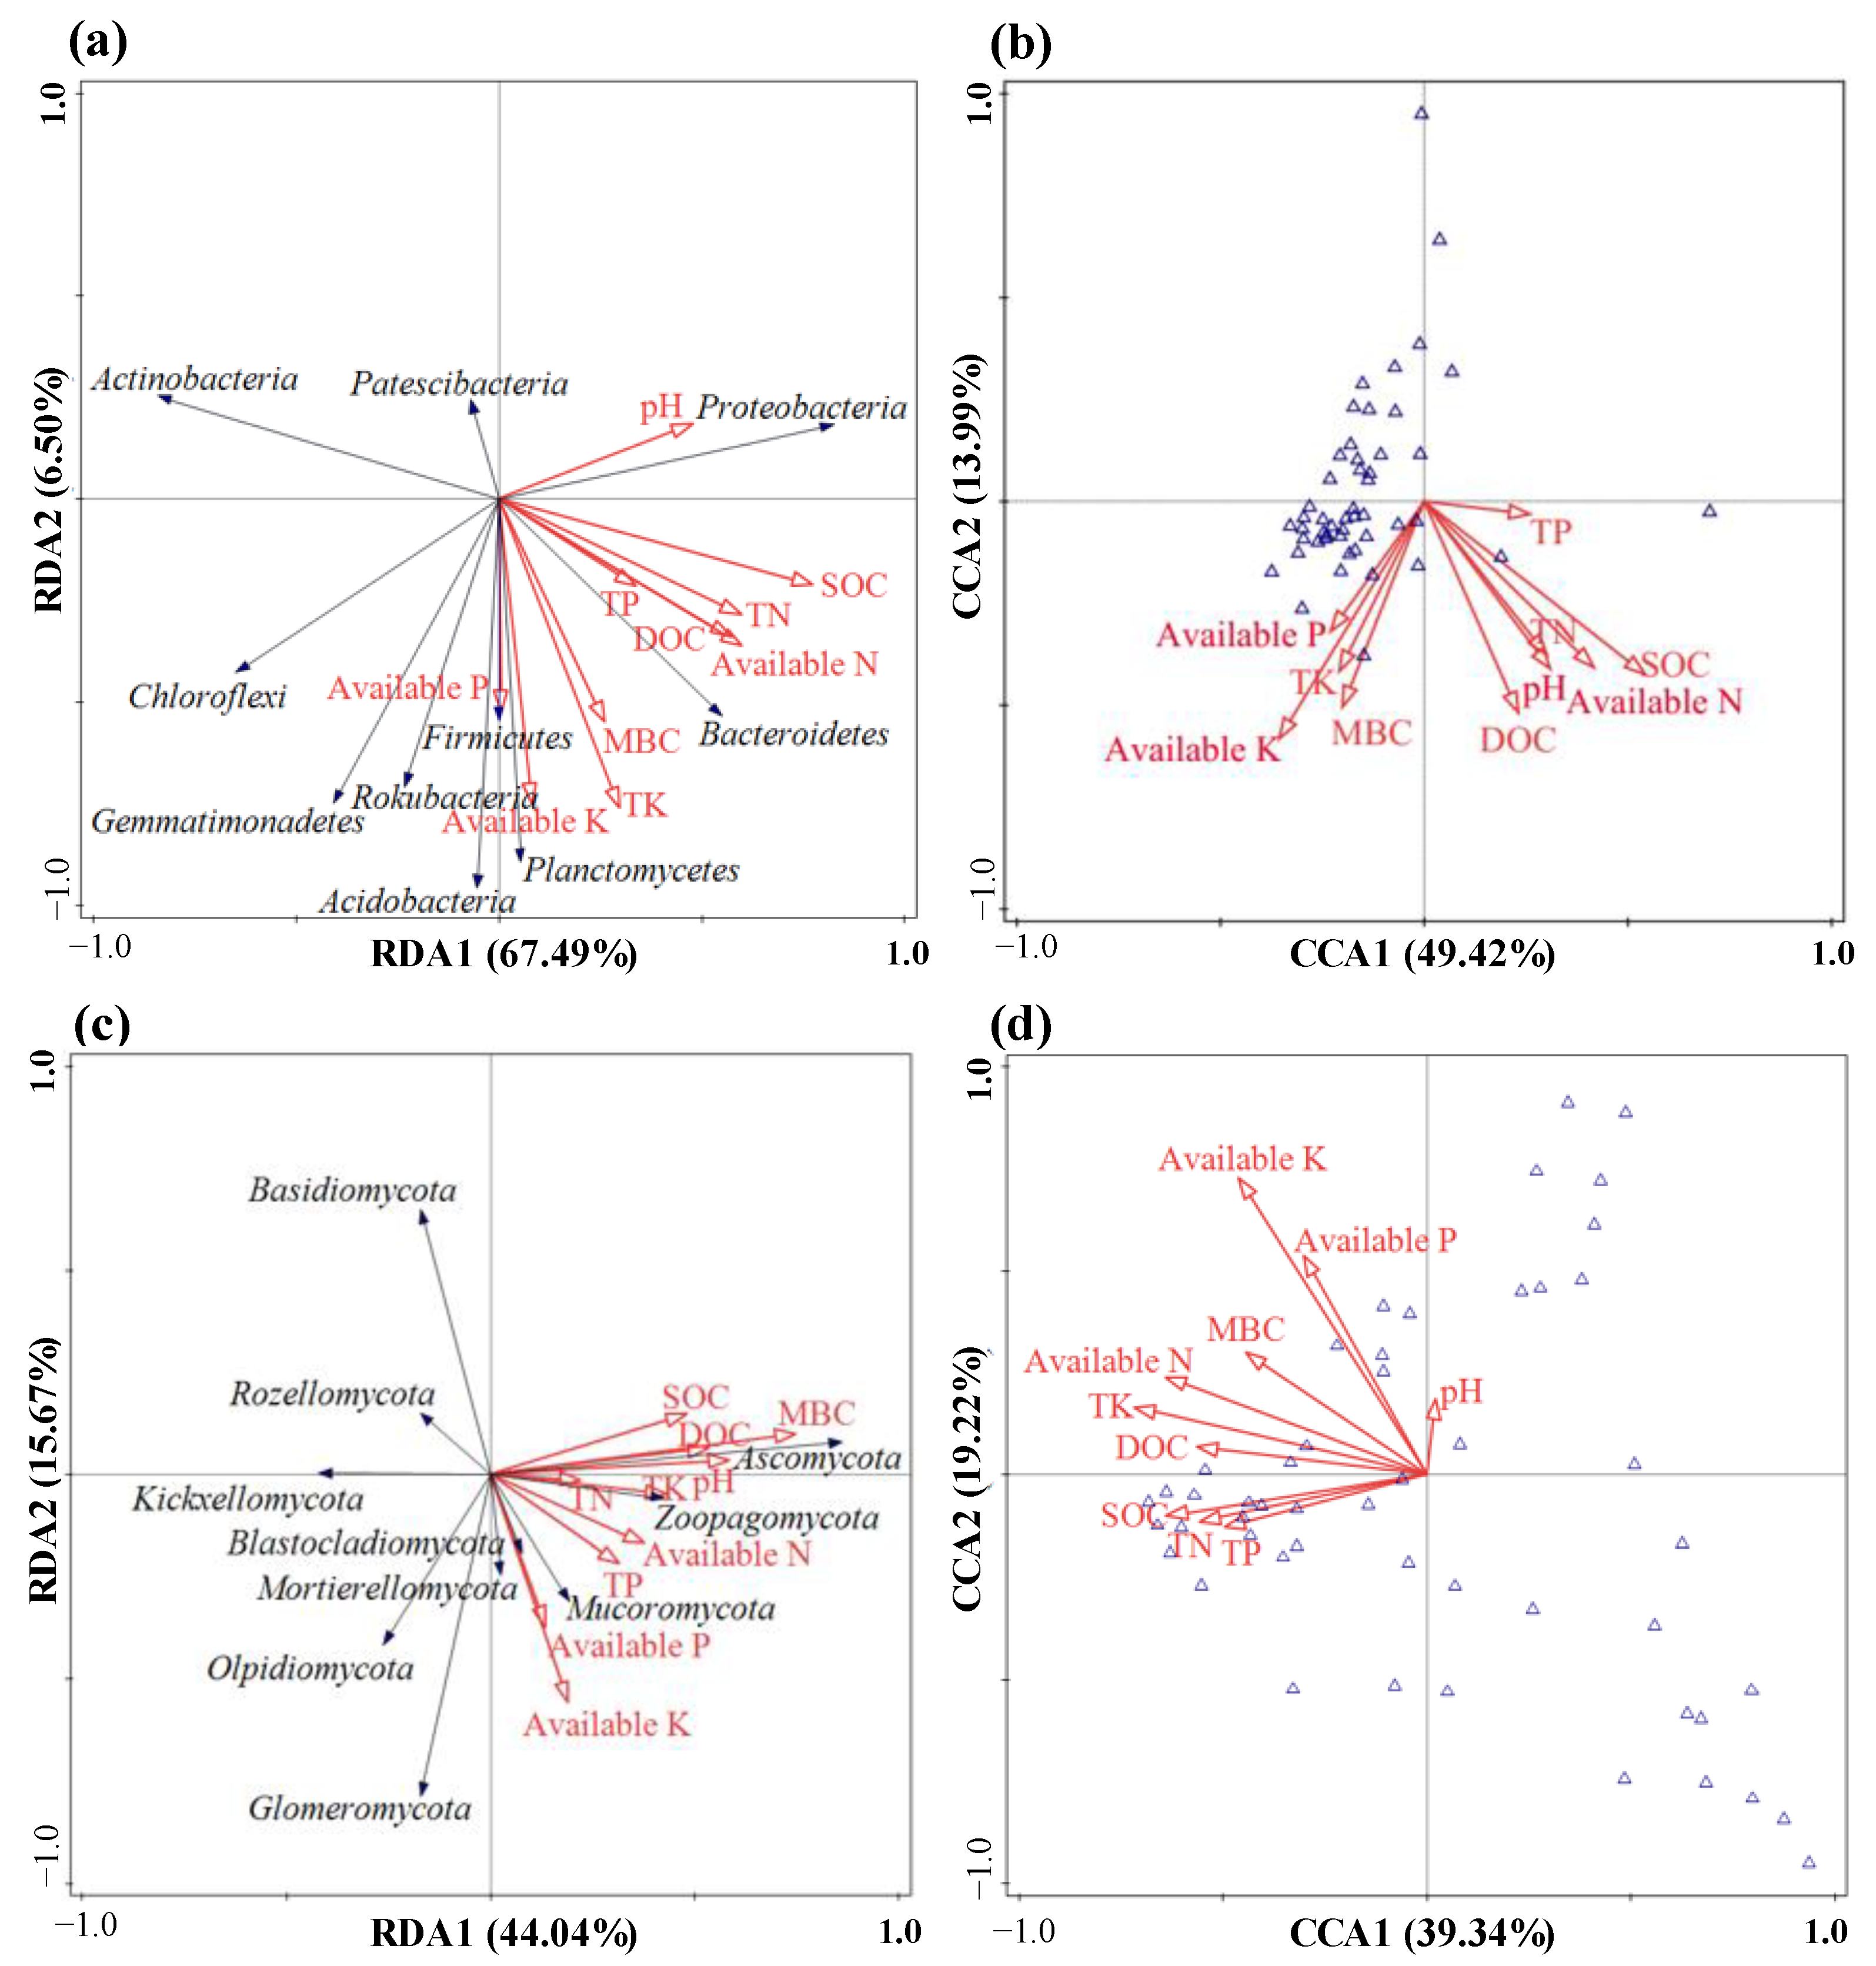
3.4. Soil Microbial Community Responses to Soil Properties and Enzyme Activity Levels

Next, an RDA approach was employed to assess the effects of soil properties on the most abundant soil fungal and bacterial community members (Figure 7). The 10 analyzed soil physicochemical variables accounted for 73.99% of the phylum-level variance in bacterial communities, with SOC and available nitrogen being significantly correlated with the first axis, whereas total potassium and available potassium were significantly correlated with the second axis. In total, SOC accounted for 40.90% of the total variance in these soil bacterial communities (p = 0.02) (Figure 7a). At the genus level, the cumulative contribution rates of the first and second constraint axes (CCA1 and CCA2) were 49.42% and 13.99%, respectively. In addition, MBC accounted for 24.30% of the overall variance in the composition of these soil bacterial communities (p = 0.028) (Figure 7b). These data thus indicated that SOC and MBC were the primary drivers of variance in bacterial community composition in this study. At the phylum level, the 10 analyzed soil physicochemical parameters accounted for 59.71% of the overall variance in the composition of soil fungal communities. MBC and pH were strongly correlated with the first axis, while available potassium was correlated with the second axis. Overall, MBC accounted for 24.80% of the variance in soil fungal communities (p = 0.034) (Figure 7c). MBC additionally explained 18.50% of the genus-level variance in fungal community composition (p = 0.012), followed by available potassium (17.60%, p = 0.038) (Figure 7d). RDA and CCA analyses thus indicated that MBC is a major driver of fungal variance in the analyzed soil samples.
A significant negative correlation was observed between soil bulk density and bacterial richness (Chao 1) (r = −0.71, p < 0.05), whereas it was positively correlated with bacterial richness (Observed species) and diversity (Shannon). Alkaline phosphatase activity was significantly negatively correlated with the Chao 1 (r = −0.61, p < 0.05) and Observed species (r = −0.59, p < 0.05) indices (Table 3). Several analyzed soil properties were significantly correlated with the four most abundant bacterial and fungal phyla (Table 4). For example, Proteobacteria abundance was significantly positively correlated with both SOC (r = 0.60, p < 0.05) and alkaline phosphatase activity (r = 0.70, p < 0.05), while Actinobacteria abundance was negatively correlated with total nitrogen (r = −0.58, p < 0.05) and available nitrogen (r = −0.60, p < 0.05). A negative correlation was also evident between Actinobacteria and both SOC (r = −0.71, p < 0.05) and alkaline phosphatase (r = −0.75, p < 0.05), whereas Acidobacteria were positively correlated with soil bulk density, total potassium, and available phosphorus, and urease activity was positively correlated with Ascomycota.

4. Discussion

4.1. Soil Properties and Enzyme Activity Levels

The present results revealed that viticulture contributed to significant improvements in the physicochemical properties and enzyme activity levels in analyzed vineyard soil samples relative to control desertified soil, with concomitant changes in the composition of soil microbial communities, thus supporting our first hypothesis. Significant increases in SOC, total nitrogen, total potassium, and total phosphorus were detected in soil from vineyards in this study relative to CK soil, although soil nutrition declined as the duration of winegrape cultivation increased (Table 1), in line with prior reported data [29]. Viticulture tends to promote soil organic matter accumulation as a consequence of the input of litter including grapevine residues, leaves, and canes, thereby increasing overall soil organic matter and nutrient availability. SOC levels in these vineyards also rose significantly in response to organic fertilizer application from 1.83 g/kg in CK samples to 3.86 g/kg, 3.20 g/kg, and 2.29 g/kg in the CS, M, and IR samples, respectively. Rhizosphere pH values rose in these vineyard soil samples (Table 1), in contrast to prior results [30,48]. This may be a consequence of differences in study site selection, as the alkalinity of the soil in the Hongsibu District of Ningxia was higher than that in previous studies. Higher levels of total nitrogen, phosphorus, and potassium were evident when the duration of winegrape cultivation was shorter (5 years). Over time, however, soil nutrition tended to decrease, likely as a consequence of continuous tillage, which can lower soil quality irrespective of the cropping system [29,49]. Soil bulk density declined following winegrape planting, likely due to the tillage-mediated loosening of the soil. However, levels of available nutrients in the soil declined with winegrape planting, with these effects being most pronounced for available potassium, as the grapevine-mediated uptake of soil nitrogen and phosphorus growth and development. The soil nutrition in this study was generally lower than in other areas [50], consistent with the suitability of winegrapes to cultivation in settings with poorer ecological conditions.
Here, higher levels of soil enzyme activity were observed at the start of winegrape planting for most analyzed enzymes, although these activity levels did not invariably continue to rise as the number of years of continuous winegrape cultivation rose (Table 2). The levels of soil urease, alkaline phosphatase and sucrase activity detected a decreasing trend, especially in the 11-year IR soil samples. This may be attributable to the deterioration of root-zone soil microenvironment as a consequence of prolonged crop monoculture [51]. The measured changes in soil enzyme activity including urease, alkaline phosphatase and sucrase activity in this study are consistent with shifts in soil quality over time, in line with prior reports [29]. These soil enzyme activity levels are also consistent with changes in SOC, with rising SOC providing a range of carbon and nitrogen substrates for these enzymes [52]. These soil enzyme activity levels were also correlated with soil microbial community characteristics, particularly with respect to alkaline phosphatase activity. Soil exhibiting higher sucrase activity levels is generally more fertile and contains higher levels of organic matter, whereas urease activity can serve as an indicator of soil nitrogen content, and alkaline phosphatase activity is reflective of soil fertility and maturation, which supports the correlation between soil enzyme activity and physicochemical properties in this study (Table S1). Compared with previous studies [34], we further studied the activity of seven soil enzymes. In addition to soil urease, alkaline phosphatase, and sucrase activities, amylase activities also had similar changes. However, ligninase, cellulase, and β-glucosidase remained stable with the extension of winegrape planting time. This may be due to the more stable lignin and cellulose derived from litter of canes and leaves in vineyards, which were not easily decomposed, resulting in the stability of soil ligninase, cellulase and β-glucosidase.

4.2. Soil Bacteria

Soil bacterial richness and diversity tended to decrease, as the number of winegrape planting years increased in this study rose (Figure 2 and Figure 3), consistent with our second hypothesis. Many variables can impact these soil microbial communities, including the crop species, soil type, and fertilization or irrigation practices [53,54]. Consistent with previous studies [55,56,57], the most abundant bacterial phyla in this study included Proteobacteria, Actinobacteria, and Acidobacteria, which tend to be dominant across a range of agricultural systems. However, after winegrape cultivation for 11 years, the microbial community in analyzed soil samples had shifted from being dominated by Proteobacteria to Actinobacteria, suggesting that soil nutrient status was stable or tended to decrease. These shifts are consistent with data presented previously [58], that analyzed shifts in microbial communities and concomitant reductions in SOC and total nitrogen after 35 years of vegetation restoration. The structure of the analyzed soil bacterial communities in this study also differed significantly between the vineyard and CK samples (Figure 5). While the CS and M soil bacterial communities were similar, they differed significantly from those in IR soil samples. This may be a consequence of the fact that IR is a white variety of winegrape, whereas CS and M are red winegrapes. Red and white vineyards exhibit significant differences in root exudates and litter properties, potentially contributing to significant differences in root-zone bacterial community structure.
The physicochemical properties of soil can strongly influence the structure and succession of microbial communities present therein [59,60]. SOC, pH, and nutrient levels are all key determinants of bacterial community composition and diversity [61]. Here, an RDA approach ultimately revealed that SOC and MBC are major drivers of variance in soil bacterial communities (Figure 7). Higher levels of SOC in vineyard soil may thus be a primary factor associated with increases in bacterial diversity in these agricultural soils, given that SOC is essential for the growth and persistence of almost all known terrestrial microbial communities [62,63]. In correlation analyses, SOC was also positively correlated with the relative abundance of both Proteobacteria and Actinobacteria (Table 4). These results thus support the ability of SOC to drive soil bacterial community composition in semi-arid agricultural environments [57]. While soil pH has also been reported to shape the richness and diversity of bacterial communities [64,65], no relationship between soil pH and bacterial diversity indices was detected in the present study, suggesting that other physicochemical factors played a more dominant role in shaping the structure of these soil bacterial communities.

4.3. Soil Fungi

Viticulture and planting years had no significant impact on the richness or diversity of soil fungal communities in this study. This may be attributable to the fact that these communities tend to be robust and capable of tolerating a wide range of conditions [66]. Vegetation also tends to more significantly impact the make-up of soil bacterial communities relative to fungal communities [58]. Ascomycota and Basidiomycota were the fungal phyla exhibiting the first and second highest relative abundance in this study, respectively, in line with prior reports [67,68,69]. Ascomycota species are capable of breaking down lignin, cellulose, and other complex macromolecules such that they are important mediators of carbon cycling [70,71,72]. However, Ascomycota abundance declined with increasing grapevine age (Figure 4). Glomus species diversity levels in red grape vineyards were higher than in CK soil samples in large part owing to the higher levels of CS vine biomass [40], providing higher levels of carbon and lipids for these fungi. Glomeromycetes are arbuscular mycorrhizal fungi capable of forming symbiotic relationships with host plants, thereby expanding the area and efficiency of plant soil mineral nutrient uptake [73]. Significant differences in soil bacterial and fungal communities were observed when comparing the IR vineyard to the included red grape vineyards (Figure 5), suggesting that winegrape cultivar type may contribute to the observed differences in microbial community composition under long-term (11-year) cultivation conditions. This report also identified differences in fungal community composition at the phylum and genus levels in different sample groups (Figure 6), offering an opportunity to analyze microbial biomarkers associated with different culture conditions. The observed correlations among microorganisms detected herein may be associated with soil properties, given that the abiotic factors and vineyard irrigation conditions were consistent across study sites. High levels of organic fertilizer application were reportedly associated with reductions in the numbers of gene-level microbial network links in 16S rRNA analyses, and in the maize rhizosphere the primary drivers of soil bacterial and fungal community structure were organic matter and available phosphorus [74], in line with the present results.
Here, MBC was found to drive variations in soil fungi (Figure 7). This may be attributable to the fact that both bacteria and fungi in the soil utilize organic carbon, but fungi generate larger quantities of biomass carbon and are dominant in ecosystems exhibiting higher proportions of organic carbon [75,76]. In some reports, the composition of soil fungal communities was found to be significantly correlated with total nitrogen and nitrate nitrogen levels [77], in line with the present results. The biochemical metabolism and physiological activity of fungi also exhibit higher levels of dependence on nitrogen and carbon availability relative to archaea and bacteria [78]. Thus, soil nitrogen levels and MBC are vital to the establishment of both fungal and bacterial communities in the soil. Winegrape planting thus induces changes in the physicochemical properties of soil, in turn altering the structures of the fungal and bacteria communities therein. We have previously studied changes in soil physicochemical property and microbial communities in vineyards [34]. However, this study further investigated variations in soil enzyme activity and carbon fractions, as well as changes in soil quality including soil properties and microbial community structure, with the increase of winegrape planting years. As downward trends were evident in the time series samples included in this study with respect to changes in the physicochemical indices and soil bacteria at different study sites, future research should explore the impact of winegrape planting age on soil quality over extended time periods from 20–50 years, in an effort to better guide soil management practices so as to mitigate any harmful viticultural impacts on sustainable soil function.

5. Conclusions

In summary, the present results demonstrate that viticulture can significantly alter soil properties, soil enzyme activity levels, and the structure of soil microbial communities. Winegrape planting was associated with decreases in most analyzed soil nutrients and with reductions in the diversity and richness of soil bacterial communities as the number of planting years increased, whereas the composition of soil fungal communities remained stable. In these semi-arid study regions, winegrape cultivation was found to facilitate SOC accumulation and to promote shifts in the structure of soil bacterial communities, with these latter shifts being primarily driven by SOC and MBC. However, these positive effects were largely lost with time over the course of prolonged winegrape cultivation, particularly for the Italian Riesling vineyards included in this study, which had been subject to winegrape monoculture for the longest period of time. As such, the application of non-tillage, fallow, and growing grass between vine-rows may represent an advantageous viticultural practice, with the potential to better maintain or enhance long-term soil quality.

Supplementary Materials

The following supporting information can be downloaded at: https://www.mdpi.com/article/10.3390/horticulturae8121097/s1, Table S1: Pearson correlation analyses of the relationships between soil physicochemical properties and enzyme activities. Figure S1: Hierarchical clustering analysis of soil bacterial and fungal communities associated with different sample plots. (a) Soil bacteria; (b) soil fungi. The left panel was a hierarchical clustering tree diagram, in which samples were clustered by their similarity. The shorter the branch length between samples, the more similar they were. The panel on the right was a stacked bar graph of the top 10 microorganisms by abundance at the genus level.

Author Contributions

All authors contributed significantly to this manuscript. Conceptualization, T.X.; methodology, T.X. and L.Z.; software, T.X. and L.Z.; validation, G.X., T.X. and L.Z.; investigation, F.Y. and Y.L.; data curation, R.L.; writing—original draft preparation, T.X. and L.Z.; writing—review and editing, T.X. and L.Z.; visualization, F.Y.; supervision, G.X.; project administration, T.X. and G.X.; funding acquisition, T.X. and G.X. All authors have read and agreed to the published version of the manuscript.

Funding

This work was supported by the Key R & D projects in Ningxia (talent introduction special) funded project (2020BEB04017), and the Ningxia University Scientific Research Launch Fund (construction of high-level teachers).

Institutional Review Board Statement

Not applicable.

Informed Consent Statement

Not applicable.

Data Availability Statement

Not applicable.

Acknowledgments

We thank Cai Li (Huida Chateau) and Jianhua Liu (Hongsibu District Agriculture and Rural Affairs Bureau of Wuzhong Municipality) for suggestions and useful help in the winegrapes industry investigation. We are also grateful to the staff of Ningxia Red Carrin Winery for their help with soil collection. We would like to thank all the reviewers who participated in the review.

Conflicts of Interest

The authors declare no conflict of interest.

References

  1. Zhang, L.; Wang, Z.; Xue, T.; Gao, F.; Wei, R.; Wang, Y.; Han, X.; Li, H.; Wang, H. Combating desertification through the wine industry in Hongsibu, Ningxia. Sustainability 2021, 13, 5654. [Google Scholar] [CrossRef]
  2. Yang, B.; Yao, H.; Zhang, J.; Li, Y.; Ju, Y.; Zhao, X.; Sun, X.; Fang, Y. Effect of regulated deficit irrigation on the content of soluble sugars, organic acids and endogenous hormones in Cabernet Sauvignon in the Ningxia region of China. Food Chem. 2020, 312, 126020. [Google Scholar] [CrossRef]
  3. Sun, Y.; Liu, Q.; Xi, B.; Dai, H. Study on the regulation of anthocyanin biosynthesis by exogenous abscisic acid in grapevine. Sci Hortic. 2019, 250, 294–301. [Google Scholar] [CrossRef]
  4. Li, L.; Sun, B. Grape and wine polymeric polyphenols: Their importance in enology. Crit. Rev. Food Sci. 2019, 59, 563–579. [Google Scholar] [CrossRef] [PubMed]
  5. Marsal, J.; Mata, M.; Del Campo, J.; Arbones, A.; Vallverdu, X.; Girona, J.; Olivo, N. Evaluation of partial root-zone drying for potential field use as a deficit irrigation technique in commercial vineyards according to two different pipeline layouts. Irrigation Sci. 2008, 26, 347–356. [Google Scholar] [CrossRef]
  6. Zhang, Q.; Wang, S.; Li, L.; Inoue, M.; Xiang, J.; Qiu, G.; Jin, W. Effects of mulching and sub-surface irrigation on vine growth, berry sugar content and water use of grapevines. Agric. Water Manag. 2014, 143, 1–8. [Google Scholar] [CrossRef]
  7. Jaksic, S.; Ninkov, J.; Milic, S.; Vasin, J.; Banjac, D.; Jaksic, D.; Zivanov, M. The state of soil organic carbon in vineyards as affected by soil types and fertilization strategies (Tri Morave Region, Serbia). Agronomy 2021, 11, 9. [Google Scholar] [CrossRef]
  8. Rusch, A.; Delbac, L.; Thiery, D. Grape moth density in Bordeaux vineyards depends on local habitat management despite effects of landscape heterogeneity on their biological control. J. Appl. Ecol. 2017, 54, 1794–1803. [Google Scholar] [CrossRef] [Green Version]
  9. Gougeon, L.; Da Costa, G.; Le Mao, I.; Ma, W.; Teissedre, P.; Guyon, F.; Richard, T. Wine analysis and authenticity using H-1-NMR metabolomics data: Application to Chinese wines. Food Anal. Methods 2018, 11, 3425–3434. [Google Scholar] [CrossRef]
  10. Parga-Dans, E.; Alonso Gonzalez, P.; Otero-Enriquez, R. The role of expert judgments in wine quality assessment: The mismatch between chemical, sensorial and extrinsic cues. Brit. Food J. 2022, 124, 4286–4303. [Google Scholar] [CrossRef]
  11. Wang, X.; Xie, X.; Chen, N.; Wang, H.; Li, H. Study on current status and climatic characteristics of wine regions in China. Vitis 2018, 57, 9–16. [Google Scholar]
  12. Oliver, D.P.; Bramley, R.G.V.; Riches, D.; Porter, I.; Edwards, J. Review: Soil physical and chemical properties as indicators of soil quality in Australian viticulture. Aust. J. Grape Wine Res. 2013, 19, 129–139. [Google Scholar] [CrossRef]
  13. Mouazen, A.M.; Steffens, M.; Borisover, M. Reflectance and fluorescence spectroscopy in soil science-Current and future research and developments. Soil Till. Res. 2016, 155, 448–449. [Google Scholar] [CrossRef]
  14. Bunemann, E.K.; Bongiorno, G.; Bai, Z.; Creamer, R.E.; De Deyn, G.; de Goede, R.; Fleskens, L.; Geissen, V.; Kuyper, T.W.; Mader, P.; et al. Soil quality—A critical review. Soil Biol. Biochem. 2018, 120, 105–125. [Google Scholar] [CrossRef]
  15. Morvan, X.; Saby, N.P.A.; Arrouays, D.; Le Bas, C.; Jones, R.J.A.; Verheijen, F.G.A.; Bellamy, P.H.; Stephens, M.; Kibblewhite, M.G. Soil monitoring in Europe: A review of existing systems and requirements for harmonisation. Sci. Total Environ. 2008, 391, 1–12. [Google Scholar] [CrossRef]
  16. Sharma, N.K.; Singh, R.J.; Mandal, D.; Kumar, A.; Alam, N.M.; Keesstra, S. Increasing farmer’s income and reducing soil erosion using intercropping in rainfed maize-wheat rotation of Himalaya, India. Agric. Ecosyst. Environ. 2017, 247, 43–53. [Google Scholar] [CrossRef]
  17. Eivazi, F.; Bayan, M.R.; Schmidt, K. Select soil enzyme activities in the historic Sanborn Field as affected by long-term cropping systems. Commun. Soil Sci. Plan. 2003, 34, 2259–2275. [Google Scholar] [CrossRef]
  18. Crecchio, C.; Curci, M.; Pellegrino, A.; Ricciuti, P.; Tursi, N.; Ruggiero, P. Soil microbial dynamics and genetic diversity in soil under monoculture wheat grown in different long-term management systems. Soil Biol. Biochem. 2007, 39, 1391–1400. [Google Scholar] [CrossRef]
  19. Bian, T.; Zheng, S.; Li, X.; Wang, S.; Zhang, X.; Wang, Z.; Li, X.; Fu, H.; Sun, Z. The variation of soil phosphorus fractions and microbial community composition under consecutive cucumber cropping in a greenhouse. Horticulturae 2022, 8, 320. [Google Scholar] [CrossRef]
  20. Xu, H.W.; Qu, Q.; Lu, B.B.; Li, P.; Xue, S.; Liu, G.B. Response of soil specific enzyme activity to vegetation restoration in the Loess hilly region of China. Catena 2020, 191, 104564. [Google Scholar] [CrossRef]
  21. Liu, G.; Zhang, X.; Wang, X.; Shao, H.; Yang, J.; Wang, X. Soil enzymes as indicators of saline soil fertility under various soil amendments. Agric. Ecosyst. Environ. 2017, 237, 274–279. [Google Scholar]
  22. Trasar-Cepeda, C.; Leiros, M.C.; Gil-Sotres, F. Hydrolytic enzyme activities in agricultural and forest soils. Some implications for their use as indicators of soil quality. Soil Biol. Biochem. 2008, 40, 2146–2155. [Google Scholar] [CrossRef]
  23. Wang, B.; Xue, S.; Liu, G.B.; Zhang, G.H.; Li, G.; Ren, Z.P. Changes in soil nutrient and enzyme activities under different vegetations in the Loess Plateau area, Northwest China. Catena 2012, 92, 186–195. [Google Scholar] [CrossRef]
  24. Cui, J.; Liu, C.; Li, Z.; Wang, L.; Chen, X.; Ye, Z.; Fang, C. Long-term changes in topsoil chemical properties under centuries of cultivation after reclamation of coastal wetlands in the Yangtze Estuary, China. Soil. Till. Res. 2012, 123, 50–60. [Google Scholar] [CrossRef]
  25. Xie, X.; Pu, L.; Wang, Q.; Zhu, M.; Xu, Y.; Zhang, M. Response of soil physicochemical properties and enzyme activities to long-term reclamation of coastal saline soil, Eastern China. Sci. Total Environ. 2017, 607, 1419–1427. [Google Scholar] [CrossRef] [PubMed]
  26. Qi, R.; Li, J.; Lin, Z.; Li, Z.; Li, Y.; Yang, X.; Zhang, J.; Zhao, B. Temperature effects on soil organic carbon, soil labile organic carbon fractions, and soil enzyme activities under long-term fertilization regimes. Appl. Soil Ecol. 2016, 102, 36–45. [Google Scholar] [CrossRef]
  27. Li, J.; Xie, T.; Zhu, H.; Zhou, J.; Li, C.; Xiong, W.; Xu, L.; Wu, Y.; He, Z.; Li, X. Alkaline phosphatase activity mediates soil organic phosphorus mineralization in a subalpine forest ecosystem. Geoderma 2021, 404, 115376. [Google Scholar] [CrossRef]
  28. Acosta-Martinez, V.; Cruz, L.; Sotomayor-Ramirez, D.; Perez-Alegria, L. Enzyme activities as affected by soil properties and land use in a tropical watershed. Appl. Soil Ecol. 2007, 35, 35–45. [Google Scholar] [CrossRef]
  29. Li, J.; Liu, G.; Kwak, J.; Chang, S.X.; Gao, H.; Wu, Q.; Yang, J.; Chen, J. Reclamation of desert land to continuous cotton cropping affects soil properties and microbial communities in the desert-oasis ecotone of Xinjiang, China. J. Soils Sediments 2020, 20, 862–873. [Google Scholar] [CrossRef]
  30. Franco-Otero, V.G.; Soler-Rovira, P.; Hernandez, D.; Lopez-de-Sa, E.G.; Plaza, C. Short-term effects of organic municipal wastes on wheat yield, microbial biomass, microbial activity, and chemical properties of soil. Biol. Fertil. Soils 2012, 48, 205–216. [Google Scholar] [CrossRef] [Green Version]
  31. Szoboszlay, M.; Dohrmann, A.B.; Poeplau, C.; Don, A.; Tebbe, C.C. Impact of land-use change and soil organic carbon quality on microbial diversity in soils across Europe. FEMS Microbiol. Ecol. 2017, 93, fix146. [Google Scholar] [CrossRef] [Green Version]
  32. Tosi, M.; Correa, O.S.; Soria, M.A.; Vogrig, J.A.; Sydorenko, O.; Montecchia, M.S. Land-use change affects the functionality of soil microbial communities: A chronosequence approach in the Argentinian Yungas. Appl. Soil Ecol. 2016, 108, 118–127. [Google Scholar] [CrossRef]
  33. Wu, W.; Dong, C.; Wu, J.; Liu, X.; Wu, Y.; Chen, X.; Yu, S. Ecological effects of soil properties and metal concentrations on the composition and diversity of microbial communities associated with land use patterns in an electronic waste recycling region. Sci. Total Environ. 2017, 601, 57–65. [Google Scholar] [CrossRef]
  34. Zhang, L.; Xue, T.; Yuan, L.; Gao, F.; Hao, X.; Yang, C.; Wang, L.; Han, Y.; Li, H.; Wang, H. The effect of vineyard reclamation on soil properties and microbial communities in desertified land in Hongsibu, Ningxia. Catena 2022, 211, 106002. [Google Scholar] [CrossRef]
  35. Li, J.; Pokharel, P.; Liu, G.; Chen, J. Reclamation of desert land to different land-use types changes soil bacterial community composition in a desert-oasis ecotone. Land Degrad. Dev. 2021, 32, 1389–1399. [Google Scholar] [CrossRef]
  36. Li, C.Y.; Zheng, L. Improvement of simultaneous and rapid determination of total nitrogen and total phosphorus in plants by flow analyzer. Soil Fertil. Sci. China 2021, 2, 336–342. [Google Scholar]
  37. Bao, S.D. Agriculture and Chemistry Analysis of Soil; China Agriculture Press: Beijing, China, 2000; pp. 39–80. [Google Scholar]
  38. Peng, Q.; Li, X.H.; Wang, K.A.; Lv, X.H.; Yang, N.; Liu, X.F. Effect of reduced controlled release nitrogen fertilizer on the sweet pepper yield and distribution of soil nitrate, ammonium nitrogen. J. Soil Water Conserv. 2012, 26, 106–110. [Google Scholar]
  39. Lin, Q.M.; Wu, Y.G.; Liu, H.L. Modification of fumigation extraction method for measuring soil microbial biomass carbon. Chin. J. Ecol. 1999, 18, 63–66. [Google Scholar]
  40. Zhang, L.; Xue, T.; Gao, F.; Wei, R.; Wang, Z.; Li, H.; Wang, H. Carbon storage distribution characteristics of vineyard ecosystems in Hongsibu, Ningxia. Plants 2021, 10, 1199. [Google Scholar] [CrossRef]
  41. Zhang, Y.Y.; Ca, L.Q.; Wu, J.; Qi, P.; Luo, Z.Z.; Zhang, R.Z. The relationship between soil labile organic carbon fractions and the enzyme activities under different tillage measures in the Loess Plateau of central Gansu province. Agric. Res. Arid. Areas 2017, 35, 1–7. [Google Scholar]
  42. White, T.; Bruns, T.D.; Lee, S.; Taylor, J. Amplification direct sequencing of fungal ribosomal RNA genes for phylogenetics. In PCR Protocols: A Guide to Methods and Applications; Innis, M.A., Ed.; Sigma Aldrich: San Diego, CA, USA, 1990; pp. 315–322. [Google Scholar]
  43. Callahan, B.J.; McMurdie, P.J.; Rosen, M.J.; Han, A.W.; Johnson, A.J.A.; Holmes, S.P. DADA2: High-resolution sample inference from Illumina amplicon data. Nat. Methods 2016, 13, 581–583. [Google Scholar] [CrossRef] [PubMed] [Green Version]
  44. Kemp, P.F.; Aller, J.Y. Bacterial diversity in aquatic and other environments: What 16S rDNA libraries can tell us. Fems. Microbiol. Ecol. 2004, 47, 161–177. [Google Scholar] [CrossRef]
  45. Quast, C.; Pruesse, E.; Yilmaz, P.; Gerken, J.; Schweer, T.; Yarza, P.; Peplies, J.; Gloeckner, F.O. The SILVA ribosomal RNA gene database project: Improved data processing and web-based tools. Nucleic Acids Res. 2013, 41, 590–596. [Google Scholar] [CrossRef]
  46. Koljalg, U.; Nilsson, R.H.; Abarenkov, K.; Tedersoo, L.; Taylor, A.F.S.; Bahram, M.; Bates, S.T.; Bruns, T.D.; Bengtsson-Palme, J.; Callaghan, T.M.; et al. Towards a unified paradigm for sequence-based identification of fungi. Mol. Ecol. 2013, 22, 5271–5277. [Google Scholar] [CrossRef] [Green Version]
  47. Segata, N.; Izard, J.; Waldron, L.; Gevers, D.; Miropolsky, L.; Garrett, W.S.; Huttenhower, C. Metagenomic biomarker discovery and explanation. Genome Biol. 2011, 12, R60. [Google Scholar] [CrossRef] [Green Version]
  48. Djukic, I.; Zehetner, F.; Tatzber, M.; Gerzabek, M.H. Soil organic-matter stocks and characteristics along an Alpine elevation gradient. J. Plant Nutr. Soil Sci. 2010, 173, 30–38. [Google Scholar] [CrossRef]
  49. Lal, R. Restoring soil quality to mitigate soil degradation. Sustainability 2015, 7, 5875–5895. [Google Scholar] [CrossRef] [Green Version]
  50. Domínguez, M.T.; Panettieri, M.; Madejón, E.; Madejón, P. Thistle crops in marginal lands after compost addition: Plant biomass and effect on soil physical, chemical and biological properties. Land Degrad. Dev. 2020, 31, 1167–1175. [Google Scholar] [CrossRef]
  51. Zhang, W.; Long, X.; Huo, X.; Chen, Y.; Lou, K. 16S rRNA-Based PCR-DGGE analysis of actinomycete communities in fields with continuous cotton cropping in Xinjiang, China. Microb. Ecol. 2013, 66, 385–393. [Google Scholar] [CrossRef]
  52. Cenini, V.L.; Fornara, D.A.; McMullan, G.; Ternan, N.; Carolan, R.; Crawley, M.J.; Clement, J.; Lavorel, S. Linkages between extracellular enzyme activities and the carbon and nitrogen content of grassland soils. Soil Biol. Biochem. 2016, 96, 198–206. [Google Scholar] [CrossRef] [Green Version]
  53. Bengtsson, J.; Ahnstrom, J.; Weibull, A.C. The effects of organic agriculture on biodiversity and abundance: A meta-analysis. J. Appl. Ecol. 2005, 42, 261–269. [Google Scholar] [CrossRef]
  54. Hartmann, M.; Frey, B.; Mayer, J.; Maeder, P.; Widmer, F. Distinct soil microbial diversity under long-term organic and conventional farming. ISME J. 2015, 9, 1177–1194. [Google Scholar] [CrossRef] [Green Version]
  55. Nacke, H.; Thuermer, A.; Wollherr, A.; Will, C.; Hodac, L.; Herold, N.; Schoening, I.; Schrumpf, M.; Daniel, R. Pyrosequencing-based assessment of bacterial community structure along different management types in German forest and grassland soils. PLoS ONE 2011, 6, e17000. [Google Scholar] [CrossRef] [Green Version]
  56. Xiong, W.; Li, Z.; Liu, H.; Xue, C.; Zhang, R.; Wu, H.; Li, R.; Shen, Q. The effect of long-term continuous cropping of black pepper on soil bacterial communities as determined by 454 pyrosequencing. PLoS ONE 2015, 10, e0136946. [Google Scholar] [CrossRef] [Green Version]
  57. Cheng, Z.; Zhang, F.; Gale, W.J.; Wang, W.; Sang, W.; Yang, H. Effects of reclamation years on composition and diversity of soil bacterial communities in Northwest China. Can. J. Microbiol. 2018, 64, 28–40. [Google Scholar] [CrossRef] [Green Version]
  58. Liu, J.; Yang, Z.; Dang, P.; Zhu, H.; Gao, Y.; Vu, N.H.; Zhao, Z. Response of soil microbial community dynamics to Robinia pseudoacacia L. afforestation in the loess plateau: A chronosequence approach. Plant Soil 2018, 423, 327–338. [Google Scholar] [CrossRef]
  59. Kerfahi, D.; Tripathi, B.M.; Dong, K.; Go, R.; Adams, J.M. Rainforest conversion to rubber plantation may not result in lower soil diversity of bacteria, fungi, and nematodes. Microb. Ecol. 2016, 72, 359–371. [Google Scholar] [CrossRef]
  60. Tian, Q.; Taniguchi, T.; Shi, W.; Li, G.; Yamanaka, N.; Du, S. Land-use types and soil chemical properties influence soil microbial communities in the semiarid Loess Plateau region in China. Sci. Rep. 2017, 7, 45289. [Google Scholar] [CrossRef] [Green Version]
  61. Li, H.; Chi, Z.; Li, J.; Wu, H.; Yan, B. Bacterial community structure and function in soils from tidal freshwater wetlands in a Chinese delta: Potential impacts of salinity and nutrient. Sci. Total Environ. 2019, 696, 134029. [Google Scholar] [CrossRef]
  62. Cai, W.; Li, Y.; Wang, P.; Niu, L.; Zhang, W.; Wang, C. Revealing the relationship between microbial community structure in natural biofilms and the pollution level in urban rivers: A case study in the Qinhuai River basin, Yangtze River Delta. Water Sci. Technol. 2016, 74, 1163–1176. [Google Scholar] [CrossRef] [Green Version]
  63. Zumsteg, A.; Luster, J.; Goeransson, H.; Smittenberg, R.H.; Brunner, I.; Bernasconi, S.M.; Zeyer, J.; Frey, B. Bacterial, archaeal and fungal succession in the forefield of a receding glacier. Microb. Ecol. 2012, 63, 552–564. [Google Scholar] [CrossRef] [PubMed] [Green Version]
  64. Ramirez, K.S.; Leff, J.W.; Barberán, A.; Bates, S.T.; Betley, J.; Crowther, T.W.; Kelly, E.F.; Oldfield, E.E.; Shaw, E.A.; Steenbock, C.; et al. Biogeographic patterns in below-ground diversity in New York City’s Central Park are similar to those observed globally. Proc. R. Soc. B Biol. Sci. 2014, 281, 20141988. [Google Scholar] [CrossRef] [PubMed]
  65. Fierer, N.; Jackson, R.B. The diversity and biogeography of soil bacterial communities. Proc. Natl. Acad. Sci. USA 2006, 103, 626–631. [Google Scholar] [CrossRef] [PubMed] [Green Version]
  66. Kozlova, Y.E.; Kostina, N.V.; Gorlenko, M.V.; Umarov, M.M. Structural and functional features of microbial communities in a soddy-podzolic soil under self-remediation conditions. Mosc. Univ. Soil Sci. Bull. 2008, 63, 184–189. [Google Scholar] [CrossRef]
  67. Maestre, F.T.; Delgado-Baquerizo, M.; Jeffries, T.C.; Eldridge, D.J.; Ochoa, V.; Gozalo, B.; Quero, J.L.; García-Gómez, M.; Gallardo, A.; Ulrich, W.; et al. Increasing aridity reduces soil microbial diversity and abundance in global drylands. Proc. Natl. Acad. Sci. USA 2015, 112, 15684–15689. [Google Scholar] [CrossRef] [Green Version]
  68. Porras-Alfaro, A.; Herrera, J.; Natvig, D.O.; Lipinski, K.; Sinsabaugh, R.L. Diversity and distribution of soil fungal communities in a semiarid grassland. Mycologia 2011, 103, 10–21. [Google Scholar] [CrossRef]
  69. Prober, S.M.; Leff, J.W.; Bates, S.T.; Borer, E.T.; Firn, J.; Harpole, W.S.; Lind, E.M.; Seabloom, E.W.; Adler, P.B.; Bakker, J.D.; et al. Plant diversity predicts beta but not alpha diversity of soil microbes across grasslands worldwide. Ecol. Lett. 2015, 18, 85–95. [Google Scholar] [CrossRef] [Green Version]
  70. Ng, E.L.; Patti, A.F.; Rose, M.T.; Schefe, C.R.; Wilkinson, K.; Smernik, R.J.; Cavagnaro, T.R. Does the chemical nature of soil carbon drive the structure and functioning of soil microbial communities? Soil Biol. Biochem. 2014, 70, 54–61. [Google Scholar] [CrossRef] [Green Version]
  71. Janusz, G.; Pawlik, A.; Sulej, J.; Swiderska-Burek, U.; Jarosz-Wilkolazka, A.; Paszczynski, A. Lignin degradation: Microorganisms, enzymes involved, genomes analysis and evolution. Fems. Microbiol. Rev. 2017, 41, 941–962. [Google Scholar] [CrossRef] [Green Version]
  72. Li, Y.; Li, Y.; Chang, S.X.; Liang, X.; Qin, H.; Chen, J.; Xu, Q. Linking soil fungal community structure and function to soil organic carbon chemical composition in intensively managed subtropical bamboo forests. Soil Biol. Biochem. 2017, 107, 19–31. [Google Scholar] [CrossRef]
  73. Shi, J.; Zhao, B.; Zheng, S.; Zhang, X.; Wang, X.; Dong, W.; Xie, Q.; Wang, G.; Xiao, Y.; Chen, F.; et al. A phosphate starvation response-centered network regulates mycorrhizal symbiosis. Cell 2021, 184, 5527. [Google Scholar] [CrossRef] [PubMed]
  74. Ji, L.; Si, H.; He, J.; Fan, L.; Li, L. The shifts of maize soil microbial community and networks are related to soil properties under different organic fertilizers. Rhizosphere 2021, 19, 100388. [Google Scholar] [CrossRef]
  75. Talbot, J.M.; Allison, S.D.; Treseder, K.K. Decomposers in disguise: Mycorrhizal fungi as regulators of soil C dynamics in ecosystems under global change. Funct. Ecol. 2008, 22, 955–963. [Google Scholar] [CrossRef] [Green Version]
  76. Thiet, R.K.; Frey, S.D.; Six, J. Do growth yield efficiencies differ between soil microbial communities differing in fungal:bacterial ratios? Reality check and methodological issues. Soil Biol. Biochem. 2006, 38, 837–844. [Google Scholar] [CrossRef]
  77. Huhe; Chen, X.; Hou, F.; Wu, Y.; Cheng, Y. Bacterial and fungal community structures in Loess Plateau Grasslands with different grazing intensities. Front. Microbiol. 2017, 8, 606. [Google Scholar] [CrossRef] [Green Version]
  78. Schmidt, S.K.; Nemergut, D.R.; Darcy, J.L.; Lynch, R. Do bacterial and fungal communities assemble differently during primary succession? Mol. Ecol. 2014, 23, 254–258. [Google Scholar] [CrossRef]
Figure 1. Selected vineyards and desertified soil sample plots. IR, Italian Riesling; M, Merlot; CS, Cabernet Sauvignon; CK, control check (desert land).
Horticulturae 08 01097 g001
Figure 2. Venn diagram of bacterial and fungal sequences in different soil sample plots. (a) Bacteria; (b) fungi. IR, Italian Riesling; M, Merlot; CS, Cabernet Sauvignon; CK, control check (desert land).
Horticulturae 08 01097 g002
Figure 3. Soil bacterial and fungal richness and diversity. (a) Bacteria; (b) fungi. IR, Italian Riesling; M, Merlot; CS, Cabernet Sauvignon; CK, control check (desert land).
Horticulturae 08 01097 g003
Figure 4. The relative abundance of major bacterial and fungal taxonomic groups at the phylum associated with the sample plots. (a) Bacteria; (b), fungi. IR, Italian Riesling; M, Merlot; CS, Cabernet Sauvignon; CK, control check (desert land).
Horticulturae 08 01097 g004
Figure 5. Soil bacterial and fungal beta diversity. (a) PCoA ordination for soil bacteria; (b) PCoA ordination for soil fungi; (c) hierarchical clustering heat map of soil bacteria; (d) hierarchical clustering heat map of soil fungi. IR, Italian Riesling; M, Merlot; CS, Cabernet Sauvignon; CK, control check (desert land). The right panel consists of a stacked histogram corresponding to the 20 genera most abundant in (c,d). Samples were subjected to UPGMA clustering based on the Euclidean distance of genus composition (horizontal) and based on a Pearson correlation coefficient matrix (vertical). Green and brown respectively correspond to genera exhibiting higher and lower levels of abundance in corresponding samples.
Horticulturae 08 01097 g005
Figure 6. LEfSe and network analyses of soil microbial communities. (a) LEfSe analysis of soil bacteria; (b) LEfSe analysis of soil fungi; (c) network analysis of soil bacteria; (d) network analysis of soil fungi. IR, Italian Riesling; M, Merlot; CS, Cabernet Sauvignon; CK, control check (desert land). Nodes in (a,b) correspond to the average relative abundance for the indicated taxa, with colored notes denoting taxa that differ significantly among groups such that abundance levels are higher in groups of samples represented by a given color. Letters are used to identify the names of taxa differing significantly among groups. Nodes in (c,d) correspond to the 100 genera exhibiting the highest richness values, with edges depicting correlations among pairs of nodes. Thicker edges denote stronger correlations.
Horticulturae 08 01097 g006
Figure 7. Redundancy analysis and canonical correspondence analysis of the relationship between soil physicochemical properties and microbial community composition. (a) Bacterial phylum level; (b) bacterial genus level; (c) fungal phylum level; (d) fungal genus level. TN, total nitrogen; TP, total phosphorus; TK, total potassium; SOC, soil organic carbon; MBC, Microbial biomass carbon; DOC, dissolved organic carbon. The red arrows represent the explanatory variables of soil properties, and the black arrows represent the top 10 soil microorganisms in abundance. The blue triangle shows the top 50 abundant soil bacteria and fungi.
Horticulturae 08 01097 g007
Table 1. Sample plot soil properties.
Soil PropertiesIRMCSCKF Valuep Value
TN (g/kg)0.54 ± 0.02 ab0.64 ± 0.11 a0.65 ± 0.03 a0.49 ± 0.04 b4.690.36
TP (g/kg)0.40 ± 0.10 a0.44 ± 0.04 a0.46 ± 0.01 a0.37 ± 0.01 a1.860.21
TK (g/kg)15.96 ± 0.29 b16.55 ± 0.17 ab17.30 ± 0.83 a16.64 ± 0.03 ab4.510.04
Available nitrogen (mg/kg)8.67 ± 1.43 c13.48 ± 1.96 c35.88 ± 4.63 a24.88 ± 1.62 b59.37<0.01
Available phosphorus(mg/kg)1.57 ± 0.28 d5.75 ± 0.79 c18.71 ± 1.72 b31.13 ± 1.65 a336.98<0.01
Available potassium(mg/kg)68.59 ± 0.09 c89.14 ± 4.08 b88.49 ± 0.09 b104.29 ± 0.15 a154.12<0.01
Ammonium nitrogen (mg/kg)2.96 ± 0.29 a4.68 ± 1.86 a3.23 ± 0.36 a3.88 ± 0.23 a1.890.21
nitrate Nitrogen (mg/kg)1.77 ± 0.41 b6.99 ± 1.06 a5.73 ± 0.95 a6.73 ± 0.82 a24.55<0.01
pH8.45 ± 0.07 ab8.69 ± 0.27 a8.51 ± 0.16 ab8.22 ± 0.03 b4.330.04
SOC (g/kg)2.29 ± 0.13 c3.20 ± 0.12 b3.86 ± 0.24 a1.83 ± 0.12 d99.97<0.01
MBC (mg/kg)86.82 ± 10.50 a113.30 ± 17.91 a114.23 ± 15.37 a94.55 ± 8.96 a3.010.09
DOC (mg/kg)25.30 ± 1.50 c55.56 ± 2.92 a48.02 ± 2.64 b18.28 ± 1.00 d203.56<0.01
Bulk density (g/cm3)1.07 ± 0.02 b1.11 ± 0.02 b1.07 ± 0.04 b1.27 ± 0.01 a39.55<0.01
Notes: IR, Italian Riesling; M, Merlot; CS, Cabernet Sauvignon; CK, control check (desert land). TN, total nitrogen; TP, total phosphorus; TK, total potassium; SOC, soil organic carbon; MBC, microbial biomass carbon; DOC, dissolved organic carbon. Values are means ± standard deviation (n = 3); different letters indicate significant differences (p < 0.05) among different sample plots based on a one-way ANOVA followed by a Duncan test. p values < 0.05 indicate significance and are in italics.
Table 2. Sample plot soil enzyme activity levels.
Enzyme ActivitiesIRMCSCKF Valuep Value
Urease (NH4+-N mg/g·24 h)0.22 ± 0.17 b0.62 ± 0.26 a0.40 ± 0.03 ab0.57 ± 0.13 a3.420.07
Alkaline phosphatase (U/g)763.13 ± 51.63 bc920.85 ± 80.71 b1555.63 ± 365.29 a522.57 ± 101.85 c15.30<0.01
Sucrase (glucose mg/g·24 h)5.48 ± 1.51 ab9.98 ± 7.00 ab12.57 ± 5.30 a2.82 ± 0.10 b2.90 0.10
Amylase (U/g)1.73 ± 0.11 b1.68 ± 0.05 b1.96 ± 0.13 a1.41 ± 0.05 c18.38<0.01
Ligninase (U/g)8.33 ± 4.22 a10.30 ± 3.82 a5.52 ± 2.72 a3.61 ± 2.52 a2.280.16
Cellulase (U/g)14.25 ± 3.33 a11.82 ± 0.82 a16.42 ± 5.41 a14.99 ± 3.72 a0.810.52
β-Glucosidase (U/g)2.26 ± 1.55 ab3.20 ± 0.67 a1.56 ± 0.88 ab0.96 ± 0.62 b2.770.11
Notes: IR, Italian Riesling; M, Merlot; CS, Cabernet Sauvignon; CK, control check (desert land). Different letters indicate significant differences among different sample plots.
Table 3. Pearson correlation analyses of the relationships between soil physicochemical properties and microbial diversity.
Soil PropertiesBacteriaFungi
Chao 1Observed SpeciesShannonSimpsonChao 1Observed SpeciesShannonSimpson
Bulk density−0.71 *0.70 *0.65 *0.47 0.29 0.28 −0.05 0.10
TN−0.49 −0.46 −0.19 −0.12 0.00 0.02 0.25 0.20
TK0.08 0.11 0.28 0.20 −0.08 −0.08 0.14 0.39
Available nitrogen−0.07 −0.05 −0.17 −0.44 −0.15 −0.16 0.17 0.43
Available phosphorus0.43 0.44 0.35 0.06 0.05 0.04 0.03 0.30
Available potassium0.48 0.49 0.47 0.16 0.29 0.28 0.15 0.34
pH−0.39 −0.38 −0.37−0.26 −0.23 −0.23 −0.27 −0.44
SOC−0.44 −0.42 −0.37 −0.40 −0.22 −0.21 0.15 0.19
Urease0.49 0.49 0.33 0.16 −0.06 −0.07 −0.35 −0.24
Alkaline phosphatase−0.61 *−0.59 *−0.54 −0.53 −0.34 −0.33 0.13 0.21
Sucrase−0.45 −0.41 −0.08 0.04 −0.02 −0.01 0.27 0.29
Amylase−0.46 −0.45 −0.47 −0.43 −0.33 −0.33 0.08 0.08
Notes: TN, total nitrogen; TK, total potassium; SOC, soil organic carbon. * p < 0.05.
Table 4. Pearson correlation analyses of the relationships between soil physicochemical properties and the four most dominant phyla.
Soil PropertiesBacteriaFungi
ProteobacteriaActinobacteriaAcidobacteriaChloroflexiAscomycotaBasidiomycotaMortierellomycotaMucoromycota
Bulk density−0.48 0.30 0.61 *0.31 −0.08 −0.20 0.30 −0.27
TN0.44 −0.58 *0.15 −0.17 0.19 −0.05 −0.05 0.03
TK0.10 −0.45 0.65 *0.02 0.37 −0.09 0.33 −0.15
Available nitrogen0.43 −0.60 *0.33 −0.49 0.31 −0.15 0.47 −0.09
Available phosphorus−0.09 −0.13 0.61 *−0.13 0.09 −0.24 0.49 −0.30
Available potassium−0.06 −0.25 0.85 **0.10 0.12 −0.37 0.48 −0.35
pH0.43 −0.36 −0.29 −0.07 0.51 −0.09 −0.24 0.28
SOC0.60 *−0.71 **0.03 −0.24 0.43 0.02 0.05 0.00
Urease0.02 −0.17 0.38 0.23 0.58 *−0.16 0.04 −0.30
Alkaline phosphatase0.70 *−0.75 **−0.09 −0.49 0.28 0.10 0.11 0.07
Sucrase0.35 −0.55 0.25 −0.14 0.12 0.05 0.02 −0.04
Amylase0.44 −0.38 −0.40 −0.35 0.31 0.20 −0.15 −0.02
Notes: TN, total nitrogen; TK, total potassium; SOC, soil organic carbon. * p < 0.05; ** p < 0.01.
Publisher’s Note: MDPI stays neutral with regard to jurisdictional claims in published maps and institutional affiliations.

