Article

Iron Biofortification of Greenhouse Cherry Tomatoes Grown in a Soilless System

by
Camila Vanessa Buturi
1,
Silvia Renata Machado Coelho
2,
Claudio Cannata
1,
Federico Basile
1,
Francesco Giuffrida
1,*,
Cherubino Leonardi
1 and
Rosario Paolo Mauro
1
1
Dipartimento di Agricoltura, Alimentazione e Ambiente (Di3A), University of Catania, Via Valdisavoia 5, 95123 Catania, Italy
2
Department of Agricultural Engineering, Western Paraná State University, Universitária Street, 2069, Cascavel 85819-110, Brazil
*
Author to whom correspondence should be addressed.
Horticulturae 2022, 8(10), 858; https://doi.org/10.3390/horticulturae8100858
Submission received: 30 August 2022 / Revised: 12 September 2022 / Accepted: 16 September 2022 / Published: 20 September 2022
(This article belongs to the Special Issue Vegetable Biofortification: Strategies, Benefits and Challenges)

Abstract

:
Iron (Fe) biofortification is a strategy to increase the amount of iron in food crops. The goal of this work was to assess the possibility of maximizing the Fe content in cherry tomatoes grown in a soilless system. The cultivar Creativo was grown with three concentrations of Fe (as Fe-HBED) in the nutrient solution (0.022, 1, and 2 mmol L−1), and received further foliar applications of the element (as Fe-DTPA) at 0, 250, and 500 µmol L−1. The addition of 2 mmol Fe L−1 to the nutrient solution, together with foliar sprays at 500 µmol Fe L−1, induced the highest increase in fruit Fe concentration in clusters 1 and 2 (by 163% and 190%, respectively). The Fe added to the nutrient solution increased the fruit dry matter (up to +10.21%) but decreased the fruit’s fresh weight (up to −11.06%). The higher Fe concentrations provided to the crop synergistically increased the contents of other minerals (i.e., K, Mg, Na, and Zn), along with the fruit’s titratable acidity and soluble solids content, improving multiple functional and quality traits of the cherry tomatoes. These results show that Fe biofortification of cherry tomatoes can be effective to address Fe deficiency while obtaining high-quality products.

1. Introduction

Iron (Fe) deficiency affects approximately two billion people worldwide, i.e., around 25% of the global population [1,2]. This mineral is responsible for a variety of metabolic processes, such as DNA synthesis and electron transport [3]. The recommended daily allowance (RDA) for Fe is from 8 to 18 mg day−1 [4]. When the body does not receive an adequate amount of Fe it cannot produce enough of the substances responsible for the transportation of oxygen, leading to a series of complications and diseases such as anemia [5]. The groups at greatest risk of Fe deficiency include women, infants, vegetarians, and frequent blood donors [6]. In this framework, biofortification is a promising strategy that allows the delivery of plant foods enriched with one or more nutrients, helping to fight the deficiencies associated with inadequate diets [7]. Vegetables represent healthy food products that are a natural source of vitamins, minerals, and fibers [8,9], and are therefore good candidates for biofortification programs. Through biofortification, vegetables can be nutritionally improved through simple agronomic expedients, such as targeted fertilization, helping to respond to the specific dietary needs of consumers [10].
Greenhouse cultivation enables the effective control of the environmental conditions influencing the quality of vegetables, such as air temperature, light, and vapor-pressure deficit [11]. Moreover, soilless cultivation systems facilitate the precise control of plant nutrition, allowing improvement of the yield and composition of many vegetables, including their concentrations of minerals and secondary metabolites [12]. In soilless systems, biofortification can be achieved by adding micronutrients to the nutrient solution and/or spraying the leaves of plants with suitable fertilizing solutions [13]. When Fe fertilization is concerned, the advantages of soilless systems stem from the poor interaction between the micronutrient and the growing medium, so that the limited mobility of Fe can be managed [14].
The tomato (Solanum lycopersicum L.) is the main fruit vegetable in the Mediterranean region, highly appreciated for its functional quality and versatility, which enable it to be consumed either fresh or as a processed product in soups, juices, or sauces [15,16]. Being a pillar of a healthy diet, this product could be effectively used to foster the intake of many important nutraceuticals, including minerals, provided that suitable agronomic protocols are developed and made available at the farm level [13]. To this end, the application of fertilizers in nutrient solution or as foliar sprays can affect the yield and product quality of many crops, including tomatoes [1,17].
Iron is one of the essential elements for normal plant growth and health, since it participates in a wide range of biochemical and physiological functions. For example, it is involved in the synthesis of chlorophyll and is part of many essential enzymes of the electron transport chain [18]. The link between Fe and other minerals is complex and depends on many factors, such as plant species, chemical form, and concentration applied, but it has been demonstrated that Fe can interact with phosphates, Zn, Cu, and Mn [19].
When using Fe fertilizers, attention should be paid to the concentration and chemical form, because of the high potential toxicity of this mineral when excessively present in the crops [20]. At concentrations higher than 500 mg kg−1 dry matter, Fe may cause damage related to the formation of reactive oxygen species (ROS), in addition to impairing DNA, cellular structures, and proteins [18]. Consequently, few studies have been conducted with the goal of enhancing the Fe concentrations in vegetables, so there are insufficient operational indications for the biofortification of important vegetables for human nutrition, as in the case of tomatoes [19,20,21,22]. For these reasons, the goal of this research was to fine-tune an agronomic protocol of Fe biofortification for cherry tomatoes grown in a soilless system. To maximize the Fe accumulation in tomato fruits, we studied the effects of the application of different concentrations of Fe chelate in the nutrient solution and in combination with foliar applications, and evaluated the subsequent effects on mineral composition, yield, and quality traits of the fruits of the tomato cultivar Creativo.

2. Materials and Methods

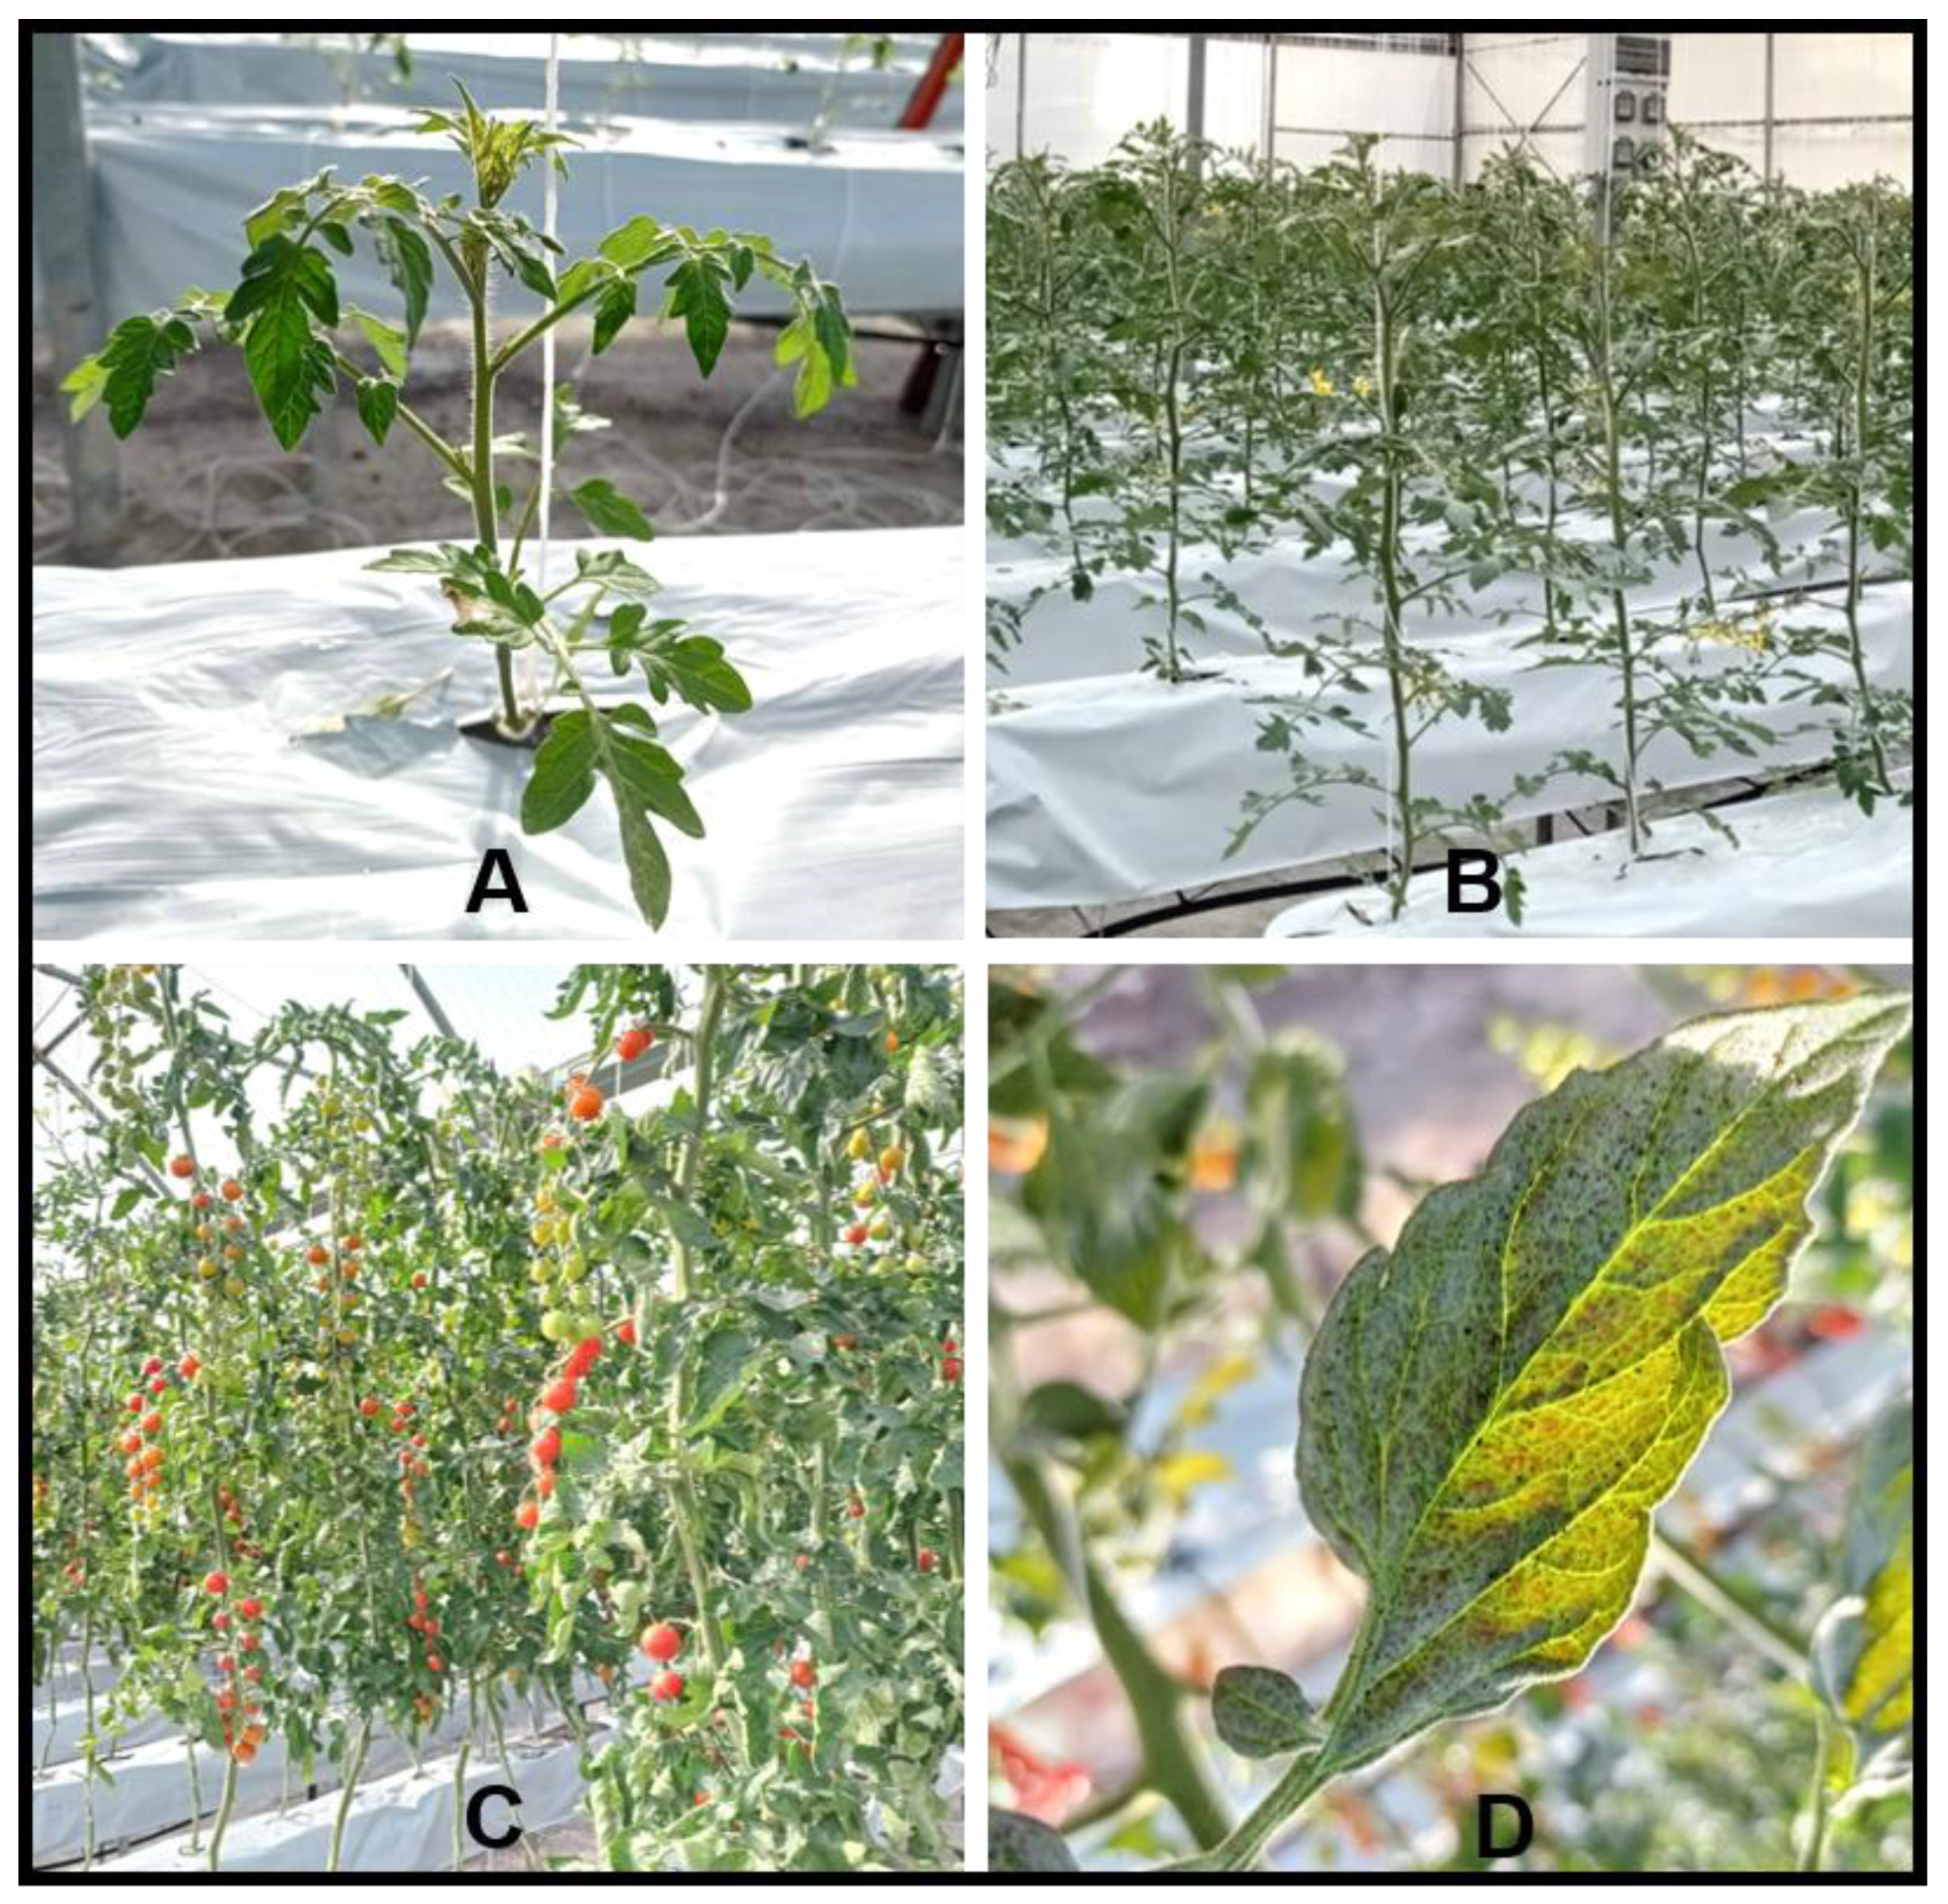
2.1. Experimental Site and Plant Material

The study was conducted from February to May 2021, in the greenhouse of the University of Catania (Sicily, Italy: 37°24′31.5” N, 15°03′32.8” E, 6 m a.s.l.). The climate is semi-arid Mediterranean, with dry, warm summers and mild winters. The cold greenhouse used has an area of 810 m2, and has adjustable windows along the sides and on the roof, along with a steel tubular structure covered with polycarbonate slabs.
Cherry tomato plants of the cultivar “Creativo” were transplanted on 1 February 2021 at the stage of four true leaves. The cultivation system adopted was open and soilless, where plants were grown in 5 L plastic pots (19 cm width, 20 cm height), and perlite was used as the growing medium (particle size 2–6 mm). Plantlets were selected for healthy appearance and uniform size before transplanting. Pots were positioned in simple rows, in a 0.30 × 1.00 m rectangular format (center-to-center), with 1 plant per pot (3.33 plants m−2). Plants were grown as a single stem up to the 5th cluster, while clusters were pruned to 12 fruits. Each net experimental unit contained 8 plants (Figure 1A–C). During the experiment, the crop was fertigated with a nutrient solution with the following composition: 8.0 mM N-NO3, 1.5 mM S, 1.0 mM P, 3.0 mM K, 3.0 mM Ca, 1.0 mM Mg, 1.0 mM NH4+, 22 µM Fe, 9 µM Mn, 2 µM Cu, 4 µM Zn, 9 µM B, and 1 µM Mo, with pH 6.0 ± 0.2 and an electrical conductivity (EC) of 2600 µS cm−1 [23]. A leaching fraction of ~35% was used to mitigate root-zone salinization [24].
A split-plot experimental design with three replicates was adopted. On the main plots, the applied treatments consisted of three concentrations of Fe chelate added to the nutrient solution—0 (only the standard nutrient solution, equal to 0.022 mmol Fe L−1), 1, and 2 mmol Fe L−1 (hereafter referred to as R0, R1, and R2, respectively)—in the form of Fe-HBED (N,N’-Bis(2-hydroxybenzyl)ethylenediamine-N,N’-diacetic acid). In the sub-plots, we carried out five applications of three concentrations of Fe chelate with foliar spray solution—0, 250, and 500 µmol Fe L−1 (hereafter referred to as L0, L250, and L500, respectively)—in the form of Fe-DTPA (diethylenetriaminepentaacetic acid). Foliar treatments were applied on 18 March, 30 March, 13 April, 20 April, and 27 April, around the flowering stage of each cluster. From 27 April to 11 May, tomatoes belonging to the 1st and 2nd clusters were harvested by hand and subsequently transported to the laboratory. All qualitative determinations were performed on the 2nd cluster, whereas the amount of Fe was measured in both clusters, to check the consistency of the mineral accumulation in the tomato fruits. Once in the laboratory, the fruits were analyzed, flash-frozen with liquid nitrogen, and stored in a freezer at −80 °C for further analytical determinations. Overall, 432 clusters were collected (2 clusters × 3 root concentrations × 3 leaf concentrations × 3 replicates × 8 plants).

2.2. Carpometric Determinations

The following measurements were carried out on each sample: Fruit fresh weight (FW) was assessed gravimetrically on 8 fruits per plot detached from their rachis and selected for their uniform appearance and absence of defects. Firmness was measured using a digital texture analyzer (model TA-XT2, Stable Micro Systems, Godalming, UK) as described by Distefano et al. [25]. The fruit dry matter (DM) content was calculated by drying fruits in a thermoventilated oven at 70 °C until constant weight. The chromatic coordinates of the fruit were determined as described by McGuire [26] on the equatorial axis of 12 fruits per plot, using a tristimulus Minolta Chroma Meter (model CR-200, Minolta Corp., Ramsey, NJ, USA) calibrated with a standard white tile (UE certificated) with illuminant D65/10°. Fruit color was expressed as L*, a*, b*, (a*/b*)2, and Chroma ((a*2 + b*2)1/2). Approximately 50 g of cherry tomatoes was homogenized using a home blender (La Moulinette, Groupe SEB, Écully, France) and centrifuged for 15 min at 5000 rpm (model 4235A, ALC centrifuge, Milan, Italy); the samples were then immediately analyzed for soluble solids content and titratable acidity. Soluble solids content (SSC) was measured using a refractometer (model Abbe 16531, Carl Zeiss, Oberkochen, Germany), and the results were expressed as °Brix. Titratable acidity (TA) was measured by titrating an aliquot of the juice sample with 0.1 M NaOH up to pH 8.1.

2.3. Biochemical Analyses

For the biochemical analyses, frozen samples from the 2nd cluster were lyophilized in a freeze-dryer (model Alpha 1–4 LD plus, Martin Christ, Osterode am Harz, Germany) and ground using liquid nitrogen. All further analyses were performed using plastic cuvettes, and readings were carried out using a UV–Visible spectrophotometer (model 7310, Jeanway, Stone, Staffordshire, UK).

2.3.1. Total Carotenoids Concentration

Determination of total carotenoids in fruits was conducted as described by Lichtenthaler and Wellburn [27], with some modifications. For the extraction, 50 mg of lyophilized tomato powder was mixed with 5 mL of ethanol (96%) and vortexed for 1 min; the samples were then left overnight in the dark at 10 °C. After that, samples were sonicated for 10 min in an ultrasonic bath (below 10 °C) and centrifuged for 10 min (5000 g at 6 °C). The samples were read in 1.5 mL plastic cuvettes, using 96% ethanol as the blank. Readings were performed at wavelengths of 470, 649, and 665 nm, and the absorbance values were applied in the following equations:
Ca = 13.95 × A665 − 6.88 × A649
Cb = 24.96 × A649 − 7.32 × A665
Cx + c = (1000 × A470 − 2.05 × Ca − 114.8 × Cb)/245
where Ca stands for chlorophyll A, Cb for chlorophyll B, and Cx + c for total carotenoids (including xanthophylls).

2.3.2. Total Phenolic Content

Total phenolic content (TPC) was quantified through the Folin–Ciocâlteu method. To this end, 100 mg of lyophilized tomato powder was mixed with 5 mL of methanol (80%) and vortexed for 1 min. Samples were then submitted to 10 min in an ultrasonic bath (below 10 °C) and centrifuged for 15 min at 4000 g and 6 °C. The supernatant was withdrawn, and the extraction process was repeated 3 times. The extracts were combined and diluted to 20 mL using methanol (80%). For the reaction, 200 µL of extract solution was mixed with Folin–Ciocâlteu reagent (1000 µL at 10% concentration) and left to react for 2 min at room temperature. Next, 800 µL of sodium carbonate (0.7 M) was added to stop the reaction, and then the solution was mixed and placed in the dark at room temperature for 60 min. Samples were read at 760 nm, and TPC values were obtained from a standard curve prepared by plotting the change in absorbance against different concentrations of gallic acid.

2.3.3. DPPH Assay

The DPPH (2,2-diphenyl-1-picrylhydrazyl) radical scavenging activity of tomato extracts was determined via the procedure reported by Brand-Williams et al. [28]. First, 100 mg of lyophilized tomato powder was mixed with 5 mL of methanol (80%) and vortexed for 1 min. Samples were then submitted to 10 min in an ultrasonic bath (below 10 °C) and centrifuged for 15 min at 4000 g and 6 °C. For the reaction, 150 µL of supernatant was mixed with 1350 µL of recently prepared DPPH solution (150 µmol), and then the samples were vigorously agitated and placed in the dark for 30 min. The decrease in the absorbance of the methanolic solution of DPPH was read at 515 nm, and DPPH was calculated from a standard curve prepared by plotting the change in absorbance against different Trolox concentrations.

2.3.4. FRAP Assay

The ferric-reducing antioxidant power (FRAP) assay of extracts was performed as described by Benzie and Strain [29]. For the extraction, 200 mg of lyophilized tomato powder was mixed with 10 mL of methanol (100%), vortexed for 1 min, and placed in the dark for 30 min. After that, the samples were centrifuged for 10 min at 4500 g and 6 °C. Preparation of the FRAP reagent consisted of 10 mL of acetate buffer (300 mmol, pH 3.1) mixed with 1 mL of TPTZ (2,4,6-Tris(2-pyridyl)-s-triazine) solution (10 mmol in 40 mmol HCl) and 1 mL of ferric chloride (20 mmol). For the reaction, 150 µL of supernatant was mixed with 300 µL of ultrapure water, vortexed, and added to 3 mL of FRAP reagent. Samples were placed in the dark at 20 °C for 10 min. The FRAP assay, based on the reduction of Fe(III) by the sample extract, was conducted following the shift in absorbance at 593 nm upon the formation of the blue compound Fe(II)-tripyridyltriazine from colorless oxidized Fe(III), in the presence of a particular sample concentration. FRAP was calculated from a standard curve prepared by plotting the change in absorbance against different Trolox concentrations.

2.4. Determination of Nitrogen and Mineral Contents

For nitrogen (N) determination, sulfuric digestion with catalyst salts in a digesting block was employed, and distillation was performed in a N distillation unit (model TE-0363, Tecnal, San Juan, PR) according to the Kjeldahl method. Total phosphorus (P) determination was performed using the colorimetric method [30] through spectrophotometry (model DR 2010, Hach, Loveland, CO, USA). For the determination of the other minerals, nitric perchloric acid digestion was used [30]. Firstly, a pre-digestion of 500 mg of sample was performed with 5 mL of nitric perchloric acid for about 16 h, and then tubes were placed in a digesting block and the temperature was gradually raised (50 °C hour−1) to 180 °C and maintained for about 4 h. When the samples had cooled down, the extracts were filtered with filter paper discs, and the volume was adjusted to 50 mL with ultrapure water. The extract was used for the determination of minerals, including macronutrients (i.e., K, Ca, Mg, and Na) and micronutrients (i.e., Fe, Cu, Zn, Mn, Cd, Cr, and Pb); analyses were performed using an atomic absorption spectrometer (AAS) (model AA-6300, Shimadzu, Kyoto, Japan).

Determination of Leaf Fe Content

After 72 days of cultivation, the leaves of cherry tomato plants started to show dark spots (Figure 1D). In order to assess the Fe content at that time, leaves covering the third cluster of plants submitted to the different treatments were harvested, dried, and analyzed to determine their Fe content, following the procedure described above.

2.5. Statistical Procedures

The collected data were subjected to a two-way analysis of variance (ANOVA) for split plots, according to the experimental layout used in the greenhouse. Means were compared using Fisher’s protected least significant difference (LSD) test (p ≤ 0.05). The calculations were carried out on Excel version 2016 (Microsoft Corporation, Redmond, WA, USA) and Minitab (version 16.1.1, Minitab Inc., State College, PA, USA).

3. Results

3.1. Yield and Carpometric Traits

As shown in Table 1, when compared to the control, the yield and average FW of cherry tomatoes treated with Fe (by the roots) decreased (10 and 13%, for the average of R1 and R2, respectively). However, their DM content at R2 increased significantly (+10.2%) compared to the control. In addition, a significant increase in SSC (+7.7% and +11.8%) was observed in R1 and R2 plants, while TA (+20.5%) was promoted by the R2 treatment. Similarly, fruit firmness was increased in the R2 treatment (+9.3%) compared to the control. Regarding the fruit’s chromatic coordinates, only the variable L* showed a reduction in R2 plants, whereas the other chromatic variables showed no significant differences between treatments (Table 2). For the plants receiving Fe through leaf spraying, none of the carpometric variables showed significant differences.

3.2. Biochemical Variables

Cherry tomato fruits from the second cluster showed no significant differences in the total carotenoids and total phenolic contents between the compared treatments. The same was observed for the antioxidants DPPH and FRAP (Table 3).

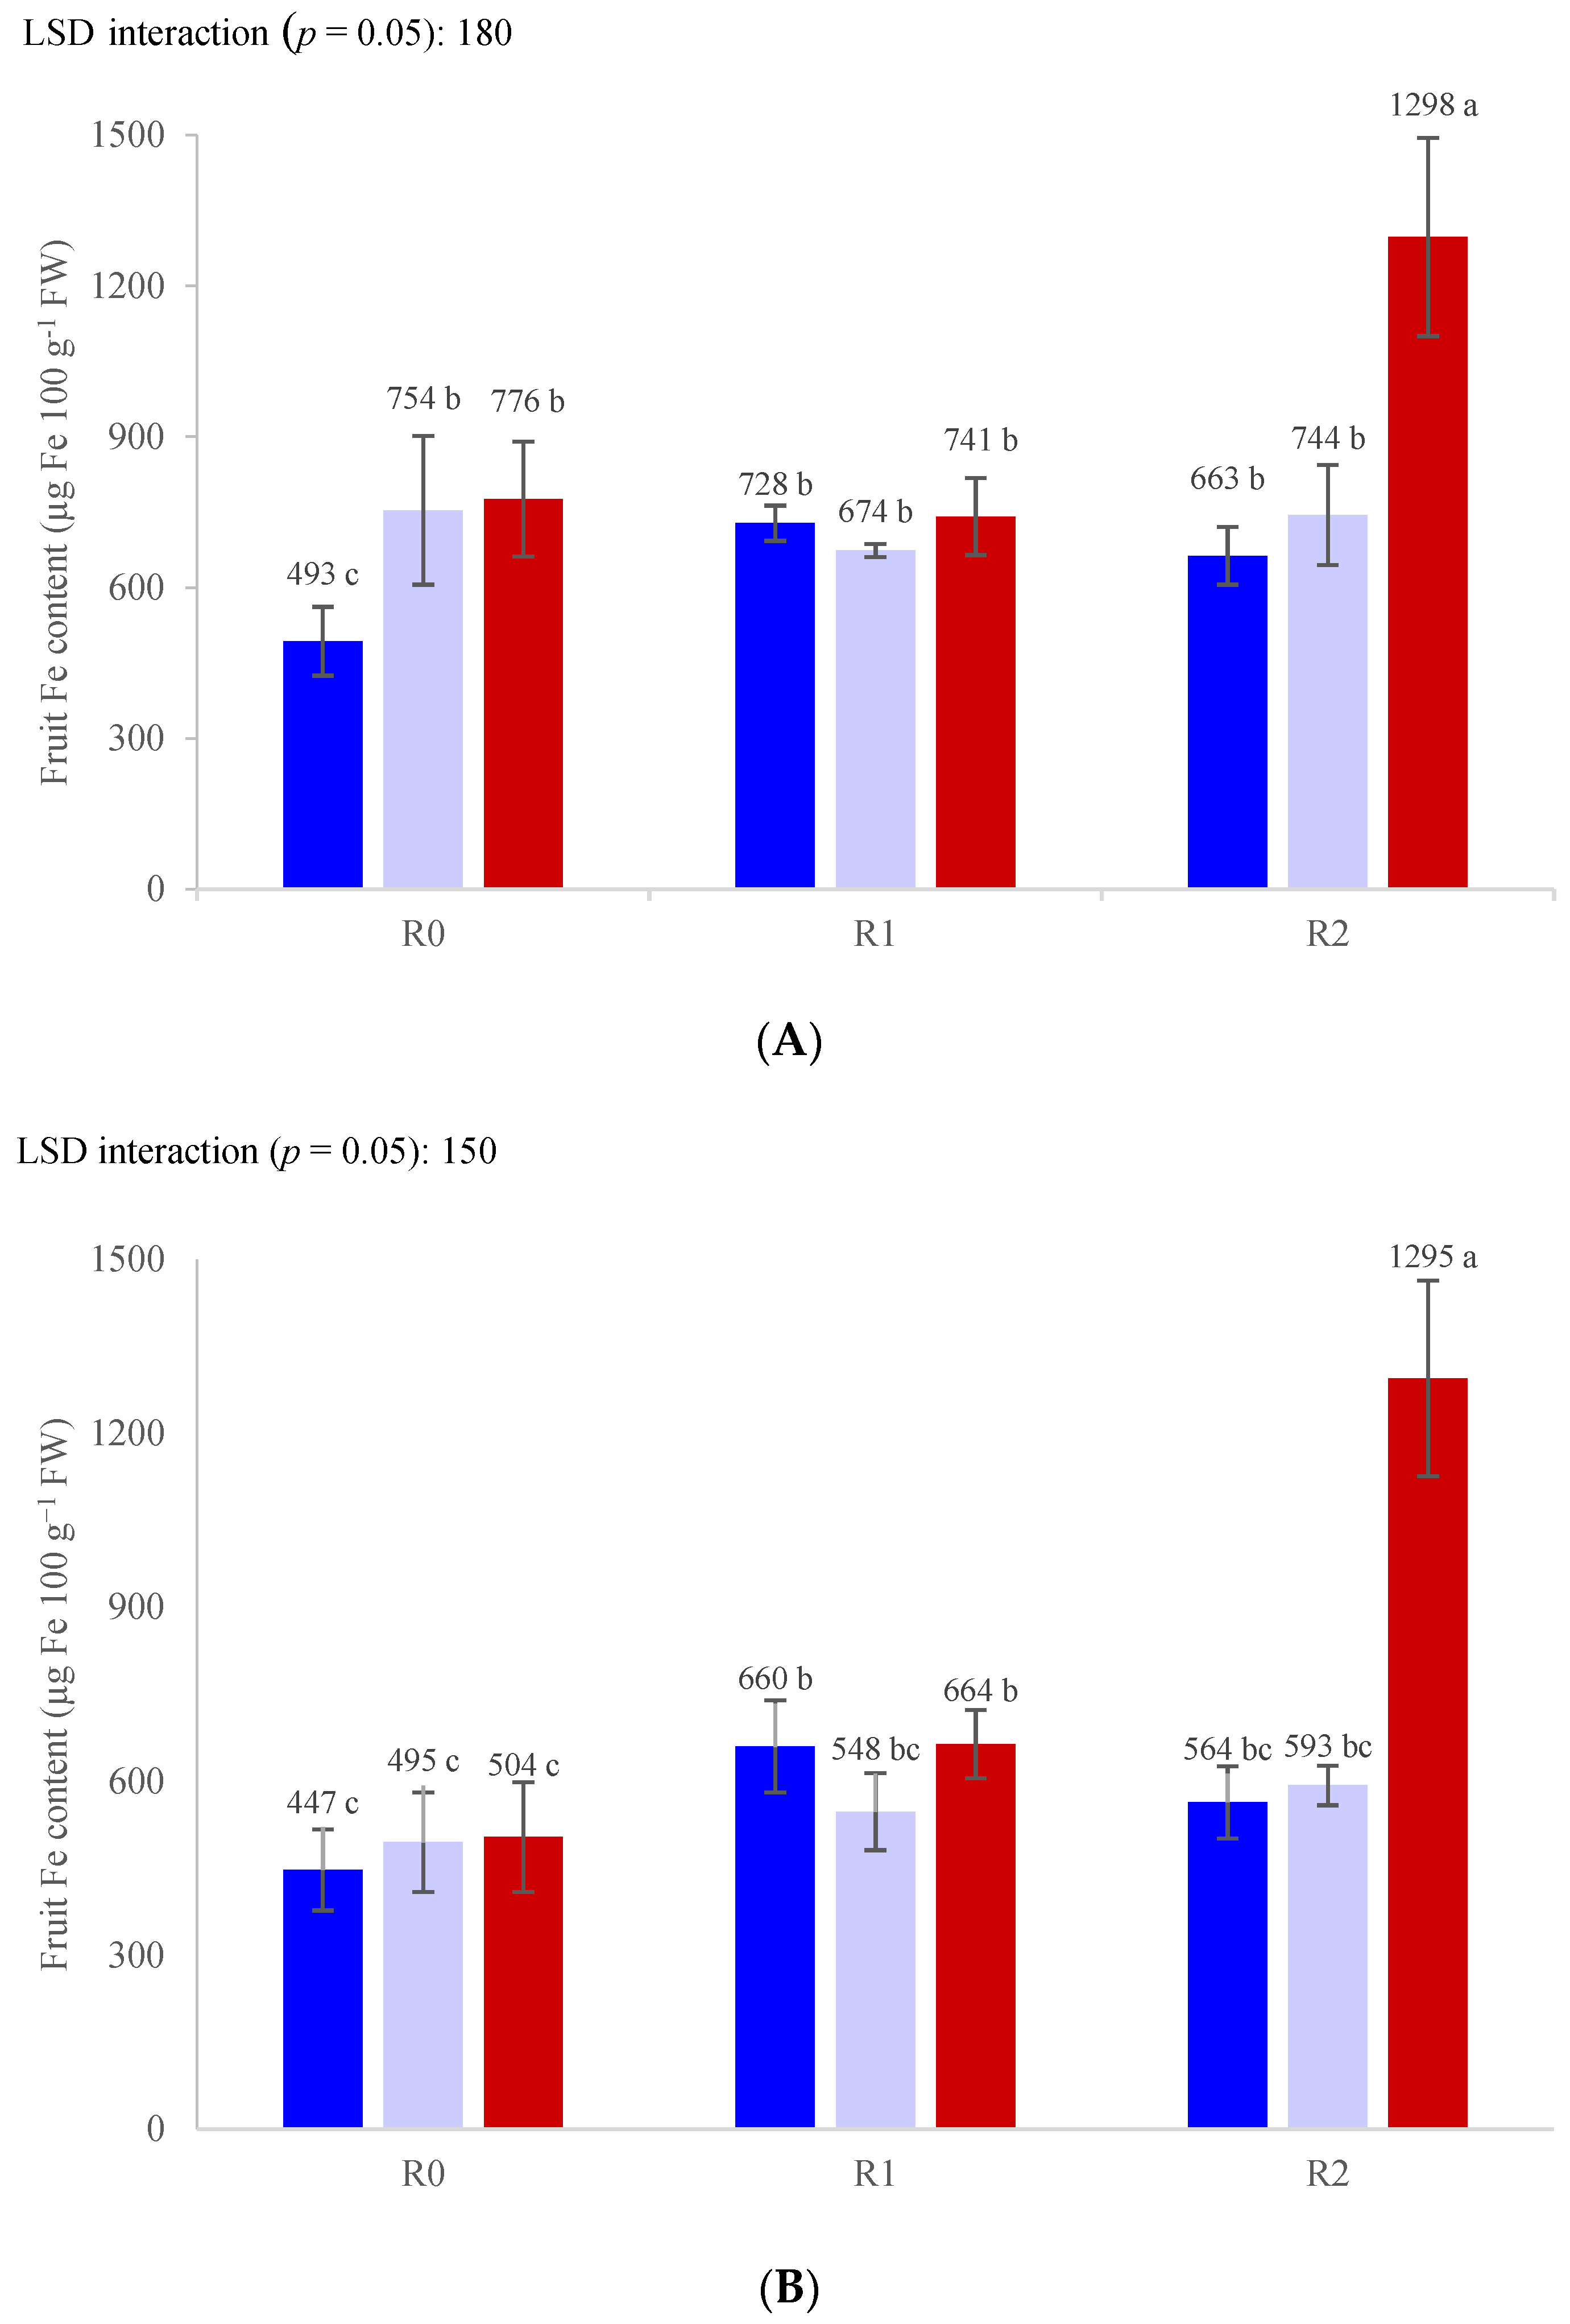
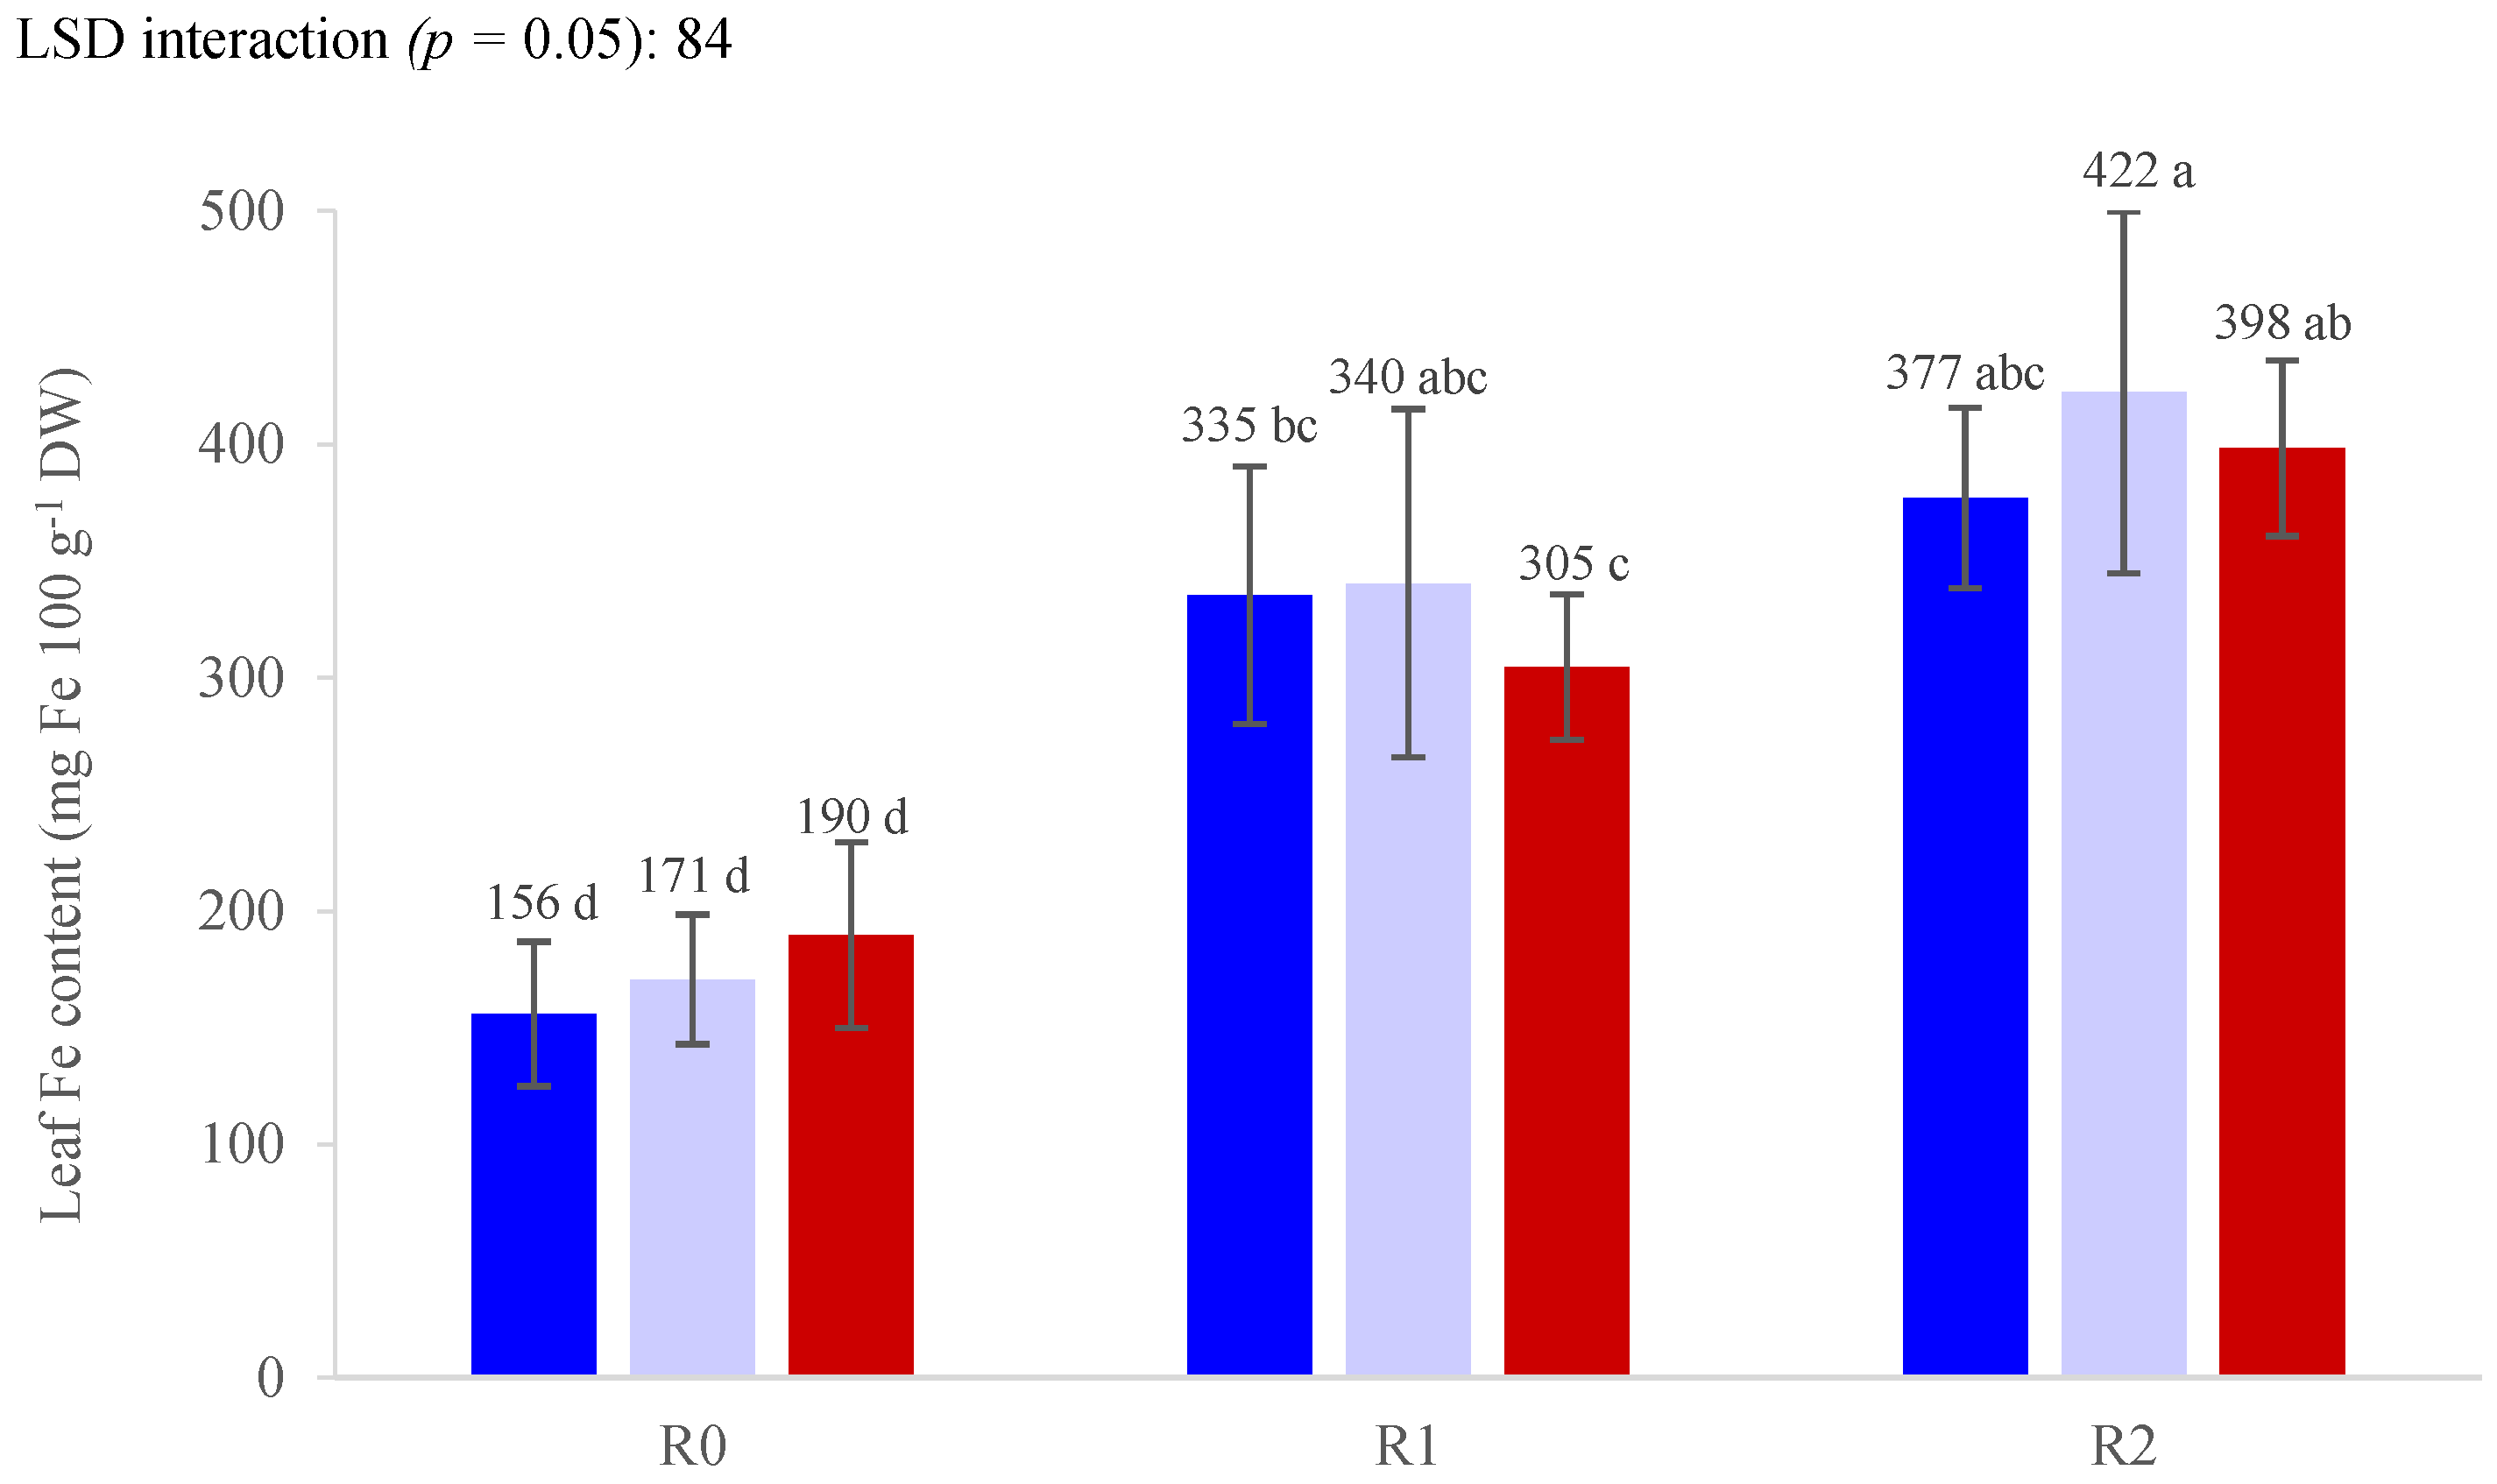
3.3. Nutrient Concentrations

The Fe content in fruits from the 1st and 2nd clusters treated with Fe in the nutrient solution showed a significant increase when compared to the controls. In this sense, the Fe content increased proportionally with the increase in the Fe concentration in the nutrient solution, being higher at R2 (Figure 2). As for the leaf spraying treatment, L500 plants showed significant increases in the Fe content of their fruits. In addition, the Fe content of both clusters showed a significant “nutrient solution × leaf spray” interaction. As shown in Figure 2, the R2–L500 plants showed the highest Fe increase (+163%) in cluster 1, when compared to the control plants (Figure 2A). This effect was confirmed by the results obtained from the 2nd cluster, where the highest Fe increase was also produced by the R2–L500 plants (+190%) (Figure 2B).
With regard to the other nutrients (Table 4), the Fe supplementation through the nutrient solution increased the amounts of K and Na in fruits (by 22 and 35%, on average for R1 and R2, respectively) when compared to the control. Moreover, an increase in the Mg content was noticed in R2 plants (+17%). As for the foliar treatments, fruits from L250 plants showed a decrease in the concentration of Mg (−15%) when compared to the L0 and L500 plants.
In addition, as shown in Table 5, the amount of Zn in the fruits of cherry tomato plants increased (+11.3%) with the addition of Fe to the nutrient solution (R2), but decreased after the leaf spray application (L500).
As can be observed in Figure 3, the leaves of the cherry tomato plants showed a significant and proportional increase in Fe accumulation according to the concentration of Fe applied. When compared to controls, R2 plants showed the highest Fe concentrations (+132%).

4. Discussion

Cherry tomato plants receiving 2 mmol Fe L−1 through the nutrient solution showed a reduction in the average fruit weight and an increase in fruit dry matter. These phenomena were probably due to the stress conditions created by high Fe concentrations and have been observed in other crops, such as lettuce and common chicory [31,32]. At the same time, in a study carried out with rice plants, 0, 2, and 4 mmol L−1 of Fe were added to the nutrient solution, and the 2 mmol L−1 dose produced the maximum fresh and dry weights, while 4 mmol L–1 showed a significant reduction in both fresh and dry weights [33]. This reduction in the average fresh weight when plants were submitted to high concentrations of Fe could indicate excessive amounts of Fe that, in turn, can increase ROS generation, causing cell damage and affecting many biochemical reactions, including reducing the rate of photosynthesis [34]. On the other hand, the increase in the dry matter content of cherry tomato fruits obtained in our study can be interpreted as a positive outcome when fruits’ postharvest behavior is concerned, as a higher dry matter content at harvest helps increase tolerance to possible mechanical damage during postharvest operations [16,35].
At the same time, titratable acidity and soluble solids content increased in tomatoes biofortified with Fe via the roots, while SS/TA was not affected (data not shown). This suggests that the higher concentrations of Fe in the nutrient solution improved the metabolism of sugars and organic acids, promoting their accumulation in fruits, but without altering the typical balance of the given cultivar [25]. This demonstrates that a tailored biofortification approach can also contribute to the production of highly palatable vegetables [10].
The present biofortification study showed that the increase in the concentration of Fe provided to the plants through the nutrient solution resulted in Fe being absorbed by the roots and translocated to the fruits. Similarly, an Fe biofortification experiment conducted with lettuce showed that a nutrient solution enriched with 1 or 2 mmol L−1 Fe, in the form of Fe-EDDHA, increased the Fe content in the leaves of red and green lettuce, in the range of 41–86% [31]. Moreover, Fe’s absorption and translocation through the roots in tomato plants has already been demonstrated in a study conducted by Brown and Ambler [36], who noted how the combined action of protoxylem and metaxylem was able to transport Fe from the lateral roots to the primary ones, before being transported from the roots into the stem exudate, mainly as Fe citrate. This is possible thanks to the reduction of Fe3+ to Fe2+ in the lateral roots, making more Fe available to be transported inside the roots, where it can be chelated into Fe citrate and transported to the top of the plant. At the same time, foliar applications of Fe (250 and 500 μmol L−1) showed that cherry tomato plants can absorb Fe through the leaves and translocate it to the fruits. This result is consistent with the absorption and translocation pattern of Fe observed by Zhang et al. [37] after submitting tomato plants to different photoperiods (12 h/12 h and 16 h/8 h) and concentrations of Fe-EDTA (100, 150, and 200 μmol L−1) applied through foliar spray. They obtained fruits with 11 and 25% greater Fe concentrations for the 12 h/12 h and 16 h/8 h photoperiods, respectively, when the 200 μmol L−1 dose was applied, compared to the untreated plants. The same floematic movement was anatomically demonstrated when tomato plants grown using hydroponics received three applications of 3 mmol L−1 Fe solution (as FeSO4), where the Fe applied to the leaves was translocated to other parts of the plants [1]. Finally, the combination of both foliar sprays and nutrient solution enriched with Fe at the higher doses (500 μmol L−1 and 2 mmol L−1, respectively) provided the greatest increase in Fe content in cherry tomato fruits. The consistency of the mineral accumulation in tomato fruits subjected to this treatment (R2 L500) can also be confirmed by comparing the first and second clusters, which followed a similar enrichment pattern (Figure 1). This indicates that in order to achieve a better biofortification efficacy in all clusters, Fe should be supplied simultaneously through the nutrient solution and as a foliar spray. In addition, the principle of double biofortification efficacy was also demonstrated by Smoleń et al. [38] when producing Se-biofortified lettuce after the application of the mineral to the roots and leaves of the crop.
The increase we observed in the accumulation of Fe in the leaves of cherry tomato plants (+90 and +132% at R1 and R2, respectively) is consistent with the findings of another study where tomato plants grown in greenhouse received a nutrient solution with 5 mmol of Fe (as Fe-EDTA), and the Fe-enriched nutrient solution caused a 66% increase in the Fe concentration in tomato shoots [39].
Plant ionomics indicated that high Fe concentrations in the nutrient solution (2 mmol L−1) synergistically affected the contents of Mg, K, Na, and Zn in cherry tomato fruits. A similar result was observed by Olowolaju et al. [40] when subjecting tomato plants to a nutrient solution 10 times stronger than the standard one (0.053 vs. 0.53 g L−1). They observed that the translocation factor of K, P, Na, Ca, and Mg, along with the bioaccumulation factor of Mg, K, and Na, was higher in the treated plants that received 10 times more Fe. This could have been caused by the increase in the expression of certain proteins responsible for increasing the uptake of Fe, which also causes synergistic increases in the concentrations of other mineral elements, such as Zn, Mn, and Co [41]. This demonstrates that Fe biofortification can not only improve the concentration of the target mineral (Fe), but also increase the concentrations of other elements in the fruits. A better understanding of these synergistic factors could help to improve cherry tomato ionomics and contribute to enhancing the efficiency of biofortification programs.

5. Conclusions

Since Fe deficiency is among the most relevant types of micronutrient deficiency in both developing and affluent nations, and consumers demand products rich in compounds that can improve health, our study demonstrates that supplementing cherry tomato plants with 2 mmol L−1 Fe through the nutrient solution and 500 µmol L−1 Fe through foliar spraying can significantly increase the concentration of this mineral in the edible part of the plant (+190%). The application of this mineral also increased the titratable acidity and total soluble solids, potentially improving the taste perception by the consumer. The average fresh weight decreased but, in return, a significant increase in the dry matter content was noticed, which is a desirable postharvest characteristic. Our results demonstrate that even though more studies are required in order to define an optimal concentration of Fe supplementation to cherry tomatoes, Fe biofortification is facilitated in soilless systems by combining both root and foliar applications, and this strategy could be considered effective to fight malnutrition caused by unbalanced diets, in addition to improving tomato quality.

Author Contributions

Conceptualization, F.G., C.L. and R.P.M.; methodology, F.G. and R.P.M.; software, C.C. and F.B.; validation, F.G. and C.L.; formal analysis, C.V.B., C.C., and F.B.; investigation, C.V.B., C.C., F.B., S.R.M.C. and R.P.M.; data curation, C.V.B. and R.P.M.; writing—original draft preparation, C.V.B. and R.P.M.; writing—review and editing, F.G. and C.L.; supervision, F.G., C.L. and S.R.M.C.; project administration, F.G., C.L. and R.P.M.; funding acquisition, F.G. and C.L. All authors have read and agreed to the published version of the manuscript.

Funding

This research was funded by the “SFIDA” project (Sviluppo di un Fertirrigatore Intelligente per proDuzioni Agricole biofortificate), Ministry of Economic Development, prot. n. 0002356.

Data Availability Statement

Not applicable.

Conflicts of Interest

The authors declare no conflict of interest.

References

  1. Carrasco-Gil, S.; Rios, J.J.; Álvarez-Fernández, A.; Abadía, A.; García-Mina, J.M.; Abadía, J. Effects of individual and combined metal foliar fertilisers on iron- and manganese-deficient Solanum lycopersicum plants. Plant Soil 2016, 402, 27–45. [Google Scholar] [CrossRef]
  2. McLean, E.; Cogswell, M.; Egli, I.; Wojdyla, D.; De Benoist, B. Worldwide prevalence of anaemia, WHO Vitamin and Mineral Nutrition Information System, 1993–2005. Public Health Nutr. 2009, 12, 444–454. [Google Scholar] [CrossRef] [PubMed]
  3. Abbaspour, N.; Hurrell, R.; Kelishadi, R. Review on iron and its importance for human health. J. Res. Med. Sci. 2014, 19, 164. [Google Scholar] [PubMed]
  4. Trumbo, P.; Yates, A.A.; Schlicker, S.; Poos, M. Dietary reference intakes: Vitamin A, vitamin K, arsenic, boron, chromium, copper, iodine, iron, manganese, molybdenum, nickel, silicon, vanadium and zinc. J. Am. Diet. Assoc. 2001, 101, 294–301. [Google Scholar] [CrossRef]
  5. Cappellini, M.D.; Musallam, K.M.; Taher, A.T. Iron deficiency anaemia revisited. J. Intern. Med. 2020, 287, 153–170. [Google Scholar] [CrossRef]
  6. Tong, S.; Vichinsky, E. Iron deficiency: Implications before anemia. Pediatrics Rev. 2021, 42, 11–20. [Google Scholar] [CrossRef]
  7. White, P.J.; Broadley, M.R. Biofortification of crops with seven mineral elements often lacking in in human diets—Iron, zinc, copper, calcium, magnesium, selenium and iodine. New Phytol. 2009, 182, 49–84. [Google Scholar] [CrossRef]
  8. Hiel, S.; Bindels, L.B.; Pachikian, B.D.; Kalala, G.; Broers, V.; Zamariola, G.; Chang, B.P.I.; Kambashi, B.; Rodriguez, J.; Cani, P.D.; et al. Effects of a diet based on inulin-rich vegetables on gut health and nutritional behavior in healthy humans. Am. J. Clin. Nutr. 2019, 109, 1683–1695. [Google Scholar] [CrossRef]
  9. Distefano, M.; Steingass, C.B.; Leonardi, C.; Giuffrida, F.; Schweiggert, R.; Mauro, R.P. Effects of a plant-derived biostimulant application on quality and functional traits of greenhouse cherry tomato cultivars. Food Res. Int. 2022, 157, 111218. [Google Scholar] [CrossRef]
  10. Rouphael, Y.; Kyriacou, M.C. Enhancing quality of fresh vegetables through salinity eustress and biofortification applications facilitated by soilless cultivation. Front. Plant Sci. 2018, 9, 1254. [Google Scholar] [CrossRef]
  11. Gruda, N. Impact of environmental factors on product quality of greenhouse vegetables for fresh consumption. Crit. Rev. Plant Sci. 2005, 24, 227–247. [Google Scholar] [CrossRef]
  12. Rouphael, Y.; Kyriacou, M.C.; Petropoulos, S.A.; De Pascale, S.; Colla, G. Improving vegetable quality in controlled environments. Sci. Hortic. 2018, 234, 275–289. [Google Scholar] [CrossRef]
  13. Buturi, C.V.; Mauro, R.P.; Fogliano, V.; Leonardi, C.; Giuffrida, F. Mineral biofortification of vegetables as a tool to improve human diet. Foods 2021, 10, 223. [Google Scholar] [CrossRef] [PubMed]
  14. Buturi, C.V.; Sabatino, L.; Mauro, R.P.; Navarro-León, E.; Blasco, B.; Leonardi, C.; Giuffrida, F. Iron Biofortification of Greenhouse Soilless Lettuce: An Effective Agronomic Tool to Improve the Dietary Mineral Intake. Agronomy 2022, 12, 1793. [Google Scholar] [CrossRef]
  15. Mauro, R.P.; Lo Monaco, A.; Lombardo, S.; Restuccia, A.; Mauromicale, G. Eradication of Orobanche/Phelipanche spp. seedbank by soil solarization and organic supplementation. Sci. Hortic. 2015, 193, 62–68. [Google Scholar] [CrossRef]
  16. Distefano, M.; Mauro, R.P.; Page, D.; Giuffrida, F.; Bertin, N.; Leonardi, C. Aroma Volatiles in Tomato Fruits: The Role of Genetic, Preharvest and Postharvest Factors. Agronomy 2022, 12, 376. [Google Scholar] [CrossRef]
  17. Sellitto, V.M.; Golubkina, N.A.; Pietrantonio, L.; Cozzolino, E.; Cuciniello, A.; Cenvinzo, V.; Florin, I.; Caruso, G. Tomato yield, quality, mineral composition and antioxidants as affected by beneficial microorganisms under soil salinity induced by balanced nutrient solutions. Agriculture 2019, 9, 110. [Google Scholar] [CrossRef]
  18. Marschner, P. Marschner’s Mineral Nutrition of Higher Plants, 3rd ed.; Academic Press: Cambridge, MA, USA, 2011; ISBN 9780123849052. [Google Scholar]
  19. Rai, S.; Singh, P.K.; Mankotia, S.; Swain, J.; Satbhai, S.B. Iron homeostasis in plants and its crosstalk with copper, zinc, and manganese. Plant Stress 2021, 1, 100008. [Google Scholar] [CrossRef]
  20. Li, G.; Kronzucker, H.J.; Shi, W. Root developmental adaptation to Fe toxicity: Mechanisms and management. Plant Signal. Behav. 2016, 11, e1117722. [Google Scholar] [CrossRef]
  21. Di Gioia, F.; Petropoulos, S.A.; Ozores-Hampton, M.; Morgan, K.; Rosskopf, E.N. Zinc and iron agronomic biofortification of Brassicaceae microgreens. Agronomy 2019, 9, 677. [Google Scholar] [CrossRef] [Green Version]
  22. Kromann, P.; Valverde, F.; Alvarado, S.; Vélez, R.; Pisuña, J.; Potosí, B.; Taipe, A.; Caballero, D.; Cabezas, A.; Devaux, A. Can Andean potatoes be agronomically biofortified with iron and zinc fertilizers? Plant Soil 2017, 411, 121–138. [Google Scholar] [CrossRef]
  23. Mauro, R.P.; Agnello, M.; Distefano, M.; Sabatino, L.; Primo, A.S.B.; Leonardi, C.; Giuffrida, F. Chlorophyll fluorescence, photosynthesis and growth of tomato plants as affected by long-term oxygen root zone deprivation and grafting. Agronomy 2020, 10, 137. [Google Scholar] [CrossRef]
  24. Giuffrida, F.; Agnello, M.; Mauro, R.P.; Ferrante, A.; Leonardi, C. Cultivation under salt stress conditions influences postharvest quality and glucosinolates content of fresh-cut cauliflower. Sci. Hortic. 2018, 236, 166–174. [Google Scholar] [CrossRef]
  25. Distefano, M.; Arena, E.; Mauro, R.P.; Brighina, S.; Leonardi, C.; Fallico, B.; Giuffrida, F. Effects of Genotype, Storage Temperature and Time on Quality and Compositional Traits of Cherry Tomato. Foods 2020, 9, 1729. [Google Scholar] [CrossRef]
  26. McGuire, R.G. Reporting of objective color measurements. HortScience 1992, 27, 1254–1255. [Google Scholar] [CrossRef]
  27. Lichtenthaler, H.K.; Wellburn, A.R. Chlorophyll and Carotenoid Determination. Biochem. Soc. Trans. 1983, 11, 591–592. [Google Scholar] [CrossRef]
  28. Brand-Williams, W.; Cuvelier, M.E.; Berset, C. Use of a free radical method to evaluate antioxidant activity. LWT—Food Sci. Technol. 1995, 28, 25–30. [Google Scholar] [CrossRef]
  29. Benzie, I.F.F.; Strain, J.J. Ferric reducing/antioxidant power assay: Direct measure of total antioxidant activity of biological fluids and modified version for simultaneous measurement of total antioxidant power and ascorbic acid concentration. Methods Enzymol. 1999, 299, 15–27. [Google Scholar] [CrossRef]
  30. AOAC. Official Methods of Analysis, 16th ed.; Association of Official Analytical Chemists: Washington, DC, USA, 1995. [Google Scholar]
  31. Giordano, M.; El-Nakhel, C.; Pannico, A.; Kyriacou, M.C.; Stazi, S.R.; De Pascale, S.; Rouphael, Y. Iron biofortification of red and green pigmented lettuce in closed soilless cultivation impacts crop performance and modulates mineral and bioactive composition. Agronomy 2019, 9, 290. [Google Scholar] [CrossRef]
  32. Cecílio Filho, A.B.; Mendoza Cortez, J.W.; de Sordi, D.; Urrestarazu, M. Common Chicory Performance as Influenced by Iron Concentration in the Nutrient Solution. J. Plant Nutr. 2015, 38, 1489–1494. [Google Scholar] [CrossRef] [Green Version]
  33. De Dorlodot, S.; Lutts, S.; Bertin, P. Effects of ferrous iron toxicity on the growth and mineral composition of an interspecific rice. J. Plant Nutr. 2005, 28, 1–20. [Google Scholar] [CrossRef]
  34. Nagajyoti, P.C.; Lee, K.D.; Sreekanth, T.V.M. Heavy metals, occurrence and toxicity for plants: A review. Environ. Chem. Lett. 2010, 8, 199–216. [Google Scholar] [CrossRef]
  35. Valverde-Miranda, D.; Díaz-Pérez, M.; Gómez-Galán, M.; Callejón-Ferre, Á.J. Total soluble solids and dry matter of cucumber as indicators of shelf life. Postharvest Biol. Technol. 2021, 180, 111603. [Google Scholar] [CrossRef]
  36. Brown, J.C.; Ambler, J.E. Iron-Stress Response in Tomato (Lycopersicon esculentum) 1. Sites of Fe Reduction, Absorption and Transport. Physiol. Plant. 1974, 31, 221–224. [Google Scholar] [CrossRef]
  37. Zhang, Y.; Liang, Y.; Han, J.; Hu, X.; Li, X.; Zhao, H.; Bai, L.; Shi, Y.; Golam, J.A. Interactive Effects of Iron and Photoperiods on Tomato Plant Growth and Fruit Quality. J. Plant Growth Regul. 2022, 14, 1–14. [Google Scholar] [CrossRef]
  38. Smoleń, S.; Kowalska, I.; Sady, W. Assessment of biofortification with iodine and selenium of lettuce cultivated in the NFT hydroponic system. Sci. Hortic. 2014, 166, 9–16. [Google Scholar] [CrossRef]
  39. Das, U.; Rahman, M.M.; Roy, Z.R.; Rahman, M.M.; Kabir, A.H. Morpho-physiological retardations due to iron toxicity involve redox imbalance rather than photosynthetic damages in tomato. Plant Physiol. Biochem. 2020, 156, 55–63. [Google Scholar] [CrossRef]
  40. Olowolaju, E.D.; Okunlola, G.O.; Ayeotan, O.J. Growth, yield and uptake of some nutrients by tomato as affected by iron concentration. Int. J. Veg. Sci. 2021, 27, 378–387. [Google Scholar] [CrossRef]
  41. Morrissey, J.; Guerinot, M. Lou Iron uptake and transport in plants: The good, the bad, and the ionome. Chem. Rev. 2009, 109, 4553–4567. [Google Scholar] [CrossRef] [Green Version]
Figure 1. Different phases of the crop cycle during the experiments: (A) plant 7 days after transplanting; (B) flowering of the 1st cluster; (C) 1st cluster almost ready for harvest; (D) leaf showing dark spots ~72 days after transplanting.
Horticulturae 08 00858 g001
Figure 2. Iron content of cherry tomato fruits belonging to the (A) 1st and (B) 2nd clusters, as affected by the application of Fe. Blue bars: L0; lilac bars: L250; red bars: L500. Different letters indicate significance according to Fisher’s protected LSD test (p = 0.05). Error bars indicate the standard deviation.
Horticulturae 08 00858 g002
Figure 3. Iron content of cherry tomato leaves as affected by the application of Fe. Blue bars: L0; lilac bars: L250; red bars: L500. Different letters indicate significance according to Fisher’s protected LSD test (p = 0.05). Error bars indicate the standard deviation.
Horticulturae 08 00858 g003
Table 1. Effects of Fe application on the yield and carpometric parameters of cherry tomato fruits.
Yield
(g Plant−1)
Average Fruit Weight (g)Dry Matter Content (%)Soluble Solids (Brix°)Titratable Acidity (g L−1)Firmness (N)
Fe Nutrient Solution
R01067 ± 41 a14.8 ± 1.0 a9.69 ± 0.6 b8.56 ± 0.4 b6.35 ± 0.5 b8.87 ± 0.7 b
R1981 ± 86 b13.2 ± 1.1 b10.24 ± 0.5 ab9.22 ± 0.6 a6.78 ± 0.6 b9.37 ± 0.5 ab
R2932 ± 65 b12.6 ± 1.1 b10.69 ± 0.9 a9.57 ± 0.9 a7.65 ± 0.9 a9.70 ± 0.5 a
F-test***********
Fe Leaf Spray
L0958 ± 7913.2 ± 1.210.35 ± 0.69.30 ± 0.67.01 ± 0.99.22 ± 0.7
L250999 ± 10013.3 ± 1.810.32 ± 1.09.27 ± 1.07.10 ± 1.09.28 ± 0.7
L5001024 ± 7214.1 ± 1.09.95 ± 0.68.78 ± 0.46.67 ± 0.79.45 ± 0.7
F-testNSNSNSNSNSNS
InteractionNSNSNSNSNSNS
Different letters indicate significance according to Fisher’s protected LSD test (p = 0.05); *, **, and ***: significance of p ≤ 0.05, 0.01, and 0.001, respectively. NS: not significant; ± indicates the standard deviation.
Table 2. Effects of Fe application on the chromatic coordinates of cherry tomato fruits.
L *a *b *(a */b *)2Chroma
Fe Nutrient Solution
R042.14 ± 0.8 a17.52 ± 1.224.71 ± 0.60.49 ± 0.130.30 ± 1.0
R141.87 ± 0.9 ab16.89 ± 1.424.37 ± 0.60.50 ± 0.129.67 ± 0.8
R241.30 ± 0.5 b17.43 ± 1.523.84 ± 0.90.54 ± 0.129.56 ± 1.2
F-test*NSNSNSNS
Fe Leaf Spray
L042.01 ± 0.317.67 ± 1.124.46 ± 0.90.54 ± 0.130.01 ± 1.1
L25041.88 ± 0.217.24 ± 1.624.24 ± 0.30.50 ± 0.129.95 ± 0.8
L50041.43 ± 0.316.93 ± 1.524.22 ± 1.00.49 ± 0.129.57 ± 1.2
F-testNSNSNSNSNS
InteractionNSNSNSNSNS
Different letters indicate significance according to Fisher’s protected LSD test (p = 0.05); *: significance of p ≤ 0.05. NS: not significant; ± indicates the standard deviation.
Table 3. Effects of Fe application on the biochemical traits of cherry tomato fruits.
TPCFRAPDPPHTotal Carotenoids
(GA μmol 100 g−1 FW)(TE μmol 100 g−1 FW)(TE μmol 100 g−1 FW)(μg 100 g−1 FW)
Fe Nutrient Solution
R0670 ± 58247 ± 18266 ± 171534 ± 174
R1665 ± 70235 ± 19251 ± 241686 ± 160
R2673 ± 36232 ± 19246 ± 241587 ± 109
F-testNSNSNSNS
Fe Leaf Spray
L0670 ± 36233 ± 16256 ± 201576 ± 111
L250653 ± 61243 ± 16259 ± 241604 ± 189
L500684 ± 63238 ± 25248 ± 251628 ± 178
F-testNSNSNSNS
InteractionNSNSNSNS
NS: not significant; ± indicates the standard deviation.
Table 4. Effects of Fe application on the macronutrient composition (mg 100 g−1 FW) of fruits from the 2nd cluster of cherry tomato plants.
NPKMgCaNa
Fe Nutrient Solution
R0181 ± 3.947.8 ± 3.9272 ± 44 b16.0 ± 2.6 b5.2 ± 0.79.6 ± 1.8 b
R1183 ± 5.846.6 ± 6.3323 ± 52 a15.8 ± 2.2 b5.3 ± 0.512.4 ± 2.4 a
R2191 ± 11.848.7 ± 6.6342 ± 73 a18.8 ± 1.9 a4.9 ± 0.413.6 ± 4.4 a
F-testNSNS***NS*
Fe Leaf Spray
L0186 ± 7.650.5 ± 6.3326 ± 7617.8 ± 2.3 a5.1 ± 0.513.1 ± 3.9
L250188 ± 11.847.2 ± 5.0309 ± 7115.1 ± 2.5 b4.9 ± 0.411.7 ± 3.6
L500181 ± 4.345.4 ± 4.5301 ± 4217.7 ± 2.2 a5.5 ± 0.610.8 ± 2.7
F-testNSNSNS**NSNS
InteractionNSNSNSNSNSNS
Different letters indicate significance according to Fisher’s protected LSD test (p = 0.05); * and **: significance of p ≤ 0.05 and 0.01, respectively. NS: not significant; ± indicates the standard deviation.
Table 5. Effects of Fe application on the micronutrient composition (μg 100 g−1 FW) of fruits from the 2nd cluster of cherry tomato plants.
ZnMnCu
Fe Nutrient Solution
R0239 ± 13 b70.8 ± 12120 ± 30
R1237 ± 12 b75.5 ± 10130 ± 30
R2266 ± 31 a70.8 ± 6128 ± 23
F-test**NSNS
Fe Leaf Spray
L0259 ± 27 a73.4 ± 9133 ± 23
L250250 ± 25 a71.3 ± 9129 ± 27
L500233 ± 8 b72.3 ± 12117 ± 31
F-test**NSNS
InteractionNSNSNS
Different letters indicate significance according to Fisher’s protected LSD test (p = 0.05); **: significance of p ≤ 0.01. NS: not significant; ± indicates the standard deviation.
Publisher’s Note: MDPI stays neutral with regard to jurisdictional claims in published maps and institutional affiliations.

