Article

Changes in Metal Distribution, Vegetative Growth, Reactive Oxygen and Nutrient Absorption of Tagetes patula under Soil Cadmium Stress

1
College of Forestry, Sichuan Agricultural University, Chengdu 611130, China
2
Forestry Key Laboratory, Liangshan State Institute of Forestry Science, Xichang 615000, China
3
College of Crops Research, Agricultural Research Institute of Sichuan, Xichang 615000, China
4
School of Agricultural Science, Xichang University, Xichang 615000, China
5
Science and Technology Promotion Station, Forestry Bureau of Leibo County, Leibo 616550, China
*
Author to whom correspondence should be addressed.
Horticulturae 2022, 8(1), 69; https://doi.org/10.3390/horticulturae8010069
Submission received: 1 June 2021 / Revised: 7 January 2022 / Accepted: 10 January 2022 / Published: 12 January 2022
(This article belongs to the Special Issue Phytotoxicity of Heavy Metals in Horticultural Plants and Security)

Abstract

:
Phytoremediation with hyperaccumulator plants has been recognized as a potential way for the clearing of cadmium (Cd)-contaminated soil. In this study, hyperaccumulator Tagetes patula was treated with seven concentrations of Cd, ranging from 0 to 300 mg kg−1. The Cd enrichment and nutrient contents in different organs during different growth phases were investigated. Under Cd concentrations ≤75 mg kg-1, the morphological growth of T. patula did not change significantly regardless of growth stage. However, when Cd concentration exceeded 150 mg kg−1, the morphological growth was remarkedly inhibited. The root/shoot ratio remained unchanged except for at 300 mg kg−1. In addition, Cd negatively influenced the flowering process at the concentration of 300 mg kg−1. Cd content increased significantly in Cd-treated plants. Nitrogen absorption was increased under Cd treatments, and phosphorus content was also increased under concentration ≤150 mg·kg−1. However, the potassium content in the flower was decreased under 300 mg kg−1. Furthermore, the contents of H2O2, O2− and malondialdehyde were increased during the seedling phase, especially when Cd concentration was ≥150 mg kg−1. In summary, T. patula showed a strong ability to tolerate Cd, and such ability might be explained by nutrient absorption and reactive oxygen clearness.

1. Introduction

Cadmium (Cd), as one of the toxic heavy metals, has posed a great threat to human health via its uptake, transfer and accumulation in crops. The annual discharge load of Cd around the world was about 1.0 × 10⁶ t [1]. According to the Chinese Contaminated Soil Report released in 2014, Cd was also the main heavy metal element in the contaminated soil in China, and the over-standard rate of heavy metal in the soil around China was 16.1%, which resulted in the annual contamination of 1200 tons of grains and an estimated annual financial loss of USD 20 billion. The rice cultivated areas in the Northeast Plain of China, the Yangtze River Basin and the southeast coastal region were 5.16 × 10⁶ ha, 1.89 × 10⁷ ha and 4.96 × 10⁶ ha, respectively [2,3]. Additionally, the corresponding rice yields were 3.76 × 10⁷ t, 1.36 × 10⁸ t and 3.04 × 10⁷ t, respectively. Liangshan region located in Southwest Sichuan Province, China, is abundant in mineral resources. However, with the rapid development in mining and metallurgy industries in this region, a mass of industrial residues were disposed of into the soils, resulting in severe pollution in the environment [4]. In 34% of the 109 monitoring stations, the Cd content in the soil has largely exceeded the standard rate, which gave rise to high ecological risk of these points [5]. Therefore, a proper approach to the remediation of the Cd-contaminated soil in the aforementioned regions is in urgent need.
Phytoremediation is an approach of using metal-accumulating plants to extract hazardous metals from contaminated soils. Compared to the physical and chemical remediation methods, phytoremediation has been recognized as a potential way for large-scale practice because it is environmentally friendly and cost-effective [6,7,8]. However, a number of plants cannot grow normally in a heavy-metal-contaminated environment, and the seeking of a certain plant species that has strong heavy metal resistance is a necessary precondition for the development of phytoremediation. There are about 570 species of plants that are metal hyperaccumulators worldwide, and the number is still increasing as more research findings are updated [9]. To date, 139 plant species of metal hyperaccumulators have been discovered in Sichuan Province; these plant species belong to 48 families and 117 genera. However, only 40 plant species are Cd hyperaccumulators [10]. In recent years, the coordinated development between environment and economy has attracted much more attention in China. Liangshan region is a tourist destination, attracting about 50 million tourists in 2019. Therefore, it is necessary to select a plant species that is a Cd hyperaccumulator and has a certain ornamental value. In this way, it can promote local tourism while remediating Cd-contaminated areas.
Liangshan region has several ornamental plant species such as Schlumlergera truncate K., Dianthus caryophyllus L., Capsicum annuum var., Plumbago auriculata L., Pentas lanceolata K. and French marigold plant (Tagetes patula L.) that are suitable for attracting tourists, and these flowers also have good economic value. However, based on our preliminary research results on heavy metal accumulation for these plants, only T. patula could grow well in Cd-contaminated soil and exhibit a better Cd accumulation capacity. Although several studies have tried to explore the mechanism of hyperaccumulator T. patula in response to soil Cd contamination through the investigation of Cd and nutrient distribution and physiological changes [11,12,13], their results were still limited to illuminating the mechanism of T. patula L. on the Cd accumulation since those studies mostly focused on a certain growth period or organs, or the cadmium concentration used was particularly low (≤100 mg·kg−1). T. patula, as an important ornamental species, has three different growth stages within a growing season: seedling, flowering and fructification stages. In addition, previous studies demonstrated that Cd accumulations are highly differentiated among plant organs [14]. However, studies on Cd accumulation in different growth stages and organs of T. patula are still lacking, which strongly limited the understanding of its mechanism of tolerance to Cd stress. Furthermore, the response of T. patula to excessive Cd, 2–3 times or even higher than the previous Cd pollution, in the environment and its resistance ability were rarely explored, and these factors are especially important when stronger anthropogenic activity and more natural resource mining are expected in the future. Thus, it is necessary to reveal how high Cd concentration influences plant growth and flowering. Therefore, in this study, T. patula plants were exposed to soil Cd treatment with a series of Cd concentrations, and the Cd accumulation and nutrient absorption in different organs (roots, stems, leaves and flowers) of T. patula in three growth stages were determined. The results of this research will help to better understand the underlying mechanism of T. patula in response to soil Cd stress and to provide fundamental information to support the phytoremediation application of T. patula on Cd-contaminated soil.

2. Materials and Methods

2.1. Growth Conditions

The experiment was carried out in a greenhouse at the Experimental Base of Liangshan Forestry Science Research Institute, Xichang City, Liangshan Yi Autonomous Prefecture, Sichuan Province. The geographical location is 102°18′44″ E, 27°53′17″ N, with an altitude of 1536 m. This area belongs to the subtropical plateau monsoon climate zone. The annual average temperature is 17.5 °C, the annual average relative humidity is 61%, the annual average precipitation is about 1100 mm, the number of annual total sunshine hours is about 2560 h, the frost-free period is about 306 days and the greenhouse light transmittance is 80%.

2.2. Plant Material

The plant Tagetes patula L., with orange color, is an annual Asteraceae herb, with upright stems, oblique branches, pinnate leaves, single main stem and branch tips. The seeds were purchased from a local gardening company. The thousand seed weight is 3.0 g. After the seeds germinated, they were planted in seedling trays. When the seedlings had 2 pairs of semitrue leaves, the seedlings were separated. The planting containers were polyethylene plastic pots with a top diameter of 18 cm, bottom diameter of 13 cm and height of 15 cm. The cultivation soil was obtained from local farming land (top 30 cm). The soil was air-dried and finely ground, sieved through a 5 mm grid and then loaded into pots with a quantity of 1.5 kg (dry soil) per pot. The chemical properties are shown in Table 1.

2.3. Experimental Design

This experiment was carried out with a randomized block design. According to previous research reports, the Cd tolerance threshold of marigold is 75–150 mg·kg−1 [15,16,17]. In order to fully explore the response of marigold to different intensities of Cd stress, seven concentrations of Cd solution were set: 7.5, 15, 30, 75, 150, 225 and 300 mg·kg−1, denoted L7.5 to L300. The method for Cd addition was as follows: dissolving the required quantity of CdCl2·2.5H2O was dissolved in 100 mL distilled water, which was evenly watered into the corresponding plastic basin [18]. The seeped solution was rewatered on the surface of the soil until the Cd2+ was evenly mixed with the soil. Plants under control treatment (CK) were treated with the same volume of distilled water.
In January 2019, Cd solutions at different concentrations were applied to soil according to the experimental design. One month (30 days) later, robust marigold seedlings (seedling age 19 days) with the same plant height and stem thickness were transplanted into pots, with 1 plant per pot and 100 repetitions per treatment. Among them, 10 pots of each treatment were randomly selected for the dynamic observation of morphological indicators and flowering process, and the remaining plants were used for the determination of cadmium, active oxygen, malondialdehyde and nutrient content and the collection of seeds. All treated plants were subjected to unified watering, weeding and other conventional management. No fertilizers or pesticides were applied, and the soil solution that leaked during watering was rewatered to the pot.

2.4. Measurement of Morphological Traits

When the seedlings were transplanted, the height and ground diameter were measured with a ruler (accuracy of 0.01 cm) and a vernier caliper (accuracy of 0.01 mm), respectively. Similar measurement was carried out at the end of the experiment (122 days after transplanting) as well. The differences between the two measured values were the increases in plant height and ground diameter. The biomass and root/shoot ratio were measured once during the plant’s vegetative growth period. The plant sample was washed with tap water first and then washed with deionized water several times, and then it was separated into roots, stems and leaves. The samples were dried in an oven at 105 °C for 30 min, followed by 75 °C to dry to constant weight. Electronic balance (precision of 0.01 mg) was used to weigh the aboveground and underground biomass.

2.5. Measurement of Inflorescence and Flowering Dynamics

Since the flowering period of marigold can last up to 70–110 days [19], in order to determine the time of the full-bloom stage and the fruiting stage, according to the blooming dynamics of a pilot experiment, we found that the full-bloom and fruiting stages were 53 and 108 days, respectively, after transplanting (data not shown here) [20,21]. The start of the blooming of marigolds was the time when the orange tongue-shaped petals appeared in the flower buds. The number of inflorescences was counted every 7 days during the blooming period. The newly opened inflorescences of each of the 10 plants per treatment were listed and numbered, and a vernier caliper (accuracy 0.01 cm) was used to continuously measure the diameter changes to obtain the maximum inflorescence diameter (ISmax).
On basis of scatter plots appointing the accumulative flower number as the Y-axis and the growth time as the X-axis, the logistic growth parabola was found optimal to describe the flowering dynamics; precisely, the following mathematic model was applied to marigold: y = a 1 + e x o x b , where a, b and x0 are constants and e is the natural log. Thus, a series of flowering parameters, including the maximum accumulative flower number per plant (AFmax), the day the first flower appeared (Dfirst) and the day the last flower appeared (Dlast), could be obtained directly from the fitted equation or from its first-order derivative.

2.6. Measurement of Cd, Total N, Total P and Total K Content

In the seedling stage (30 days after transplantation), blooming stage (79 days after transplantation) and fruiting stage (122 days after transplantation), 6 plants were randomly collected in each treatment, washed with Na2-EDTA several times to remove ions attached to the surface, then washed with deionized water and dried at 75 °C to constant weight [22]. The whole plant sample was divided into roots, stems and leaves in the seedling stage or roots, stems, leaves and flowers in the blooming and fruiting stages. The dried roots, stems, leaves and flowers of three of the six samples per treatment were ground through a 1 mm sieve. The Cd content was determined in accordance with the National Food Safety Standard GB5009.15-2014 of the People’s Republic of China, using the wet digestion method and an atomic absorption spectrophotometer (AA6800 type, Shimadzu, Chengdu of China). Samples containing high Cd content were diluted before measuring. The melting temperature was 500 °C, the matrix modifier was palladium nitrate, the Cd measurement relative standard deviation (RSD) was 0.67% and the average recovery rate of Cd measured by the standard addition method was 97.43% [23]. The three remaining plant samples (roots, stems, leaves and flowers) were pulverized and ground through a 1 mm sieve. The determination of total N, total P and total K content was completed according to the People’s Republic of China Forestry Standard LY/T 1271-1999, using H2SO4-HClO4 to boil to prepare the test solution. The total N was determined by the indophenol blue colorimetry method, with an average recovery rate of 99.54%; the total P was determined by the molybdenum blue method, with an average recovery rate of 98.05%; the total K was determined by flame photometry in an atomic absorption spectrophotometer (AA6800, Shimadzu, Chengdu of China), with an average recovery rate was 109.49%.

2.7. Measurement of ROS and MDA

In the seedling stage (30 days after transplanting), blooming stage (79 days after transplanting) and fruiting stage (122 days after transplanting), three plants were randomly sampled for each treatment, and the 3rd and 4th leaves from the top fully expanded leaf were collected and washed with deionized water for the determination of O2, H2O2 and MDA content. The measurements of superoxide radicals (O2) followed the method of Chen [24]. Samples were reacted with 1 mL of hydroxylamine hydrochloride for 1 h, then 1 mL of p-aminobenzene sulphonic acid and 1 mL of a-naphthylamine were added, and the solution was kept at 25 °C for 20 min. The mixture was measured under 530 nm using NaNO2 as the standard curve. The H2O2 content was determined as a H2O2 titanium complex resulting from the reaction of tissue H2O2 with titanium tetrachloride following the method of Chen [24]. The H2O2 concentration was measured when monitored at 410 nm using a spectrophotometer. Absorbance values were calibrated with a standard curve generated using known concentrations of H2O2. Malonaldehyde (MDA), as a lipid peroxidation marker, was determined by using the methods of Fang [25]; the MDA concentration was nmol·g−1, and A532, A600 and A450 were absorbance values at 532, 600 and 450 nm, respectively.

2.8. Statistics

The data were analyzed by SPSS 20.0 software (SPSS Inc., Chicago, IL, USA). When performing a one-way analysis of variance of each index among Cd concentrations or among organs, the normality of the data distribution was tested by the Shapiro–Wilk test, and the homogeneity of variance was tested by Levene’s test. The effect of Cd on height, basal diameter, biomass and root/shoot ratio and differences in the content of Cd, N, P and K among different Cd concentrations within the same growth stage and organs were tested with one-way ANOVA, followed by Fisher’s least significant difference (LSD) post hoc multiple comparisons. Generalized linear models (GLMs) using linear distribution and identity link functions were used to analyze the effects of Cd, growth stage, organs and their interaction on Cd distribution and nitrogen (N), phosphorus (P) and potassium (K) content. The effect of Cd stress and growth stage on malonaldehyde (MDA), H2O2 and O2- content was also tested with GLMs, followed by LSD post hoc to test the differences among groups. Significance level was a = 0.05. Microsoft Excel 2007 was used for table design; SigmaPlot 12.0 (Systat Software Inc., California of USA) and Microsoft Excel 2007 were used for figure drawing, and the dynamic curve fitting program was used to fit the flowering process.

3. Results

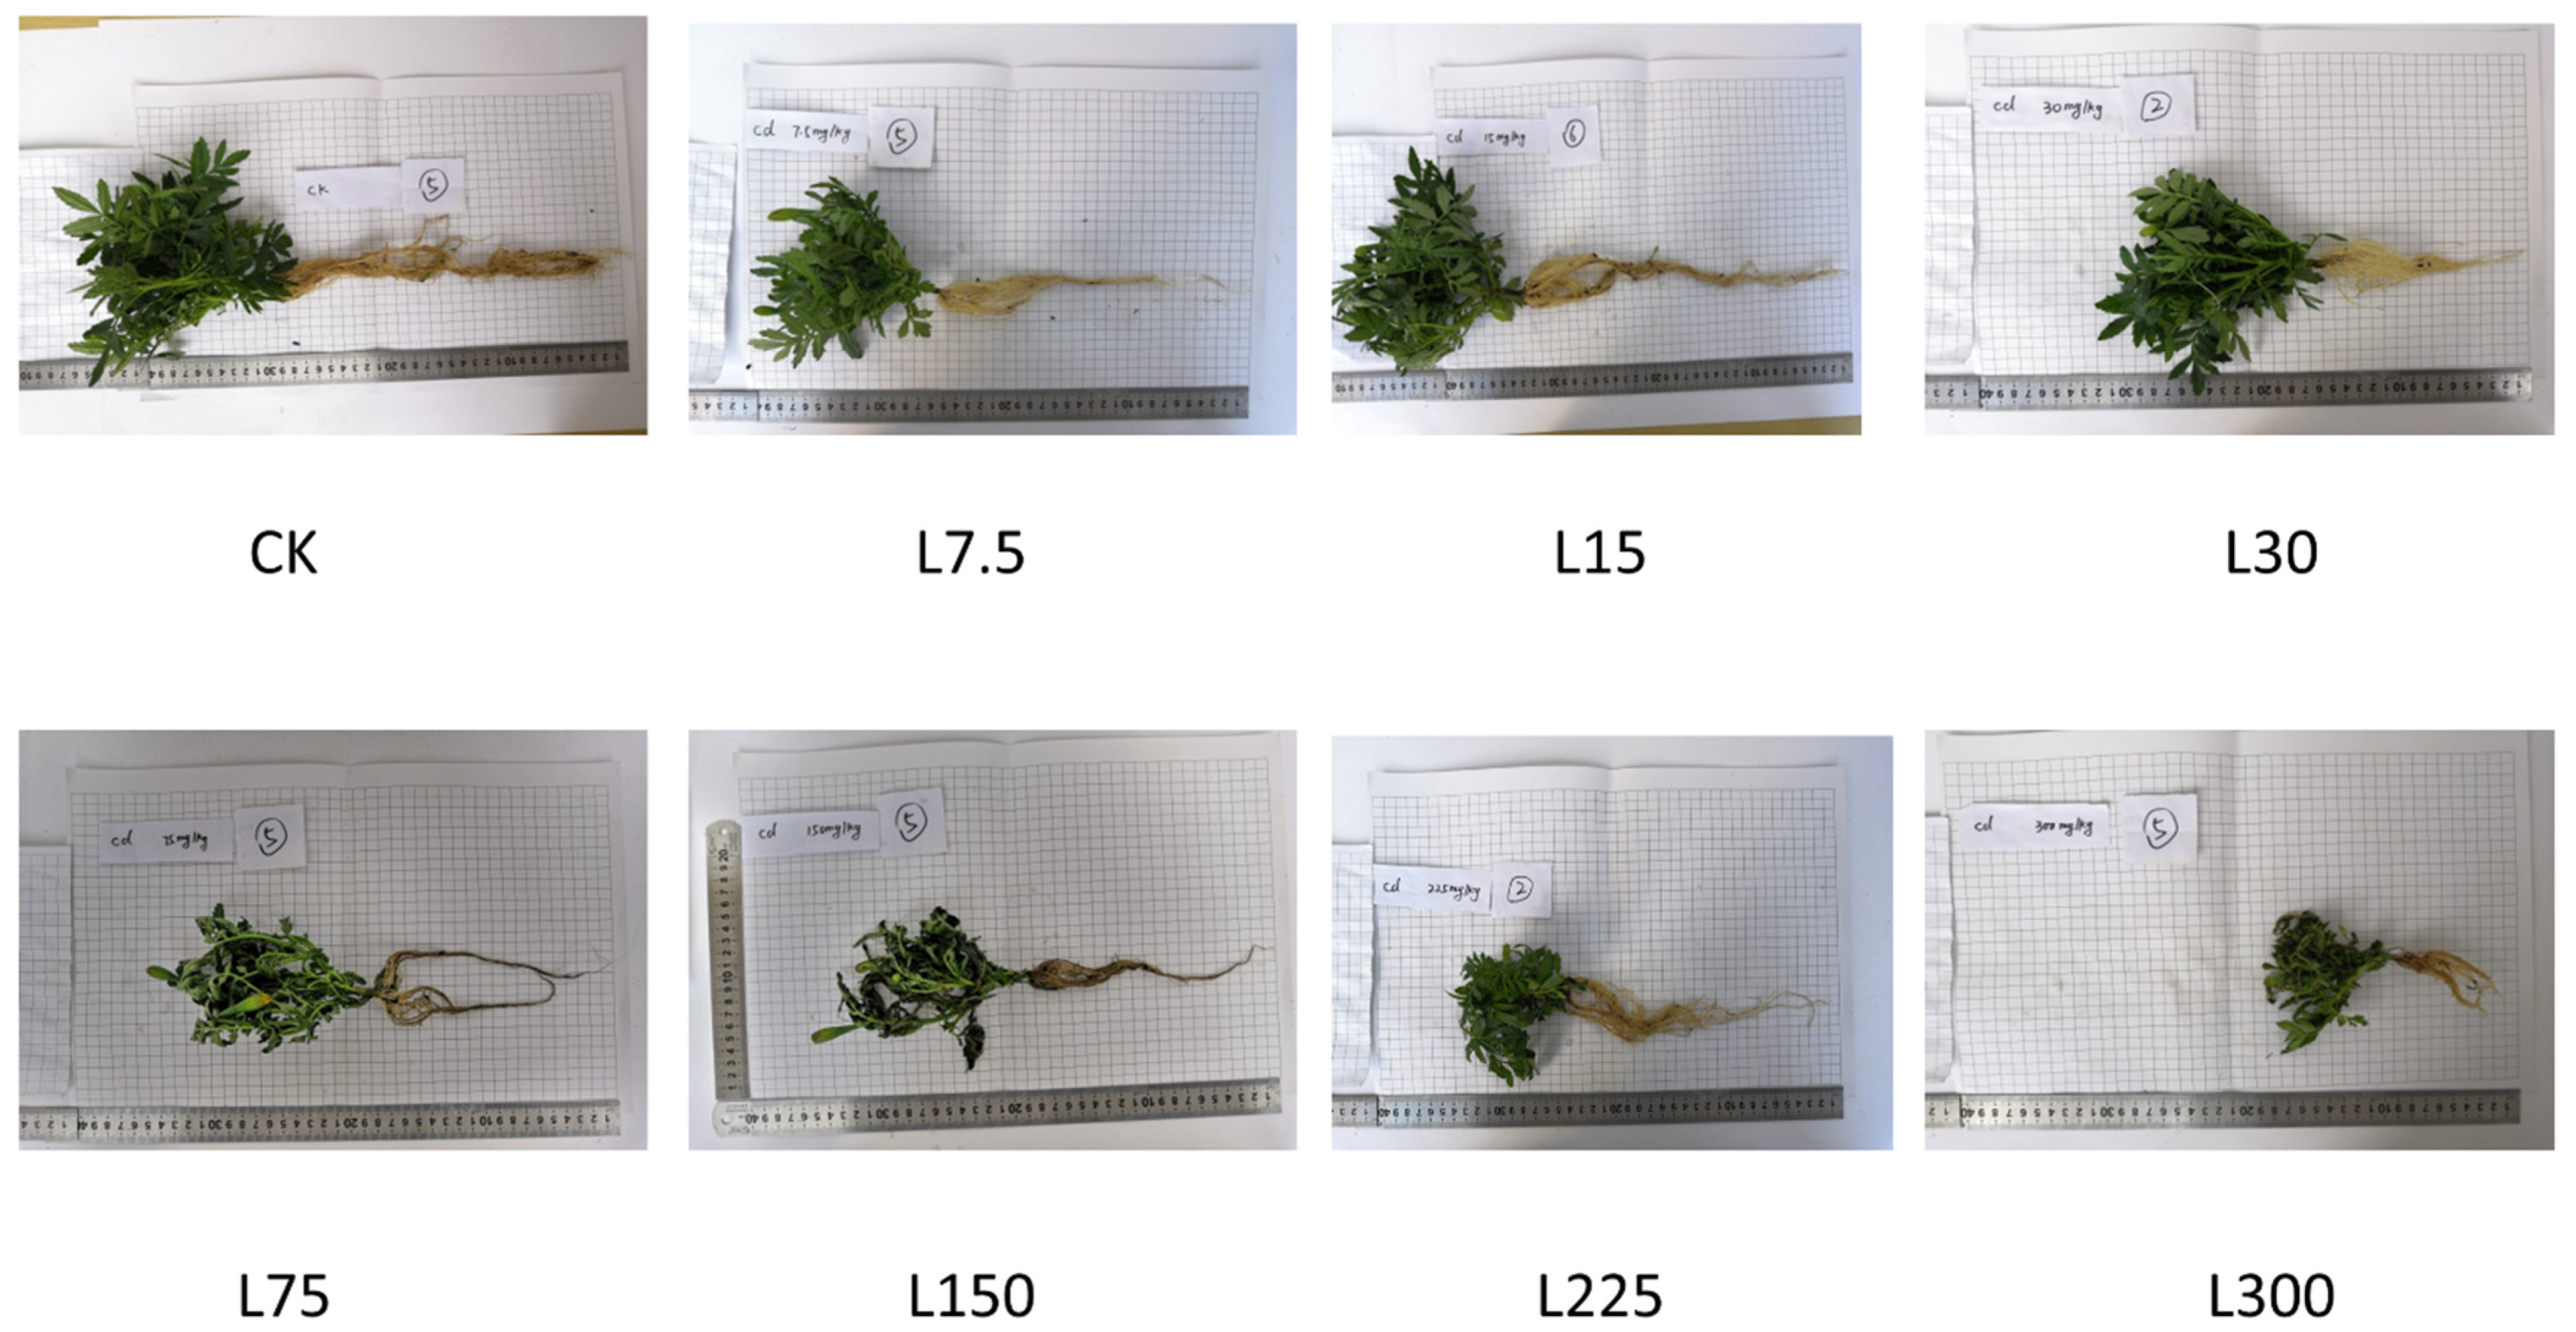
3.1. Effect of Cd Stress on Morphological Traits

Plant growth of T. patula was inhibited by Cd only under high concentrations (≥150 mg·kg−1) in the soil. Basal diameter was significantly reduced by Cd at the concentration of 300 mg·kg−1 (Figure 1 and Figure 2a; one-way ANOVA, p < 0.001) compared to CK, but plant height and root and shoot biomass were markedly decreased when the concentration exceeded 150 mg·kg−1 (Figure 2b–d; one-way ANOVA, p = 0.016 for height, p = 0.012 for root biomass and p = 0.012 for shoot biomass). Root/shoot ratio was not influenced by Cd within the tested concentration ranges (Figure 2e; one-way ANOVA, p = 0.068).

3.2. Effect of Cd Stress on Flowering Traits

T. patula flowering was not significantly influenced by Cd except for treatments L255 and L300. The maximum inflorescence size was significantly reduced at the concentration of 300 mg·kg−1 Cd2+ compared to that of CK (Figure 3a; one-way ANOVA, p < 0.05). The number of bloomed flowers was significantly reduced by Cd during the flowering process (Figure 3b; repeated measurement ANOVA, p < 0.001), with 29% and 79% fewer flowers observed for treatments L225 and L300, respectively, compared to CK.
To further evaluate the effect of Cd stress on the flowering process of T. patula, the flowering dynamic characteristics of T. patula were fit with a mathematic model. As the temporal distribution of bloomed flowers resembled a logistic curve after plotting all the observations, this logistic model was used to fit the bloomed flowers and time for each treatment. It showed that this model generated good fits for all treatments except for L300 (Table 2; logistic regression, p < 0.05 for CK–L225, p = 0.0613 for L300). The fitting results showed that Cd stress did not obviously influence the first flowering date, but Cd stress shortened the flowering period by 0.7–8.4 days compared to that of CK.

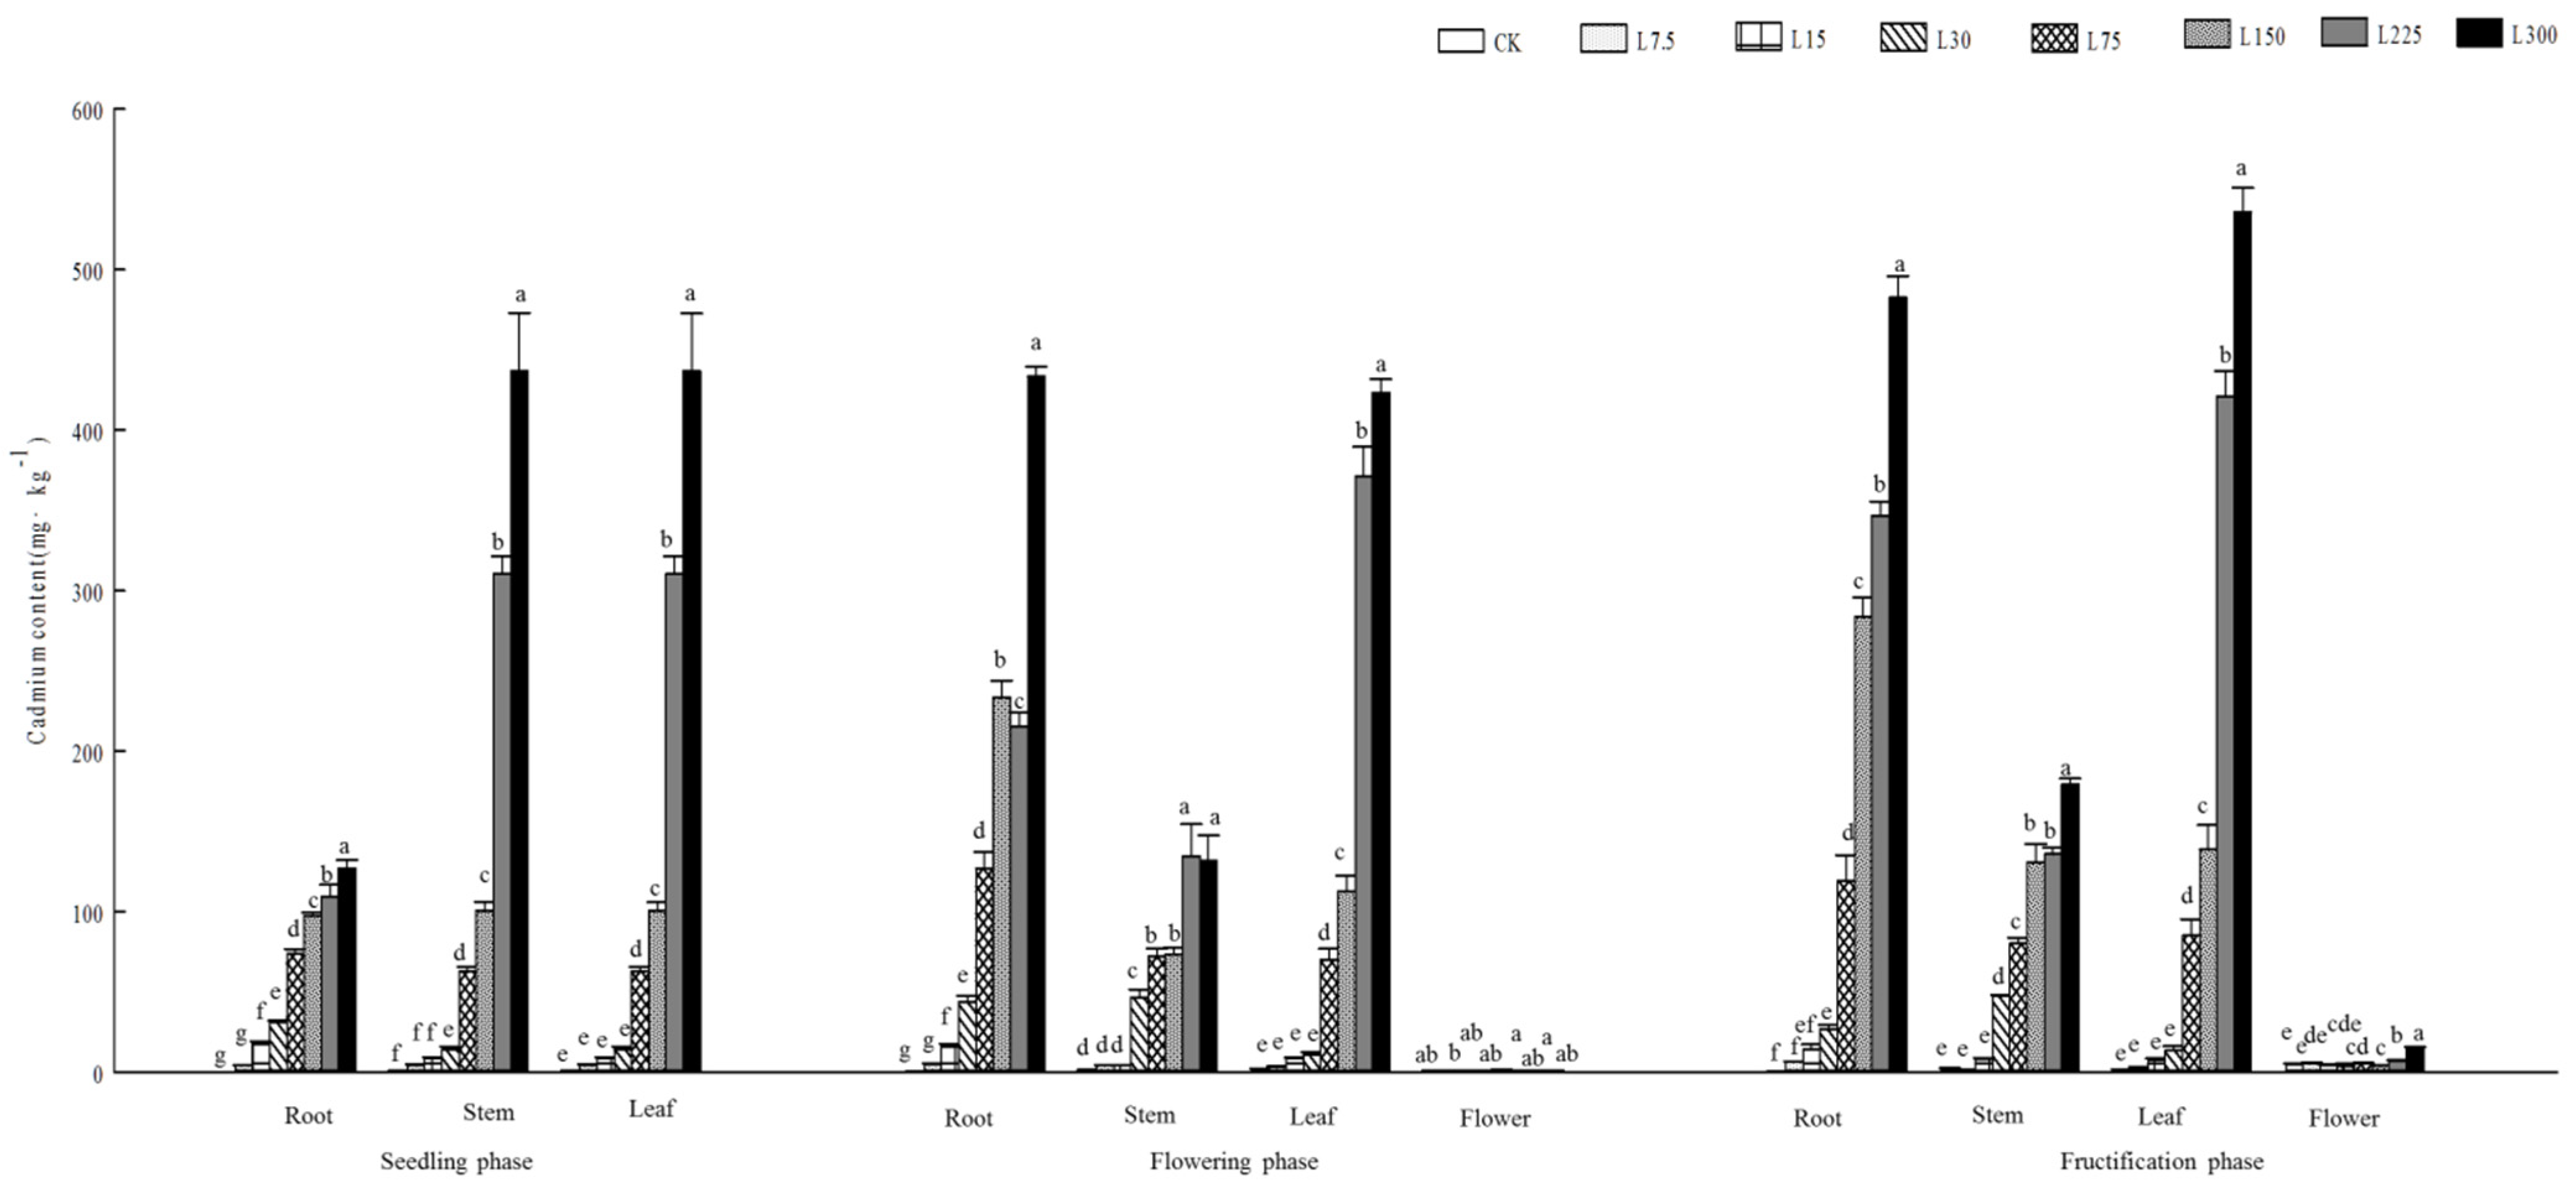
3.3. Cd Distribution with Plant

The Cd content in T. patula was influenced by the concentration of Cd applied, plant growth stage and organs. An overall increase in Cd content was observed with the increase in the concentration of Cd applied (Figure 4; GLMs, p < 0.001 for treatments), regardless of growth stage and organs. Cd contents differed considerably among growth stages (GLMs, p < 0.001 for growth stage), with the following order on average: seedling phase > fructification phase > flowering phase. Similarly, Cd contents varied dramatically among different organs (GLMs, p < 0.001 for organs), with the following order: leaf > root > stem > flower. The Cd contents in flowers were only around 1.84%, 2.05% and 2.57% of those in leaf, root and stem, respectively. The Cd content in organs depended significantly on the growth stage (GLMs, p < 0.001 for the interaction between growth stage and organs). Root contained a relatively lower Cd content than stem did in the seedling phase but contained a relatively higher Cd content in the flowering and fructification phases.

3.4. Effect of Cd Stress on Nutrient Distribution

In general, Cd significantly increased the N content in T. patula (Figure 5; GLMs, p < 0.001 for treatments). N content was dramatically influenced by the growth stage (GLMs, p < 0.001 for growth stage), being highest in the seedling phase, followed by the fructification phase, and lowest in the flowering phase. N content differed considerably among organs as well (GLMs, p < 0.001 for organs), with the following order: leaf > flower > stem > root. In roots, N content in Cd-treated T. patula was significantly higher than that in the CK (one-way ANOVA, p < 0.05), showing an increasing trend with the increasing Cd concentration. In stems, N content in T. patula under treatments L225 and L300 was considerably higher than that of CK (one-way ANOVA, p < 0.05). There was no significant difference in N content of flowers among the treatments during the flowering phase (one-way ANOVA, p = 0.497), but a significant difference in N content was observed between treated plants and CK during the fructification phase (one-way ANOVA, p < 0.05).
P content was significantly influenced by Cd (Figure 5; GLMs, p < 0.001 for treatments), and this influence was dependent on growth stages and organs (GLMs, p < 0.001 for interactions among treatments, growth stages and organs). P content differed significantly among the three growth stages (GLMs, p < 0.001 for growth stage), with an order of seedling phase > flowering phase = fructification phase. In similar, P contents varied dramatically among organs (GLMs, p < 0.001 for organs), with the following order: flower > stem > leaf > root. During the flowering and fructification phases, the P contents in roots from all Cd-treated plants were significantly higher than that from CK (one-way ANOVA, p < 0.05), while the P contents only from L1 and L2 were higher than that from CK during the seedling phase (one-way ANOVA, p < 0.05). During the flowering phase, the P contents in flower were lower in Cd-treated plants than that in CK; however, in the fructification phase, the P contents in plants treated with Cd concentration less than 225 mg kg−1 were higher than that in CK.
Cd treatment considerably influenced the K content in T. patula (Figure 5; GLMs, p < 0.001 for treatments), and this influence was dependent on growth stages and organs (GLMs, p < 0.001 for interactions among treatments, growth stages and organs). K content differed dramatically among growth stages (GLMs, p < 0.001 for growth stage), with an overall order of seedling phase > fructification phase > flowering phase. Similarly, K contents varied significantly among organs (GLMs, p < 0.001 for organs), with the following general order: flower > stem > root > leaf. The K content in root, stem and leaf was significantly lower under the treatment L300 compared to that of CK (one-way ANOVA, p < 0.05), except for the stem in the fructification phase. However, the K content in flower of the L300 treatment was similar to that of CK (one-way ANOVA, p > 0.05).

3.5. Active Oxygen Injury Caused by Cd Stress

Cd treatment significantly influenced the MDA content in T. patula (Figure 6a; GLMs, p < 0.001 for treatments), and this influence was dependent on growth stages (GLMs, p < 0.001 for interactions between treatments and growth stage). MDA content also differed significantly among growth stages (GLMs, p < 0.001 for growth stage), with an order of fructification phase > flowering phase > seedling phase. In the seedling phase, all Cd-treated plants showed an increased MDA content, but only plants under L225 and L300 had an increased MDA content in both flowering and fructification phases.
H2O2 content was significantly influenced by the application of Cd (Figure 6b; GLMs, p < 0.001 for treatments), and it depended on growth stages (GLMs, p < 0.001 for interaction between treatments and growth stage). Growth stage remarkedly affected the H2O2 content as well (GLMs, p < 0.001 for growth stage), with an inverse order as for MDA: seedling phase > flowering phase > fructification phase. Cd treatment increased H2O2 content at all tested concentrations except for 7.5 mg·kg−1 in the flowering stage. In the flowering stage, plants treated with Cd at concentrations of ≥75 mg·kg−1 showed a significantly higher H2O2 content. However, plants under the treatments of L7.5–L150 showed a decreased H2O2 content, and only that of L225 showed an increased H2O2 content.
Cd treatments showed a significant effect on O2 content in T. patula (Figure 6c; GLMs, p < 0.001 for treatments), and this effect was dependent on growth stages (GLMs, p < 0.001 for interaction between treatments and growth stage). In the seedling stage, Cd decreased the O2 content for treatments L7.5–L30 compared to CK, but increased it for treatments L75–L300. In the flowering stage, only plants treated with Cd at concentrations of ≥150 mg·kg−1 showed an increased O2 content. Similar to what was observed in the seedling phase, plants treated with Cd at concentrations of ≥75 mg·kg−1 showed an increased O2 content in the fructification phase. Growth stage considerably influenced the O2 content (GLMs, p < 0.001 for growth stage), with an order of seedling phase > flowering phase > fructification phase.

4. Discussion

Cd stress induces changes in nutrient element absorption and transfer efficiency in plants, resulting in a malfunctioning metabolic process with morphological changes and nutritional deficiency [26,27]. The impact extent is related to Cd stress concentration, plant species and the physical–chemical properties of soil [28,29]. In this research, no nutritional deficiency for T. patula was observed under the Cd treatments with concentration ≤75 mg·kg−1. The height, basal diameter and biomass were significantly affected only at the soil Cd concentration higher than 150 mg·kg−1, which is consistent with the results of Sun [13], who found that the biomass of T. patula was significantly decreased when the Cd concentration was higher than 100 mg·kg−1.
The uninfluenced growth of T. patula at low concentrations of Cd may be explained by two reasons. The first explanation would be the elements of N, P and K in T. patula. Our result is similar to the findings of Chen [24], in which N and P content in Solanum nigrum L. showed an overall increase with the increase in soil Cd concentration applied. Previous research confirmed that N and P play important roles in normal physiological metabolism and substance synthesis, and they have a detoxification function for plants under heavy metal stress via the synthesis of organic acids, specific proteins and peptides, which further form new compounds with the metals, promoting the stabilization of root system and/or lowering the diffusivity of the heavy metals in the cells [30,31]. Previous studies have documented that K+ is involved in the transfer of Cd [4,32]. In our study, the Cd content showed an overall decrease in the flowering and fructification phases, which could lead to a decrease in Cd absorption, accumulation and injury. In addition, Liu [33] demonstrated that potassium deficiency protected rice seedlings from Cd stress, and Zhao found that the application of K2SO4 and KCl increases the uptake of Cd in wheat [34]. The second explanation would be the strong oxide clearing system. MDA, an indicator for ROS injury that is reduced by antioxidant enzymes such as superoxide dismutase, catalase, peroxidase and reduced glutathione, was controlled at a low level during the seedling phase [25,29]. Furthermore, the MDA content was even lower during the flowering and fructification phases in T. patula, which may be attributed to the fully developed state during these two phases, in which plants possessed a stronger ability to produce higher levels of antioxidant enzymes and reduzates [24]. However, excessive ROS was induced by high Cd concentration stress (≥150 mg·kg−1), which exceeded the ability of T. patula to clear, resulting in peroxide damage to the cytomembrane and thus inhibiting the growth of T. patula. Ben observed that MDA was increased under Cd stress during the flowering phase for Brassica napus, and they concluded that plants were more sensitive to Cd stress during the flowering stage [35]. However, our study showed that the H2O2 and O2 contents decreased with the development of T. patula. Furthermore, the MDA decreased with the increase in the developmental stage of T. patula. These results suggested that T. patula became less sensitive to Cd stress with the increase in developmental stages, and they further confirmed the potential tolerance and adaption of T. patula to Cd pollution.
As the transition phase from the vegetative period to the reproductive period, the flowering phase is a special growth stage [36]. Except for the high concentrations of L225 and L300, the initial flowering period and maximum inflorescence size of T. patula were not significantly affected by the tested Cd concentrations; the flower number was not reduced either. Our result was similar to that of Moradi [37], in which Cd stress did not show a significant effect on the total flowers of Crocus sativus L. Hladun [38] also found that average flower number and flower morphology of Raphanus sativus, a Cd-sensitive plant, were not affected by Cd at concentrations of 0.003–0.3 mg·kg−1. Flowering is the result of a combination of internal physiological changes and external environmental factors. The flowering process is directly related to the distribution of basic nutrients [30,32]. According to the resource utilization hypothesis, plants can ensure the success of reproduction by controlling the relative proportion of resources allocated to vegetative components and reproductive components when resources are limited [38,39]. In this experiment, regardless of Cd concentrations, P content in the flowering phase and K content in the flowering and fructification phases were higher in the flower than in other organs. Compared with the CK without exogenous Cd, when stressed with Cd, T. patula actively distributes more N, P and K to the flower parts. The active absorption, transportation and reasonable distribution of these nutrients by T. patula under Cd stress may be one of the important reasons for the unaffected flower numbers [40]. In addition, the Cd content of T. patula flowers remained at an extremely low level under a series of Cd concentration treatments, which is consistent with the results of Prins [41]. Studies have reported that Cd stress influences the sperm behavior and morphology of Sphaeropteris lepifera (Hook.) RM Tryon and severely blocks its sexual reproduction [42]. Cd was found to accumulate in the flowers of Cucurbita pepo L., influencing insect access and reducing its breeding fitness [43]. T. patula controlled the Cd content of the flower to a very low level, reduced the chance of damage to its germ cells and ensured the success rate of sexual reproduction.
The difference between the accumulation and transfer of Cd by plants mainly depends on two aspects: one is the genetic characteristics of the plant itself, such as root absorption, cumulative transport efficiency and the ability of roots to secrete organic acids to activate Cd ions in the soil; the other is environmental factors, such as the concentration of Cd in the soil, Cd form, pH and antagonism and synergy among ions [32,44]. In this experiment, the Cd content in each organ of marigold increased with the increase in Cd concentration at each developmental stage, which was similar to the results of Farooq [45] and Rao [46]. In terms of the overall comparison of Cd contents among organs in the seedling stage, the Cd content in the stem was the highest, and the Cd content in the roots was the lowest, which may be determined by the biological characteristics of hyperaccumulators [32]. Studies have found that hyperaccumulator plants are lacking in the ability to restrict the migration of metals from root to stem, and therefore heavy metals are transferred to their aerial parts in large amounts, but the stems with complex vascular structure can effectively prevent the further transfer of Cd to the leaves [47]. This can prevent Cd2+ from causing damage to photosynthesis and metabolic enzymes [48]. With the prolongation of the treatment time (flowering and fructification phases), the Cd content in the roots of T. patula turned to the highest. This may be due to the antagonism among Cd ions leading to enriched Cd in the T. patula root system and thus avoiding more Cd absorption [49]. In addition, studies have found that a high concentration of Cd in the roots will inhibit its transfer to the aboveground part [50]. This may contribute to the improvement of the Cd stress tolerance for a long time in T. patula. This study revealed that, in the Cd-contaminated habitat, the mechanism by which T. patula accumulates Cd and ensures normal absorption and metabolism is as follows: a large amount of absorption and accumulation of Cd in the stem during the vegetative growth phase and the accumulation of Cd in the root during the reproductive growth phase, thus avoiding a large amount of upward Cd transfer.
The average enrichment coefficient of Cd (mass content of plant aboveground part/mass content in soil) of T. patula at each developmental stage was 1.60–2.76, which exceeded 1.0, a standard for the definition of hyperaccumulator plants [4,51]. T. patula is indeed a Cd hyperaccumulator. According to the model for estimation of the Cd-enrichment capacity per unit area [52], the aboveground biomass and enrichment coefficient of T. patula were calculated based on the average value of 6.44 g/plant and 2.07 in the flowering period. When the soil Cd concentration was set as 150 mg·kg−1 in the seriously polluted mining area, the aboveground Cd concentration of T. patula was about 2.0 mg. The actual T. patula density was about 3.6 × 10⁴ plants hm−2, which can absorb about 72.0 g of pure Cd per hectare, suggesting a high practical application in the remediation of Cd-contaminated soil.

5. Conclusions

This study revealed the response of T. patula vegetative growth, flowering rhythm, active oxygen metabolism and absorption and distribution patterns of Cd and nutrient elements at different developmental stages under Cd stress. T. patula maintains the coordination of the aboveground/underground parts in morphology and adopts different strategies at different developmental stages to avoid the large transfer of Cd to the assimilation organs of leaves and reproduction organs of flowers, ensuring sufficient absorption and reasonable distribution of N, P and K in each organ. Active oxygen was effectively cleared to avoid membrane peroxidation caused by Cd stress, which allowed T. patula to survive and reproduce under the treatment of Cd at a concentration of 225 mg·kg−1 or below. Considering the strong Cd accumulation ability of T. patula and the extremely low level of Cd accumulation in the flower part (the risk of Cd returning to the soil ecosystem through petal litter and seed dispersal is low), this species can not only be a potential hyperaccumulator in Cd-polluted areas but also provide the possibility for the development of the local anthocyanidin extraction industry. Of course, these results need to be treated with caution as this tested artificial system with only Cd existing is much simpler than the real system rich in a variety of heavy metals and other pollutants. Therefore, to better understand the Cd tolerance of T. patula under a real wastewater system with dense Cd, it is necessary to further study the performance of T. patula threatened with Cd when interacting with other organic and inorganic pollutants.

Author Contributions

H.S. investigated and interpreted the experiment data and wrote the original draft. Y.W. and H.C. collated and analyzed the investigation data and also were major contributors in writing the manuscript. Y.L. and F.D. administrated and supervised the project. G.C. reviewed the draft. All authors have read and agreed to the published version of the manuscript.

Funding

This study was funded by the Natural Science Foundation of Liangshan Grant (No. 17YYJS0060) (No.19YYJS0018), which paid all costs such as tests carried out, collection and analysis of data.

Institutional Review Board Statement

Not applicable.

Informed Consent Statement

Not applicable.

Data Availability Statement

Not applicable.

Conflicts of Interest

The authors declare no conflict of interest.

Abbreviations

CKcontrol treatment
AFmaxthe maximum accumulative flower number per plant
Dfirstthe day the first flower appeared
Dlastthe day the last flower appeared
RSDrelative standard deviation
ROSreactive oxygen species
MDAmalondialdehyde
LSDleast significant difference
GLMsgeneralized linear models

References

  1. Eid, E.M.; Galal, T.M.; El-Bebany, A.F. Prediction models for monitoring heavy-metal accumulation by wheat (Triticum aestivum L.) plants grown in sewage sludge amended soil. Int. J. Phytoremediat. 2020, 22, 1000–1008. [Google Scholar] [CrossRef]
  2. NBS (National Bureau of Statistics). 2020. Available online: http://data.stats.gov.cn/easyquery.htm?cn¼C01 (accessed on 1 June 2021).
  3. Zou, M.; Zhou, S.; Zhou, Y.; Jia, Z.; Guo, T.; Wang, J. Cadmium pollution of soil-rice ecosystems in rice cultivation dominated regions in China: A review. Environ. Pollut. 2021, 280, 116965. [Google Scholar] [CrossRef]
  4. Wang, L.; Cui, X.; Cheng, H.; Chen, F.; Wang, J.; Zhao, X.; Lin, C.; Pu, X. A review of soil cadmium contamination in China including a health risk assessment. Environ. Sci. Pollut. Res. 2015, 22, 16441–16452. [Google Scholar] [CrossRef]
  5. Wang, Y.; Qian, S.; Wan, X.; Yang, P. Research on the environmental property and potential ecological risk of the soil and sediment around the typical enterprises relating to heavy mental in the southwest. Environ. Monit. China 2014, 30, 13–19. [Google Scholar] [CrossRef]
  6. Pająk, M.; Błońska, E.; Szostak, M.; Gąsiorek, M.; Pietrzykowski, M.; Urban, O.; Derbis, P. Restoration of Vegetation in Relation to Soil Properties of Spoil Heap Heavily Contaminated with Heavy Metals. Water Air Soil Pollut. 2018, 229, 392. [Google Scholar] [CrossRef] [Green Version]
  7. Ashraf, S.; Ali, Q.; Zahir, Z.A.; Ashraf, S.; Asghar, H.N. Phytoremediation: Environmentally sustainable way for reclamation of heavy metal polluted soils. Ecotoxicol. Environ. Saf. 2019, 174, 714–727. [Google Scholar] [CrossRef]
  8. Fu, S.; Wei, C.; Xiao, Y.; Li, L.; Wu, D. Heavy metals uptake and transport by native wild plants: Implications for phytoremediation and restoration. Environ. Earth Sci. 2019, 78, 103. [Google Scholar] [CrossRef]
  9. Li, F.; Ma, D. Species composition and floristic characteristics of hyperaccumulators in Sichuan province. J. Sichuan Norm. Univ. 2020, 43, 263–269. [Google Scholar] [CrossRef]
  10. Nakbanpote, W.; Meesungnoen, O.; Prasad, M.N.V. Potential of Ornamental Plants for Phytoremediation of Heavy Metals and Income Generation. In Bioremediation and Bioeconomy; Elsevier, Inc.: Philadelphia, PA, USA, 2016; pp. 179–217. [Google Scholar] [CrossRef]
  11. Ye, X.; Hu, H.; Li, H.; Xiong, Q.; Gao, H. Combined nitrogen fertilizer and wheat straw increases the cadmium phytoextraction efficiency of Tagetes patula. Ecotoxicol. Environ. Saf. 2019, 170, 210–217. [Google Scholar] [CrossRef]
  12. Liu, Z.; Chen, W.; He, X. Evaluation of hyperaccumulation potentials to cadmium (Cd) in six ornamental species (compositae). Int. J. Phytoremediat. 2018, 20, 1464–1469. [Google Scholar] [CrossRef]
  13. Sun, R.; Sun, Q.; Wang, R.; Cao, L. Cadmium accumulation and main rhizosphere characteristics of seven French marigold (Tagetes patula L.) cultivars. Int. J. Phytoremediation 2018, 20, 1171–1178. [Google Scholar] [CrossRef]
  14. Tőzsér, D.; Magura, T.; Simon, E. Heavy metal uptake by plant parts of willow species: A meta-analysis. J. Hazard. Mater. 2017, 336, 101–109. [Google Scholar] [CrossRef] [Green Version]
  15. Mondal, M.K.; Mishra, G.; Kumar, P. Adsorption of Cadmium (II) and Chromium (VI) from Aqueous Solution by Waste Marigold Flowers. J. Sustain. Dev. Energy Water Environ. Syst. 2015, 3, 405–415. [Google Scholar] [CrossRef]
  16. Liu, L.-Z.; Gong, Z.-Q.; Zhang, Y.-L.; Li, P.-J. Growth, Cadmium Accumulation and Physiology of Marigold (Tagetes erecta L.) as Affected by Arbuscular Mycorrhizal Fungi. Pedosphere 2011, 21, 319–327. [Google Scholar] [CrossRef]
  17. Tabrizi, L.; Lakzaei, M.; Motesharezadeh, B. The yield potential and growth responses of licorice (Glycyrrhiza glabra L.) to mycorrhization under Pb and Cd stress. Int. J. Phytoremediat. 2021, 23, 316–327. [Google Scholar] [CrossRef]
  18. Zhou, Y.-M.; Long, S.-S.; Li, B.-Y.; Huang, Y.-Y.; Li, Y.-J.; Yu, J.-Y.; Du, H.-H.; Khan, S.; Lei, M. Enrichment of cadmium in rice (Oryza sativa L.) grown under different exogenous pollution sources. Environ. Sci. Pollut. Res. 2020, 27, 44249–44256. [Google Scholar] [CrossRef]
  19. Omer, C.; Dursun, K. Flower yields of pot marigold (Calendula officinalis L.) plants as effected by flowering durations and number of harvests. J. Med. Plants Stud. 2018, 6, 159–161. [Google Scholar]
  20. Thakur, P.; Dilta, B.; Gupta, Y.; Kumar, P.; Mehta, D. Effect of Planting Dates, Mulching and Application of GA3 on growth and flower yield of Marigold (Tagetes Erecta L.) cv. ‘Pusa Narangi Gainda’. Int. J. Curr. Microbiol. Appl. Sci. 2019, 8, 3028–3039. [Google Scholar] [CrossRef]
  21. Balijagić, J.; Crnobarac, J.; Jovancević, M.; Mujanovic, I. The effect of variety and plant den-sity on marigold flower yield (Calendula officinalis L.) in agro-ecological conditions of Bijelo Polje. J. Agric. For. 2018, 64, 113–120. [Google Scholar] [CrossRef]
  22. Zhang, X.; Zhang, P.; Hu, Y.; Liu, Y.; Feng, S.; Guo, D.; Dang, X. Immobilization of cadmium in soil and improved iron concentration and grain yields of maize (Zea mays L.) by chelated iron amendments. Environ. Sci. Pollut. Res. 2021, 28, 53161–53170. [Google Scholar] [CrossRef]
  23. Türker, A.; Acar, O. Investigation of cadmium and lead contents of boron minerals and boron waste by electrothermal atomic absorption spectrometer. J. Iran. Chem. Soc. 2021, 18, 1607–1612. [Google Scholar] [CrossRef]
  24. Chen, L.; Hu, X.; Yang, W.; Xu, Z.; Zhang, D.; Gao, S. The effects of arbuscular mycorrhizal fungi on sex-specific responses to Pb pollution in Populus cathayana. Ecotoxicol. Environ. Saf. 2015, 113, 460–468. [Google Scholar] [CrossRef]
  25. Fang, Z.; Wan, H.; Xu, Y.; Liu, Q.; Liang, J.; Shi, X.; Chen, F. Indole-acyl esters improve the effect of nitrogen and phosphorous fertilization by mitigating the phytotoxicity and concentrations of cadmium and lead in Jatropha curcas L. in contaminated soils. Arch. Biol. Sci. 2019, 71, 677–686. [Google Scholar] [CrossRef] [Green Version]
  26. Ondrasek, G.; Rengel, Z.; Romic, D. Humic acids decrease uptake and distribution of trace metals, but not the growth of radish exposed to cadmium toxicity. Ecotoxicol. Environ. Saf. 2018, 151, 55–61. [Google Scholar] [CrossRef]
  27. Dharma-Wardana, M.W.C. Fertilizer usage and cadmium in soils, crops and food. Environ. Geochem. Heal. 2018, 40, 2739–2759. [Google Scholar] [CrossRef] [Green Version]
  28. Lin, L.; Li, J.; Chen, F.; Liao, M.; Tang, Y.; Liang, N.; Xia, H.; Lai, Y.; Wang, X.; Chen, C.; et al. Effects of melatonin on the growth and cadmium characteristics of Cyphomandra betacea seedlings. Environ. Monit. Assess. 2018, 190, 119. [Google Scholar] [CrossRef]
  29. Abbas, T.; Rizwan, M.; Ali, S.; Adrees, M.; Mahmood, A.; Zia-Ur-Rehman, M.; Ibrahim, M.; Arshad, M.; Qayyum, M.F. Biochar application increased the growth and yield and reduced cadmium in drought stressed wheat grown in an aged contaminated soil. Ecotoxicol. Environ. Saf. 2018, 148, 825–833. [Google Scholar] [CrossRef]
  30. Zemanová, V.; Pavlík, M.; Pavlíková, D.; Hnilička, F.; Vondráčková, S. Responses to Cd Stress in Two Noccaea Species (Noccaea praecox and Noccaea caerulescens) Originating from Two Contaminated Sites in Mežica, Slovenia and Redlschlag, Austria. Arch. Environ. Contam. Toxicol. 2015, 70, 464–474. [Google Scholar] [CrossRef]
  31. Thongchai, A.; Meeinkuirt, W.; Taeprayoon, P.; Pichtel, J. Soil amendments for cadmium phytostabilization by five marigold cultivars. Environ. Sci. Pollut. Res. 2019, 26, 8737–8747. [Google Scholar] [CrossRef]
  32. Rasheed, R.; Ashraf, M.A.; Kamran, S.; Iqbal, M.; Hussain, I. Menadione sodium bisulphite mediated growth, secondary metabolism, nutrient uptake and oxidative defense in okra (Abelmoschus esculentus Moench) under cadmium stress. J. Hazard. Mater. 2018, 360, 604–614. [Google Scholar] [CrossRef]
  33. Liu, C.-H.; Chao, Y.-Y.; Kao, C.H. Effect of potassium deficiency on antioxidant status and cadmium toxicity in rice seedlings. Bot. Stud. 2013, 54, 2. [Google Scholar] [CrossRef] [Green Version]
  34. Zhao, Z.-Q.; Zhu, Y.-G.; Li, H.-Y.; Smith, S.E.; Smith, F. Effects of forms and rates of potassium fertilizers on cadmium uptake by two cultivars of spring wheat (Triticum aestivum L.). Environ. Int. 2004, 29, 973–978. [Google Scholar] [CrossRef]
  35. Ben Ghnaya, A.; Charles, G.; Hourmant, A.; Ben Hamida, J.; Branchard, M. Physiological behaviour of four rapeseed cultivar (Brassica napus L.) submitted to metal stress. Comptes Rendus Biol. 2009, 332, 363–370. [Google Scholar] [CrossRef]
  36. Wei, S.; Zhou, Q.; Koval, P.V. Flowering stage characteristics of cadmium hyperaccumulator Solanum nigrum L. and their significance to phytoremediation. Sci. Total Environ. 2006, 369, 441–446. [Google Scholar] [CrossRef]
  37. Moradi, R.; Pourghasemian, N.; Naghizadeh, M. Effect of beeswax waste biochar on growth, physiology and cadmium uptake in saffron. J. Clean. Prod. 2019, 229, 1251–1261. [Google Scholar] [CrossRef]
  38. Hladun, K.R.; Parker, D.R.; Trumble, J.T. Cadmium, Copper, and Lead Accumulation and Bioconcentration in the Vegetative and Reproductive Organs of Raphanus sativus: Implications for Plant Performance and Pollination. J. Chem. Ecol. 2015, 41, 386–395. [Google Scholar] [CrossRef]
  39. Marquez, J.; Pourret, O.; Faucon, M.-P.; Weber, S.; Hoàng, T.; Martinez, R. Effect of Cadmium, Copper and Lead on the Growth of Rice in the Coal Mining Region of Quang Ninh, Cam-Pha (Vietnam). Sustainability 2018, 10, 1758. [Google Scholar] [CrossRef] [Green Version]
  40. Nicholson, C.C.; Ricketts, T.H.; Koh, I.; Smith, H.G.; Lonsdorf, E.V.; Olsson, O. Flowering resources distract pollinators from crops: Model predictions from landscape simulations. J. Appl. Ecol. 2019, 56, 618–628. [Google Scholar] [CrossRef]
  41. Prins, C.N.; Hantzis, L.J.; Quinn, C.F.; Pilon-Smits, E.A.H. Effects of selenium accumulation on reproductive functions in Brassica juncea and Stanleya pinnata. J. Exp. Bot. 2011, 62, 5633–5640. [Google Scholar] [CrossRef] [Green Version]
  42. Korshin, G.V.; Ferguson, J.F.; Lancaster, A.N. Influence of natural organic matter on the morphology of corroding lead surfaces and behavior of lead-containing particles. Water Res. 2005, 39, 811–818. [Google Scholar] [CrossRef]
  43. Xun, E.; Zhang, Y.; Zhao, J.; Guo, J. Translocation of heavy metals from soils into floral organs and rewards of Cucurbita pepo: Implica-tions for plant reproductive fitness. Ecotoxicol. Environ. Saf. 2017, 145, 235–243. [Google Scholar] [CrossRef]
  44. Meeinkuirt, W.; Kruatrachue, M.; Pichtel, J.; Phusantisampan, T.; Saengwilai, P. Influence of organic amendments on phytostabilization of Cd-contaminated soil by Eucalyptus camaldulensis. Science 2016, 42, 83. [Google Scholar] [CrossRef] [Green Version]
  45. Farooq, M.U.; Tang, Z.; Zheng, T.; Asghar, M.A.; Zeng, R.; Su, Y.; Ei, H.H.; Liang, Y.; Zhang, Y.; Ye, X.; et al. Cross-Talk between Cadmium and Selenium at Elevated Cadmium Stress Determines the Fate of Selenium Uptake in Rice. Biomolecules 2019, 9, 247. [Google Scholar] [CrossRef] [Green Version]
  46. Rao, G.; Huang, S.; Ashraf, U.; Mo, Z.; Duan, M.; Pan, S.; Tang, X. Ultrasonic seed treatment improved cadmium (Cd) tolerance in Brassica napus L. Ecotoxicol. Environ. Saf. 2019, 185, 109659. [Google Scholar] [CrossRef]
  47. Xie, L.; Hao, P.; Cheng, Y.; Ahmed, I.M.; Cao, F. Effect of combined application of lead, cadmium, chromium and copper on grain, leaf and stem heavy metal contents at different growth stages in rice. Ecotoxicol. Environ. Saf. 2018, 162, 71–76. [Google Scholar] [CrossRef]
  48. Bhatti, S.S.; Kumar, V.; Sambyal, V.; Singh, J.; Nagpal, A.K. Comparative analysis of tissue compartmentalized heavy metal uptake by common forage crop: A field experiment. Catena 2018, 160, 185–193. [Google Scholar] [CrossRef]
  49. Qin, Q.; Li, X.; Wu, H.; Zhang, Y.; Feng, Q.; Tai, P. Characterization of cadmium (108Cd) distribution and accumulation in Tagetes erecta L. seedlings: Effect of split-root and of remove-xylem/phloem. Chemosphere 2013, 93, 2284–2288. [Google Scholar] [CrossRef]
  50. Zaheer, M.M.; Yasin, N.A.; Ahmad, S.R.; Khan, W.U.; Ahmad, A.; Ali, A.; Rehman, S.U. Amelioration of cadmium stress in gladiolus (Gladiolus grandiflora L.) by application of potassium and silicon. J. Plant Nutr. 2017, 41, 461–476. [Google Scholar] [CrossRef]
  51. Sarma, H. Metal Hyperaccumulation in Plants: A Review Focusing on Phytoremediation Technology. J. Environ. Sci. Technol. 2011, 4, 118–138. [Google Scholar] [CrossRef] [Green Version]
  52. Wang, T.; Wei, H.; Zhou, C.; Gu, Y.; Li, R.; Chen, H.; Ma, W. Estimating cadmium concentration in the edible part of Capsicum annuum using hyperspectral models. Environ. Monit. Assess. 2017, 189, 548. [Google Scholar] [CrossRef]
Figure 1. Tagetes patula performance under different concentrations of Cd treatment on day 30.
Horticulturae 08 00069 g001
Figure 2. Effect of Cd stress on morphological traits of Tagetes patula. (a) Basal diameter increase and (b) height increase were measured by subtracting the basal diameter and height from day 0 to day 122 after transplantation. (c) Root biomass and (d) shoot biomass were measured on day 122 after transplantation. (e) Root/shoot ratio was based on the root/shoot biomass on day 122 after transplantation. Each bar denotes the mean of 10 (for (a,b)) or 3 (for (ce)) replicates, with standard error based on means (MSE). Different letters indicate significant differences among Cd concentrations compared by Fisher’s least significant differences (LSD) test at p ≤ 0.05.
Horticulturae 08 00069 g002
Figure 3. Effect of Cd stress on flowering of Tagetes patula. (a) Maximum influence size and (b) bloomed flowers were measured during the whole flowering phase. Each bar in (a) denotes the mean of 10 replicates, with standard error based on means (MSE). Different letters indicate significant differences among Cd concentrations within the same growth stage and organ compared by Fisher’s least significant differences (LSD) test at p ≤ 0.05. Each dot in (b) represents the mean of 10 replicates.
Horticulturae 08 00069 g003
Figure 4. Effect of Cd stress on Cd distribution in Tagetes patula. The leaf for the measurement of Cd was sampled on days 30 (seedling phase), 79 (flowering phase) and 122 (fructification phase) after transplantation. Each bar denotes the mean of 3 replicates, with standard error based on means (MSE). Different letters indicate significant differences among Cd concentrations within the same growth stage and organ compared by Fisher’s least significant differences (LSD) test at p ≤ 0.05.
Horticulturae 08 00069 g004
Figure 5. Effect of Cd stress on nutrient distribution in Tagetes patula. The leaf for the measurement of N, P and K was sampled on days 30 (seedling phase), 79 (flowering phase) and 122 (fructification phase) after transplantation. Each bar denotes the mean of 3 replicates, with standard error based on means (MSE). Different letters indicate significant differences among Cd concentrations within the same growth stage and organ compared by Fisher’s least significant differences (LSD) test at p ≤ 0.05.
Horticulturae 08 00069 g005
Figure 6. Effect of Cd stress on the active oxygen damage. The leaf for the measurement of (a) malondialdehyde, (b) H2O2 and (c) O2 was sampled on days 30 (seedling phase), 79 (flowering phase) and 122 (fructification phase) after transplantation. Each bar denotes the mean of 3 replicates, with standard error based on means (MSE). Different letters indicate significant differences among Cd concentrations within the same growth stage and organ compared by Fisher’s least significant differences (LSD) test at p ≤ 0.05.
Horticulturae 08 00069 g006
Table 1. The background values of nutrient elements, organic matter and electric conductivity (EC).
Organic Matter (%)Macronutrients (mg·kg−1)Micronutrients (mg·kg−1)EC (mS·cm−1)pH
NPKCaMgSCdZnFeBMoMnCu
2.38 ± 0.2579.62 ± 1.49161.48 ± 11.74261.47 ± 18.91212.6 ± 16.5519.06 ± 2.511.84 ± 0.490.85 ± 0.120.81 ± 0.188.12 ± 1.220.33 ± 0.091.45 ± 0.332.32 ± 0.511.38 ± 0.262.51 ± 0.736.0 ± 0.41
Mean ± SD, n = 3.
Table 2. Effects of Cd stress on flowering parameters of Tagetes patula.
Cd TreatmentFmax (Flower/Plant)Dfirst (d)Dlast (d)FD (d)Mathematic Model Parameter Test Coefficient
abx0FpAJR2n
CK20.5244.63108.5763.9420.5211.6576.6526.14<0.00010.9380
L7.518.7646.22106.1859.9618.7611.1376.2229.52<0.00010.852680
L1516.0244.8100.3655.5616.0211.0172.58164.61<0.00010.805580
L3018.4845.82109.0463.2218.4812.3877.43385.27<0.00010.906880
L7017.1646.12101.755.5817.1610.4273.91500.89<0.00010.926880
L15017.1545.11102.0756.9717.1510.8973.59215.64<0.00010.844680
L22515.0946.8108.5661.7715.0914.7777.6835.09<0.00010.463280
L3003.99///3.998.4564.23.080.06130.118332
Fmax = maximum flower amount per plant. Dfirst = first flower day, Dlast = last flower day, FD = flowering period; means ± SD for ISmax, n = 80 (except H2, n = 32, as six plants were dead during the exposure time), and the lowercase letters within this column indicate the significance of differences between Cd concentrations (confidence threshold α = 0.05).
Publisher’s Note: MDPI stays neutral with regard to jurisdictional claims in published maps and institutional affiliations.

