Article

Novel Approach for Statistical Interpretation: A Case Study from Long-Term Crop Production Experiments (Hungary)

1
Institute of Statistics and Methodology, Faculty of Economics and Business, University of Debrecen, 138 Böszörményi Str., 4032 Debrecen, Hungary
2
Institute of Land Use, Technical and Precision Technology, Faculty of Agricultural and Food Sciences and Environmental Management, University of Debrecen, 4032 Debrecen, Hungary
*
Authors to whom correspondence should be addressed.
Horticulturae 2022, 8(1), 48; https://doi.org/10.3390/horticulturae8010048
Submission received: 13 November 2021 / Revised: 30 December 2021 / Accepted: 3 January 2022 / Published: 4 January 2022

Abstract

:
In recent decades, the agricultural sector has witnessed rapid technological interventions from field to the production stage. Thus, the importance of these technological interventions must be strictly evaluated. The traditional statistical method often deems low statistical differences as a significant one, which cannot be considered effective from different perspectives. In this sense, the aim of this research was to develop a new statistical method for evaluating agricultural experiments based on different criteria; hence, the significant importance of the technological interventions can be clearly determined. Data were collected from of a long-term (13-year) crop production experiment (Central Europe, Hungary), which involved five different fertilization levels, along with non-fertilized treatment (control), two irrigation treatments (irrigated and non-irrigated), and 15–20 genotypes of maize. The output of this research showed that the classic statistical approach for testing the significant differences among treatments should be accompanied with our new suggested approach (i.e., professional test), which reflect whether treatments were professionally effective or not. Also, results showed that good statistical background is not enough for interoperating the analysis of agricultural experiments. This research suggested that erroneous conclusions can be avoided by merging classical and professional statistical tests, and correct recommendations could be provided to decision makers and farmers based on their financial resources.

1. Introduction

Globally, the agricultural sector is under immense pressure due to rapid population expansion, urbanization, and climate change [1]. Despite the malfunction of the agricultural sector in many parts of the world due to land degradation [2,3], extreme climate events [4,5], and plant diseases [6]; this sector has to feed more than 9 billion by 2050 and 12 billion by 2100 [7,8,9,10]. Thus, rapid technological interventions and innovations were implemented in the agricultural sector to fulfil global food security and to overcome production obstacles. However, the applicability and profitability of these new technological interventions and innovations need to be carefully addressed through accurate statistical methods. Hence, the traditional statistical methods raise many vital questions [11,12,13], whereas improper application of statistical methods leads to erroneous conclusions [14,15,16,17].
Recently, Raudonius [17] and Kramer et al. [18] reported that more than 50% of published research needs to be improved in terms of statistical analysis interpretation, where the results of the null hypothesis significance test (NHST) were less informative. However, many researchers argued about the validity of classical significance tests (e.g., Kramer et al. [18], Lykken, [19]; Cohen, [20]; Harlow et al., [21]; Gigerenzer, [22]; Rinella and James, [23]). While Cumming [24] invited researchers to use other statistical techniques due to several drawback in NHST. Rinella and James [23] reported that p-values were difficult to be interpreted and regularly misinterpreted, whereas there are high possibilities for uncertainties in the interoperations of the results. However, this method is still widely used in agricultural research, where the correctly interpreted NHST is considered by researchers to be a decision-making tool [25,26,27,28].
In long-term agricultural experiments, especially for crop production, researchers applied different treatments, such as different level of fertilization, irrigation, and soil treatments. Ordinarily, the collected data from different treatments were evaluated by analysis of variance. If the F-test is significant, a post-hoc test is applied to analyze mean value differences. This may be the Least Significant Difference (LSD) [29], Duncan [30], Dunnett [31], Scheffe [32], or many other tests. However, these tests examine a very “soft” hypothesis: can the difference between treatment mean values be considered zero? Which is the classic null hypothesis. Such hypothesis is often denied by the tests and show a statistically significant effect. In the case of samples with a large number of elements, small, insignificant differences are also considered significant. However, the statistically significant effect is not the same as the professionally significant effect. In addition, researchers often erroneously interpret the strength of significance as the magnitude of the effect [21]. For instance, in agricultural fertilization experiments, if researchers rely only on statistical significance (p < 0.05); over-fertilization, environmental pollution and economic loss might be caused as a result. Thus, a new approach should be adopted, tacking into consideration environmental impact, crop yield, and economic positives.
Given the above introduction, the main aim of this research was to develop a new method for evaluating long-term experiments in crop production based on Meehl [33] framework. We considered the “null hypothesis” (H0) when the expected yield surplus in the possession of professional knowledge. However, the level of expenditure and the expected increase in yield can be determined for each level of treatment.

2. Materials and Methods

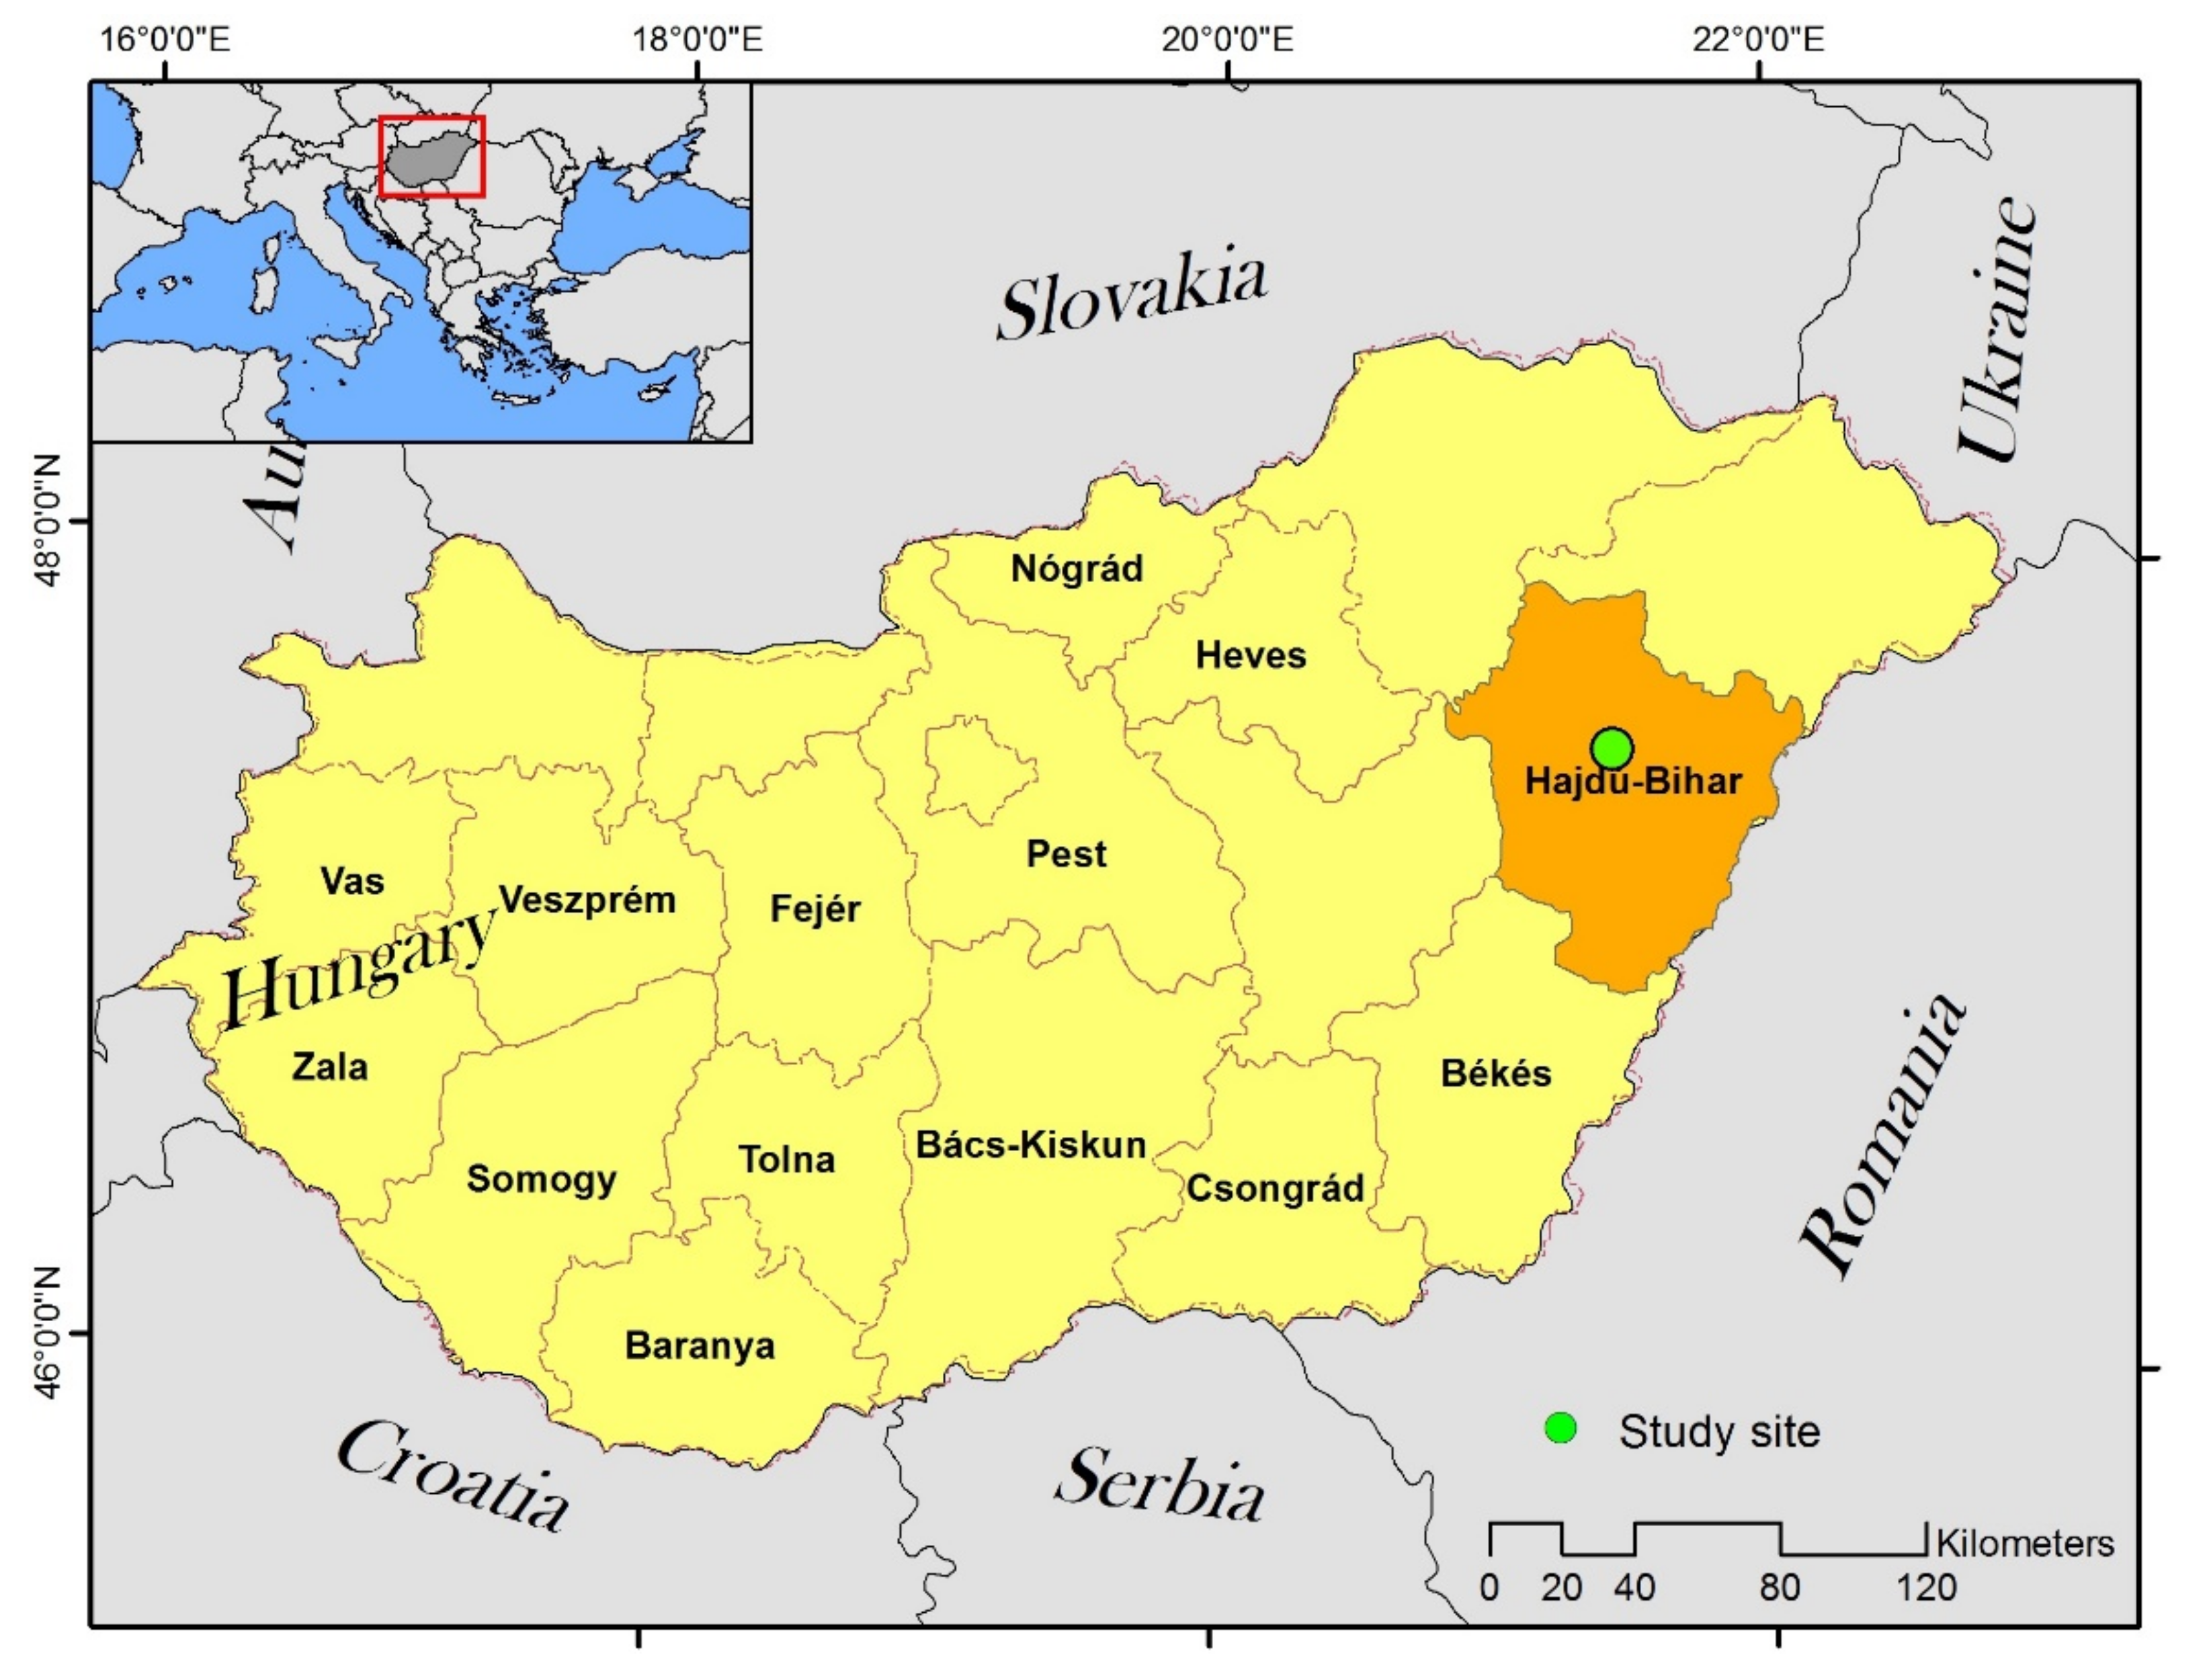
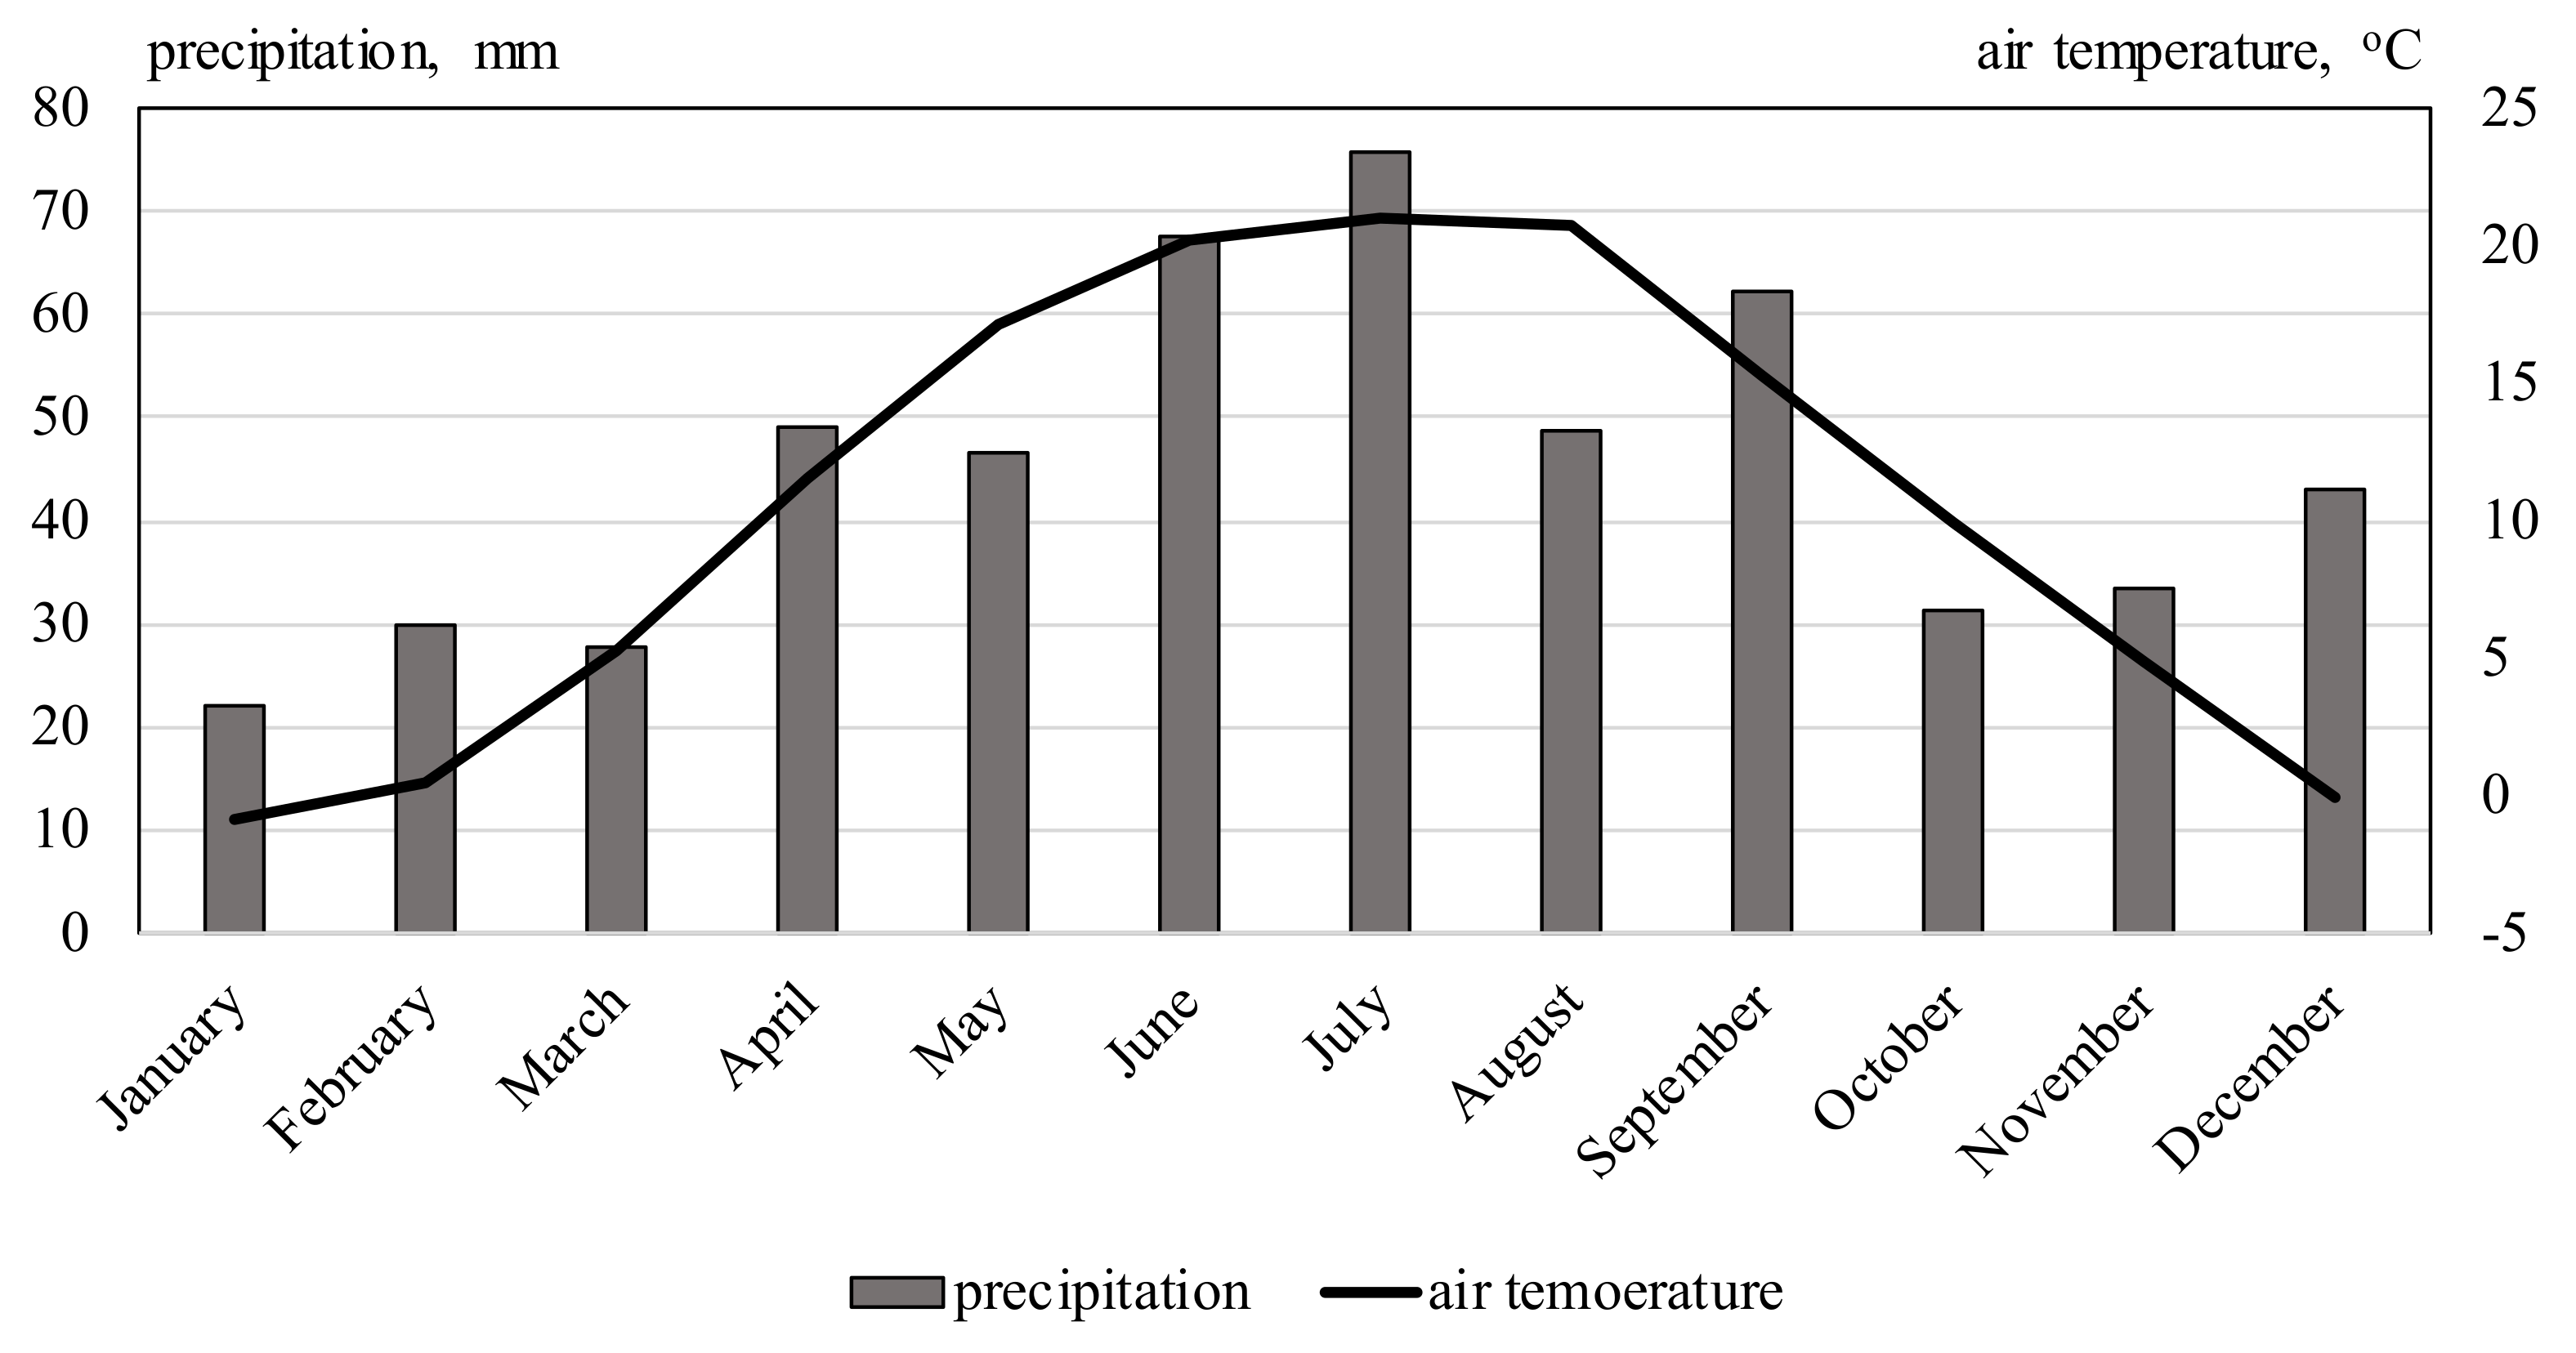
2.1. Site Description and Experiment Design for Data Collection

Data were collected from Látókép Experimental Site of the University of Debrecen (47°33′ N, 21°26′ E, 11 m) in eastern Hungary (Figure 1) [34]. The experimental site was established in 1983 to be the core of agricultural research in the eastern part of Hungary. The average temperature is 10.4 °C and the average rainfall is 537 mm (Figure 2). The experimental was designed as Randomized Complete Block Design (RCBD), which included a four-repetition three-factor process (fertilization, irrigation, hybrids). The treatments include six levels of fertilization and tow level of irrigation, as can be seen in Table 1.
To cope with the study goal, data from long-term experiment (i.e., 13 years (1996–2008)) were used, which can be considered as a homogeneous time series. The collected data include maize yield of 15–20 genotypes.

2.2. Steps for Building Professional Statistical Approach (Suggested Approach)

1. Selection of the significant level: based on decades of experimental experience, the best compromise is 10%. In crop production experiments, where biological objects are dealt with, internal deviation is high and the generally applied 5% significance level is too strict.
2. Cost and yield: cost of fertilizer dose and application is determined and the amount of grain it corresponds to is calculated. This will be the basis of the expected yield growth. A fertilizer dose is only considered to be professionally significant if the yield increase is statistically higher than that. This is the professional alternative hypothesis. Thus, the professional alternative hypothesis has to be defined. At the same time, the expected yield surplus that will cover the cost of the treatment has to be calculated, which is the material and application cost of the additional fertilizer in the presented example. In other experiments, e.g., in an irrigation experiment, the cost of irrigation should be covered by the revenue from the surplus yield caused by the treatment. If no such yield increase is obtained, the treatment is professionally non-significant. However, a statistically significant difference might still be found, but it is so small that it is professionally ineffective, not covering the cost of the inputs, i.e., the treatments.
3. Analysis of variance: If the F-test is significant, the analysis can proceed. If the F-test is not significant, then there is no significant statistical or professional effect. However, a significant F-test does not automatically mean that the effect is also professionally significant.
4. Suggested approach: the “professional null hypothesis” is set opposite to the professional alternative hypothesis. This hypothesis is tested with statistical methods. The “professional null hypothesis”: treatment is professionally ineffective; yield growth is less than or equal to the expected yield growth. Thus, professionally significant effects will be justified indirectly. User-defined contrasts are created that simultaneously examine one-sided hypotheses. This will be a real multiple mean value comparison method, where p-values are corrected based on the single-step method. Contrasts should be adjusted to test the difference between two neighboring treatment means. This step can be set up in the R statistics software as follows:
glut(model, linfct = mcp(npk =
c(“N60-controll ≤ 0.84”,
“N120-N60 ≤ 0.84”,
“N180-N120 ≤ 0.84”,
“N240-N180 ≤ 0.84”,
“N300-N240 ≤ 0.84”)))
5. Analyzing findings: If our hypothesis is accepted, the fertilizer dose will have no significant professional effect. If we reject it, the fertilizer has significantly increased the yield of the plant in a professional sense as well.
6. The analysis is carried out for each year and professionally significant effect of each dose is determined. Based on that probability of the professional effectiveness of the given fertilizer dose can be determined. Deducting this probability, the risk of using the given dose is obtained.

2.3. Statistical Analysis Performance

For testing professional significance, the 3.6.0 version of the R statistical environment was applied [35]. For general linear hypotheses and multiple comparisons for parametric models, the glut() function was applied, which can be found in the {multcomp} package [36]. In the R environment, multiple mean value comparison tests to be used in agricultural research (LSD, Duncan, Sheffé, Dunett, etc.) can be found in the {agricolae} package [37].

3. Results

3.1. Compression between Traditional and Professional Method

The previous treatment mean is subtracted from the next value and it is tested if it can be considered less or equal to 0.84 t ha−1, i.e., ineffective (Equation (1)). The results of the multiple mean comparison test are shown in Table 2, which is the output list of the R software.
The “professional null hypothesis” is rejected only in the case of the N60 kg ha−1 dose alone, as only this dose has a professionally significant effect. Applying additional fertilizer is not justified, as crop growth does not exceed the professionally expected level.
The explanation of Table 2 requires the MSE value from the analysis of variance. In addition to the six fertilizer doses, six hybrids were also included in the experiment, so a two-factor analysis of variance were applied. In this sense, the MSE value was 0.973, and the degree of freedom 130.
The Estimate column of Table 2 contains the difference in mean yield values of the two treatments. The Std. error column is the standard error of differences. This should be determined as follows:
S . E = 2 M S E r = 2 * 0.973 24 = 0.2848
This formula is also used to determine the LSD. The number of repetitions (r) is 24, there are 4 real repetitions and 6 hybrids, the product of which is 24. Thus, the standard error of the difference between the mean values of the two group is 0.2848 t ha−1. The standard error can be used to represent the distribution of the “professional null hypothesis” (Figure 3). Acceptance and rejection ranges can be marked. The blue light area of the figure is the acceptance range, while red indicates the rejection range. In this example, the critical value is 1.2 t ha−1 for a 10% one-sided alternative hypothesis. Of course, this value varies depending on the experiment and the given year. The greater the internal deviation of the data, the greater the difference between the professionally expectable yield increase and the value belonging to the 90% probability.
Result of the “traditional LSD test” (alpha = 0.1) is presented through an example, completed by an illustration of a homogeneous group with the actual data of the random block arranged maize experiment of 1985. In addition to the non-fertilized control treatment involved in the experiment, there were five different doses of NPK, which was double the amount of applied fertilizer during the period (1996–2008).
Three homogeneous groups were obtained. Group “a” shows the yields of N120–N300 kg ha−1. They do not differ significantly in statistical terms. According to the above, the highest yield can be achieved with N120 kg ha−1 fertilizer. The N60 kg ha−1 dose (group b) resulted in a significantly lower yield, while the lowest was recorded in the case of the non-fertilized group “c”.
Another way to reduce type I errors is if fewer paired comparisons are performed. If the effects of treatments are compared to the control, the Dunnett’s test can be applied suitably. There is only k − 1 (k is the number of treatment levels) in this case. If this is the objective, then this test has the highest power as a statistical test. However, in a fertilizer dose experiment, it is incorrect to compare to the control (non-fertilized treatment) because it might lead to a misleading conclusion. An example where the test results are misleading the researcher: let us assume that even the first fertilizer dose increases the yield to a very large extent; however, the other additional fertilizer doses no longer increase the yield any further. In this case, the third, fourth, etc. doses also show a significant effect as compared to the control. This result is shown in Table 2. It can be clearly seen that the Dunnett test indicates a significant effect on all fertilizer doses, although only the first doses increased the yield significantly.
According to the Professional Hypotheses, only the first fertilizer dose of N60 kg increased yield significantly. This is shown by the value of the Pr(>|t|) column. The probability value is less than 0.1. The other additional fertilizer applications did not increase maize yields to the extent that would be professionally expected.

3.2. Application of Professional Hypotheses on Collected Experimental Data

A total of 13 years of data from the long-term experiment were utilized. When presenting the method, yields of non-irrigated and irrigated plots are evaluated separately, as water supply in the often-droughty climate of Hungary significantly influences the utilization of nutrients.
Expected increase of grain yield of fertilizer dosages were determined on the basis of the technology of KITE cPlc. (Table 3). Prices were taken into account on the Hungarian level of 2017.
The grain yield increase of the first dose is higher than the others, because the application cost over the fertilizer price is borne by this dose. The additionally applied quantities will only increase production by the cost of the fertilizer. For the other doses, the value of yield increase is not exactly the same, because the calculation is based on actual KITE cPlc. data (KITE is the collaborated agricultural company with Debrecen University), where fertilizer reloads and actual rotations were taken into account. The difference is not significant.
In the R software, multiple comparisons should be specified as follows:
>K = c(“N30-kontroll ≤ 0.594”,
“N60-N30 ≤ 0.323”,
“N90-N60 ≤ 0.34”,
“N120-N90 ≤ 0.326”,
“N150-N120 ≤ 0.353”)
>glht(model, linfct = mcp(npk = K))
The “model” object contains the result of the variance analysis of the two-factor random block experiment

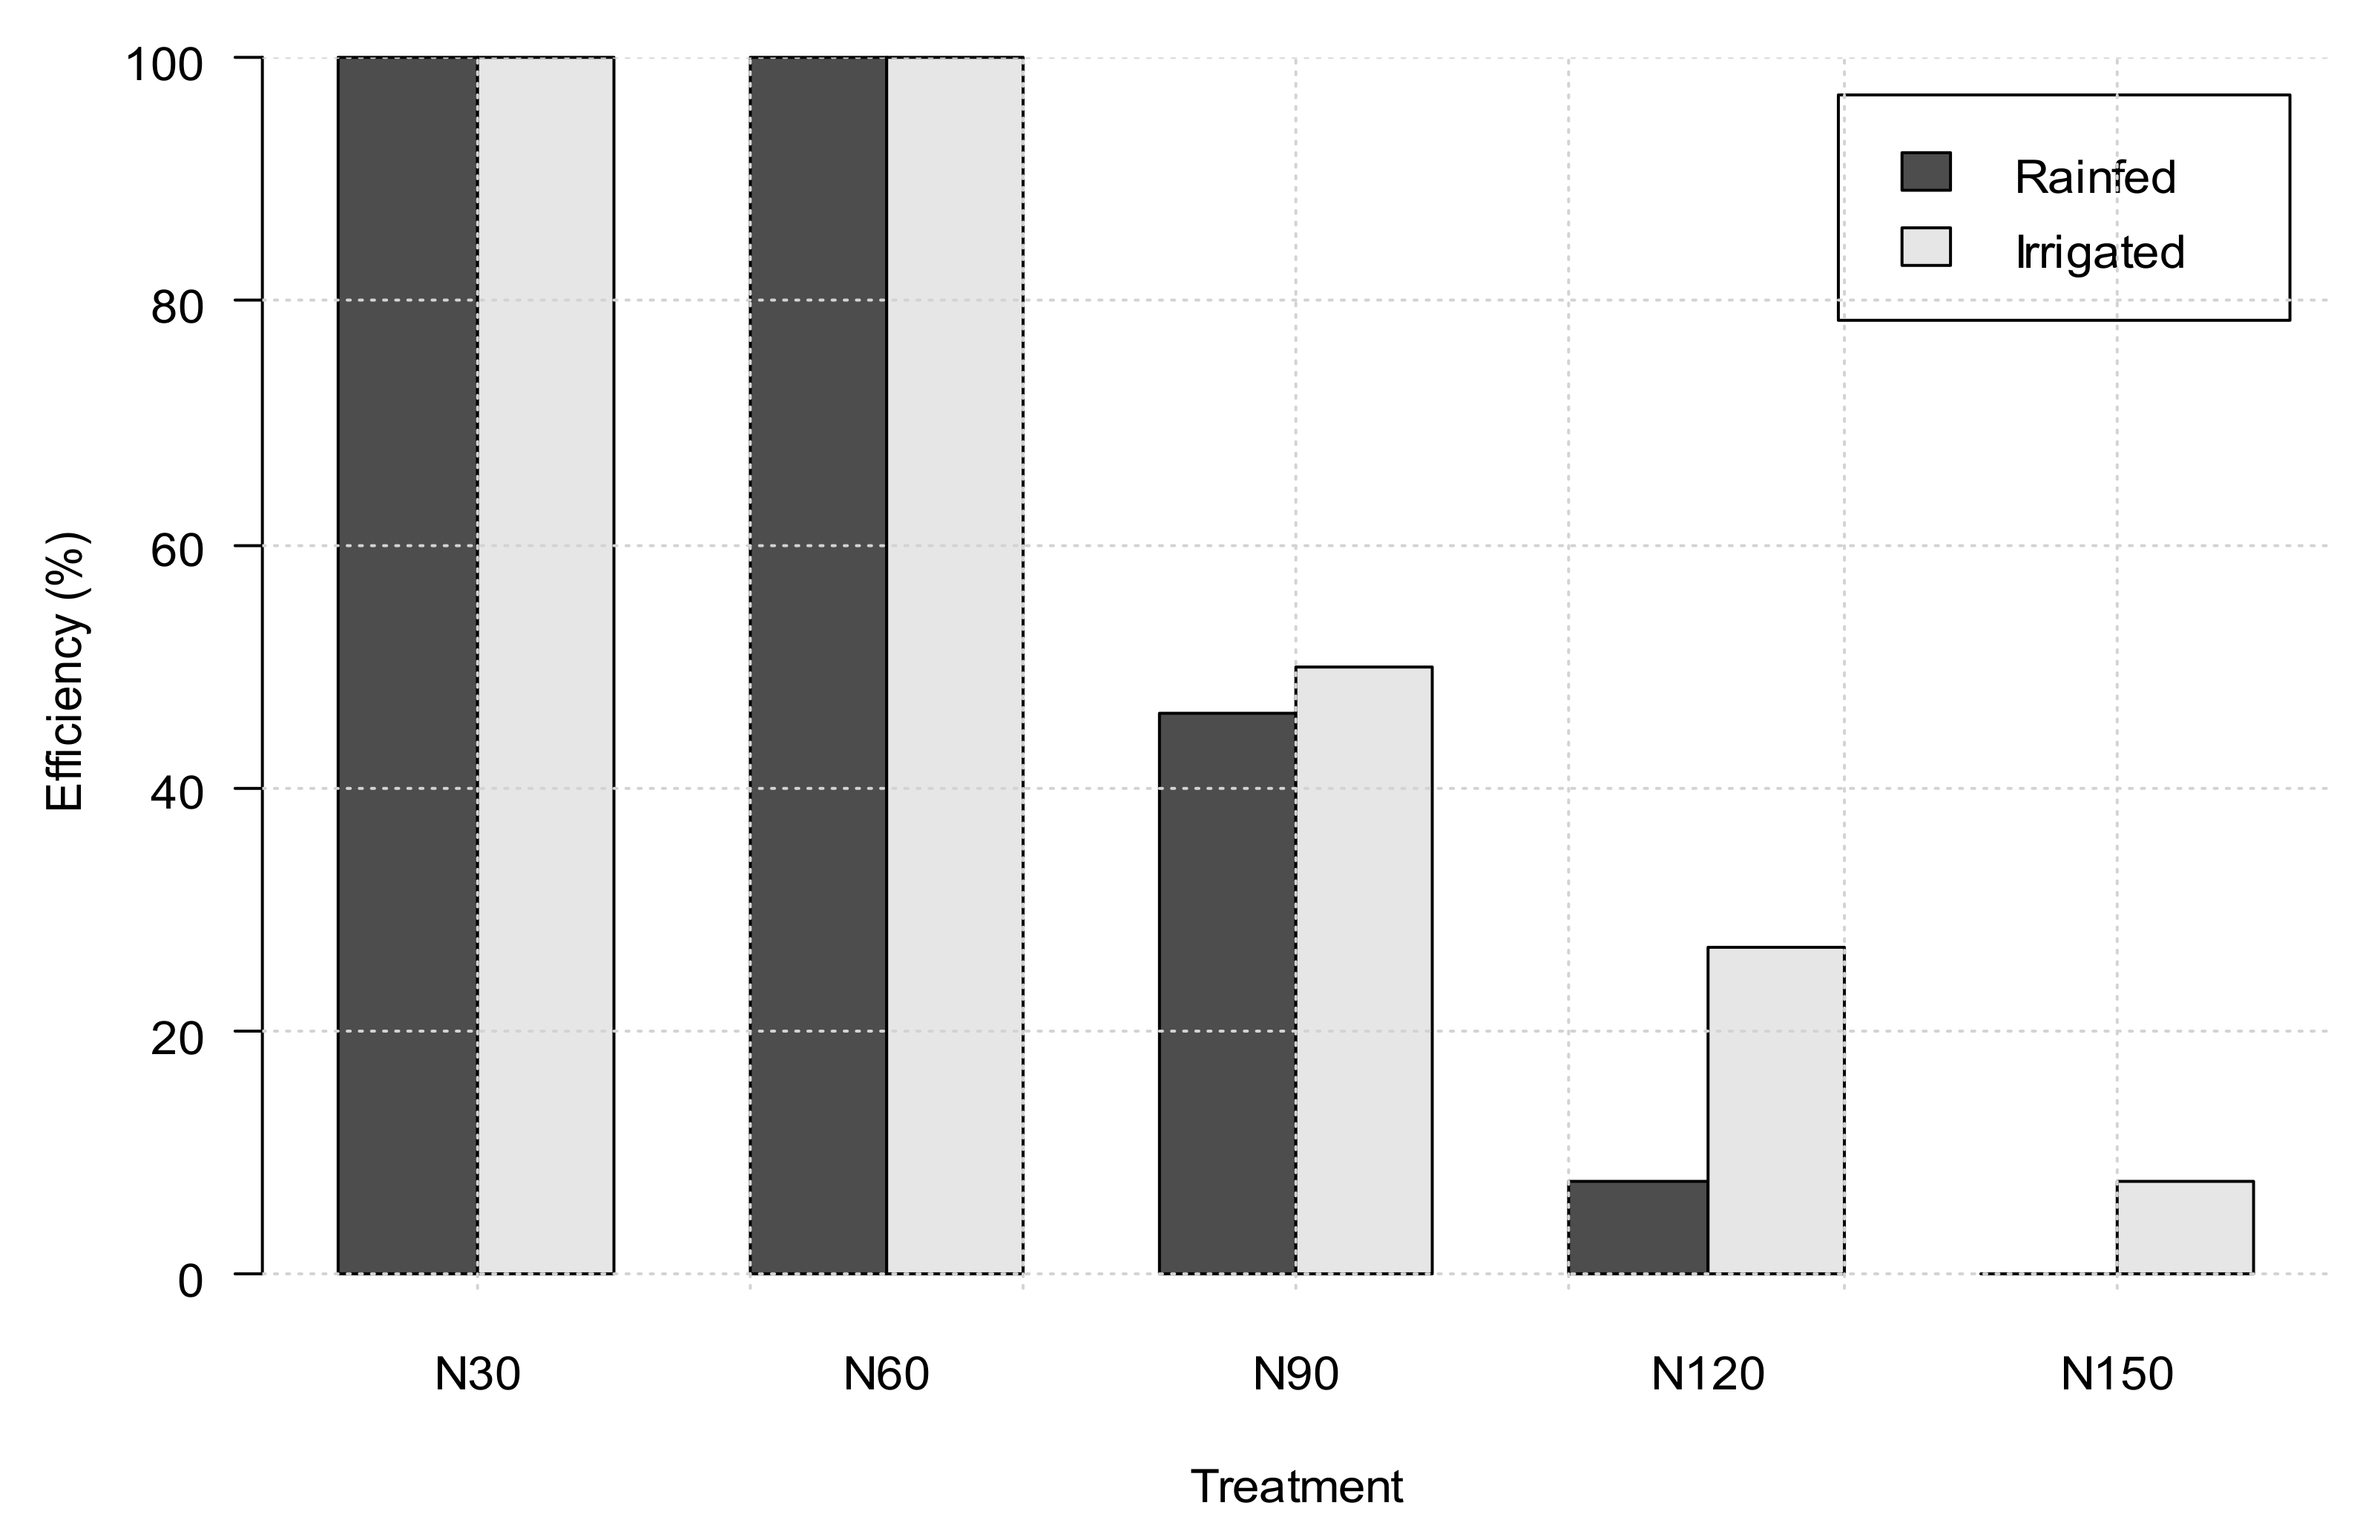
3.2.1. Results of the Non-Irrigated Treatments

The method was first tested on the data of plots with natural precipitation. So, two different years are presented from the whole studied period (i.e., 13 years). Table 4 shows a year where only low fertilizer doses were professionally significant. Except for the N150 kg ha−1 nitrogen dose, all doses increased the yield of maize professionally for yield data in 1999.
The overall result of 13 years is shown in Figure 4. Each year, the N30 and N60 kg ha−1 doses caused professionally significant yield increases. The N90 kg ha−1 dose was only 46% effective, and the N120 kg ha−1 was effective at 8%. The N150 kg ha−1 dose was not effective in any of the years of the studied period.

3.2.2. Results of the Irrigated Treatments

The two extreme cases from among the results of irrigated treatments are presented as well. Table 5 illustrates that only the first two fertilizer dosages increased the yield in a professionally significant manner (1997). The other extreme, when at 10% professional significance, all the doses used in the experiment increased maize yield, except for N150 (Table 5).
Figure 4 shows the summarized results of the studied period. The first two doses increased yield every year at the professionally expectable level. N90 kg ha−1 was 54% effective, N120 kg ha−1 was 46%, and N150 kg ha−1 was only 15% effective.

4. Discussion

Recently, economic growth and rapid increase of world population stress the importance of the agricultural sector and food security all over the world [38,39]. In this regard, as the world’s population grows to nearly 9 billion people by 2050, global food demand is expected to increase by 70–85 percent [40,41]. To meet the increased demand for food, rapid technological investment in the agricultural sector was implemented. However, these changes in the agricultural pattern raise questions about the profitability of this investment and its environmental impact. In this sense, the main goal of this research was to provide a new statistical approach for evaluating the impact of new agricultural practices (fertilization, genotype) on agricultural practices against traditional approaches. On the other hand, if researchers depend solely on statistical significance (p < 0.05) in agricultural fertilization trials, over-fertilization, environmental contamination, and economic loss may ensue. As a result, a new method should be taken, taking into account environmental impact, agricultural output, and economic benefits [23,24]. Scientifically, the conventional statistical approaches have their drawbacks [14]. For instance, when evaluating experiments through the application of multiple mean value tests, mostly all of the possible paired comparisons are tested, where k(k − 1)/2 (k is the number of treatment levels) comparison can be performed, where k is the number of treatment levels. The disadvantage of the above is that if the number of treatment levels is high, accumulation of Type I Error will be so high because of the large number of paired comparisons that there are often misinterpreted effects, i.e., Type I Error occurs. As the number of comparisons increases, the probability of making Type I Errors increases. If there are six fertilizer levels in an experiment and a 5% LSD test is applied, the global alpha value will be 53.67%. This is the probability that there will be at least one Type I Error during the comparisons. This error can be reduced by correcting the p-value, for which many recommendations are known.
From amongst the results of the long-term fertilization experiments, the most important information for practice would be to know how much additional grain yield increase is induced by additional fertilizer compared to the previous dose, and whether it is worthwhile to apply more nutrients. The yield surplus must cover the expenditure, so it should be at least that amount of yield increase or more. This has to be tested with a one-sided asymmetric test, in a series from small to large. This reduces the accumulation of the type I error, since only k−1 comparison is required. This could also be tested with independent two-sample t-tests, but the probability of committing a type I error is significantly increased in this case. In addition, the common deviation of error is only estimated from two samples, which is less accurate than an estimate based on all groups. Thus, in our research, we develop a new professional null hypothesis, which overcomes the disadvantages of old statistical approaches and it tests whether the supplemented nutrient is ineffective, namely whether it does increase the yield to the expected level.
In this research, fewer paired comparisons are performed to reduce type I errors, and to avoid the misleading of Dunnett test. In other words, conducting a comparison between fertilized and nonfertilized experiments showed that fertilization plots showed a significant impact on yield production (Table 2), although only the first two doses increased the yield significantly. To overcome this issue, the professional hypothesis approach should be applied to know how much additional grain yield increase is induced by additional fertilizer compared to the previous dose, and whether it is worthwhile to apply more nutrients.
By adopting the professional hypothesis approach, we can precisely evaluate the impact of different agricultural practices on crop yield. However, in this research we discriminated the irrigated experiments from rainfed ones, where irrigation and fertilization enhanced crop production [42]. For rainfed experiments, the implementation of professional hypothesis approach reveals that the N30 and N60 kg ha−1 doses caused a professional significant yield increase, while the other treatments could be excluded, especially the N150 kg ha−1 dose (Figure 4). Similarly, the output of irrigated plots showed that the N30 and N60 kg ha−1 doses increased the yield professionally and significantly, while the highest fertilization dosage (N150 kg ha−1) covers only 15% of yield increase (Figure 4). It is clear from the results that irrigation improves the efficiency of fertilization in the often-droughty climate of Hungary and that higher doses are more likely to be utilized than in non-irrigated treatments. By knowing the results, farmers can decide what risk they are taking with additional nutrient supply and whether it is worthwhile to use or not to use nutrients that are utilized with a probability lower than 50%.
It is good to emphasize that the professional hypothesis approach does not aim to replace the traditional approach, and therefore it is a complementary approach that tests the hypothesis from different dimensions. The outcome of this research will provide farmers and decision makers with extra information about the efficiency of their input and their impacts from different aspects (finical, environmental).

5. Conclusions

The developed method should not be utilized instead of the classic analysis of variance, but afterwards as its addition. After the statistically significant F-test, there is no need to test whether two treatment differences can be considered zero. Indirectly, this will only show a significant difference higher than zero. Information that can be useful for the producers is provided by the professional significance test.
This method is suitable for evaluating data from long-term experiments, and the vast amount of information they contain can be used for practical purposes, helping to balance productivity and environmental considerations.
Possibilities for further development of the method: development of scenarios by changing professionally expected yields, depending on the hectic changes in maize prices and production costs, or in view of their expected future developments. How will the impact of climate change on yield modify nutrient replenishment? More or less artificial fertilizers will be applied?

Author Contributions

Conceptualization, A.S.; Data curation, L.H.; Formal analysis, L.H. and A.S.; Methodology, L.H. and A.S.; Writing—original draft, A.S.; Writing—review and editing, L.H., S.M. and E.H. All authors have read and agreed to the published version of the manuscript.

Funding

This research was supported by project No. TKP2021-NKTA-32, and by the National Research, Development and Innovation Fund of Hungary, and has been financed by the 2020-4.1.1-TKP2020 funding scheme and the EFOP-3.6.3-VEKOP-16-2017-00008 project.

Institutional Review Board Statement

Not applicable.

Informed Consent Statement

Not applicable.

Data Availability Statement

Readers can contact authors.

Acknowledgments

The authors would like to thank University of Debrecen and the National Research, Development and Innovation Fund of Hungary for their unlimited support.

Conflicts of Interest

The authors declare no conflict of interest.

References

  1. Notenbaert, A.; Pfeifer, C.; Silvestri, S.; Herrero, M. Targeting, out-scaling and prioritising climate-smart interventions in agricultural systems: Lessons from applying a generic framework to the livestock sector in sub-Saharan Africa. Agric. Syst. 2017, 1, 153–162. [Google Scholar] [CrossRef]
  2. Takács, I.; Amiri, M.; Károly, K.; Mohammed, S. Assessing soil quality changes after 10 years of agricultural activities in eastern Hungary. Irrig. Drain. 2021, 70, 1116–1128. [Google Scholar] [CrossRef]
  3. Mohammed, S.; Al-Ebraheem, A.; Holb, I.J.; Alsafadi, K.; Dikkeh, M.; Pham, Q.B.; Linh, N.T.; Szabo, S. Soil management effects on soil water erosion and runoff in central Syria—A comparative evaluation of general linear model and random forest regression. Water 2020, 12, 2529. [Google Scholar] [CrossRef]
  4. Kogo, B.K.; Kumar, L.; Koech, R. Climate change and variability in Kenya: A review of impacts on agriculture and food security. Environ. Dev. Sustain. 2021, 23, 23–43. [Google Scholar] [CrossRef]
  5. Vogel, E.; Donat, M.G.; Alexander, L.V.; Meinshausen, M.; Ray, D.K.; Karoly, D.; Meinshausen, N.; Frieler, K. The effects of climate extremes on global agricultural yields. Environ. Res. Lett. 2019, 14, 054010. [Google Scholar] [CrossRef]
  6. Chakraborty, S.; Tiedemann, A.V.; Teng, P.S. Climate change: Potential impact on plant diseases. Environ. Pollut. 2000, 108, 317–326. [Google Scholar] [CrossRef]
  7. Béné, C.; Barange, M.; Subasinghe, R.; Pinstrup-Andersen, P.; Merino, G.; Hemre, G.I.; Williams, M. Feeding 9 billion by 2050–Putting fish back on the menu. Food Secur. 2015, 7, 261–274. [Google Scholar] [CrossRef] [Green Version]
  8. Bahar, N.H.; Lo, M.; Sanjaya, M.; Van Vianen, J.; Alexander, P.; Ickowitz, A.; Sunderland, T. Meeting the food security challenge for nine billion people in 2050: What impact on forests. Glob. Environ. Chang. 2020, 62, 102056. [Google Scholar] [CrossRef]
  9. Mohammed, S.; Gill, A.R.; Alsafadi, K.; Hijazi, O.; Yadav, K.K.; Khan, A.H.; Islam, S.; Cabral-Pinto, M.M.; Harsanyi, E. An overview of greenhouse gases emissions in Hungary. J. Clean. Prod. 2021, 127865. [Google Scholar] [CrossRef]
  10. Mohammed, S.; Alsafadi, K.; Hennawi, S.; Mousavi, S.M.; Kamal-Eddin, F.; Harsanyie, E. Effects of long-term agricultural activities on the availability of heavy metals in Syrian soil: A case study in southern Syria. J. Saudi Soc. Agric. Sci. 2021. [Google Scholar] [CrossRef]
  11. Onofri, A.; Carbonell, E.A.; Piepho, H.P.; Mortimer, A.M.; Cousens, R.D. Current statistical issues in Weed Research. Weed Res. 2010, 50, 5–24. [Google Scholar] [CrossRef]
  12. Singh, A.S.; Masuku, M.B. An insight in statistical techniques and design in agricultural and applied research. World J. Agric. Sci. 2012, 8, 568–584. [Google Scholar]
  13. Rudolph, S.; Wongleecharoen, C.; Lark, R.M.; Marchant, B.P.; Garré, S.; Herbst, M.; Vereecken, H.; Weihermüller, L. Soil apparent conductivity measurements for planning and analysis of agricultural experiments: A case study from Western-Thailand. Geoderma 2016, 267, 220–229. [Google Scholar] [CrossRef]
  14. Anderson, D.R.; Burnham, K.P.; Thompson, W.L. Null hypothesis testing: Problems, prevalence, and an alternative. J. Wildl. Manag. 2000, 64, 912–923. [Google Scholar] [CrossRef]
  15. Hobbs, N.T.; Hilborn, R. Alternatives to statistical hypothesis testing in ecology: A guide to self teaching. Ecol. Appl. 2006, 16, 5–19. [Google Scholar] [CrossRef] [Green Version]
  16. Tavares, L.D.; Carvalho, A.M.; Machado, L.G. An evaluation of the use of statistical procedures in soil science. Rev. Bras. De Ciência Do Solo 2016, 29, 40. [Google Scholar] [CrossRef] [Green Version]
  17. Raudonius, S. Application of statistics in plant and crop research: Important issues. Zemdirb.-Agric. 2017, 104, 377–382. [Google Scholar] [CrossRef] [Green Version]
  18. Kramer, M.H.; Paparozzi, E.T.; Stroup, W.W. Statistics in a Horticultural Journal: Problems and solutions. J. Am. Soc. Hortic. Sci. 2016, 141, 400–406. [Google Scholar] [CrossRef]
  19. Lykken, D.T. Statistical significance in psychological research. Psychol. Bull. 1968, 70, 151–159. [Google Scholar] [CrossRef] [Green Version]
  20. Cohen, J. The earth is round (p <0.05). Am. Psychol. 1994, 49, 997. [Google Scholar]
  21. Harlow, L.L.; Mulaik, S.A.; Steiger, J.H. (Eds.) Multivariate Applications Book Series. What If There Were No Significance Tests? Lawrence Erlbaum Associates Publishers: Mahwah, NJ, USA, 1997. [Google Scholar] [CrossRef]
  22. Gigerenzer, G. Mindless statistics. J. Socio-Econ. 2004, 33, 587–606. [Google Scholar] [CrossRef]
  23. Rinella, M.J.; James, J.J. Invasive plant researchers should calculate effect sizes, not P-values. Invasive Plant Sci. Management. 2010, 3, 106–112. [Google Scholar] [CrossRef]
  24. Cumming, G. The new statistics: Why and how. Psychol. Sci. 2014, 25, 7–29. [Google Scholar] [CrossRef]
  25. Robinson, D.H.; Wainer, H. On The Past and Future of Null Hypothesis Significance Testing 1. ETS Res. Rep. Ser. 2001, 2001, i–20. [Google Scholar] [CrossRef]
  26. Mogie, M. In support of null hypothesis significance testing. Proceedings of the Royal Society of London. Ser. B Biol. Sci. 2004, 271 (Suppl. S3), S82–S84. [Google Scholar] [CrossRef]
  27. Stephens, P.A.; Buskirk, S.W.; del Rio, C.M. Inference in ecology and evolution. Trends Ecol. Evol. 2007, 22, 192–197. [Google Scholar] [CrossRef]
  28. Mudge, J.F.; Baker, L.F.; Edge, C.B.; Houlahan, J.E. Setting an optimal α that minimizes errors in null hypothesis significance tests. PLoS ONE 2012, 7, e32734. [Google Scholar] [CrossRef]
  29. Fisher, R.A. The Design of Experiments; Oliver and Boyd: Edinburgh, UK, 1935. [Google Scholar] [CrossRef]
  30. Duncan, D.B. Multiple range and multiple F tests. Biometrics 1955, 11, 1–42. [Google Scholar] [CrossRef]
  31. Dunnett, C.W. A multiple comparison procedure for comparing several treatments with a control. J. Am. Stat. Assoc. 1955, 50, 1096–1121. [Google Scholar] [CrossRef]
  32. Scheffe, H. The Analysis of Variance; Wiley: New York, NY, USA, 1959. [Google Scholar] [CrossRef]
  33. Meehl, P.E. Theoretical risks and tabular asterisks: Sir Karl, Sir Ronald, and the slow progress of soft psychology. J. Consult. Clin. Psychol. 1978, 46, 806–834. [Google Scholar] [CrossRef]
  34. Mohammed, S.; Mirzaei, M.; Pappné Törő, Á.; Anari, M.G.; Moghiseh, E.; Asadi, H.; Szabó, S.; Kakuszi-Széles, A.; Harsányi, E. Soil carbon dioxide emissions from maize (Zea mays L.) fields as influenced by tillage management and climate. Irrig. Drain. 2021. [Google Scholar] [CrossRef]
  35. R Core Team. R: A Language and Environment for Statistical Computing; R Foundation for Statistical Computing: Vienna, Austria, 2019; Available online: https://www.R-project.org (accessed on 5 September 2021).
  36. Hothorn, T.; Bretz, F.; Westfall, P.; Heiberger, R.M. Multcomp: Simultaneous Inference for General Linear Hypotheses. R package version. 2012, pp. 1–2. Available online: http://CRAN.R-project.org/package=multcomp (accessed on 5 September 2021).
  37. Mendiburu, F. Agricolae: Statistical Procedures for Agricultural Research. R Package Version 1.3-1. 2019. Available online: https://CRAN.R-project.org/package=agricolae (accessed on 5 September 2021).
  38. Pawlak, K.; Kołodziejczak, M. The role of agriculture in ensuring food security in developing countries: Considerations in the context of the problem of sustainable food production. Sustainability 2020, 12, 5488. [Google Scholar] [CrossRef]
  39. Qaim, M. Role of new plant breeding technologies for food security and sustainable agricultural development. Appl. Econ. Perspect. Policy 2020, 42, 129–150. [Google Scholar] [CrossRef]
  40. Dhankher, O.P.; Foyer, C.H. Climate resilient crops for improving global food security and safety. Plant Cell Environ. 2018, 41, 877–884. [Google Scholar] [CrossRef]
  41. Ray, D.K.; Mueller, N.D.; West, P.C.; Foley, J.A. Yield trends are insufficient to double global crop production by 2050. PLoS ONE 2013, 8, e66428. [Google Scholar] [CrossRef] [Green Version]
  42. Zou, H.; Fan, J.; Zhang, F.; Xiang, Y.; Wu, L.; Yan, S. Optimization of drip irrigation and fertilization regimes for high grain yield, crop water productivity and economic benefits of spring maize in Northwest China. Agric. Water Manag. 2020, 230, 105986. [Google Scholar] [CrossRef]
Figure 1. Location of the experiment site, Hungary, city of Debrecen.
Horticulturae 08 00048 g001
Figure 2. Average temperature and rainfall in the research station (1996–2008).
Horticulturae 08 00048 g002
Figure 3. Distribution function of the “professional null hypothesis”, p = 0.9.
Horticulturae 08 00048 g003
Figure 4. Efficiency of the fertilization of non-irrigated and irrigated plots (1996–2008).
Horticulturae 08 00048 g004
Table 1. Treatments of long-term experiment (1996–2008) (Hungary).
Fertilization CodeFertilization Levels
N3030 kg N, 23 kg P2O5, 27 kg K2O ha−1
N6060 kg N, 45 kg P2O5, 53 kg K2O ha−1
N9090 kg N, 68 kg P2O5, 80 kg K2O ha−1
N120120 kg N, 90 kg P2O5, 106 kg K2O ha−1
N150150 kg N, 113 kg P2O5, 133 kg K2O ha−1
ControlNA
Table 2. Results of the simultaneous tests for general linear hypotheses.
Traditional Approach
Statistical HypothesesEstimate
(t/ha)
Error
(t/ha)
t ValuePr(>|t|)
N60 − control = 02.02860.28487.123<1 × 10⁻⁹ ***
N120 − control = 02.54290.28488.928<1 × 10⁻⁹ ***
N180 − control = 02.66200.28489.346<1 × 10⁻⁹ ***
N240 − control = 02.74770.28489.647<1 × 10⁻⁹ ***
N300 − control = 02.56900.28489.020<1 × 10⁻⁹ ***
Professional Hypotheses
N60 − control ≤ 0.842.028620.284824.1730.000153 ***
N120 − N60 ≤ 0.840.514290.28482−1.1441.000000
N180 − N120 ≤ 0.840.119120.28482−2.5311.000000
N240 − N180 ≤ 0.840.085630.28482−2.6491.000000
N300 − N240 ≤ 0.84−0.178620.28482−3.5761.000000
*** Significant at the 0.001 probability level (Adjusted p values reported—single-step method).
Table 3. Data of treatments and expectable grain yield increase.
TreatmentN Fertilizer
(kg ha−1)
P2O5 Fertilizer
(kg ha−1)
K2O Fertilizer
(kg ha−1)
Yield Increase
(t ha−1)
N303023270.594
N606045530.323
N909068800.340
N120120901060.326
N1501501131330.353
Table 4. Result of the simultaneous tests for general linear hypotheses in two different crop years.
Professional Hypotheses, 1996Estimate Std.Errort ValuePr(>|t|)
N30 − control ≤ 0.5943.27980.122921.857<2 × 10⁻¹⁶ ***
N60 − N30 ≤ 0.3231.61370.122910.503<2 × 10⁻¹⁶ ***
N90 − N60 ≤ 0.34−0.23210.1229−4.6561
N120 − N90 ≤ 0.326−0.61470.1229−7.6551
N150 − N120 ≤ 0.353−0.51190.1229−7.0391
Professional Hypotheses, 1999Estimate Std.Errort ValuePr(>|t|)
N30 − control ≤ 0.5942.55320.145713.443<1 × 10⁻⁴ ***
N60 − N30 ≤ 0.3231.13100.14575.544<1 × 10⁻⁴ ***
N90 − N60 ≤ 0.340.91990.14573.9790.000186 ***
N120 − N90 ≤ 0.3260.84250.14573.5440.001029 **
N150 − N120 ≤ 0.3530.14660.1457−1.4161.000000
*** Significant at the 0.001 probability level; ** Significant at the 0.01 probability level (Adjusted p values reported—single-step method).
Table 5. Result of the simultaneous tests for general linear hypotheses.
Professional Hypotheses, 1997.Estimate Std.Errort ValuePr(>|t|)
N30 − control ≤ 0.5943.86753850.118723127.573<0.001 ***
N60 − N30 ≤ 0.3230.91512500.11872314.987<0.001 ***
N90 − N60 ≤ 0.340.45712500.11872310.9870.645
N120 − N90 ≤ 0.3260.00045190.1187231−2.7421.000
N150 − N120 ≤ 0.353−0.74456730.1187231−9.2451.000
Professional Hypotheses, 2004Estimate Std.Errort ValuePr(>|t|)
N30 − control ≤ 0.5941.99800.15928.817<0.001 ***
N60 − N30 ≤ 0.3231.13010.15925.069<0.001 ***
N90 − N60 ≤ 0.340.84070.15923.1450.00451 **
N120 − N90 ≤ 0.3261.07740.15924.719<0.001 ***
N150 − N120 ≤ 0.3530.71940.15922.3010.05341
*** Significant at the 0.001 probability level; ** Significant at the 0.01 probability level (Adjusted p values reported—single-step method).
Publisher’s Note: MDPI stays neutral with regard to jurisdictional claims in published maps and institutional affiliations.

