Article

Identification of Major Loci and Candidate Genes for Anthocyanin Biosynthesis in Broccoli Using QTL-Seq

1
Shanghai Key Lab of Protected Horticultural Technology, Horticulture Research Institute, Shanghai Academy of Agricultural Sciences, Shanghai 201403, China
2
School of Ecological Technology and Engineering, Shanghai Institute of Technology, Shanghai 201418, China
*
Author to whom correspondence should be addressed.
These authors contributed equally to this work.
Horticulturae 2021, 7(8), 246; https://doi.org/10.3390/horticulturae7080246
Submission received: 6 June 2021 / Revised: 2 August 2021 / Accepted: 9 August 2021 / Published: 13 August 2021
(This article belongs to the Special Issue Advances in Molecular Breeding of Vegetable Crops)

Abstract

:
Anthcyanins determine the colors of flowers, fruits, and purple vegetables and act as important health-promoting antioxidants. BT 126 represents a broccoli variety with a high content of anthocyanins (5.72 mg/g FW). Through QTL-seq bulk segregant analysis, the present study aimed to determine the quantitative trait loci (QTLs) involved in anthocyanin biosynthesis in the F2 population (n = 302), which was obtained by crossing BT 126 with a non-anthocyanin-containing SN 60. The whole-genome resequencing of purple (n = 30) and green (n = 30) bulk segregates detected ~1,117,709 single nucleotide polymorphisms (SNPs) in the B. oleracea genome. Two QTLs, tightly correlated with anthocyanin biosynthesis (p < 0.05), were detected on chromosomes 7 (BoPur7.1) and 9 (BoPur9.1). The subsequent high-resolution mapping of BoPur9.1 in the F2 population (n = 280) and F3 population (n = 580), with high-throughput genotyping of SNPs technology, narrowed the major anthocyanin biosynthesis QTL region to a physical distance of 73 kb, containing 14 genes. Among these genes, Bo9g174880, Bo9g174890, and Bo9g174900 showed high homology with AT5G07990 (gene encoding flavonoid 3′ hydroxylase), which was identified as a candidate gene for BoPur9.1. The expression of BoF3’H in BT 126 was significantly higher than that in SN60. Multiple biomarkers, related to these QTLs, represented potential targets of marker-assisted selection (MAS) foranthocyanin biosynthesis in broccoli. The present study provided genetic insights into the development of novel crop varieties with augmented health-promoting features and improved appearance.

1. Introduction

Broccoli (Brassica oleracea var. italic) is a popular vegetable of B. oleracea that differs from most Brassica species, including Chinese cabbage, turnip, cabbage, broccoli, cauliflower, and oilseed rape. Most varieties of broccoli are domesticated from crop wild relatives in the Mediterranean Basin and grow as annuals, producing a large head with florets, buds, leaves, stalks, and stems for consumption. Both of broccoli and cauliflower cultivar groups are members of the CC genome B. oleracea (2n = 18) coenospecies. High-quality reference genomes of cauliflower have been reported, and the assembled cauliflower genome was 584.60 Mb in size [1]. As a great food source of essential vitamins and minerals, broccoli contains antioxidant phytochemicals, such as glucoraphanin, which may help prevent cancer [2]. Purple broccoli attracts increasing attention as a functional food, owing to its pleasing appearance and high level of health-promoting effects [3]. The purple coloration has been identified as one of the signs of anthocyanin accumulation [4].
Anthocyanins belong to a class of flavonoid compounds that impart color to plants and play an important role in plant protection against a variety of biotic and abiotic stresses [5,6,7]. Anthocyanin biosynthetic pathway genes have been extensively characterized in Arabidopsis (Arabidopsis thaliana), maize (Zea mays), tomato (Solanum lycopersicum), eggplant (Solanum melongena), and other plant species [8,9,10,11]. The induction of structural genes and transcription factors is considered to be an important mechanism for the regulation of anthocyanin biosynthesis in the Brassica species [12,13,14]. A cauliflower purple mutation exhibited a tissue-specific pattern of anthocyanin overproduction [15]. Due to the insertion of Harbinger transposon, the upregulation of BoMYB2 specifically activates BobHLHs and some downstream anthocyanin structural genes to generate the ectopic accumulation of anthocyanin. Similarly, the accumulation of anthocyanin is caused by the activation of TT8 and MYB2 genes in red cabbages [14]; of BrMYB2 and downstream genes, such as BrTT8, BrF3’H, BrDFR1, BrANS1, BrUGTs, BrATs, and BrGSTs, under the control of BrMYB2 in a purple head of Chinese cabbage cultivar 11S91 [16]. In purple cabbages, deleting or replacing nucleotides in the exon of BoMYBL2-1 is solely responsible for the purple coloration [17]. In addition, temperature and light are the major environmental factors that affect anthocyanin accumulation. In purple head Chinese cabbage, BrMYB2 and BrTT8 activated anthocyanin structural genes after low temperature induction [18]. Elevated temperature could suppress anthocyanin accumulation via COP1-HY5 signaling, and MYBL2 down-regulation partially modulated the high-temperature-associated suppression of anthocyanin production [19]. Some efforts have also led to the identification of candidate genes that regulate the coloration of the Brassica species. In broccoli, three QTLs have been mapped to the purple sepal trait of the flower head on chromosome C01 [20]. In ornamental kale, the genes that individually conferred pink and purple leaf colorations have been mapped to chromosomes C3 [21] and C9 [22], respectively. In Zicaitai, an important locus on chromosome 7 highly controlled the stalk color trait, which was significantly correlated with bHLH49 expression in the F2 population [23]. In purple-heading Chinese cabbage, the purple inner leaf trait was solely regulated by the dominant gene BrPur, which was mapped to A07, between SSR markers A710 and A714, with a genetic distance of 3.1 and 3.5 cM, respectively [24].
The majority of agronomic traits are controlled by QTLs, which are critical for improvement in crop breeding, through marker-assisted selection (MAS). The classical method of QTL mapping is linkage mapping, which is laborious and requires a great amount of time. Next-generation sequencing (NGS) has become the new strategy for establishing associations between agronomic traits and biomarkers or genes. It has been demonstrated that the QTL-seq method, which combines bulk segregant analysis (BSA) with NGS, is an effective tool for mapping and isolating QTLs [25]. QTL-seq is performed with two groups of individual plants, with a contrasting phenotype on a trait of interest, from segregating population-either F2 recombinant inbred lines, double haploid, or backcross populations. Through high-throughput SNP (Hi-SNP) technology, the genotype analysis of two mixed pools identifies the genomic position of the polymorphic molecular markers, and the major QTL region with significant segregation of genotypes is identified. Hi-SNP is a technique for large-scale SNP genotyping, based on multiplex-PCR, combined with the next generation sequencing and bioinformatics tools. Amplicon sequencing, combined multiplex-PCR and NGS with higher depth and low false discovery rate (and was more accurate than the whole-genome resequencing (WGS)), has been used for known SNPs genotyping in diploid but was not reported in allopolyploid crops. QTL-seq used for SNP genotyping had many advantages, such as simple primer design, single short reads sequences, high-throughput, high-depth sequencing, and easy to automate and process, e.g., recently, the QTL-seq method has been utilized for mapping QTLs related to resistance to rice blast disease and seedling vigor [26], leaf spot resistance in peanuts [27,28], heat tolerance in broccoli [29], resistance to Fusarium oxysporum f. sp. niveum race 1 in watermelon [30], cucumber early flowering [31], and tomato fruit weight and lobule amounts [32].
Mutant analyses, leading to purple or red organs, has been extensively studied in flowers, fruits, and model plants [15]. Although there is much research on the underlying mechanisms of anthocyanin biosynthesis in cauliflower [15], cabbage [17], kohlrabi [33], kale [22], and Chinese kale [34], only few have focused on broccoli [20]. The purple broccoli mutant represents an interesting mutation, in which the accumulation of anthocyanins in flower buds causes the mutant heads to exhibit purple coloration. The broccoli purple mutation was found to be controlled by QTLs. We designate the symbol Pur for the Purple allele.
Through QTL-seq, this work aimed to identify QTLs involved in anthocyanin biosynthesis in the F2 population, which was obtained by crossing the purple broccoli line BT 126 with SN 60 (a cultivar with green heads).

2. Materials and Methods

2.1. Plant Materials

Two broccoli inbred lines, including BT 126 (with purple heads) and SN 60 (with green heads), were used as parental lines in this study. To develop segregating populations for anthocyanin biosynthesis, the purple head plant BT 126 was crossed with the green head plant SN 60 (Figure 1). The F1 plants were self-pollinated to produce the two F2 populations with 302 and 280 individuals, respectively.
Initially, a population of 302 F2 individuals, along with 10 plants from each parental line, were grown at Zhuanghang Experimental Base of Shanghai Academy of Agricultural Sciences, Shanghai in 2018. The phenotyping of each F2 individual was carried out on at least three separate days, after the flower head reached maturity in the field. Curd color, which showed a color distribution from green to purple, was visually scored from 1 to 5: 1–green, 2–slight purple, 3–light purple, 4–slightly darker purple, and 5–purple (Figure 1E–I). The total anthocyanin content has been determined by the high-performance liquid chromatography (HPLC) method at six biological replicates. The BT 126 is a purple broccoli variety, with an average content of anthocyanin 5.72 mg/g FW. It was crossed to SN 60, with very low anthocyanin content (0.64 mg/g FW), to generate F1 progeny. The average contents of anthocyanin, for the 5 phenotypic categories, were 5.38, 3.26, 2.29, 1.27, and 0.78 mg/g FW. All the above information was increased in the revised manuscript. Subsequently, two populations of 280 F2 and 580 F3 individuals were grown under routine management at Zhuanghang Experimental Base of Shanghai Academy of Agricultural Sciences, Shanghai in 2019 and 2020, respectively. We started the broccoli seeds in the plastic tunnel in August. Four weeks after germination, we transplanted them to field plots. The head color of each F2 and F3 plants was visually phenotyped in 60 days, when grown from transplants, when the heads usually had a diameter larger than 2 ¼ inches. To avoid the sunlight and temperature effects, all the plants were grown in the same plastic tunnel. Leaf tissues were harvested and stored at −20 °C for DNA extraction. The head tissues of both parents (BT 126 and SN 60), at the full-size, mature stage, were collected from the same site of the top head, at three biological replicates, and used for RT-qPCR analysis. The anthocyanins in the broccoli heads were isolated and assessed, according to the method proposed by Liu C. et al. [4].
All materials were obtained from the Institute of Horticulture, Shanghai Academy of Agricultural Sciences.

2.2. DNA Purification, Library Generation, and Whole-Genome ReSequencing

Total DNA was extracted from fresh leaves using the CTAB method [35]. A total of 1.5 μg DNA, per specimen, was utilized for DNA sample preparations. The DNA quality was assessed by 1% agarose gel electrophoresis. Among the F2 segregating population, composed of 302 plants, 30 with purple heads (high anthocyanin biosynthesis, HAB) and 30 with green heads (low anthocyanin biosynthesis, LAB) were selected to extract equal amount of DNA, pooled to construct the DNA bulks. The DNA bulks, together with the two parental DNA, were used for whole-genome resequencing.
By ultrasonication, 350-bp fragments were obtained from the tested DNA sample. A sequencing library was generated using the Truseq Nano DNA HT Sample Preparation Kit (Illumina, San Diego, CA, USA), according to the manufacturer’s instructions. The constructed library was sequenced on the Illumina HiSeq4000 platform (Illumina, CA, USA), and 150-bp paired-end reads were produced with approximately 350-bp inserts. Stringent quality control (QC) steps were applied to ensure the reliability and accuracy of the reads. Then, the filtered, high-quality sequences from the DNA bulks and parental genotypes were aligned and mapped to the public B. oleracea genome database (TO1000) (http://plants.ensembl.org/Brassica_oleracea) (accessed on 5 May 2021) with the Burrows-Wheeler alignment (BWA) tool [36,37]. Alignment files were converted into BAM files with SAMtools (Wellcome Trust Genome Campus, Cambridge, UK) [38]. SNP detection was carried out for each specimen, utilizing the UnifiedGenotyper function in the GATK3.8 software (The Broad Institute of Harvard and MIT, Cambridge, MA, USA) [39]. ANNOVAR (Children’s Hospital of Philadelphia, Philadelphia, PA, USA) was employed for SNP annotation, based on the GFF3 file of the reference genome [40].

2.3. QTL-Seq Analysis

By applying an established QTL-seq method, based on SNP-index and Δ( SNP-index) estimates, candidate genomic regions harboring the main QTL(s) involved in anthocyanin biosynthesis in broccoli were identified. Only the SNPs homozygous in either parent and polymorphic between the parents were prepared for the further analysis. Then 1,117,709 SNPs, between both parents, were selected. The read depth for the above-mentioned homozygous SNPs, in LAB and HAB bulks, was obtained to evaluate the SNP-index. The SNP-index, calculated according to the reads order-checking depth information, utilized short reads covering the given nucleotide position, calculated the differs reads bar number, and accounted for the ratio of the total number [26]. The genotype of one parent was utilized as a reference to determine the number of reads for the parental genotype, or other genotypes, in the LAB and HAB libraries. Then, the number of the various reads was divided by the total read number, and the ratio constituted the SNP-index of the base sites. The SNP-index points below 0.3, in both libraries, were removed. The sliding window method was utilized to present the SNP-indexes for the entire genome. All SNP-indexes in a given window were averaged to obtain the SNP-index for that particular window. The window size of 1Mb and the step size of 1Kb were routinely utilized. The ∆ (SNP-index) was then calculated using the following formula: [SNP index (HAB bulk)—SNP index (LAB bulk)].

2.4. High-Throughput Genotyping of SNPs in Intra-Specific Mapping Individuals

In order to validate the BoPur QTL, obtained by QTL-seq, classical QTL mapping was performed, via the selection of the SNP, with a polymorphism between the genotypes of the parents (BT 126 and SN 60). Through the Hi-SNP method, a total of 33 SNPs, differentiating BT 126 and SN60, were utilized for validation and high-throughput genotyping in the F2 segregating population with 280 individuals and parents. The HI-SNP technology was developed by Shanghai BioWing Applied Biotechnology Company (http://www.biowing.com.cn/) (accessed on 9 June 2021) the genotyping of 33 SNPs was carried out by multiplex PCR with NGS on Illumina X-10 (Illumina, CA, USA) [41]. The genotyping primers were shown in the Supplementary Table S1. Based on the phenotypic and genotypic data, linkage maps were constructed by QTL IciMapMaker (Chinese Academy of Agricultural Sciences, Beijing, China) with a logarithm of the odds (LOD) value [42]. The LOD score is a measure of the strength of the evidence for the presence of a QTL at a particular location (the LOD score = log10 likelihood ratio, comparing single-QTL model to the “no QTL anywhere” mode).

2.5. Analysis of the Candidate Gene

To infer the gene regulation patterns of BoF3’H during anthocyanin biosynthesis, a qRT-PCR assay was performed. The RNA was isolated from BT 126 and SN60 at three head developmental stages, with both low and high anthocyanin contents. Reverse transcription was conducted using oligo-dT primers and PrimeScript™ RT Master Mix (Takara BIO, Inc., Shiga, Japan). The primer pair sequences for BoF3’H, BoANS2, and BoTTG1 used in this study were previously designed for the RT-qPCR analysis. BoLBD38.3-specific primers were designed based on the sequences in NCBI (accession number: XM_013739916). The qPCR primer pair sequences for BoLBD38.3 were 5′-GCCCAAACGGAGACGATTAG-3′ (forward) and 5′-AACCGTTCACTGGCGATGTG-3′ (reverse), gene-specific primers that were confirmed to produce specific gene products by sequencing [15]. Real-time PCR was performed using TB Green® Premix Ex Taq™ (Tli RNaseH Plus) (Takara, Dalian, China) on an ABI QuantStudio 5 real-time PCR system(Thermo Fisher Scientific, MA, USA) according to the manufacturer’s instructions. Actin was used as a reference gene [43]. The data were processed using the 2−ΔΔCt method [44]. Sequence data of BoF3’H can be found in the GenBank data libraries, under accession number XM_013751545.

3. Results

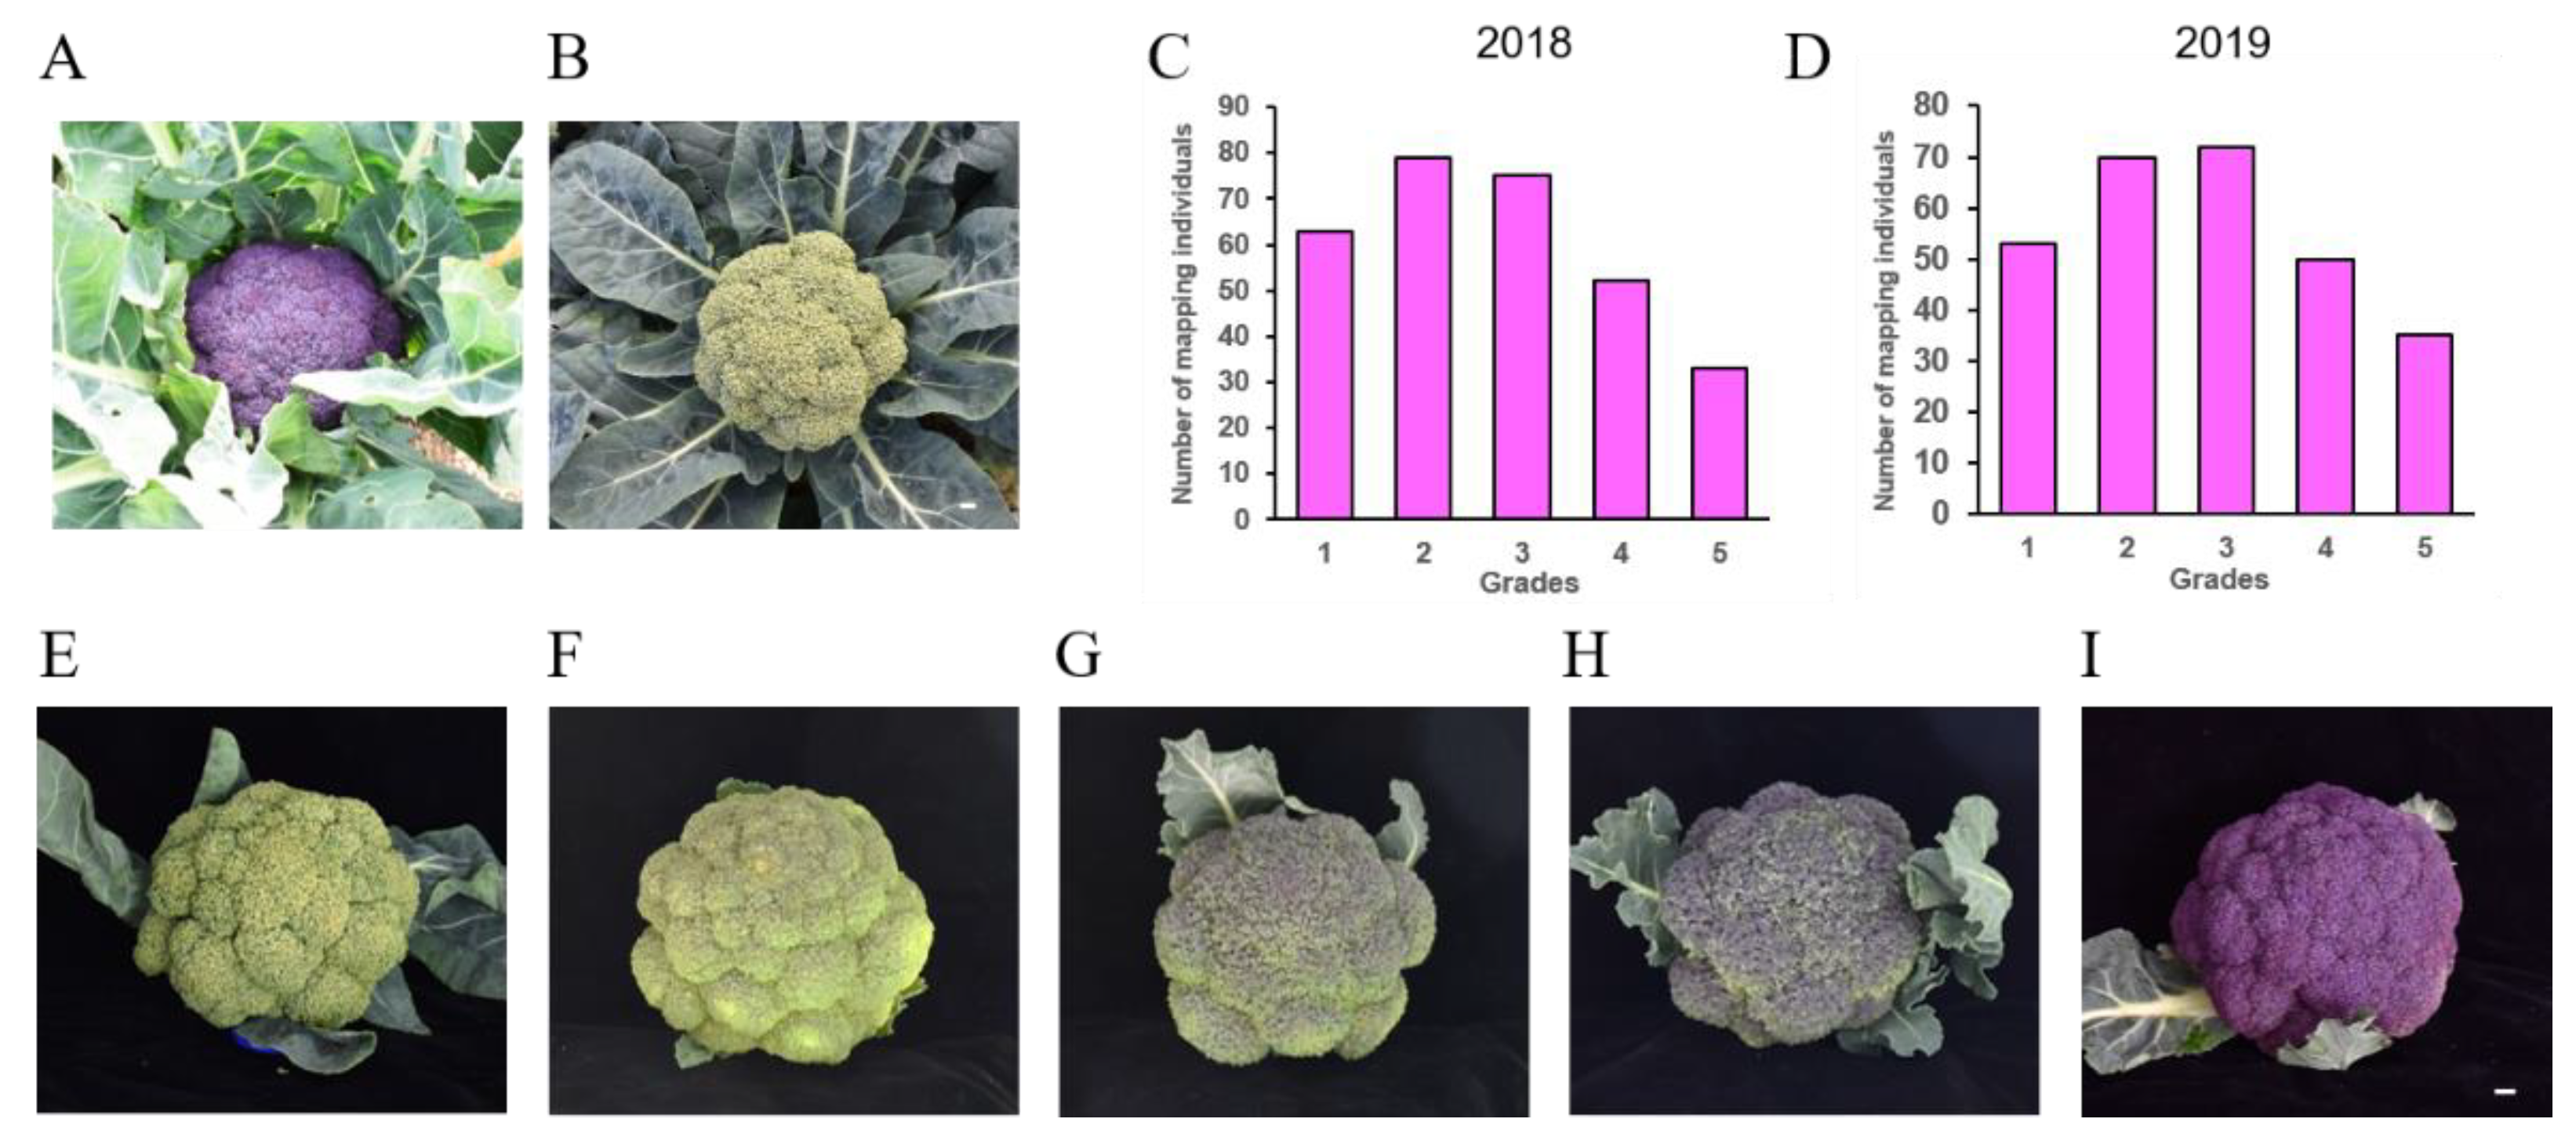
3.1. Inheritance of Head Color of BT 126 with SN 60

Significant differences in head color were observed among the BT 126 (parent 1, P1, purple head), SN 60 (parent 2, P2, green head), and F1 hybrids planted in 2018 and 2019 (Figure 1). The BT 126 purple line exhibited a high anthocyanin accumulation in the heads (5.72 mg/g FW) and developed normally when compared to green broccoli, under normal conditions, in the field and greenhouse [4]. It was crossed to SN 60, with very low anthocyanin content (0.241 mg/g FW), to generate the F1 progeny. F1 individuals displayed third grade color. As expected, the F2 population was divided into purple and green classes, with varying degrees of continuous distribution in 1st-5th color grades (Figure 1E–I). No transgressive segregation was observed in either direction of the parental genotype in the mapping population. We could infer that the purple trait was controlled by QTL.

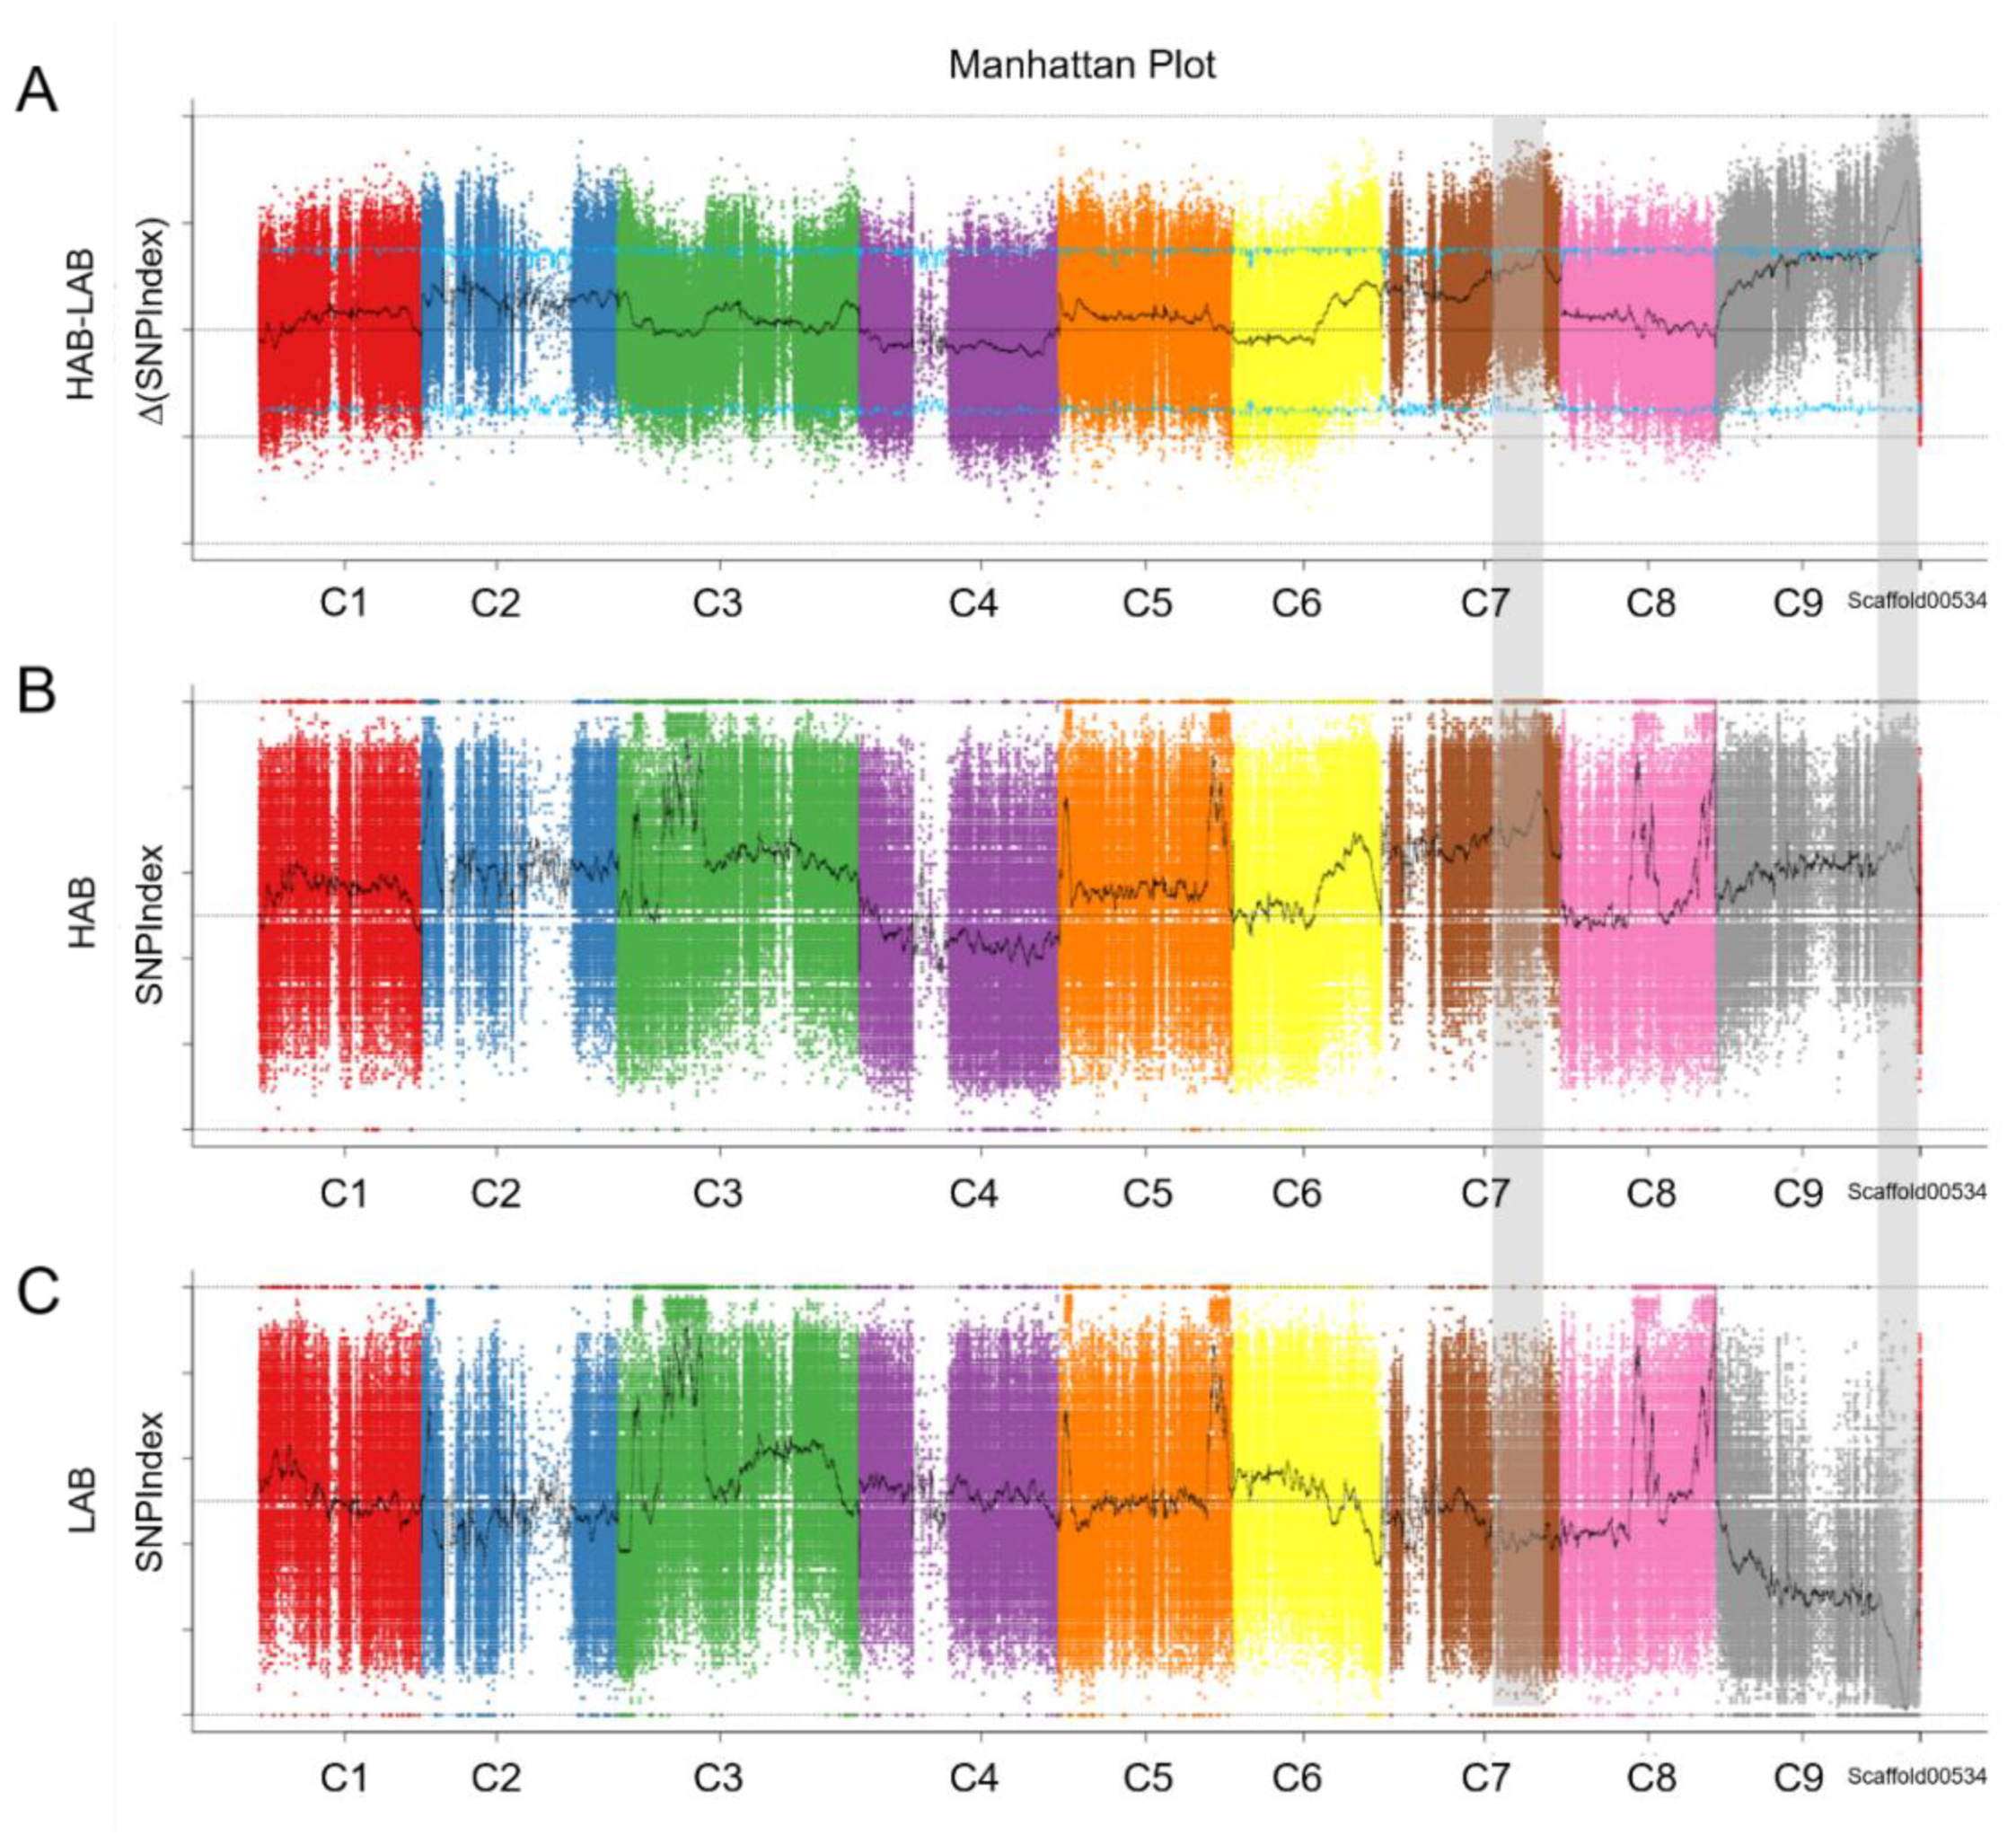
3.2. QTL-Seq Analysis

The high-throughput, whole-genome resequencing of both parents, as well as the LAB and HAB libraries, yielded 158.49 to 261.57 million reads per sample. Based on the B. oleracea reference genome (estimated genome size~630 Mb), the read mapping ratio was >93% (Table 1). The mean coverage of the reference genome, across all samples, was 33×. As depicted in Table 1, the 4× coverage of each specimen ranged from 86.85% to 92.43%. Meanwhile, the value of Q20 was above 93% in all specimens (data not shown). The comparative genome sequence analysis of the parental DNA and DNA bulks with the reference genome revealed 1,117,709 polymorphic SNPs.
The SNP-index of each SNP, that distinguished LAB from HAB, was determined. The mean SNP-index, covering 1 Mb genomic sequence, was assessed separately in LAB and HAB, by the 1 kb sliding window method, and mapped against all B. oleracea reference chromosomes (9 in total). The Δ (SNP-index) was determined by combining the SNP-index data of LAB and HAB and was plotted against the positions (Mb) on the B. oleracea genome. The QTL-seq analysis detected two major genomic regions on chromosomes 7 (36,784,249–44,791,849) (BoPur7.1) and 9 (46,217,406–52,600,419) (BoPur9.1), with significant associations with anthocyanin biosynthesis in broccoli (Figure 2). Moreover, LAB and HAB mapping plants with reduced or elevated anthocyanin biosynthesis had the majority of SNP alleles from SNP 1 to SNP 26 (Table S1). An important genomic region [BoSNP5 (46,217,406 bp) to BoSNP 26 (52,600,419 bp)] harboring the QTL Pur on chromosome 9 showed a Δ (SNP-index) that was markedly different from 0 (p < 0.05) (Figure 2A and Figure 3B). The QTL-seq data confirmed an important QTL (BoPur9.1) located at the 6.38 Mb genomic interval [46,217,406 (BoSNP 5) to 52,600,419 (BoSNP 26) bp] on chromosome 9, which was associated with the regulation of anthocyanin biosynthesis in broccoli.

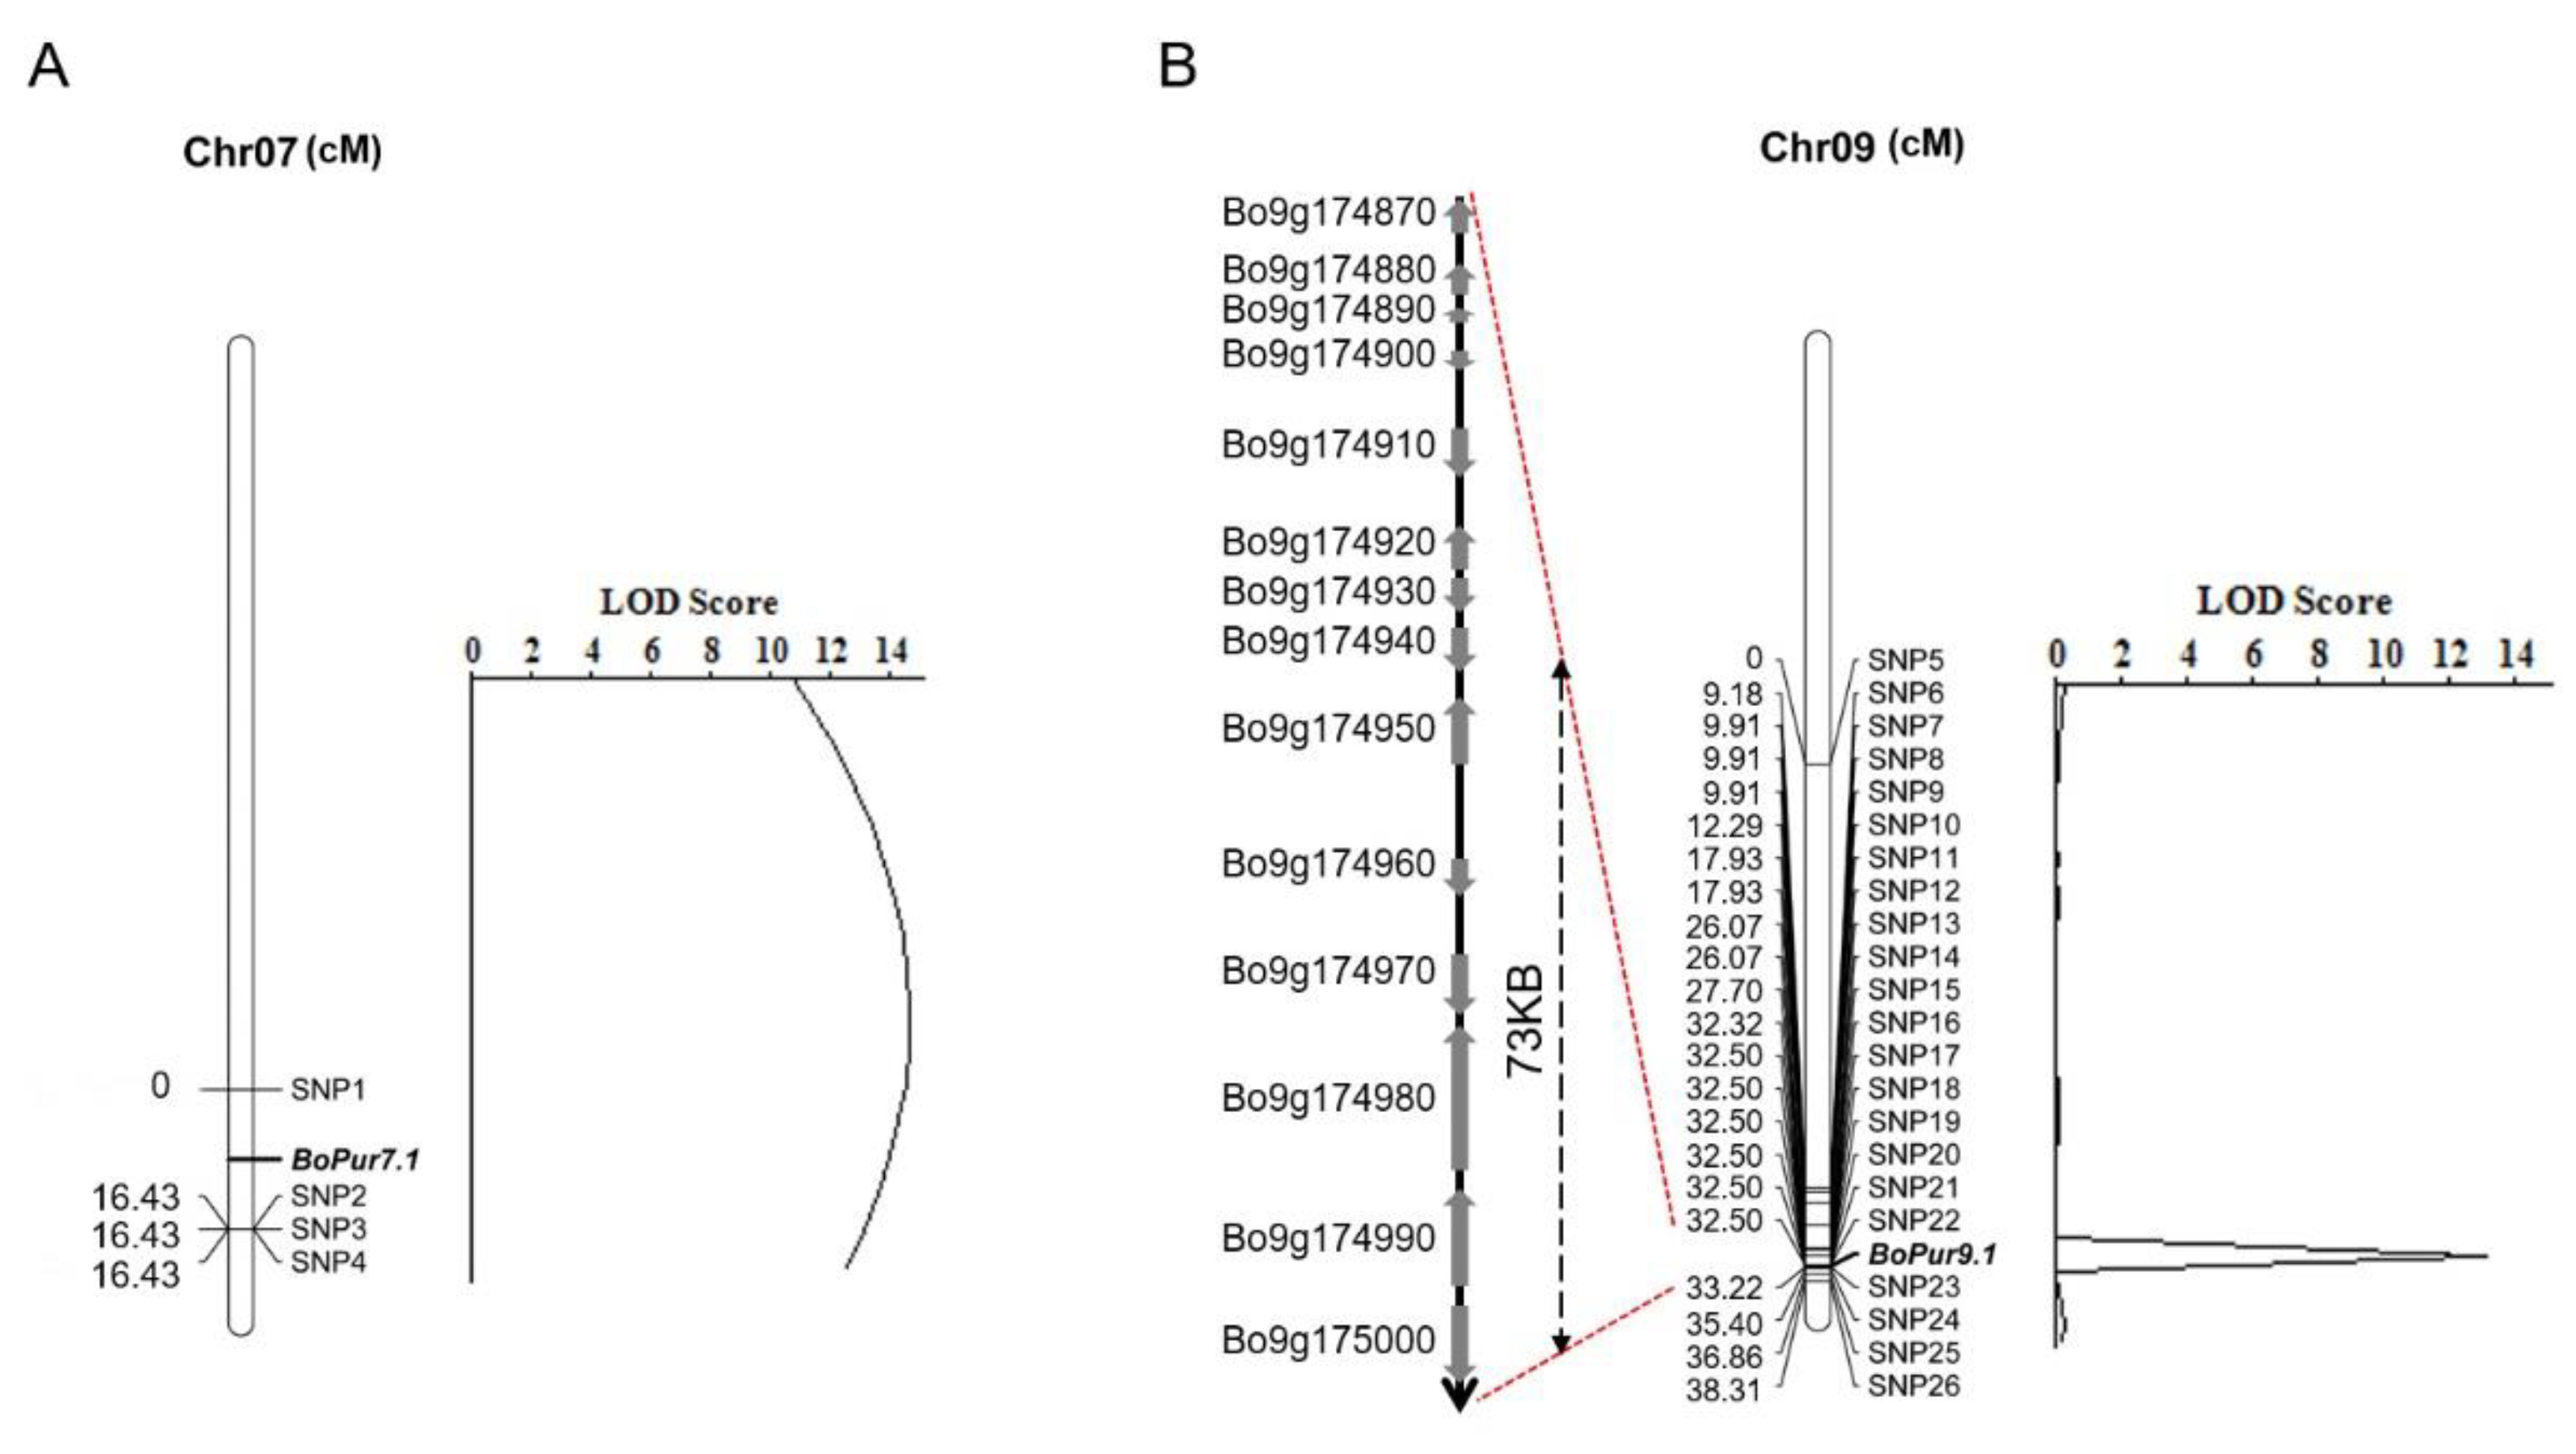
3.3. Validation of QTL-Seq-Derived Anthocyanin Biosynthesis QTL through High-Throughput SNP

To assess BoPur7.1 and BoPur9.1, detected by QTL-seq, a high-throughput SNP was carried out. The genotyping data of 26 SNP markers were mapped to a highly dense intraspecific genetic region of chromosomes 7 and 9, depicting polymorphisms between parental genotypes and between LAB and HAB, and were combined with phenotypic features of a second F2 mapping population with 280 individuals. Classical QTL analysis, based on interval mapping and composite interval mapping, revealed two highly important genomic regions: [BoSNP37 (32.5 cM) to BoSNP38 (33.22 cM)], harboring a potent (LOD: 13.1) Pur QTL (BoPur9.1) on broccoli chromosome 9, and [BoSNP1 (0 cM) to BoSNP2 (16.43 cM)], harboring a potent (LOD: 14.6) Pur QTL (BoPur7.1) on broccoli chromosome 7. The detected QTLs had an interval of 0.72 cM with 72,683 bp [BoSNP22 (51,716,244 bp) to BoSNP23 (51,788,927 bp)] on chromosome 9 and an interval of 16.43 cM with 6,920,903 bp [BoSNP1 (36,784,249 bp) to BoSNP2 (43,705,152 bp)] on chromosome 7 (Figure 3). The proportions of phenotypic variants caused by the BoPur9.1 and BoPur7.1 QTLs were 28.19% and 38.12%, respectively (Table 2).
To further delineate the BoPur9.1 QTL, the genotyping data of 17 selected SNP markers, the most tightly linked to BoPur9.1 (SNP10–SNP26), were analyzed in 580 F3 mapping individuals. Loci mapping analysis identified a major QTL for anthocyanin biosynthesis, designed by two SNP markers, including SNP22 and SNP23. This result was consistent with the QTL analysis supporting a major anthocyanin biosynthesis QTL BoPur9.1, which was located in the genomic interval of 51.71–51.79 Mb on chromosome 9 (Table S2).

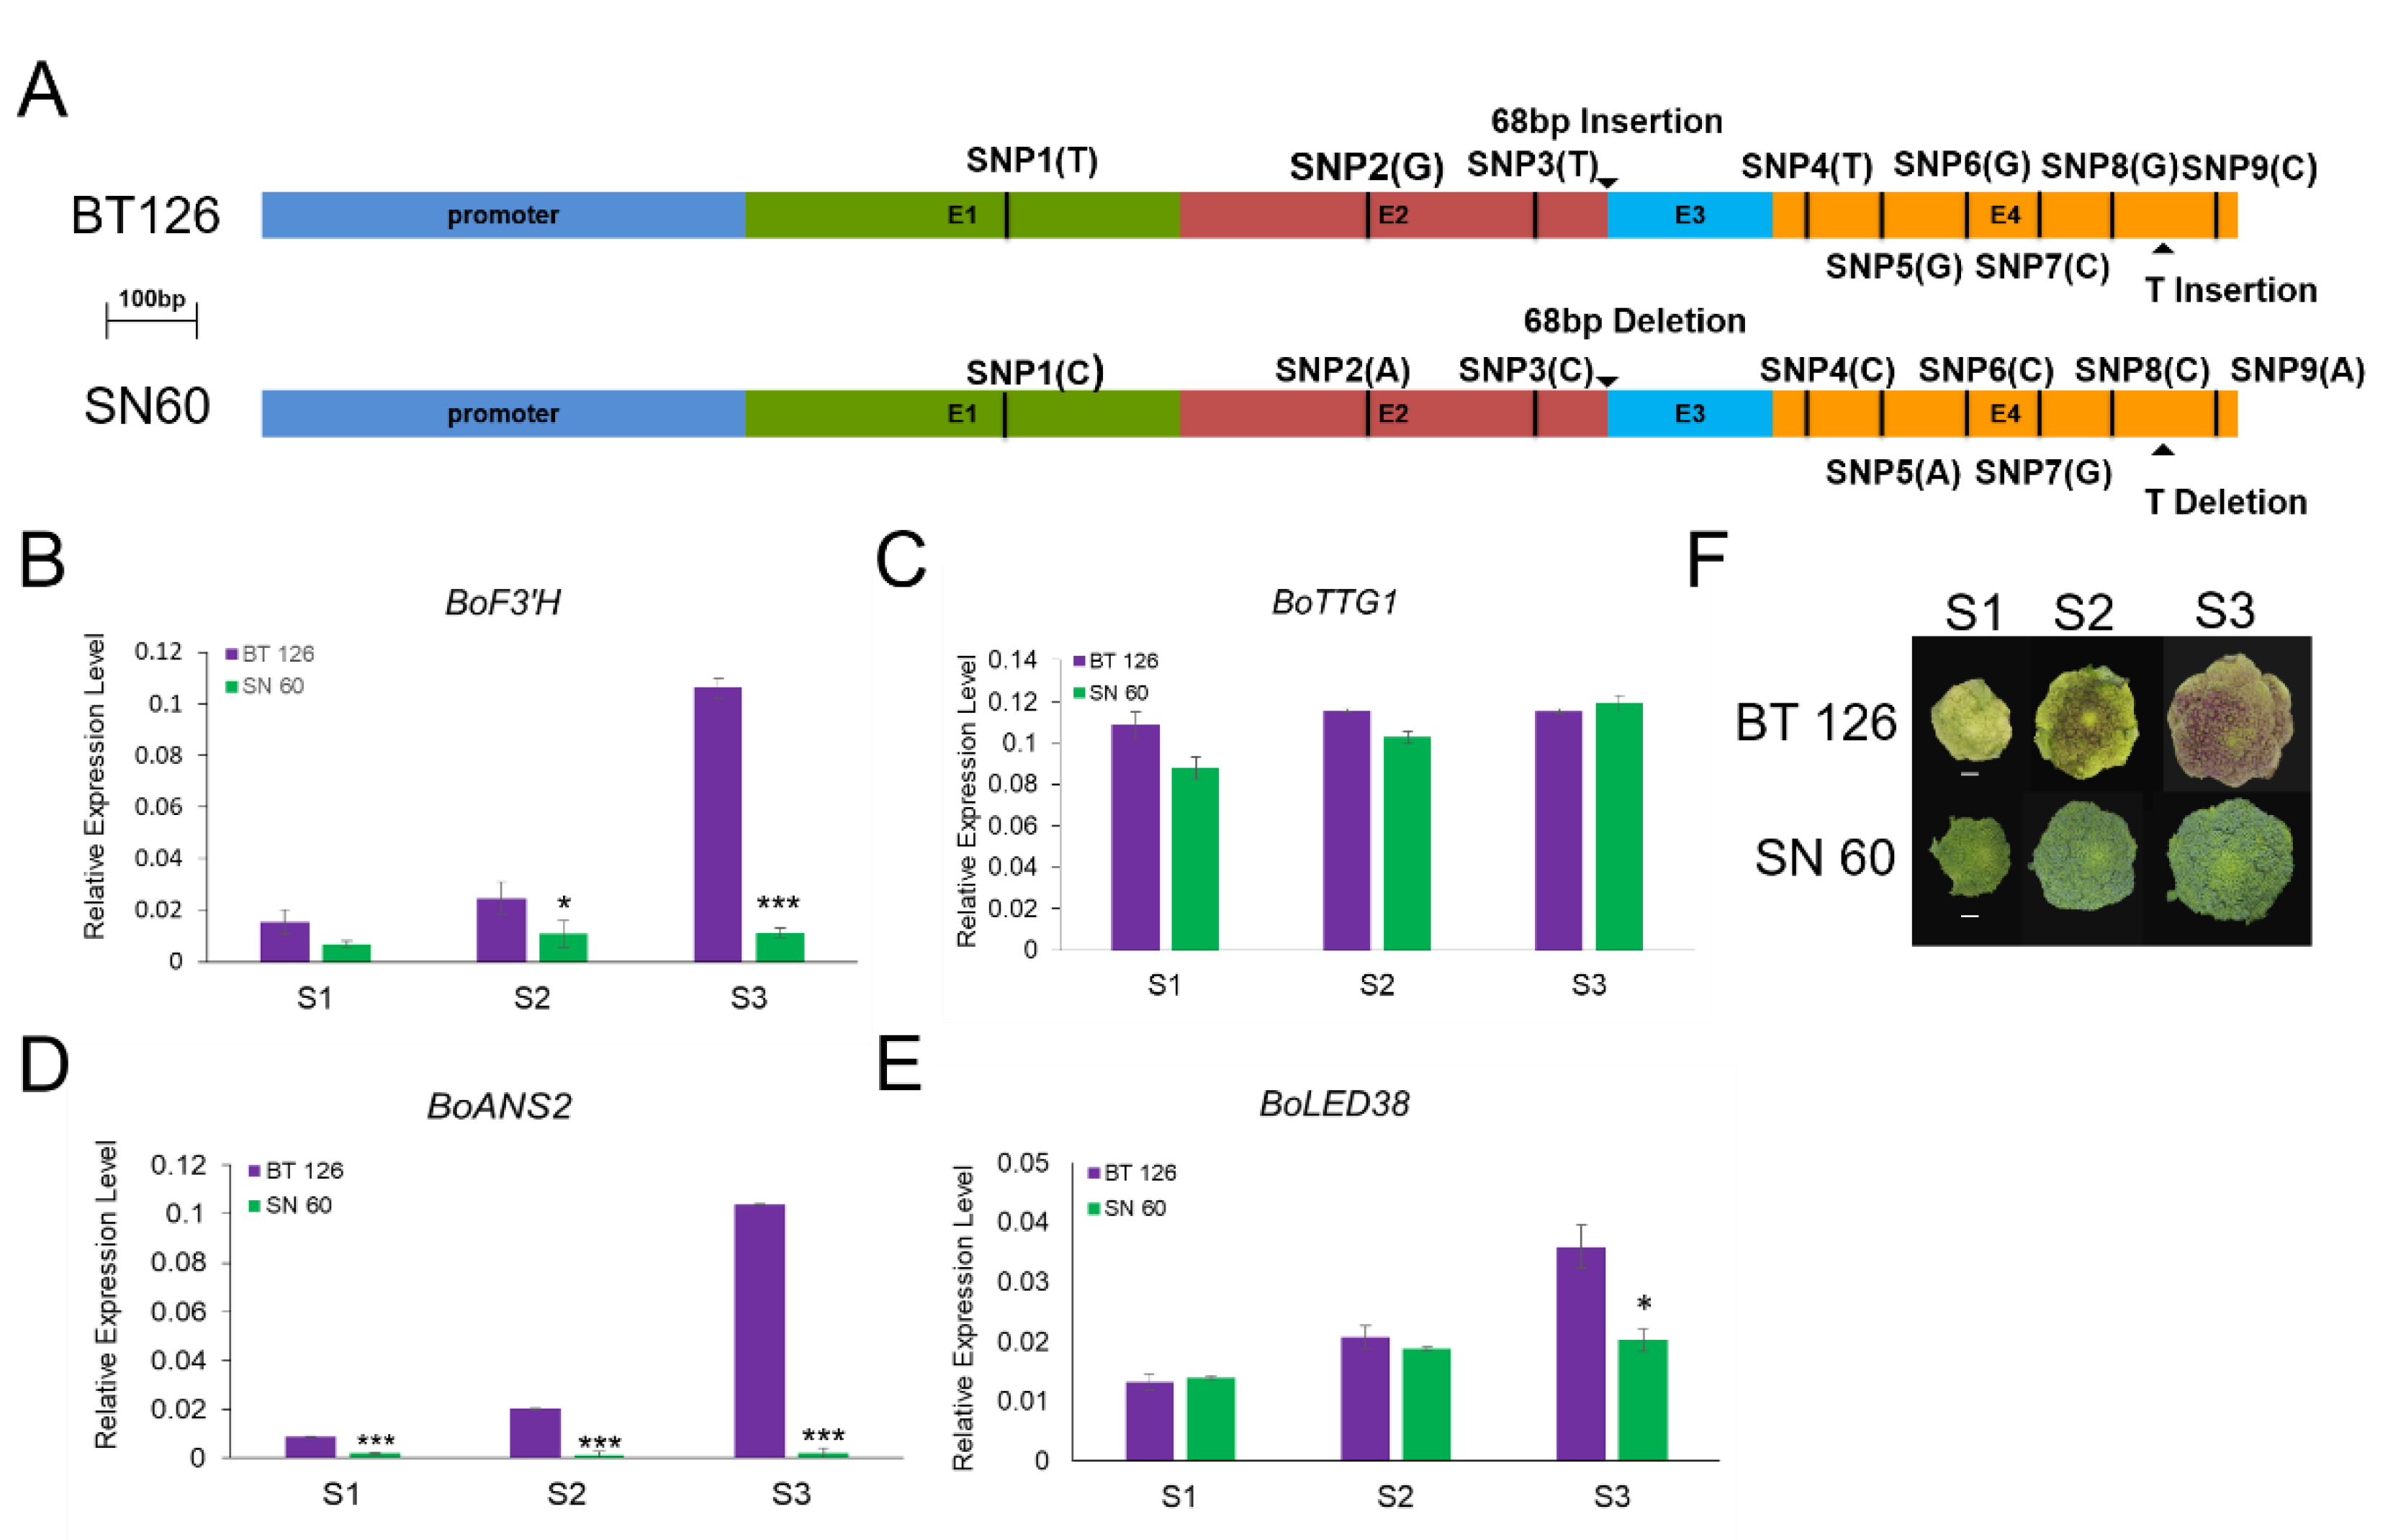
3.4. Prediction and Analysis of the Candidate Gene

Based on the B. oleracea genome databases (TO1000) (http://plants.ensembl.org/Brassica_oleracea) (accessed on 5 May 2021), a total of 3 anthocyanin-related and 14 predicted protein-coding genes were found in the interval of BoPur7.1 and BoPur9.1, respectively (Table 3). According to domain annotations from InterPro and BLASTX (best hit) analyses, two of these fourteen genes have not been annotated (Table 3). The other fifteen candidate genes were as follows: Bo7g096780 (homologous gene AT5G24520), encoding the transparent testa glabra 1; Bo7g099150 (homologous gene AT3G49940), encoding the LOB domain-containing protein 38; Bo7g108300 (homologous gene AT4G22880), encoding the anthocyanin synthase; Bo9g174870 (homologous gene AT5G08000), encoding the X8-GPI family of proteins; Bo9g174880, Bo9g174890, and Bo9g174900 (homologous gene AT5G07990), encoding flavonoid 3′ hydroxylase (F3’H), which catalyzed the conversion of dihydrokaempferol to dihydroquercetin in anthocyanin biosynthesis [45]; Bo9g174920 (homologous gene AT5G07960), encoding the Asterix-like protein; Bo9g174940 (homologous gene AT5G07890), encoding the myosin heavy chain-like protein; Bo9g174950 (homologous gene AT5G07830), encoding the glucuronidase 2; Bo9g174960 (homologous gene AT5G07820), encoding the calmodulin-binding, protein-like protein; Bo9g174970 (homologous gene AT5G07800), encoding the flavin-containing monooxygenase; and Bo9g174980, Bo9g174990, and Bo9g175000 (homologous gene AT5G07740), encoding the actin-binding protein. BoF3’H was annotated as a homologue of the anthocyanin biosynthesis gene.
A primer pair, spanning the full-length CDS of BoF3’H was designed, and PCR was performed using the cDNA of BT 126 and SN 60 as a template. DNA sequencing revealed that the full-length of BoF3’H in purple-head SN 60 is 1669 bp, whereas it was 1600 bp in green-head SN 60. Compared with BoF3’H in BT 126, a deletion of 68 bp and 1bp was found at nucleotide 1080 and 1501, respectively, and nine SNPs were present in SN60 (sequences of BT 126 and SN60 were illustrated in Table S3). The polymorphism of the candidate gene BoF3’H was further confirmed in the segregating population. To delineate the potential candidate genes regulating the anthocyanin biosynthesis in broccoli, differ-ential expression profiling of BoF3’H was performed in two parental lines, at three head developmental stages. The expression of BoF3’H, BoANS2, and BoLED38 in BT 126 were up-regulated at three head developmental stages of anthocyanin accumulation, and the expression levels were significantly higher than those in SN60 (Figure 4B–F).

4. Discussion

Increasing the anthocyanin content in Brassica vegetables represents an important goal for nutriment breeding. This work discovered two important genomic regions harboring anthocyanin biosynthesis QTLs BoPur7.1 and Bopur9.1 on chromosomes 7 and 9, based on intra-specific broccoli mapping individuals, through whole-genome NGS-based, high-throughput QTL-seq. The two QTL-seq-derived Pur QTLs were subsequently verified by Hi-SNP analysis. In previous studies, a major locus was reported to control anthocyanin pigmentation. In purple cauliflower (B. oleracea var botrytis), a Pur gene, encoding the transcription factor R2R3 MYB, was isolated [43]. Broccoli flower head’s purple sepal trait is regulated by a major loci and two minor loci on chromosome C01 [20]. The purple gene of non-heading Chinese cabbage is subject to a single dominant inheritance mode but does not follow the Mendel law [33]. Due to the considerable variations in anthocyanin content, a novel locus was mapped in the linkage group R07 in purple turnip plants [46]. Moreover, a single dominant gene on C09, named BoPr, was reported to control anthocyanin pigmentation in leaves. The physical region of the C09 QTL was from 19,018,694 to 24,359,626 (5.3 Mb in internal length), which was different from our major QTLs for head anthocyanin contents. The major locus on C09 from 51,716,244 to 51,788,927 was included in this study. This indicates a population-specific inheritance modality for certain QTLs controlling anthocyanin biosynthesis in the Brassica species. Hence, the integrated approach developed here could be used for rapidly identifying the target QTLs, important genes, and/or alleles involved in the qualitative and quantitative traits of various crops. Diverse models of purple traits, related to anthocyanins, may come from different genetic backgrounds. The purple gene in ornamental kale (B. oleracea L. var. acephala) shows a single dominant inheritance pattern on chromosome C09, and Bo9g058630 encoding dihydroflavonol 4-reductase (DFR) was considered to be a candidate gene [22].
Combining QTL-seq with Hi-SNP analysis, the 0.73 Mb QTL Bopur9.1 region [BoSNP37 (51,716,244 bp) to BoSNP38 (51,788,927 bp)], encompassing 14 genes, was detected on chromosome 9, which accounted for ∼28.19% of all phenotypic variations in anthocyanin biosynthesis. Among these genes, according to their respective annotations (Table 3), three genes, Bo9g174880, Bo9g174890, and Bo9g174900 were homologues of Arabidopsis F3’H, encoding flavanone 3′-hydroxylase. The BoF3’H gene has been suggested to have played a critical role in modifying plant coloration [45], which contained a coding sequence length of 1536 bp and encoded a protein of 511 amino acids with four exons. All of the 3 candidate genes became aligned to the different regions of BoF3’H. An increased expression of F3’H was found to be responsible for anthocyanin production in a number of anthocyanin-accumulating mutants. For example, the ectopic expression of apple MdF3’H can increase the production of flavonols and cyanidin-based pigments in the Arabidopsis tt7 mutant, under nitrogen pressure [47]. The VvF3’H gene was identified from grapevine, and its ectopic expression results in high accumulation levels of anthocyanin and flavonols in the petunia ht1 mutant line [48]. OsF3’H editing in the Heugseonchal or Sinmyungheugchal variety, using the CRISPR/Cas9 system, might be responsible for ocher seeds with lower anthocyanin contents than wild-type black rice plants [49]. Two copies of the F3’H gene were isolated in the barley genome and exhibited a tissue-specific expression pattern of anthocyanin synthesis [50]. Furthermore, nine SNPs and a 68-bp insertion, between the 3rd and 4rd exon of BoF3’H CDS sequences, were found, which may cause a gain-of-function mutation (Figure 4A). The 68 bp InDel was in the open reading frame (between E3 and E4), as well as the T InDel in the 3′ end. Therefore, a frame shift is expected, resulting in a putative truncated or extended protein. In addition, since most enzymes had conserved regions, anthocyanin discoloration might occur, as a result of BoF3’H enzyme inactivity, due to one of the two isoforms. In addition, the 6.92 Mb QTL Bopur7.1 region [BoSNP1 (36,784,249 bp) to BoSNP2 (43,705,152 bp)], encompassing 3 anthocyanin-related genes, was detected on chromosome 7, which accounted for ∼38.12% of all phenotypic variations in anthocyanin biosynthesis. Among these genes, BoANS2 and BoLED38 were activated at three head developmental stages of anthocyanin accumulation [12,13]. However, further experiments involving transformation are needed to verify whether the function of this gene is responsible for the purple head in broccoli.
Most of the agronomic traits are controlled by multiple QTLs. The traditional QTL fine-mapping method usually requires several generations of backcrossing, screening of a large population for recombinants and exhaustive field phenotyping, which is both time-consuming and labor-intensive [51]. Although the genotyping-by-sequencing (GBS) approach has been shown to be an efficient way to develop high-resolution genetic mapping [52], the genotyping of a large population with genome-wide markers is expensive. It is important to note that the QTL-seq approach has been successfully used to conduct a BSA analysis, as well as deployed for the mapping of a segregated population of homozygous parental lines with opposite phenotypes. Using QTL-seq, only two samples need to be sequenced. The sequence coverage is decided by genome size and complexity, but as an example for broccoli, sufficient data could be generated by sequencing each bulk to 30× coverage. Further, it’s an effective method to identify markers most tightly linked to the trait.
In this study, two identified QTLs were distributed on chromosome 7 and 9, respectively. The purple intensity and size of the heading leaves had great variations among F2 individuals. The anthocyanin content of purple head BT 126 was also affected by the temperature condition. Therefore, environmental factors might have an important effect on anthocyanin synthesis. The genetic mechanism of anthocyanin biosynthesis is complex. Candidate genes that control the purple trait may be different in diverse genetic backgrounds and may have different spatial and temporal expression patterns.
In summary, the above findings indicated that combining QTL-seq, Hi-SNP analysis and differential gene expression profiling might help identify candidate genes manipulating anthocyanin biosynthesis at major QTL intervals in broccoli. Bo9g174880, Bo9g174890, and Bo9g174900 were first selected as the strong candidate genes at the BoPur locus. The functional assessment of the candidate gene homologs, identified within the confidence intervals of both QTLs, would provide novel insights into the detailed mechanisms of anthocyanin biosynthesis in broccoli.

Supplementary Materials

The following are available online at https://www.mdpi.com/article/10.3390/horticulturae7080246/s1. Table S1: SNPs genetically mapped on chromosome 7 and 9, used for anthocyanin biosynthesis targeted QTL-seq in broccoli; Table S2: quantitative trait loci (p < 0.05), associated with anthocyanin biosynthesis in F3 population; Table S3: sequences of BT 126 and SN60.

Author Contributions

Conceptualization, Z.X.; methodology, C.L. and X.Y.; investigation, C.L., L.H., and X.W.; resources, X.Y. and G.L.; data curation, C.L.; writing—original draft preparation, C.L.; writing—review and editing, Z.X.; supervision, Z.X.; funding acquisition, Z.X. and X.Y. All authors have read and agreed to the published version of the manuscript.

Funding

This research was funded by the Shanghai Agriculture Applied Technology Development Program, grant number G2016060105” and the Youth Talent Development Plan of Shanghai Municipal Agricultural System, grant number 20180116.

Institutional Review Board Statement

Not applicable.

Informed Consent Statement

Not applicable.

Data Availability Statement

Not applicable.

Acknowledgments

We acknowledge Bin Wang, Shanghai BioWing Applied Biotechnology Company, China for the kind help in data analysis.

Conflicts of Interest

The authors declare no conflict of interest.

References

  1. Sun, D.; Wang, C.; Zhang, X.; Zhang, W.; Jiang, H.; Yao, X.; Liu, L.; Wen, Z.; Niu, G.; Shan, X. Draft genome sequence of cauliflower (Brassica oleracea L. var. botrytis) provides new insights into the C genome in Brassica species. Hortic. Res. 2019, 6, 1–11. [Google Scholar] [CrossRef] [PubMed] [Green Version]
  2. Fahey, J.W.; Holtzclaw, W.D.; Wehage, S.L.; Wade, K.; Stephenson, K.K.; Talalay, P. Sulforaphane Bioavailability from Glucoraphanin-Rich Broccoli: Control by Active Endogenous Myrosinase. PLoS ONE 2015, 10, e0140963. [Google Scholar] [CrossRef] [Green Version]
  3. Rodríguez-Hernández, M.d.C.; Moreno, D.A.; Carvajal, M.; García-Viguera, C.; Martínez-Ballesta, M.d.C. Natural antioxidants in purple sprouting broccoli under Mediterranean climate. J. Food Sci. 2012, 77, C1058–C1063. [Google Scholar] [CrossRef] [PubMed]
  4. Liu, C.; Yao, X.; Li, G.; Huang, L.; Xie, Z. Transcriptomic profiling of purple broccoli reveals light-induced anthocyanin biosynthetic signaling and structural genes. PeerJ 2020, 8, e8870. [Google Scholar] [CrossRef]
  5. Steyn, W.J.; Wand, S.J.E.; Holcroft, D.M.; Jacobs, G. Anthocyanins in vegetative tissues: A proposed unified function in photoprotection. New Phytol. 2002, 155, 349–361. [Google Scholar] [CrossRef] [PubMed]
  6. Pourcel, L.; Routaboul, J.-M.; Cheynier, V.; Lepiniec, L.; Debeaujon, I. Flavonoid oxidation in plants: From biochemical properties to physiological functions. Trends Plant Sci. 2007, 12, 29–36. [Google Scholar] [CrossRef]
  7. Lev-Yadun, S.; Gould, K.S. Role of Anthocyanins in Plant Defence. In Anthocyanins; Springer: Berlin, Germany, 2008; pp. 22–28. [Google Scholar] [CrossRef]
  8. Shi, M.-Z.; Xie, D.-Y. Biosynthesis and metabolic engineering of anthocyanins in Arabidopsis thaliana. Recent Pat. Biotechnol. 2014, 8, 47–60. [Google Scholar] [CrossRef] [Green Version]
  9. Sun, C.; Deng, L.; Du, M.; Zhao, J.; Chen, Q.; Huang, T.; Jiang, H.; Li, C.-B.; Li, C. A Transcriptional Network Promotes Anthocyanin Biosynthesis in Tomato Flesh. Mol. Plant 2020, 13, 42–58. [Google Scholar] [CrossRef]
  10. Liu, X.; Li, S.; Yang, W.; Mu, B.; Jiao, Y.; Zhou, X.; Zhang, C.; Fan, Y.; Chen, R. Synthesis of Seed-Specific Bidirectional Promoters for Metabolic Engineering of Anthocyanin-Rich Maize. Plant Cell Physiol. 2018, 59, 1942–1955. [Google Scholar] [CrossRef] [Green Version]
  11. Li, J.; Ren, L.; Gao, Z.; Jiang, M.; Liu, Y.; Zhou, L.; He, Y.; Chen, H. Combined transcriptomic and proteomic analysis constructs a new model for light-induced anthocyanin biosynthesis in eggplant (Solanum melongena L.). Plant Cell Environ. 2017, 40, 3069–3087. [Google Scholar] [CrossRef]
  12. Guo, N.; Cheng, F.; Wu, J.; Liu, B.; Zheng, S.; Liang, J.; Wang, X. Anthocyanin biosynthetic genes in Brassica rapa. BMC Genom. 2014, 15, 426. [Google Scholar] [CrossRef] [PubMed] [Green Version]
  13. Goswami, G.; Nath, U.K.; Park, J.-I.; Hossain, M.R.; Biswas, M.K.; Kim, H.-T.; Kim, H.R.; Nou, I.-S. Transcriptional regulation of anthocyanin biosynthesis in a high-anthocyanin resynthesized Brassica napus cultivar. J. Biol. Res. Thessalon. 2018, 25, 19. [Google Scholar] [CrossRef] [PubMed]
  14. Yuan, Y.; Chiu, L.-W.; Li, L. Transcriptional regulation of anthocyanin biosynthesis in red cabbage. Planta 2009, 230, 1141–1153. [Google Scholar] [CrossRef]
  15. Chiu, L.-W.; Zhou, X.; Burke, S.; Wu, X.; Prior, R.L.; Li, L. The Purple Cauliflower Arises from Activation of a MYB Transcription Factor. Plant Physiol. 2010, 154, 1470–1480. [Google Scholar] [CrossRef] [Green Version]
  16. He, Q.; Wu, J.; Xue, Y.; Zhao, W.; Li, R.; Zhang, L. The novel gene BrMYB2, located on chromosome A07, with a short intron 1 controls the purple-head trait of Chinese cabbage (Brassica rapa L.). Hortic. Res. 2020, 7, 1–19. [Google Scholar] [CrossRef] [PubMed]
  17. Song, H.; Yi, H.; Lee, M.; Han, C.-T.; Lee, J.; Kim, H.; Park, J.-I.; Nou, I.-S.; Kim, S.-J.; Hur, Y. Purple Brassica oleracea var. capitata F. rubra is due to the loss of BoMYBL2–1 expression. BMC Plant Biol. 2018, 18, 82. [Google Scholar] [CrossRef]
  18. He, Q.; Ren, Y.; Zhao, W.; Li, R.; Zhang, L. Low Temperature Promotes Anthocyanin Biosynthesis and Related Gene Expression in the Seedlings of Purple Head Chinese Cabbage (Brassica rapa L.). Genes 2020, 11, 81. [Google Scholar] [CrossRef] [Green Version]
  19. Kim, S.; Hwang, G.; Lee, S.; Zhu, J.-Y.; Paik, I.; Nguyen, T.T.; Kim, J.; Oh, E. High Ambient Temperature Represses Anthocyanin Biosynthesis through Degradation of HY5. Front. Plant Sci. 2017, 8, 1787. [Google Scholar] [CrossRef] [Green Version]
  20. Yu, H.; Wang, J.; Sheng, X.; Zhao, Z.; Shen, Y.; Branca, F.; Gu, H. Construction of a high-density genetic map and identification of loci controlling purple sepal trait of flower head in Brassica oleracea L. italica. BMC Plant Biol. 2019, 19, 228. [Google Scholar] [CrossRef] [Green Version]
  21. Zhu, P.; Cheng, M.; Feng, X.; Xiong, Y.; Liu, C.; Kang, Y. Mapping of Pi, a gene conferring pink leaf in ornamental kale (Brassica oleracea L. var. acephala DC). Euphytica 2015, 207, 377–385. [Google Scholar] [CrossRef]
  22. Liu, X.-P.; Gao, B.-Z.; Han, F.-Q.; Fang, Z.-Y.; Yang, L.-M.; Zhuang, M.; Lv, H.-H.; Liu, Y.-M.; Li, Z.-S.; Cai, C.-C.; et al. Genetics and fine mapping of a purple leaf gene, BoPr, in ornamental kale (Brassica oleracea L. var. acephala). BMC Genom. 2017, 18, 230. [Google Scholar] [CrossRef] [PubMed] [Green Version]
  23. Li, G.-H.; Chen, H.-C.; Liu, J.-L.; Luo, W.-L.; Xie, D.-S.; Luo, S.-B.; Wu, T.-Q.; Akram, W.; Zhong, Y.-J. A high-density genetic map developed by specific-locus amplified fragment (SLAF) sequencing and identification of a locus controlling anthocyanin pigmentation in stalk of Zicaitai (Brassica rapa L. ssp. chinensis var. purpurea). BMC Genom. 2019, 20, 343. [Google Scholar] [CrossRef]
  24. Wu, J.; Zhao, J.; Qin, M.; Ren, Y.; Zhang, H.; Dai, Z.; Hao, L.; Zhang, L. Genetic Analysis and Mapping of the Purple Gene in Purple Heading Chinese Cabbage. Hortic. Plant J. 2016, 2, 351–356. [Google Scholar] [CrossRef]
  25. Michelmore, R.W.; Paran, I.; Kesseli, R.V. Identification of markers linked to disease-resistance genes by bulked segregant analysis: A rapid method to detect markers in specific genomic regions by using segregating populations. Proc. Natl. Acad. Sci. USA 1991, 88, 9828–9832. [Google Scholar] [CrossRef] [Green Version]
  26. Takagi, H.; Abe, A.; Yoshida, K.; Kosugi, S.; Natsume, S.; Mitsuoka, C.; Uemura, A.; Utsushi, H.; Tamiru, M.; Takuno, S.; et al. QTL-seq: Rapid mapping of quantitative trait loci in rice by whole genome resequencing of DNA from two bulked populations. Plant J. 2013, 74, 174–183. [Google Scholar] [CrossRef] [PubMed]
  27. Pandey, M.K.; Khan, A.W.; Singh, V.K.; Vishwakarma, M.K.; Shasidhar, Y.; Kumar, V.; Garg, V.; Bhat, R.S.; Chitikineni, A.; Janila, P. QTL-seq approach identified genomic regions and diagnostic markers for rust and late leaf spot resistance in groundnut (A rachis hypogaea L.). Plant Biotechnol. J. 2017, 15, 927–941. [Google Scholar] [CrossRef] [Green Version]
  28. Clevenger, J.; Chu, Y.; Chavarro, C.; Botton, S.; Culbreath, A.; Isleib, T.G.; Holbrook, C.C.; Ozias-Akins, P. Mapping Late Leaf Spot Resistance in Peanut (Arachis hypogaea) Using QTL-seq Reveals Markers for Marker-Assisted Selection. Front. Plant Sci. 2018, 9, 83. [Google Scholar] [CrossRef] [Green Version]
  29. Branham, S.E.; Farnham, M.W. Identification of heat tolerance loci in broccoli through bulked segregant analysis using whole genome resequencing. Euphytica 2019, 215, 34. [Google Scholar] [CrossRef]
  30. Fall, L.A.; Clevenger, J.; McGregor, C. Assay development and marker validation for marker assisted selection of Fusarium oxysporum f. sp. niveum race 1 in watermelon. Mol. Breed. 2018, 38, 130. [Google Scholar] [CrossRef]
  31. Lu, H.; Lin, T.; Klein, J.; Wang, S.; Qi, J.; Zhou, Q.; Sun, J.; Zhang, Z.; Weng, Y.; Huang, S. QTL-seq identifies an early flowering QTL located near Flowering Locus T in cucumber. Theor. Appl. Genet. 2014, 127, 1491–1499. [Google Scholar] [CrossRef] [PubMed]
  32. Illa-Berenguer, E.; Van Houten, J.; Huang, Z.; Van Der Knaap, E. Rapid and reliable identification of tomato fruit weight and locule number loci by QTL-seq. Theor. Appl. Genet. 2015, 128, 1329–1342. [Google Scholar] [CrossRef] [PubMed]
  33. Zhang, Y.; Hu, Z.; Zhu, M.; Zhu, Z.; Wang, Z.; Tian, S.; Chen, G. Anthocyanin accumulation and molecular analysis of correlated genes in purple kohlrabi (Brassica oleracea var. gongylodes L.). J. Agric. Food Chem. 2015, 63, 4160–4169. [Google Scholar] [CrossRef] [PubMed]
  34. Tang, Q.; Tian, M.; An, G.; Zhang, W.; Chen, J.; Yan, C. Rapid identification of the purple stem (Ps) gene of Chinese kale (Brassica oleracea var. alboglabra) in a segregation distortion population by bulked segregant analysis and RNA sequencing. Mol. Breed. 2017, 37, 153. [Google Scholar] [CrossRef]
  35. Porebski, S.; Bailey, L.G.; Baum, B.R. Modification of a CTAB DNA extraction protocol for plants containing high polysaccharide and polyphenol components. Plant Mol. Biol. Rep. 1997, 15, 8–15. [Google Scholar] [CrossRef]
  36. Li, H.; Durbin, R. Fast and accurate short read alignment with Burrows-Wheeler transform. Bioinformatics 2009, 25, 1754–1760. [Google Scholar] [CrossRef] [Green Version]
  37. Yu, J.; Zhao, M.; Wang, X.; Tong, C.; Huang, S.; Tehrim, S.; Liu, Y.; Hua, W.; Liu, S. Bolbase: A comprehensive genomics database for Brassica oleracea. BMC Genom. 2013, 14, 664. [Google Scholar] [CrossRef] [Green Version]
  38. Li, H.; Handsaker, R.; Wysoker, A.; Fennell, T.; Ruan, J.; Homer, N.; Marth, G.; Abecasis, G.; Durbin, R. The Sequence Alignment/Map format and SAMtools. Bioinformatics 2009, 25, 2078–2079. [Google Scholar] [CrossRef] [Green Version]
  39. McKenna, A.; Hanna, M.; Banks, E.; Sivachenko, A.; Cibulskis, K.; Kernytsky, A.; Garimella, K.; Altshuler, D.; Gabriel, S.B.; Daly, M.J.; et al. The Genome Analysis Toolkit: A MapReduce framework for analyzing next-generation DNA sequencing data. Genome Res. 2010, 20, 1297–1303. [Google Scholar] [CrossRef] [Green Version]
  40. Wang, K.; Li, M.; Hakonarson, H. ANNOVAR: Functional annotation of genetic variants from high-throughput sequencing data. Nucleic Acids Res. 2010, 38, e164. [Google Scholar] [CrossRef] [PubMed]
  41. Chen, K.; Zhou, Y.-X.; Li, K.; Qi, L.-X.; Zhang, Q.-F.; Wang, M.-C.; Xiao, J.-H. A novel three-round multiplex PCR for SNP genotyping with next generation sequencing. Anal. Bioanal. Chem. 2016, 408, 4371–4377. [Google Scholar] [CrossRef] [PubMed]
  42. Meng, L.; Li, H.; Zhang, L.; Wang, J. QTL IciMapping: Integrated software for genetic linkage map construction and quantitative trait locus mapping in biparental populations. Crop. J. 2015, 3, 269–283. [Google Scholar] [CrossRef] [Green Version]
  43. Chiu, L.-W.; Li, L. Characterization of the regulatory network of BoMYB2 in controlling anthocyanin biosynthesis in purple cauliflower. Planta 2012, 236, 1153–1164. [Google Scholar] [CrossRef] [PubMed]
  44. Livak, K.J.; Schmittgen, T.D. Analysis of relative gene expression data using real-time quantitative PCR and the 2− ΔΔCT method. Methods 2001, 25, 402–408. [Google Scholar] [CrossRef] [PubMed]
  45. Schoenbohm, C.; Martens, S.; Eder, C.; Forkmann, G.; Weisshaar, B. Identification of the Arabidopsis thaliana Flavonoid 3′-Hydroxylase Gene and Functional Expression of the Encoded P450 Enzyme. Biol. Chem. 2000, 381, 749–753. [Google Scholar] [CrossRef] [PubMed]
  46. Hayashi, K.; Matsumoto, S.; Tsukazaki, H.; Kondo, T.; Kubo, N.; Hirai, M. Mapping of a novel locus regulating anthocyanin pigmentation in Brassica rapa. Breed. Sci. 2010, 60, 76–80. [Google Scholar] [CrossRef] [Green Version]
  47. Han, Y.; Vimolmangkang, S.; Soria-Guerra, R.E.; Rosales-Mendoza, S.; Zheng, D.; Lygin, A.V.; Korban, S.S. Ectopic Expression of Apple F3′H Genes Contributes to Anthocyanin Accumulation in the Arabidopsis tt7 Mutant Grown Under Nitrogen Stress. Plant Physiol. 2010, 153, 806–820. [Google Scholar] [CrossRef] [Green Version]
  48. Bogs, J.; Ebadi, A.; McDavid, D.; Robinson, S.P. Identification of the Flavonoid Hydroxylases from Grapevine and Their Regulation during Fruit Development. Plant Physiol. 2005, 140, 279–291. [Google Scholar] [CrossRef] [Green Version]
  49. Jung, Y.J.; Lee, H.J.; Kim, J.H.; Kim, D.H.; Kim, H.K.; Cho, Y.-G.; Bae, S.; Kang, K.K. CRISPR/Cas9-targeted mutagenesis of F3′H, DFR and LDOX, genes related to anthocyanin biosynthesis in black rice (Oryza sativa L.). Plant Biotechnol. Rep. 2019, 13, 521–531. [Google Scholar] [CrossRef]
  50. Vikhorev, A.V.; Strygina, K.V.; Khlestkina, E.K. Duplicated flavonoid 3′-hydroxylase and flavonoid 3′, 5′-hydroxylase genes in barley genome. PeerJ 2019, 7, e6266. [Google Scholar] [CrossRef] [Green Version]
  51. Zhang, H.; Wang, X.; Pan, Q.; Li, P.; Liu, Y.; Lu, X.; Zhong, W.; Li, M.; Han, L.; Li, J. QTG-Seq accelerates QTL fine mapping through QTL partitioning and whole-genome sequencing of bulked segregant samples. Mol. Plant 2019, 12, 426–437. [Google Scholar] [CrossRef] [Green Version]
  52. Zhou, X.; Xia, Y.; Ren, X.; Chen, Y.; Huang, L.; Huang, S.; Liao, B.; Lei, Y.; Yan, L.; Jiang, H. Construction of a SNP-based genetic linkage map in cultivated peanut based on large scale marker development using next-generation double-digest restriction-site-associated DNA sequencing (ddRADseq). BMC Genom. 2014, 15, 351. [Google Scholar] [CrossRef] [PubMed] [Green Version]
Figure 1. Phenotypes of the parents and F2 individuals and their frequency distributions. (A) Maternal line BT 126; (B) paternal line, SN 60; (C,D) the frequency distribution of the purple head trait in the F2 populations with 302 and 280 individuals planted in 2018 and 2019, respectively; (EI) phenotype of two F2 populations with 1st to 5th grades of head color. The DNAs of 30 F2 individuals with extreme phenotypes (1st and 5th grade) were used to develop high anthocyanin and low anthocyanin bulks; scale bar = 1 cm.
Horticulturae 07 00246 g001
Figure 2. Distribution of two progeny SNP-index on the chromosome length, represented by the horizontal axis (Mb); vertical axis: SNP-index. (A) Δ (SNP-index) graphs generated from QTL-seq study; (B) SNP-index graphs depicting the HAB (high anthocyanin biosynthesis bulk); (C) SNP-index graphs depicting the LAB (low anthocyanin biosynthesis bulk). Gray shaded boxes indicate significant QTLs.
Horticulturae 07 00246 g002
Figure 3. Maps of the Pur loci on C07 (A) and C09 (B) constructed using 26 SNP markers.
Horticulturae 07 00246 g003
Figure 4. Structure identity and expression of broccoli gene BoF3’H. (A) Comparison of BoF3’H promoter and cDNA sequence between parental lines BT 126 and SN 60; (BE) relative expression of BoF3’H, BoTTG1, BoANS2, and BoLED38 at three head developmental stages. Significant differences between BT 126 and SN 60 are indicated by * based on Students t test (* p < 0.05, ** p < 0.01; *** p < 0.001); (F) the phenotype of the head during three developmental stages. The upper part depicts the head of BT 126, while the lower part depicts the head of SN 60. Scale bar = 1 cm.
Horticulturae 07 00246 g004
Table 1. Whole-genome mapping statistics for parents, as well as LAB and HAB bulks.
SampleMapped ReadsTotal ReadsMapping Rate (%)Average Depth (X)Coverage 1× (%)Coverage 4× (%)
SN 60245,092,342261,565,56093.741.8192.3389.41
BT 126148,780,556158,487,15293.8826.291.5186.85
LAB218,978,598232,601,04894.1434.995.0392.43
HAB192,459,282203,800,72894.4431.1394.7791.78
Table 2. Quantitative trait loci (p < 0.05) associated with anthocyanin biosynthesis in broccoli.
ChromosomeStartEndLODPVE (%)AddDom
7SNP1SNP214.619338.1207−0.8350−0.4366
9SNP22SNP2313.123128.19350.01501.0399
LOD-logarithm of odds; PVE-phenotypic variance explained; Add-additive effect; Dom-dominance effect.
Table 3. Annotation of B. oleracea genes in the candidate region.
Bo GenesChromosomeGene Position
(bp)
AT ID aE-ValueAT GO b Annotation
Bo7g096780C737466680–37466680AT5G245200.0TRANSPARENT TESTA GLABRA 1
Bo7g099150C738873553–38874347AT3G499400.0LOB domain-containing protein 38
Bo7g108300C742567442–42568605AT4G228800.0anthocyanin synthase
Bo9g174870C951722173–51723584AT5G080001 × 10−127X8-GPI family of proteins
Bo9g174880C951725909–51727132AT5G079900.0flavonoid 3′ hydroxylase activity
Bo9g174890C951728802–51729245AT5G079900.0flavonoid 3′ hydroxylase activity
Bo9g174900C951731919–51732761AT5G079900.0flavonoid 3′ hydroxylase activity
Bo9g174910C951736550–51738488---
Bo9g174920C951742405–51744195AT5G079601 × 10−128Asterix-like protein
Bo9g174930C951744445–51745784---
Bo9g174940C951747328–51749122AT5G078900.0myosin heavy, chain-like protein
Bo9g174950C951751745–51754512AT5G078300.0glucuronidase 2
Bo9g174960C951758770–51760263AT5G078200.0calmodulin-binding, protein-like protein
Bo9g174970C951764406–51766923AT5G078000.0Flavin-containing monooxygenase
Bo9g174980C951767719–51777672AT5G077400.0actin-binding protein
Bo9g174990C951779465–51787686AT5G077400.0actin-binding protein
Bo9g175000C951788944–51794354AT5G077400.0actin-binding protein
a The best hits of the seven B. oleracea genes compared to A. thaliana (AT). b GO annotations for seven Bo to AT best-hit genes obtained from TAIR.
Publisher’s Note: MDPI stays neutral with regard to jurisdictional claims in published maps and institutional affiliations.

