Article

Systematic Identification and Validation of Housekeeping and Tissue-Specific Genes in Allotetraploid Chenopodium quinoa

1
Shandong Key Laboratory of Water Pollution Control and Resource Reuse, School of Environmental Science and Engineering, Shandong University, Qingdao 266237, China
2
Institute of Germplasm Resources and Biotechnology, Jiangsu Academy of Agricultural Sciences, Nanjing 210014, China
3
Excellence and Innovation Center, Jiangsu Academy of Agricultural Sciences, Nanjing 210014, China
4
Tobacco Research Institute, Chinese Academy of Agricultural Sciences, Qingdao 266101, China
*
Authors to whom correspondence should be addressed.
These authors contributed equally to this work.
Horticulturae 2021, 7(8), 235; https://doi.org/10.3390/horticulturae7080235
Submission received: 29 June 2021 / Revised: 23 July 2021 / Accepted: 5 August 2021 / Published: 10 August 2021
(This article belongs to the Section Genetics, Genomics, Breeding, and Biotechnology (G2B2))

Abstract

:
Quinoa is a gluten-free food crop that contains all the essential amino acids and vitamins. The selection of proper housekeeping and tissue-specific genes is the crucial prerequisite for gene expression analysis using the common approach, real-time quantitative PCR (RT-qPCR). In this study, we identified 40 novel candidate housekeeping genes by the minimum transcript per million (TPM), coefficient of variation (CV) and maximum fold change (MFC) methods and 19 candidate tissue-specific genes by the co-expression network method based on an RNA-seq dataset that included 53 stem, leaf, flower and seed samples, as well as additional shoot and root samples under different stresses. The expression stability of 12 housekeeping and tissue-specific genes, as well as that of another two traditionally used housekeeping genes, was further evaluated using qPCR and ranked using NormFinder, BestKeeper and the comparative delta-Ct method. The results demonstrated that MIF, RGGA, VATE and UBA2B were ranked as the top four most stable candidate housekeeping genes. qPCR analysis also revealed three leaf-specific genes and five root-specific genes, but no stem-specific gene was identified. Gene Ontology (GO) enrichment analysis identified that housekeeping genes were mainly enriched in the small molecule metabolic process, organonitrogen compound metabolic process, NAD binding and ligase activity. In addition, tissue-specific genes are closely associated with the major functions of a specific tissue. Specifically, GO terms “photosynthesis” and “thylakoid” were most significantly overrepresented in candidate leaf-specific genes. The novel housekeeping and tissue-specific genes in our study will enable better normalization and quantification of transcript levels in quinoa.

1. Introduction

Quinoa (Chenopodium quinoa Wild., 2n = 4x = 36) is an ancient seed crop originating from the Andean region of South America, where it has developed tolerance to various environmental stresses [1,2,3]. Quinoa not only can be grown on marginal lands unsuitable for other main crops but is also used as a highly nutritional food source. Quinoa seeds are gluten-free and contain an excellent balance of essential amino acids, dietary fiber, lipids, carbohydrates, vitamins and minerals [4]. The genome of quinoa has been sequenced and assembled [5], which enables the genetic improvement of quinoa. Considerable attention has been focused on defining the biological significance and functional characteristics of the quinoa genes.
Housekeeping genes, also known as reference genes, are stably expressed in all cell types. In qPCR analysis, the expression of target genes is calculated relative to housekeeping genes. Suitable housekeeping genes should be steadily expressed in all samples in a given study. Until now, little research has focused on the identification of suitable housekeeping genes for use in qPCR analysis in quinoa, and conventional housekeeping genes, such as GADPH and ACT1, were used randomly without experimental validation. However, under some conditions, the expression of conventional housekeeping genes varies across tissues or treatments, which could lead to errors in the quantitative analysis of gene expression [6,7,8,9]. Thus, it is necessary to develop novel housekeeping genes for quinoa gene functional analysis.
Tissue-specific genes (TGs) are genes that are highly expressed in one tissue. These genes sets are closely related to the main functions performed by each specific tissue type [10,11]. Thus, the study of the expression profiles of tissue-specific genes could help us to understand the regulation mechanism of plant growth and development, how genes function and the relationship between genes [12,13,14]. The sequence information of tissue-specific genes contributes to the development of tissue-specific promoters, which activate the expression of target genes only in the specific tissues [15,16,17].
Researchers are increasingly turning to transcriptome analyses to identify housekeeping genes and tissue-specific genes in which they are interested. High-throughput sequencing methods such as RNA-seq provide an opportunity to study the expression patterns of quinoa genes in different cell types [18,19,20]. RNA-seq is a sensitive and reliable method for identifying genes with specific expression patterns [21,22]. With RNA-seq data, housekeeping genes and tissue-specific genes have been identified in various plants, such as chickpea and onion [23,24]. Maldonado-Taipe et al. (2021) validated eight suitable genes for normalization of diurnal gene expression studies in Chenopodium quinoa [25]. The identification of housekeeping genes and tissue-specific genes will benefit the research of gene function in quinoa.
In this study, we profiled the gene expression abundance of 53 samples representing 22 distinct tissues. The purpose was to identify housekeeping and tissue-specific genes for studies of genetic improvement of quinoa. Using a variety of statistical methods, we identified 40 candidate housekeeping genes and 19 candidate leaf-, stem- and root-specific genes. The expression characteristics of these candidate genes were further validated by qPCR on a group of tissues, including dry seeds, seedlings, roots, stems, leaves and inflorescences.

2. Materials and Methods

2.1. Plant Materials

Quinoa cv. ISLUGA plants were grown in a greenhouse at the Jiangsu Academy of Agricultural Sciences, Nanjing, China. The following samples were selected: dry seeds (0 weeks old), seedlings (1 week old), roots (6 weeks old), stems (6 weeks old), leaves (6 weeks old) and inflorescences (6 weeks old). Three biological replicates were collected for each tissue to validate housekeeping and tissue-specific gene candidates with quantitative real-time PCR (qPCR). Samples were immediately frozen in liquid nitrogen and stored at −80 °C for further use.

2.2. RNA Isolation and cDNA Synthesis

Total RNA was extracted using the RNAprep Pure Plant Kit (Tiangen, China) according to the kit instructions. The integrity of RNA was determined by 1.2% agarose electrophoresis. The quantity and quality of RNA were assessed using a BioPhotometer D30 (Eppendorf, Germany). cDNA was then synthesized using a cDNA Synthesis Kit (Takara, Japan) according to the kit instructions and was stored at −20 °C.

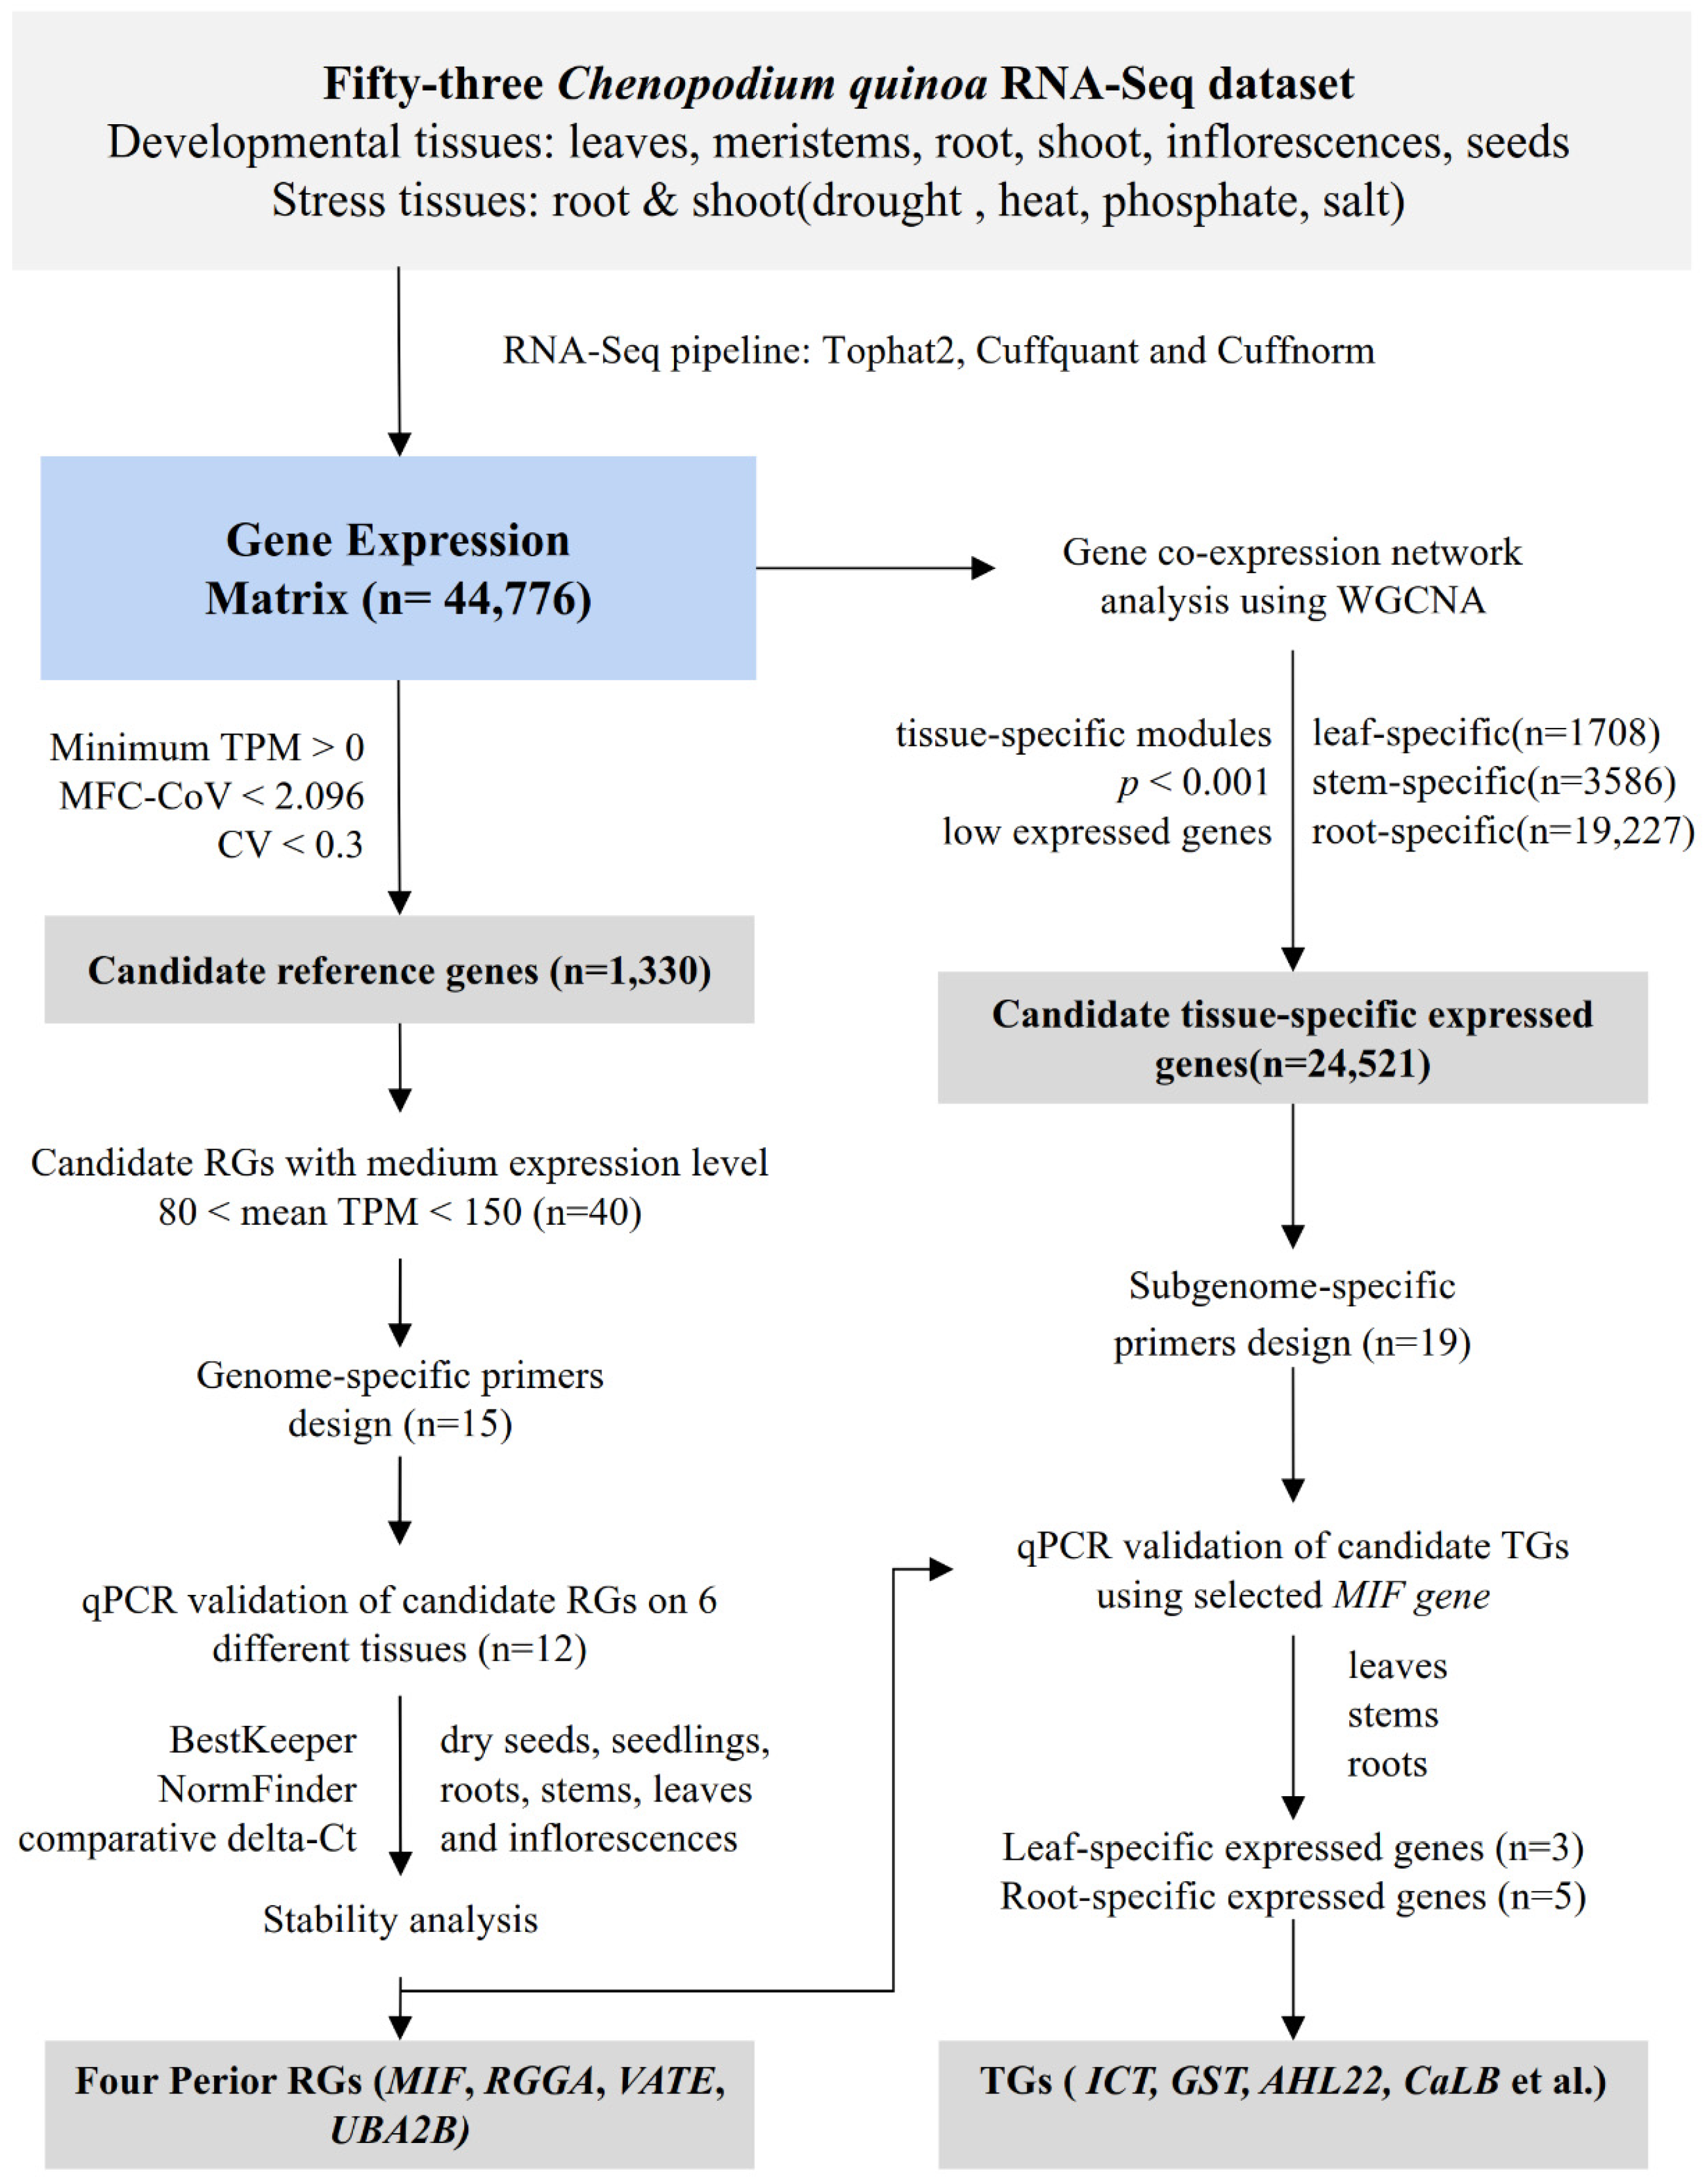
2.3. RNA-Seq Analysis Pipeline

The RNA-seq dataset included 53 samples of stems, leaves, flowers and seeds, as well as additional shoot and root samples under different stresses (heat, drought, salt and low phosphorus), and was employed for identifying candidate housekeeping and tissue-specific genes (Table S1) [5,26]. The FastQC program [27] was first used to check and evaluate the sequencing quality of the raw data. Trimmomatic v0.36 [28] was then used to remove adapters, low-quality bases and reads shorter than 36 bases. The genome assemblies and sequence data for quinoa [5] were downloaded from ChenopodiumDB (http://www.cbrc.kaust.edu.sa/chenopodiumdb/, accessed on 5 May 2020). Cleaned data were aligned to the quinoa reference genome with Tophat v2.1.1 [29]. The expression levels of the genes were quantified and normalized with cuffquant and cuffnorm, respectively [30]. The transcript abundance was determined based on the fragments per kilobase of transcripts per million fragments mapped (FPKM) value. Finally, an FPKM value matrix from multiple samples was converted to a transcripts per million (TPM) value matrix using a custom R script.

2.4. Systematic Identification of Housekeeping and Tissue-Specific Genes with RNA-Seq Data

Housekeeping genes were identified as described by Hoang et al. (2017) [9] with some modifications. First, genes with a minimum TPM value of zero were removed, since housekeeping genes must be detectable in all samples. Then, we calculated the mean TPM, the coefficient of variation (CV) and the ratio of the maximum to minimum (MFC) for each transcript. The mean TPM value was calculated by averaging TPM values across all samples. The CV was the ratio of the standard deviation to the mean TPM value. The MFC was the ratio of the maximum TPM value to the minimum TPM value. The MFC-CV of a transcript was also obtained by multiplying CV by MFC. Potential housekeeping genes were identified based on MFC and CV according to the following criteria: (I) the minimum TPM should be larger than 0; (II) MFC-CV should be less than the lower quartile value of MFC-CV; and (III) CV should be less than 0.3.
Tissue-specific genes were identified by the co-expression network analysis method. First, genes with low abundance (maximum TPM < 2) were filtered out. A gene co-expression network was constructed using the WGCNA program [31,32]. Then, modules that had a significant correlation (|r| > 0.8, p < 0.001) with a specific tissue were identified by quantifying the correlation between the module eigengene and the tissue indicators [33]. Candidate tissue-specific genes were identified according to the following criteria: (I) they should be members of the positively correlated modules, and (II) the minimum TPM in the target tissue should be larger than 10.

2.5. qPCR Validation

Quinoa is an allotetraploid crop; consequently, the amplification of orthologous genes should be considered and avoided. Transcript sequences were employed as the query for a BLAST analysis against the quinoa transcript database. Based on BLAST results, qPCR primers were designed using Primer Premier 6 (PREMIER Biosoft International, Palo Alto, CA, USA). At least one primer of each pair must be located within the non-conservative regions.
Thirty-three genes from the bioinformatic analysis were selected for qPCR validation, including 12 candidate housekeeping genes, two commonly used housekeeping genes, actin-1 (ACT1), glyceraldehyde-3-phosphate dehydrogenase (GAPDH) and 19 candidate tissue-specific genes. PCR reactions were performed using the SYBR® Premix DimerEraser™ (Perfect Real Time) kit (Takara, Japan) on a LightCycler 96 Real-Time PCR System (Roche, Indianapolis, IN, USA). Each PCR reaction was repeated three times, and relative expression levels of genes were calculated by the comparative Ct (ÄÄCt) method [34].

2.6. Evaluation of Candidate Housekeeping Gene Stability

The expression stability of candidate housekeeping genes was determined through three statistical approaches, NormFinder [35], BestKeeper [36] and the comparative delta-Ct method [37].

2.7. Gene Ontology Enrichment Analysis

All genes were aligned against NCBI non-redundant (nr) protein databases and the UniProt database, and the annotated result was then imported into Blast2GO [38]. Gene Ontology (GO) enrichment analysis of housekeeping genes and tissue-specific genes was performed according to the Blast2GO user manual. GO terms with a false discovery rate (FDR) less than 0.05 were considered significant.

3. Results

3.1. Expression Profiles of Candidate Housekeeping and Tissue-Specific Genes

The RNA-seq dataset included 53 samples of stems, leaves, flowers and seeds, as well as additional shoot and root samples under different stresses (heat, drought, salt and low phosphorus), and was employed for identifying candidate housekeeping and tissue-specific genes (Table S1). Clean data (113.7 Gb) were aligned to the quinoa reference genome, and 44,776 genes were successfully quantified in total. The workflow of identification of housekeeping and tissue-specific genes is summarized in Figure 1.
Housekeeping genes should be generally stably expressed and be detectable in all samples. Accordingly, three parameters, the minimum TPM, CV and MFC-CV, for each transcript, were considered as filtering criteria for housekeeping genes (Figure 1). Among the 44,776 genes in the quinoa genome, 1330 genes were screened based on the three criteria (Table S2). Since poorly expressed genes (Cts around 30–35) and highly expressed genes (Cts around 15 or lower) show different variances, we aimed to choose housekeeping genes with a medium expression level. Our previous qPCR analysis showed that when the mean TPM was between 80 and 150, the Ct values ranged from approximately 15 to 30. Finally, 40 candidate housekeeping genes met the criterion for the expression level (80 < TPM < 150). We successfully designed primers for 15 genes, of which 12 encode known proteins (Table 1). To further measure the stability of the candidate housekeeping genes, 12 candidates were compared with two traditional housekeeping genes, GAPDH and ACT1 (Table 1). The TPM of housekeeping genes is graphically represented in a box plot with their quartiles (Figure 2A,B). The expression of GAPDH varied dramatically, suggesting that it is not stable, at least in test data. The expression of ACT1 was less variable than that of candidate genes, except for APX3 and AHRI. However, given the low expression of ACT1, the lower volatility did not mean that ACT1 was more stable than the candidate genes. Novel housekeeping genes had a lower CV value than commonly used housekeeping genes (Figure 2C), and a much lower MFC value than ACT1 (Figure 2D). In addition, there was no MFC value for GAPDH because GAPDH was not expressed in quinoa roots under heat stress. These results suggested that candidate housekeeping genes were more stable than traditional reference genes and were not abnormally expressed in any of the samples.
Compared to stably expressed housekeeping genes, we employed a new method, the weighted gene co-expression network method, to identify candidate tissue-specific genes with the WGCNA program [31,32]. Based on RNA-seq data across different tissues, we successfully identified three kinds of tissue-specific modules, which corresponded to the leaf, stem and root (Figure 3A). Three co-expressed modules, black, red and orange modules, were leaf-specific modules, and the other three modules, green, purple and white modules, were stem-specific modules. However, only one module, the turquoise module, was root specific. There were 1708, 3586 and 19,227 members in the leaf-, stem- and root-specific modules, respectively. After strict filtration and BLAST analysis, we successfully designed 19 primers for six candidate leaf-specific genes (L1–L6), four candidate stem-specific genes (S1–S4) and nine candidate root-specific genes (R1–R9) (Table S3). The expression patterns of these tissue-specific genes are shown in Figure 3B. Root-specific genes were barely expressed in tissues other than roots, and leaf-specific genes were preferentially expressed in leaves. Some stem-specific genes were expressed in stems and roots, but the expression of stem-specific genes in stems was obviously higher than that in roots. These results indicated that it was feasible and effective to identify candidate tissue-specific genes through gene co-expression analysis.

3.2. qPCR Validation and Stability Measurement of Candidate Housekeeping Genes

Due to potential high similarity of the nucleotide sequence between subgenomes in polyploid plants, qPCR primers were carefully designed to avoid amplifying conservative regions. We successfully designed primers for 12 genes (Table 1). To determine the stability of candidate housekeeping genes, qPCR analysis was carried out for the transcription profiling of the 12 candidate housekeeping genes as well as the two commonly used housekeeping genes, GAPDH and ACT1. In total, six tissues were tested, including dry seeds, seedlings, roots, stems, leaves and inflorescences. Three statistical approaches, NormFinder [35], BestKeeper [36] and the comparative delta-Ct method [37], were used to measure the stability of candidate housekeeping genes.
BestKeeper software first determines the most suitable housekeeping genes out of the candidates and then combines them into an index [36]. The stability of a housekeeping gene is measured by the correlation between the gene and the BestKeeper Index. The stronger the correlation, the more stable the gene. Since the 14 genes in our analysis, both candidate and commonly used housekeeping genes, were recognized as suitable housekeeping genes (p < 0.001), all of them were used to calculate the BestKeeper Index. The genes were all highly correlated with the BestKeeper Index (r > 0.90, p < 0.001), which means that candidate housekeeping genes were stably expressed across samples (Figure 4A). Candidate housekeeping genes showed a higher level of correlation with the BestKeeper Index than the commonly used housekeeping genes, ACT1 and GADPH, indicating a higher level of stability. Except for HEX1, the Pearson correlation coefficients between candidates and the BestKeeper Index exceeded 0.95. NormFinder software measures the stability of genes in terms of stability value [35]. Notably, the lower the stability value, the more stable the candidate RG. NormFinder analysis showed that the most stable candidate housekeeping genes were MIF, RGGA, UBA2B and VATE, and the best housekeeping gene combination was VATE and MIF. ACT1, GADPH and HEX1 were the least stable housekeeping genes (Figure 4B). The comparative delta-Ct method evaluates expression stabilities via a parameter called the mean standard deviation [37]. The lower the mean standard deviation, the more stable the gene. The mean standard deviations of MIF, RGGA, VATE and UBA2B were relatively small (mean SD < 1), indicating a low level of variability. HEX1, ACT1 and GADPH showed the highest level of variability, with a mean SD of 1.66, 1.69 and 2.34, respectively (Figure 4C).
NormFinder, BestKeeper and the comparative delta-Ct method all demonstrated that candidate housekeeping genes tended to be more stable than commonly used housekeeping genes. Although there were some differences in the relative order of gene stability across the three methods, their general tendency was similar, showing that MIF, RGGA, VATE and UBA2B were ranked as the top four most stable candidate housekeeping genes.

3.3. qPCR Validation and Specificity Measurement of Candidate Tissue-Specific Genes

To verify the specificity of candidate tissue-specific genes, qPCR analysis was performed using MIF as a reference gene. The expression patterns of candidate genes (Table S2) are shown in Figure 5 in the form of a relative expression level. After removing genes with low expression (maximum relative expression lower than five), we observed the expression of three candidate leaf-specific genes (L2–L4), three candidate stem-specific genes (S2–S4) and seven candidate root-specific genes (R1, R2 and R5–R9) across three tissues: the leaf, stem and root. Candidate leaf-specific genes, L2, L3 and L4, showed strong preferential expression in leaves, with L4 being expressed at the highest level. Six of seven candidate root-specific genes were exclusively expressed in roots, whereas R5 was expressed in both roots and leaves. Candidate stem-specific genes S2, S3 and S4 were expressed in all three tissues, although S3 and S4 had the highest expression in stems.
Furthermore, we evaluated the tissue specificity index for each candidate gene [39]. ô ranges between 0 and 1; 0 represents genes that are stably expressed in different tissues, and 1 indicates genes that are exclusively expressed in only one tissue [39]. In our study, tissue-specific genes were defined as those genes that had the highest expression in target tissues and with ô > 0.9 [40]. As a result, candidates L2, L3 and L4, as well as R1, R2, R6, R7 and R9, were recognized as tissue-specific genes (Table 2). However, no stem-specific gene was identified, even though we conducted genome-wide screening of tissue-specific genes. This may be because, compared with roots and leaves, stems lack a unique function.

3.4. GO Enrichment of Housekeeping and Tissue-Specific Genes

GO analysis was then performed to predict the potential functions of candidate housekeeping and tissue-specific genes. Among GO terms associated with housekeeping genes, significant terms were mainly associated with metabolic processes, such as the small molecule metabolic process (GO: 0044281), organonitrogen compound metabolic process (GO: 1901564), cellular amino acid metabolic process (GO: 0006520) and organic acid metabolic process (GO: 0006082). In molecular functions (MF), NAD binding (GO: 0051287) was the most significant, followed by ligase activity (GO: 0016874). These genes were most significantly enriched in the nuclear part (GO: 0044428) of cellular components (CC) (Figure 6A, Table S4).
In addition, for candidate leaf-specific genes, the most significant GO terms were photosynthesis (GO: 0015979), iron–sulfur cluster binding (GO: 0051536) and the thylakoid (GO: 0009579). For candidate stem-specific genes, the most significant GO terms were protein phosphorylation (GO: 0006468), kinase activity (GO: 0016301) and the extracellular region (GO: 0005576), and for candidate root-specific genes, the most significant ones were cellular process (GO: 0009987), structural molecule activity (GO: 0005198) and intracellular (GO: 0005622) (Figure 6B, Table S5).

4. Discussion

It is important to select an appropriate housekeeping gene to quantify gene expression precisely. However, the commonly used housekeeping genes are highly variable in many circumstances [7,8]. We showed that GADPH was not expressed in quinoa roots under heat stress. Thus, it is necessary to develop novel and more stable housekeeping genes for quinoa. We measured the variability of genes using the RNA-seq approach and succeeded in developing candidate housekeeping genes. Subsequent qPCR validation demonstrated that RNA-seq was an effective and feasible method to identify tissue-specific genes. GO analysis demonstrated that candidate housekeeping genes were most significantly involved in small molecule metabolic processes, including nitrogen compound metabolism and organic acid metabolism. The stable expression of this group of genes is reasonable, as the tight regulation of carbon and nitrogen metabolism is critical for the realization of the basic functions of tissues and cells.
We evaluated the stability of housekeeping genes using three methods, BestKeeper, NormFinder and the comparative delta-Ct method. The results showed some differences in the relative stability of genes, but the overall stability of candidate genes was higher than that of commonly used genes. The discrepancies were likely to result from the characteristics of different algorithms. BestKeeper is based on the principle that proper housekeeping genes should have a similar expression pattern [36]. NormFinder works on a linear mixed-effects model, with estimates of both intra- and inter-group variation for each gene, and automatically calculates the gene stability value [35]. The founding principle of the comparative delta-Ct method is that the delta-Ct value between two housekeeping genes remains constant across samples [37]. Any algorithm has its strong and weak points. We used approaches based on different principles to minimize bias caused by statistical methods. In our study, the highest-ranking candidate housekeeping genes were the same for NormFinder and the comparative delta-Ct method (Figure 4B,C). In the case of BestKeeper, although UBA2B and MIF were not recognized as the most stable housekeeping genes, their stability was only slightly lower than that of the most stable genes (Figure 3A). Generally speaking, the top four candidate housekeeping genes, MIF, RGGA, VATE and UBA2B, are ideal housekeeping genes for use in quinoa. By contrast, the traditional reference gene, GAPDH, is not suitable for quinoa, as it was not expressed in quinoa roots under heat stress (Figure 2A,B). Previous studies also recommended not using GAPDH for normalization purposes to analyze gene abundance [9,41].
Tissue-specific gene identification, similar to that of housekeeping genes, is currently carried out with high-throughput approaches, including cDNA microarray and RNA-seq methods. Usually, the tissue specificity of genes is evaluated directly, based on their expression levels in different tissues. For example, Yanai et al. [39] proposed a tissue-specific index “ô,” which takes into consideration the variation in gene expression across different tissues. Other similar indexes include the weighted index [42], which determines the confidence level and expression abundance simultaneously, and the HKera index, which is based on the sequencing of gene expression levels [43]. We adopted a novel analysis method with RNA-seq data. First, a gene co-expression network was constructed. Then, the correlation coefficients between the module eigengene and the tissue indicators were calculated to identify tissue-specific modules whose members were recognized as candidate tissue-specific genes. On the one hand, the functions of tissue-specific genes are highly related to that of the specific tissue [10,11]. On the other hand, genes in the same module tend to have similar or related functions [31]. Therefore, our method was helpful to reduce the false positive rate of tissue-specific gene detection and could test tissue-specific genes quickly and easily.
GO enrichment analysis was performed on candidate leaf-, stem- and root-specific genes. The analysis results confirmed the theory that tissue-specific genes are closely associated with the major functions of a specific tissue. Specifically, GO terms “photosynthesis” and “thylakoid” were most significantly overrepresented in candidate leaf-specific genes. Candidate stem-specific genes included those known to be highly expressed in this tissue, such as the xyloglucan endotransglycosylase gene, whose products are involved in the formation of secondary walls of xylem and/or phloem cells [44]. As anticipated, the candidate root-specific genes included those associated with substrate uptake (e.g., ABC transporter, amino acid transporter, ammonium transporter, nitrate transporter, phosphate transporter, potassium transporter, sulfate transporter).

5. Conclusions

Through RNA-seq analysis and qPCR evaluation, we finally identified 12 novel candidate housekeeping genes and eight tissue-specific genes. The MIF, RGGA, VATE and UBA2B genes were finally ranked as the top four most stable candidate housekeeping genes. Our developed PCR primers for the novel housekeeping and tissue-specific genes will provide important resources for future gene expression studies in quinoa.

Supplementary Materials

The following are available online at https://www.mdpi.com/article/10.3390/horticulturae7080235/s1, Table S1: Public RNA-seq data for detecting housekeeping genes and tissue-specific genes, Table S2: Expression profiles of candidate housekeeping genes, Table S3: qPCR primers of candidate tissue-specific genes, Table S4: Significantly overrepresented GO terms in candidate housekeeping genes, Table S5: Significantly overrepresented GO terms in tissue-specific genes.

Author Contributions

Conceptualization, Y.L. and L.M.; methodology, B.H. and H.C.; software, F.H. and B.H.; validation, P.S., W.S. and H.C.; formal analysis, B.H.; writing—original draft preparation, B.H.; writing—review and editing, Y.L.; supervision, L.M.; funding acquisition, Y.L. All authors have read and agreed to the published version of the manuscript.

Funding

This research was funded by the National Natural Science Foundation of China (31771813), Natural Science Foundation of Shandong Province (ZR2019BC066) and the Agricultural Science and Technology Innovation Program (ASTIP-TRIC03).

Institutional Review Board Statement

Not applicable.

Informed Consent Statement

Not applicable.

Data Availability Statement

RNA-seq data of Chenopodium quinoa were deposited in the NCBI Sequence Read Archive (SRA) database under the accession number PRJNA394651 and PRJNA306026, encompassing 22 distinct tissues (Table S1).

Conflicts of Interest

The funders had no role in the design of the study; in the collection, analyses, or interpretation of data; in the writing of the manuscript, or in the decision to publish the results.

References

  1. Adolf, V.I.; Shabala, S.; Andersen, M.N.; Razzaghi, F.; Jacobsen, S.E. Varietal differences of quinoa’s tolerance to saline conditions. Plant. Soil 2012, 357, 117–129. [Google Scholar] [CrossRef]
  2. Hariadi, Y.; Marandon, K.; Tian, Y.; Jacobsen, S.E.; Shabala, S. Ionic and osmotic relations in quinoa (Chenopodium quinoa Willd.) plants grown at various salinity levels. J. Exp. Bot. 2011, 62, 185–193. [Google Scholar] [CrossRef] [Green Version]
  3. Jacobsen, S.E.; Mujica, A.; Jensen, C.R. The resistance of quinoa (Chenopodium quinoa Willd.) to adverse abiotic factors. Food Rev. Int. 2003, 19, 99–109. [Google Scholar] [CrossRef]
  4. Vega-Gálvez, A.; Miranda, M.; Vergara, J.; Uribe, E.; Puente, L.; Martínez, E.A. Nutrition facts and functional potential of quinoa (Chenopodium quinoa willd.), an ancient Andean grain: A review. J. Sci. Food Agric. 2010, 90, 2541–2547. [Google Scholar] [CrossRef]
  5. Jarvis, D.E.; Ho, Y.S.; Lightfoot, D.J.; Schmöckel, S.M.; Li, B.; Borm, T.J.A.; Ohyanagi, H.; Mineta, K.; Michell, C.T.; Saber, N.; et al. The genome of Chenopodium quinoa. Nature 2017, 542, 307–312. [Google Scholar] [CrossRef] [PubMed] [Green Version]
  6. Janssens, N.; Janicot, M.; Perera, T.; Bakker, A. Housekeeping genes as internal standards in cancer research. Mol. Diagn. 2004, 8, 107–113. [Google Scholar] [CrossRef]
  7. de Jonge, H.J.M.; Fehrmann, R.S.N.; de Bont, E.S.J.M.; Hofstra, R.M.W.; Gerbens, F.; Kamps, W.A.; de Vries, E.G.E.; van der Zee, A.G.J.; te Meerman, G.J.; ter Elst, A. Evidence based selection of housekeeping genes. PLoS ONE 2007, 2, 1–5. [Google Scholar] [CrossRef] [Green Version]
  8. Chari, R.; Lonergan, K.M.; Pikor, L.A.; Coe, B.P.; Zhu, C.Q.; Chan, T.H.; MacAulay, C.E.; Tsao, M.S.; Lam, S.; Ng, R.T.; et al. A sequence-based approach to identify reference genes for gene expression analysis. BMC Med. Genom. 2010, 3. [Google Scholar] [CrossRef] [PubMed] [Green Version]
  9. Hoang, V.L.T.; Tom, L.N.; Quek, X.C.; Tan, J.M.; Payne, E.J.; Lin, L.L.; Sinnya, S.; Raphael, A.P.; Lambie, D.; Frazer, I.H.; et al. RNA-seq reveals more consistent reference genes for gene expression studies in human non-melanoma skin cancers. Peer J. 2017, 2017, 1–15. [Google Scholar] [CrossRef] [Green Version]
  10. Dezsö, Z.; Nikolsky, Y.; Sviridov, E.; Shi, W.; Serebriyskaya, T.; Dosymbekov, D.; Bugrim, A.; Rakhmatulin, E.; Brennan, R.J.; Guryanov, A.; et al. A comprehensive functional analysis of tissue specificity of human gene expression. BMC Biol. 2008, 6, 1–15. [Google Scholar] [CrossRef] [Green Version]
  11. Hsiao, L.L.; Dangond, F.; Yoshida, T.; Hong, R.; Jensen, R.V.; Misra, J.; Dillon, W.; Lee, K.F.; Clark, K.E.; Haverty, P.; et al. A compendium of gene expression in normal human tissues. Physiol. Genom. 2002, 2002, 97–104. [Google Scholar] [CrossRef] [PubMed] [Green Version]
  12. Jeon, J.-S.; Jang, S.; Lee, S.; Nam, J.; Kim, C.; Lee, S.-H.; Chung, Y.-Y.; Kim, S.-R.; Lee, Y.H.; Cho, Y.-G.; et al. Leafy hull sterile1 is a Homeotic Mutation in a Rice MADS Box Gene Affecting Rice Flower Development. Plant. Cell 2000, 12, 871–884. [Google Scholar] [CrossRef] [Green Version]
  13. Theißen, G. Development of floral organ identity: Stories from the MADS house. Curr. Opin. Plant. Biol. 2001, 4, 75–85. [Google Scholar] [CrossRef]
  14. Wu, H.; Gaur, U.; Mekchay, S.; Peng, X.; Li, L.; Sun, H.; Song, Z.; Dong, B.; Li, M.; Wimmers, K.; et al. Genome-wide identification of allele-specific expression in response to Streptococcus suis 2 infection in two differentially susceptible pig breeds. J. Appl. Genet. 2015, 56, 481–491. [Google Scholar] [CrossRef]
  15. Tan, H.; Yang, X.; Zhang, F.; Zheng, X.; Qu, C.; Mu, J.; Fu, F.; Li, J.; Guan, R.; Zhang, H.; et al. Enhanced seed oil production in canola by conditional expression of brassica napus LEAFY COTYLEDON1 and LEC1-LIKE in developing seeds. Plant. Physiol. 2011, 156, 1577–1588. [Google Scholar] [CrossRef] [Green Version]
  16. Ye, R.; Zhou, F.; Lin, Y. Two novel positive cis-regulatory elements involved in green tissue-specific promoter activity in rice (Oryza sativa L ssp.). Plant. Cell Rep. 2012, 31, 1159–1172. [Google Scholar] [CrossRef]
  17. Geng, L.; Duan, X.; Liang, C.; Shu, C.; Song, F.; Zhang, J. Mining tissue-specific contigs from peanut (Arachis hypogaea L.) for promoter cloning by deep transcriptome sequencing. Plant. Cell Physiol. 2014, 55, 1793–1801. [Google Scholar] [CrossRef] [Green Version]
  18. Fiallos-Jurado, J.; Pollier, J.; Moses, T.; Arendt, P.; Barriga-Medina, N.; Morillo, E.; Arahana, V.; de Lourdes Torres, M.; Goossens, A.; Leon-Reyes, A. Saponin determination, expression analysis and functional characterization of saponin biosynthetic genes in Chenopodium quinoa leaves. Plant. Sci. 2016, 250, 188–197. [Google Scholar] [CrossRef]
  19. Morales, A.; Zurita-Silva, A.; Maldonado, J.; Silva, H. Transcriptional responses of chilean quinoa (Chenopodium quinoa Willd.) under water deficit conditions uncovers ABA-independent expression patterns. Front. Plant. Sci. 2017, 8, 1–13. [Google Scholar] [CrossRef] [PubMed] [Green Version]
  20. Ruiz, K.B.; Maldonado, J.; Biondi, S.; Silva, H. RNA-seq analysis of salt-stressed versus non salt-stressed transcriptomes of chenopodium quinoa landrace R49. Genes 2019, 10, 1042. [Google Scholar] [CrossRef] [PubMed] [Green Version]
  21. Wilhelm, B.T.; Landry, J.R. RNA-Seq-quantitative measurement of expression through massively parallel RNA-sequencing. Methods 2009, 48, 249–257. [Google Scholar] [CrossRef] [PubMed]
  22. Fu, X.; Fu, N.; Guo, S.; Yan, Z.; Xu, Y.; Hu, H.; Menzel, C.; Chen, W.; Li, Y.; Zeng, R.; et al. Estimating accuracy of RNA-Seq and microarrays with proteomics. BMC Genom. 2009, 10, 1–9. [Google Scholar] [CrossRef] [Green Version]
  23. Garg, R.; Patel, R.K.; Jhanwar, S.; Priya, P.; Bhattacharjee, A.; Yadav, G.; Bhatia, S.; Chattopadhyay, D.; Tyagi, A.K.; Jain, M. Gene discovery and tissue-specific transcriptome analysis in chickpea with massively parallel pyrosequencing and web resource development. Plant. Physiol. 2011, 156, 1661–1678. [Google Scholar] [CrossRef] [Green Version]
  24. Kim, S.; Kim, M.S.; Kim, Y.M.; Yeom, S.I.; Cheong, K.; Kim, K.T.; Jeon, J.; Kim, S.; Kim, D.S.; Sohn, S.H.; et al. Integrative structural annotation of de novo RNA-Seq provides an accurate reference gene set of the enormous genome of the onion (Allium cepa L.). DNA Res. 2015, 22, 19–27. [Google Scholar] [CrossRef]
  25. Maldonado-Taipe, N.; Patirange, D.S.R.; Schmöckel, S.M.; Jung, C.; Emrani, N. Validation of suitable genes for normalization of diurnal gene expression studies in Chenopodium quinoa. PLoS ONE 2021, 16, e0233821. [Google Scholar] [CrossRef]
  26. Zou, C.; Chen, A.; Xiao, L.; Muller, H.M.; Ache, P.; Haberer, G.; Zhang, M.; Jia, W.; Deng, P.; Huang, R.; et al. A high-quality genome assembly of quinoa provides insights into the molecular basis of salt bladder-based salinity tolerance and the exceptional nutritional value. Cell Res. 2017, 27, 1327–1340. [Google Scholar] [CrossRef]
  27. Wingett, S.W.; Andrews, S. FastQ Screen: A tool for multi-genome mapping and quality control. F1000 Res. 2018, 7, 1338. [Google Scholar] [CrossRef]
  28. Bolger, A.M.; Lohse, M.; Usadel, B. Trimmomatic: A flexible trimmer for Illumina sequence data. Bioinformatics 2014, 30, 2114–2120. [Google Scholar] [CrossRef] [Green Version]
  29. Trapnell, C.; Pachter, L.; Salzberg, S.L. TopHat: Discovering splice junctions with RNA-Seq. Bioinformatics 2009, 25, 1105–1111. [Google Scholar] [CrossRef]
  30. Trapnell, C.; Roberts, A.; Goff, L.; Pertea, G.; Kim, D.; Kelley, D.R.; Pimentel, H.; Salzberg, S.L.; Rinn, J.L.; Pachter, L. Differential gene and transcript expression analysis of RNA-seq experiments with TopHat and Cufflinks. Nat. Protoc. 2012, 7, 562–578. [Google Scholar] [CrossRef] [PubMed] [Green Version]
  31. Zhang, B.; Horvath, S. A general framework for weighted gene co-expression network analysis. Stat. Appl. Genet. Mol. Biol. 2005, 4, 17. [Google Scholar] [CrossRef] [PubMed]
  32. Langfelder, P.; Horvath, S. WGCNA: An R package for weighted correlation network analysis. BMC Bioinform. 2008, 9, 559. [Google Scholar] [CrossRef] [PubMed] [Green Version]
  33. Xue, Z.; Huang, K.; Cai, C.; Cai, L.; Jiang, C.Y.; Feng, Y.; Liu, Z.; Zeng, Q.; Cheng, L.; Sun, Y.E.; et al. Genetic programs in human and mouse early embryos revealed by single-cell RNA sequencing. Nature 2013, 500, 593–597. [Google Scholar] [CrossRef] [Green Version]
  34. Lv, Y.; Hu, F.; Zhou, Y.; Wu, F.; Gaut, B.S. Maize transposable elements contribute to long non-coding RNAs that are regulatory hubs for abiotic stress response. BMC Genomics 2019, 20, 864. [Google Scholar] [CrossRef] [PubMed]
  35. Andersen, C.L.; Jensen, J.L.; Ørntoft, T.F. Normalization of Real-Time Quantitative Reverse Transcription-PCR Data: A Model-Based Variance Estimation Approach to Identify Genes Suited for Normalization, Applied to Bladder and Colon Cancer Data Sets. Cancer Res. 2004, 64, 5245–5250. [Google Scholar] [CrossRef] [Green Version]
  36. Pfaffl, M.W.; Tichopád, A.; Prgomet, C.; Neuvians, T.P. Determination of stable housekeeping genes, differentially regulated target genes and sample integrity: BestKeeper-Excel-based tool using pair-wise correlations. Biotechnol. Lett. 2004, 26, 509–515. [Google Scholar] [CrossRef] [PubMed]
  37. Silver, N.; Best, S.; Jiang, J.; Thein, S.L. Selection of housekeeping genes for gene expression studies in human reticulocytes using real-time PCR. BMC Mol. Biol. 2006, 7, 1–9. [Google Scholar] [CrossRef] [Green Version]
  38. Götz, S.; García-Gómez, J.M.; Terol, J.; Williams, T.D.; Nagaraj, S.H.; Nueda, M.J.; Robles, M.; Talón, M.; Dopazo, J.; Conesa, A. High-throughput functional annotation and data mining with the Blast2GO suite. Nucleic Acids Res. 2008, 36, 3420–3435. [Google Scholar] [CrossRef]
  39. Yanai, I.; Benjamin, H.; Shmoish, M.; Chalifa-Caspi, V.; Shklar, M.; Ophir, R.; Bar-Even, A.; Horn-Saban, S.; Safran, M.; Domany, E.; et al. Genome-wide midrange transcription profiles reveal expression level relationships in human tissue specification. Bioinformatics 2005, 21, 650–659. [Google Scholar] [CrossRef] [Green Version]
  40. Liu, L.; Wang, G.; Wang, L.; Yu, C.; Li, M.; Song, S.; Hao, L.; Ma, L.; Zhang, Z. Computational identification and characterization of glioma candidate biomarkers through multi-omics integrative profiling. Biol. Direct 2020, 15, 1–14. [Google Scholar] [CrossRef]
  41. Beer, L.; Mlitz, V.; Gschwandtner, M.; Berger, T.; Narzt, M.S.; Gruber, F.; Brunner, P.M.; Tschachler, E.; Mildner, M. Bioinformatics approach for choosing the correct reference genes when studying gene expression in human keratinocytes. Exp. Dermatol. 2015, 24, 742–747. [Google Scholar] [CrossRef]
  42. Chang, C.W.; Cheng, W.C.; Chen, C.R.; Shu, W.Y.; Tsai, M.L.; Huang, C.L.; Hsu, I.C. Identification of human housekeeping genes and Tissue-Selective genes by microarray Meta-Analysis. PLoS ONE 2011, 6, 14–19. [Google Scholar] [CrossRef] [PubMed] [Green Version]
  43. Chiang, A.W.T.; Shaw, G.T.W.; Hwang, M.J. Partitioning the human transcriptome using Hkera, a novel classifier of housekeeping and tissue-specific genes. PLoS ONE 2013, 8, e83040. [Google Scholar] [CrossRef] [PubMed]
  44. Bourquin, V.; Nishikubo, N.; Abe, H.; Brumer, H.; Denman, S.; Eklund, M.; Christiernin, M.; Teeri, T.T.; Sundberg, B.; Mellerowicz, E.J. Xyloglucan endotransglycosylases have a function during the formation of secondary cell walls of vascular tissues. Plant. Cell 2002, 14, 3073–3088. [Google Scholar] [CrossRef] [PubMed] [Green Version]
Figure 1. Workflow to identify housekeeping genes and tissue-specific genes using RNA-seq data.
Horticulturae 07 00235 g001
Figure 2. RNA-seq analysis of commonly used and candidate references genes. (A) Expression patterns of commonly used and candidate reference genes across different tissues. (B) Expression patterns of commonly used and candidate reference genes in roots and shoots under different stresses. (C) Coefficient of variation (CV) and mean log2 (TPM) of 1330 selected transcripts. Each transcript is represented by a single dot. (D) MFC value of candidate and commonly used housekeeping genes.
Horticulturae 07 00235 g002
Figure 3. Identification of leaf-, stem- and root-specific genes. (A) Scatter plot showing the correlation between modules and quinoa tissues. (B) Heatmap of the expression patterns of leaf-, stem- and root-specific genes in various tissues. Color legend represents log2 TPM.
Horticulturae 07 00235 g003
Figure 4. Comparison of the expression stability using BestKeeper (A), NormFinder (B) and the comparative delta-Ct method (C).
Horticulturae 07 00235 g004
Figure 5. qPCR analysis of candidate tissue-specific genes. Relative expression of candidate tissue-specific genes in the leaf (A), stem (B) and root (C). L1–L6: candidate leaf-specific genes; S1–S4: candidate stem-specific genes; R1–R9: candidate root-specific genes.
Horticulturae 07 00235 g005
Figure 6. Most representative GO terms in candidate reference genes and tissue-specific genes. (A) Top representative GO terms of potential housekeeping genes. (B) Heatmap reporting the most significant GO terms in leaf-, stem- and root-specific genes. Color legend represents ‒log10(FDR).
Horticulturae 07 00235 g006
Table 1. qPCR primers for candidate and commonly used housekeeping genes.
Gene_IDSymbolGene NameForward PrimerReverse PrimerProduct (bp)
AUR62013045APX3L-ascorbate peroxidase 3TCGTCAACACAGAATACCTGCACTCTTCCTCATTCCTA179
AUR62038932AHRIKetol-acid reductoisomeraseGGTGTCTATGTTGCTCTAATGAAGTCTTGCTGTGGTTGA174
AUR62019540MDH1Malate dehydrogenase 1GGTTCAGCAACATTGTCTATTCTTCCACTCCATTCTTCC170
AUR62020291RSZ22Serine/arginine-rich splicing factor RSZ22TGCTATGAGTGTGGTGAGGGCTCCTCCTGTATCTTG109
AUR62013759RGGARGG repeats nuclear RNA binding protein A-likeAAGTCTGTCAGCATTAACGTTACCTCCACCACCATATC113
AUR62010794VATEV-type proton ATPase subunit EGTTGCCGAAAGGATGATGCCAGGAGGAAGATGAATAGT124
AUR62030760MIFMacrophage migration inhibitory factor homologCTTATGTTATGGTGGTGCTTATTGTTGGTGTCGGGATTA115
AUR62009613ADF1Actin-depolymerizing factor 1GCCGTTATGCTGTGTATGTGAATGCCATCCAACTCT160
AUR62008267CYCLCytochrome c1-1CACATCTCATCCTCCTCTTATCTACCTCCAGCCATTATC134
AUR62018470UBA2BUBP1-associated protein 2BTGTTCGTGTATAGGAGTGTTCCTCTTGGCTGATGATGT145
AUR62012065OEP163Outer envelope pore protein 16-3ACCAGGATTGATAAGGACTTCCAACTGCTCCATTAACAA138
AUR62032855HEX1Woronin body major proteinGCTTCCTATGACAAATGGGCGTTCCGATTTCAATTCACT94
AUR62042589GAPDHGlyceraldehyde-3-phosphate dehydrogenaseAGCAGCAGGTCCGTTGAAGGACCACCCGTTGGCTGTAACC180
AUR62039382ACT1Actin-1CGTGTGGCTCCAGAAGAGCACCTGTTGTACGTCCACTGGCA167
Table 2. Tissue specificity index ô and maximum expression level of the candidate tissue-specific genes.
Gene_IDSymbolτTissue with the Highest ExpressionMaximum Relative Expression Level
AUR62005063L10.488Leaf1
AUR62005589L20.968Leaf35.334
AUR62005590L30.975Leaf35.09
AUR62039526L40.94Leaf53.557
AUR62034418L50.695Leaf2.193
AUR62039803L60.69Leaf4.237
AUR62033160R10.90Root9.51
AUR62010528R20.91Root25.28
AUR62016467R30.74Root4.72
AUR62026665R40.62Root4.69
AUR62038762R50.80Root16.22
AUR62043174R60.92Root8.51
AUR62002636R70.99Root32.67
AUR62032910R80.89Root12.21
AUR62009323R90.98Root35.02
AUR62002145S10.65Stem2.00
AUR62003648S20.39Root35.75
AUR62028094S30.62Stem60.55
AUR62017190S40.67Stem40.22
Publisher’s Note: MDPI stays neutral with regard to jurisdictional claims in published maps and institutional affiliations.

