Article

Foliar Application of ZnSO4 and CuSO4 Affects the Growth, Productivity, and Fruit Quality of Washington Navel Orange Trees (Citrus sinensis L.) Osbeck

by
Sherif Fathy El-Gioushy
1,
Rokayya Sami
2,*,
Amina A. M. Al-Mushhin
3,
Hanan M. Abou El-Ghit
4,
Mohamed S. Gawish
5,
Khadiga Ahmed Ismail
6 and
Reda M. Y. Zewail
7
1
Horticulture Department, Faculty of Agriculture (Moshtohor), Benha University, Benha 13511, Egypt
2
Department of Food Science and Nutrition, College of Sciences, Taif University, P.O. Box 11099, Taif 21944, Saudi Arabia
3
Department of Biology, College of Science and Humanities in Al-Kharj, Prince Sattam Bin Abdulaziz University, Al-Kharj 11942, Saudi Arabia
4
Botany and Microbiology Department, Faculty of Science, Helwan University, Cairo 11111, Egypt
5
Pomology Department, Faculty of Agriculture, Damietta University, Damietta 34511, Egypt
6
Department of Clinical Laboratory Sciences, College of Applied Medical Sciences, Taif University, P.O. Box 11099, Taif 21944, Saudi Arabia
7
Department of Botany, Faculty of Agriculture, Benha University, Benha 13511, Egypt
*
Author to whom correspondence should be addressed.
Horticulturae 2021, 7(8), 233; https://doi.org/10.3390/horticulturae7080233
Submission received: 1 July 2021 / Revised: 1 August 2021 / Accepted: 3 August 2021 / Published: 9 August 2021

Abstract

:
The goal of this study was to examine how to improve the vegetative growth, nutritional status, productivity, and fruit quality of Washington navel orange trees by examining the effect of foliar application of ZnSO4 (0, 300, and 600 mg/L) solutions in combination with CuSO4 (0, 200, and 400 mg/L) solutions on Washington navel orange trees, which were 11 years old and grown in clay loam soil with a surface irrigation system. The results showed that all the investigated measurements responded specifically to each investigated factor. ZnSO4 elicited a stronger and more effective response than CuSO4. Nonetheless, the response varied only slightly or moderately from one measurement to the next. In terms of the interaction effect between ZnSO4 and CuSO4 concentrations, the effect of each investigated factor was directly reflected in its combinations, with ZnSO4 (600 mg/L) and CuSO4 (200 and 400 mg/L) being the most effective for the majority of the measurements under consideration. When the highest level of ZnSO4 was combined with the highest level of CuSO4, the highest values for the various vegetative growth parameters shoot length and diameter, number of leaves per shoot, leaf area, and total assimilation area per shoot were obtained. As a result, the nutritional status (the highest total leaf chlorophyll and leaf mineral contents) was significantly coupled with the treatment of 600 mg/L ZnSO4 in combination with 400 mg/L CuSO4. Moreover, the combinations of the highest ZnSO4 concentration (600 mg/L) and CuSO4 concentration (400 mg/L) exhibited the greatest statistical values of the measurements of fruiting aspects as well as fruit quality. Consequently, it can be recommended that using 600 mg/L ZnSO4 in combination with 400 mg/L CuSO4 as a foliar spray on monthly basis during the period from March to July could be safely recommended under similar environmental conditions and horticulture practices adopted in the present experiment.

1. Introduction

Plants require micronutrients, such as zinc, manganese, copper, boron, and molybdenum. Except for molybdenum, all micronutrients are unavailable in Egypt. Zinc added to alkaline soil is typically adsorbed or precipitated on the surface and does not easily pass to the root region, according to research. Furthermore, because citrus is a deep-rooted tree, applying micronutrients to the soil may be ineffective [1]. Zn foliar application increased sweet orange fruit yield compared with the control treatment [2].
Plant nutrients are easily absorbed through the surface of the leaves; as a result, Swietlik [3] stated that the mineral nutrients reached the leaf in three stages: (1) penetration through the cuticle and epidermal walls, (2) adsorption on the surface of the plasmalemma, and (3) passage through the plasmalemma to the cytoplasm. Foliar treatments are also required in cases of immobilization processes, which render the application to soils ineffective. Nutrient absorption is determined by several influences, including plant types, leafage, nutrient type and concentration, product formulation, climatic conditions, and plant nutritional status [4]. Citrus development has also been affected by micronutrients such as zinc (Zn) and copper (Cu) applications. These components influence the biochemical functions of the plant system. Zn is an important micro factor essential for plants because of its role in tryptophan synthesis, a precursor to indole acetic acid synthesis [5].
Citrus trees are the most economically important fruit crop in Egypt in terms of cultivated area, output, and export potential. Egypt is considered to be the world’s largest orange exporter and is ranked as the sixth-largest producer. The orange is the major species of citrus in Egypt. Where an area of approximately 133,236 hectares was planted, accounting for about 69% of the total citrus area, producing about 2.9 million tons, and representing about 71% of the total citrus harvest, orange exports were about 1.1 million tons, accounting for about 92% of the total citrus exports [6]. There are different problems with navel orange productivity in the Delta zone, such as (1) a lack of sufficient quantity of fertilizers, still, mostly no prescribed fertilization programmers; (2) vast areas that have had low productivity due to the orange crop, with some of these orchards planted more than 50 years ago; (3) low productivity of different orchards (around 22 tons/ha); and (4) most orchards in the Delta area having mixed varieties within the same field [7].
Zn is needed for the action of different enzymes, such as dehydrogenases, aldolases, isomerases, transphosphorylases, and RNA and DNA polymerases [8]. It has an essential function in the metabolism of starch and serves as a co-factor for several enzymes, and it influences photosynthesis reactions, nucleic acid metabolism, and protein biosynthesis [9]. Bergmann [10] indicated that zinc is assumed to be involved in chlorophyll synthesis because of its effect on protein, carbohydrate, and energy metabolism. Taiz and Zeiger [11] stated that several enzymes needed zinc ions (Zn2+) for their function, and zinc may be required for chlorophyll biosynthesis in some plants.
Cu is involved in the stimulation of lignification of all plant cell walls, photosynthesis, and electron carriers in plant enzyme systems [12]. It plays an essential function in the synthesis and/or stabilization of other plant pigments in chlorophyll soil. Copper also participates in various physiological processes and is an important cofactor for certain metalloproteinases, but complications occur when excess copper is found in cells [13].
As a result, the purpose of this study was to determine the effect of spraying ‘Washington’ navel orange trees with varying concentrations of ZnSO4 and CuSO4 on vegetative growth, nutritional status, yield, and fruit quality.

2. Materials and Methods

During the 2019 and 2020 experimental seasons, 11-year-old Washington navel orange trees budded on Sour orange rootstock were planted 5 × 5 meters apart (168 trees/fed.) in a private orchard under surface irrigation located in the Toukh region, Qalyubia Governorate, Egypt. The experimental area was located at an altitude of 45 m above mean sea level between the 30.45 N latitude and 31.10 E longitude. The same horticultural practices were applied to all trees as recommended by the Ministry of Agriculture and implemented in the region. This study was designed to determine the effects of different ZnSO4 and CuSO4 concentrations on the growth, nutritional status, and fruiting aspects of Washington navel orange trees. Before the start of the first season (2019) a mechanical and chemical analysis of the orchard soil surface (40 cm depth) was carried out according to [14], as shown in Table 1 below.
The nine treatments involved in this study can be summarized as follows:
  • 1—Tap water (control), 2—CuSO4 200 mg/L,
  • 3—CuSO4 400 mg/L, 4—ZnSO4 300 mg/L,
  • 5—ZnSO4 300 mg/L + CuSO4 200 mg/L, 6—ZnSO4 300 mg/L + CuSO4 400 mg/L,
  • 7—ZnSO4 600 mg/L, 8—ZnSO4 600 mg/L + CuSO4 200 mg/L,
  • 9—ZnSO4 600 mg/L + CuSO4 400 mg/L
Considering that the forms of zinc and copper added were copper sulfate and zinc sulfate solutions, the molecular weight of CuSO4 was 159.61 and the molecular weight of copper was 63, and the molecular weight of ZnSO4 was 161.47 and the molecular weight of zinc was 65.21.

2.1. Experiment Layout

The nine investigated fertilization treatments were organized using a complete randomized block design with three replications, with a single tree representing each replicate. As a result, 27 healthy fruitful Washington navel orange trees that were healthy, disease-free, and in the on-year state were carefully selected. The chosen trees were divided into three categories (blocks) on the basis of their growth vigor, with each block containing nine similar trees, each of them received one of the nine foliar spray treatments investigated (a single tree was randomly subjected to one treatment). During each season, the dedicated trees for each treatment were sprayed five times with the corresponding solution in one-month intervals beginning at full bloom. Considering that spraying treatments were used to cover the entire foliage of each tree canopy, 5 liters were found to be sufficient in this regard. In the second year, all treatments were repeated with different trees in the same experiment area. Climatic data presented in Table 2 showing the different weather data for the experimental area.
During the first and second seasons of study, four main branches (limbs/scaffolds) well-distributed around each tree’s periphery were carefully selected and tagged late in March 2019 and 2020. In addition, 20 newly developed spring shoots were labeled.

2.2. Vegetative Growth Measurements

In the middle of October, the following vegetative growth parameters were determined during the first and second experimental seasons.
In this regard, the average number of newly developed shoots per one meter of each tagged limb, average length and thickness, and the number of leaves per labeled shoot were estimated. In addition, the average leaf area (cm2) on a weight basis was also determined. Hence, 20 mature leaves from the previously labeled shoots per limb were randomly collected. Then, 20 disks from each centimeter of the area were taken and oven-dried, together with the leaves, at 80 °C until a constant weight was achieved. Using a known dry weight of leaves with a known surface area, i.e., 20 leaf discs on one hand and the total weight of 20 leaves on the other, the average leaf area in centimeters was calculated. Moreover, the assimilation area per shoot was calculated according to the following equation: Assimilation area = leaf area x No. of leaves per one shoot.

2.3. Biochemical Analysis

2.3.1. SPAD Chlorophyll

The total chlorophyll content in fresh leaves was determined using Minolta meter SPAD-502.

2.3.2. Estimation of Certain Minerals

During both seasons, representative samples of the fourth and fifth leaves from the bases of spring shoots were collected from each replicate in October. The samples were thoroughly washed with tap water, rinsed twice with distilled water, oven-dried at 80 °C until they reached a constant weight, and finely ground. A 250 mL digestion flask previously washed with acid and distilled water was filled with 0.2 g of ground plant material. A 6 mL mixture of concentrated (5 mL) sulfuric acid and (1 mL) perchloric acid (70%) in a 5:1 (v/v) ratio was added. The samples were digested on an electric heater until dense white fumes appeared, at which point the solution became clean and a volume of about 2.5 mL was obtained. The samples were then allowed to cool before being quantitatively transferred into a 50 mL volumetric flask and diluted with distilled water. The distilled water was used to reach the required volume. The modified micro Kjeldahl method described by [15] was used to determine the total Nitrogen content (N). The total phosphorus (P) was determined by wet digestion of plant materials using sulfuric and perchloric acid, as recommended by [16]. The total potassium in the digested material (total leaf K) was determined photometrically using the method described in [17]. Following [18], the calcium and magnesium percentages, as well as the iron, manganese, and zinc contents, were determined using an atomic absorption spectrophotometer (Perkin Elmer-3300).

2.4. Productivity Measurements

2.4.1. Fruit Set Percentage

During each experimental season, the number of perfect flowers per tagged limb was counted at full blooming after estimating of 75% of the petal fall fruit set as a percentage of perfect flowers utilizing the following equation:
Fruit set % = Number of set fruitlets Number of perfect flowers × 100
Fruit retention %:
During each experimental season, the percentage of retained fruits was estimated in late December using the following equation:
Fruit s retention % = Number of presented ( remained ) fruits at a given date Number of set fruitlets × 100

2.4.2. Yield Attributes

Fruits from each tree were harvested separately in late December 2019 and 2020, then counted and weighed. The number or weight (in kilograms) of fruits harvested per tree was used to estimate tree productivity (yield), and furthermore, the yield per tree.

2.4.3. Fruit Quality

Fruit Physical Properties

At harvest time, 15 healthy fruits were taken from each treatment to estimate the fruit’s physical properties. The fruit’s physical properties investigated in this case were the average fruit weight (g), dimensions (polar and equatorial diameters, i.e., length and width in centimeters), fruit shape index (length: width), juice weight and juice %, and peel thickness (mm).

Fruit Chemical Characteristics

The total soluble solids percentage (TSS %) of fruit juice was determined using a Carl Zeins hand refractometer. Following [19], fruit total acidity (grams of citric acid per 100 mL of juice) and ascorbic acid (V.C) content (milligrams of ascorbic acid per 100 mL fruit juice) were determined. The total soluble solids/acid ratio was calculated as well. Following [19], the ascorbic acid/vitamin C content was determined by titration with a 2,6-dichlorophenol-indophenol indicator. Furthermore, the percentage of total sugar was calculated using the method described by [20].

2.5. Statistical Analysis

All data collected during both experimental seasons were subjected to an analysis of variance, and significant differences between means were determined using the formula in [21]. Letters were used for distinguishing between the means of specific effects of two investigated factors, i.e., ZnSO4 and CuSO4 concentrations and the interaction between them, according to Duncan’s multiple test range [22].

3. Results

The influence was assessed by comparing the responses of the various parameters under study to each investigated factor (ZnSO4 and CuSO4) separate with the responses to different concentrations of these factors is a specific effect. In addition, the interaction effect of ZnSO4 with CuSO4 concentrations (combinations).

3.1. Vegetative Growth Measurements

The investigated growth parameters in response to the different treatments were the number of developed shoots per meter of each tagged main branch (limb/scaffold), the average shoot length and diameter, the number of leaves/shoots, the average leaf area, and the total assimilation area/shoot. Figure 1 and Figure 2 displays data collected during the 2019 and 2020 seasons.

3.1.1. Specific Effect

It is quite clear that all the above-mentioned vegetative growth parameters were specific to each investigated factor. Nevertheless, not only did the grade of response vary from one vegetative growth measurement to the next, but the rates of difference of the investigated measurements exhibited by ZnSO4 were more pronounced than those exhibited by CuSO4. Moreover, it is noted in Figure 1 and Figure 2 that the highest values for the different vegetative growth parameters were recorded when the highest level of ZnSO4 or the highest level of CuSO4 was used. This was true for all growth measurements taken over two seasons.

3.1.2. Interaction Effect

The results showed that in both seasons, the recorded vegetative growth parameters were all favorably influenced by the different ZnSO4 and CuSO4 treatments. Moreover, the values recorded for the different parameters showed steady significant increases when raising the application rates of ZnSO4 and/or CuSO4. Accordingly, the highest values for the different parameters were recorded when the highest level of ZnSO4 was combined with the highest rate of CuSO4.

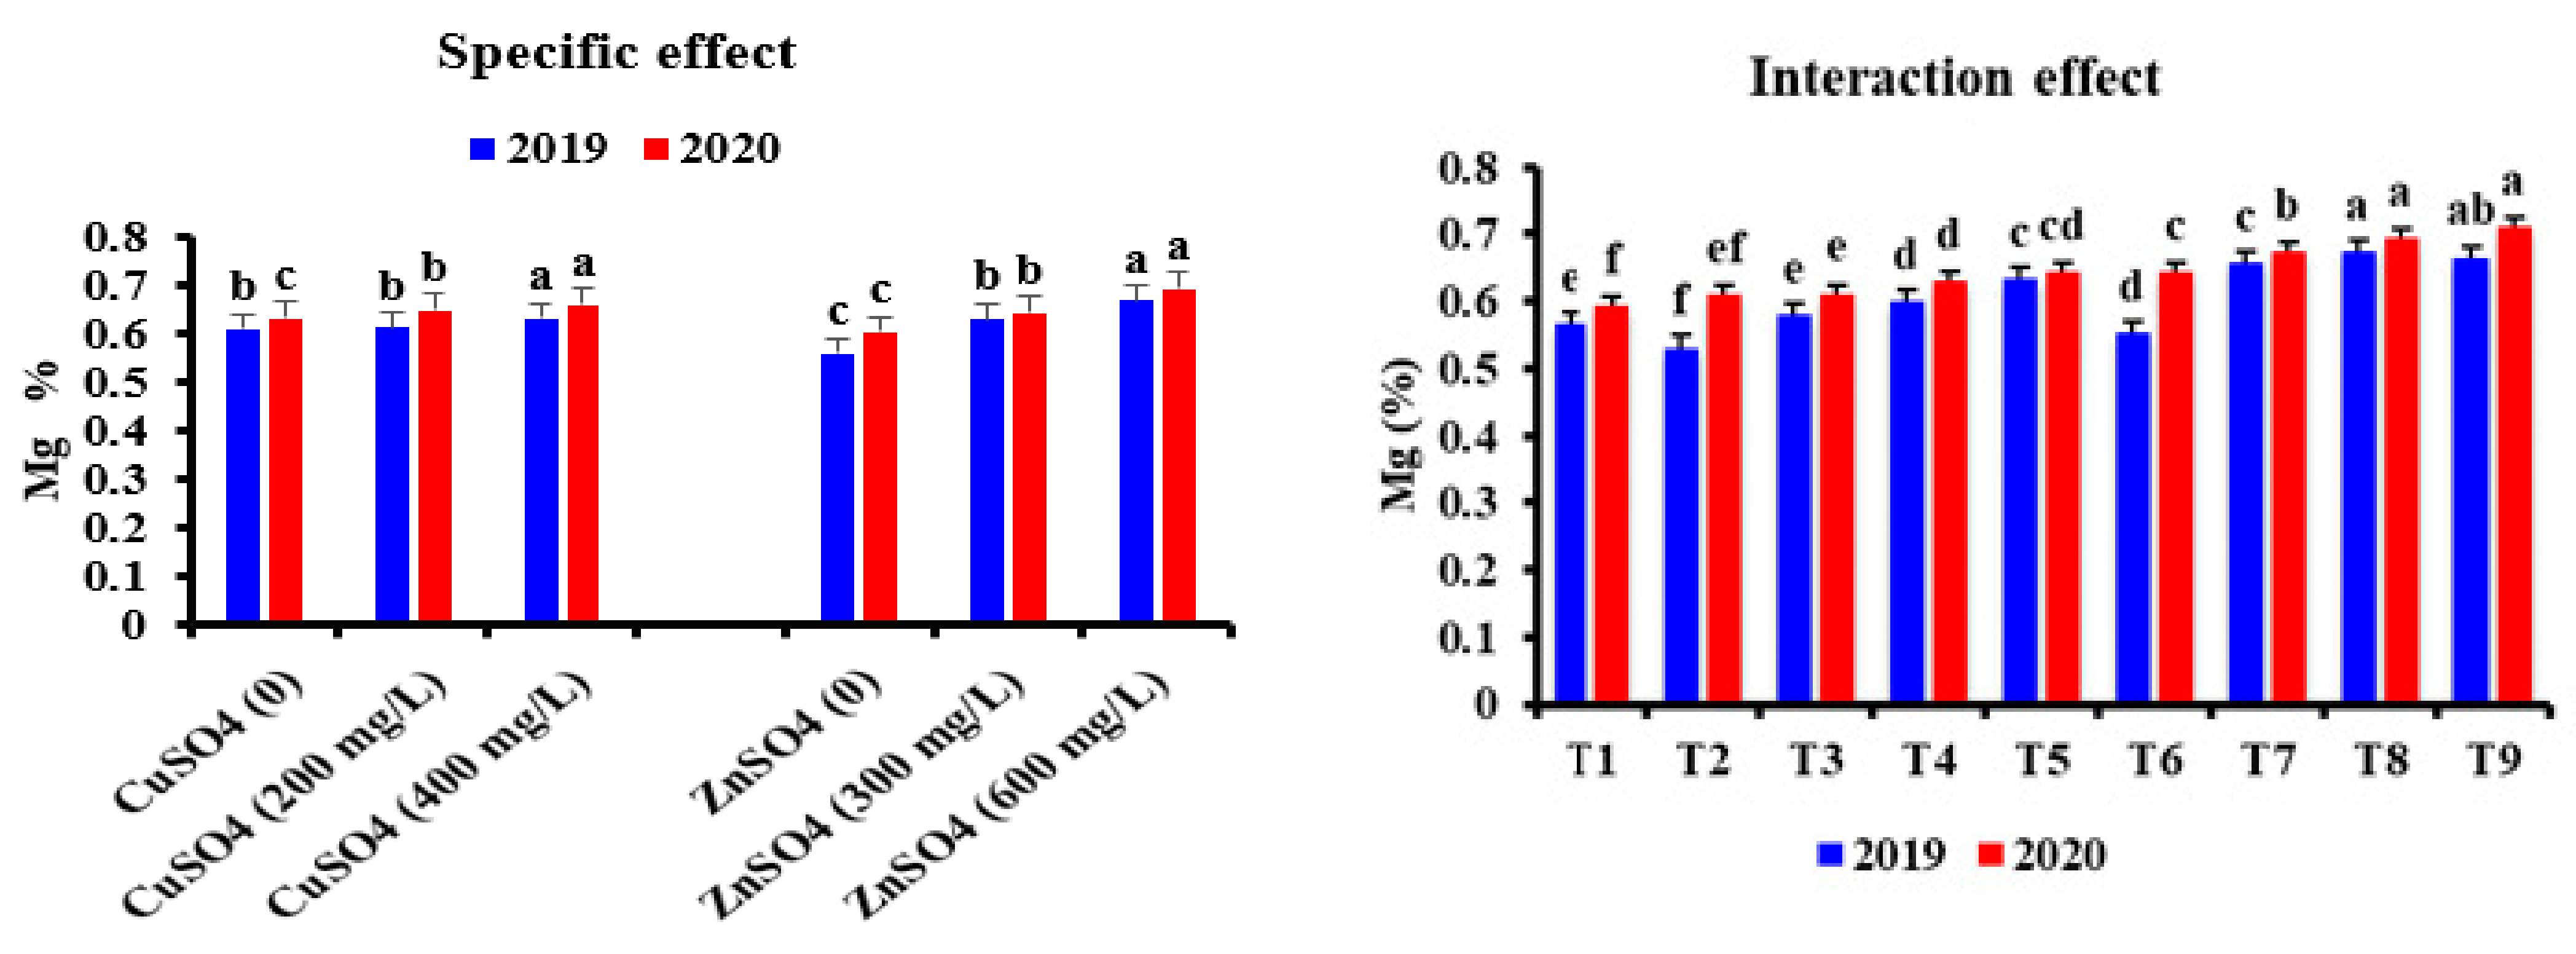
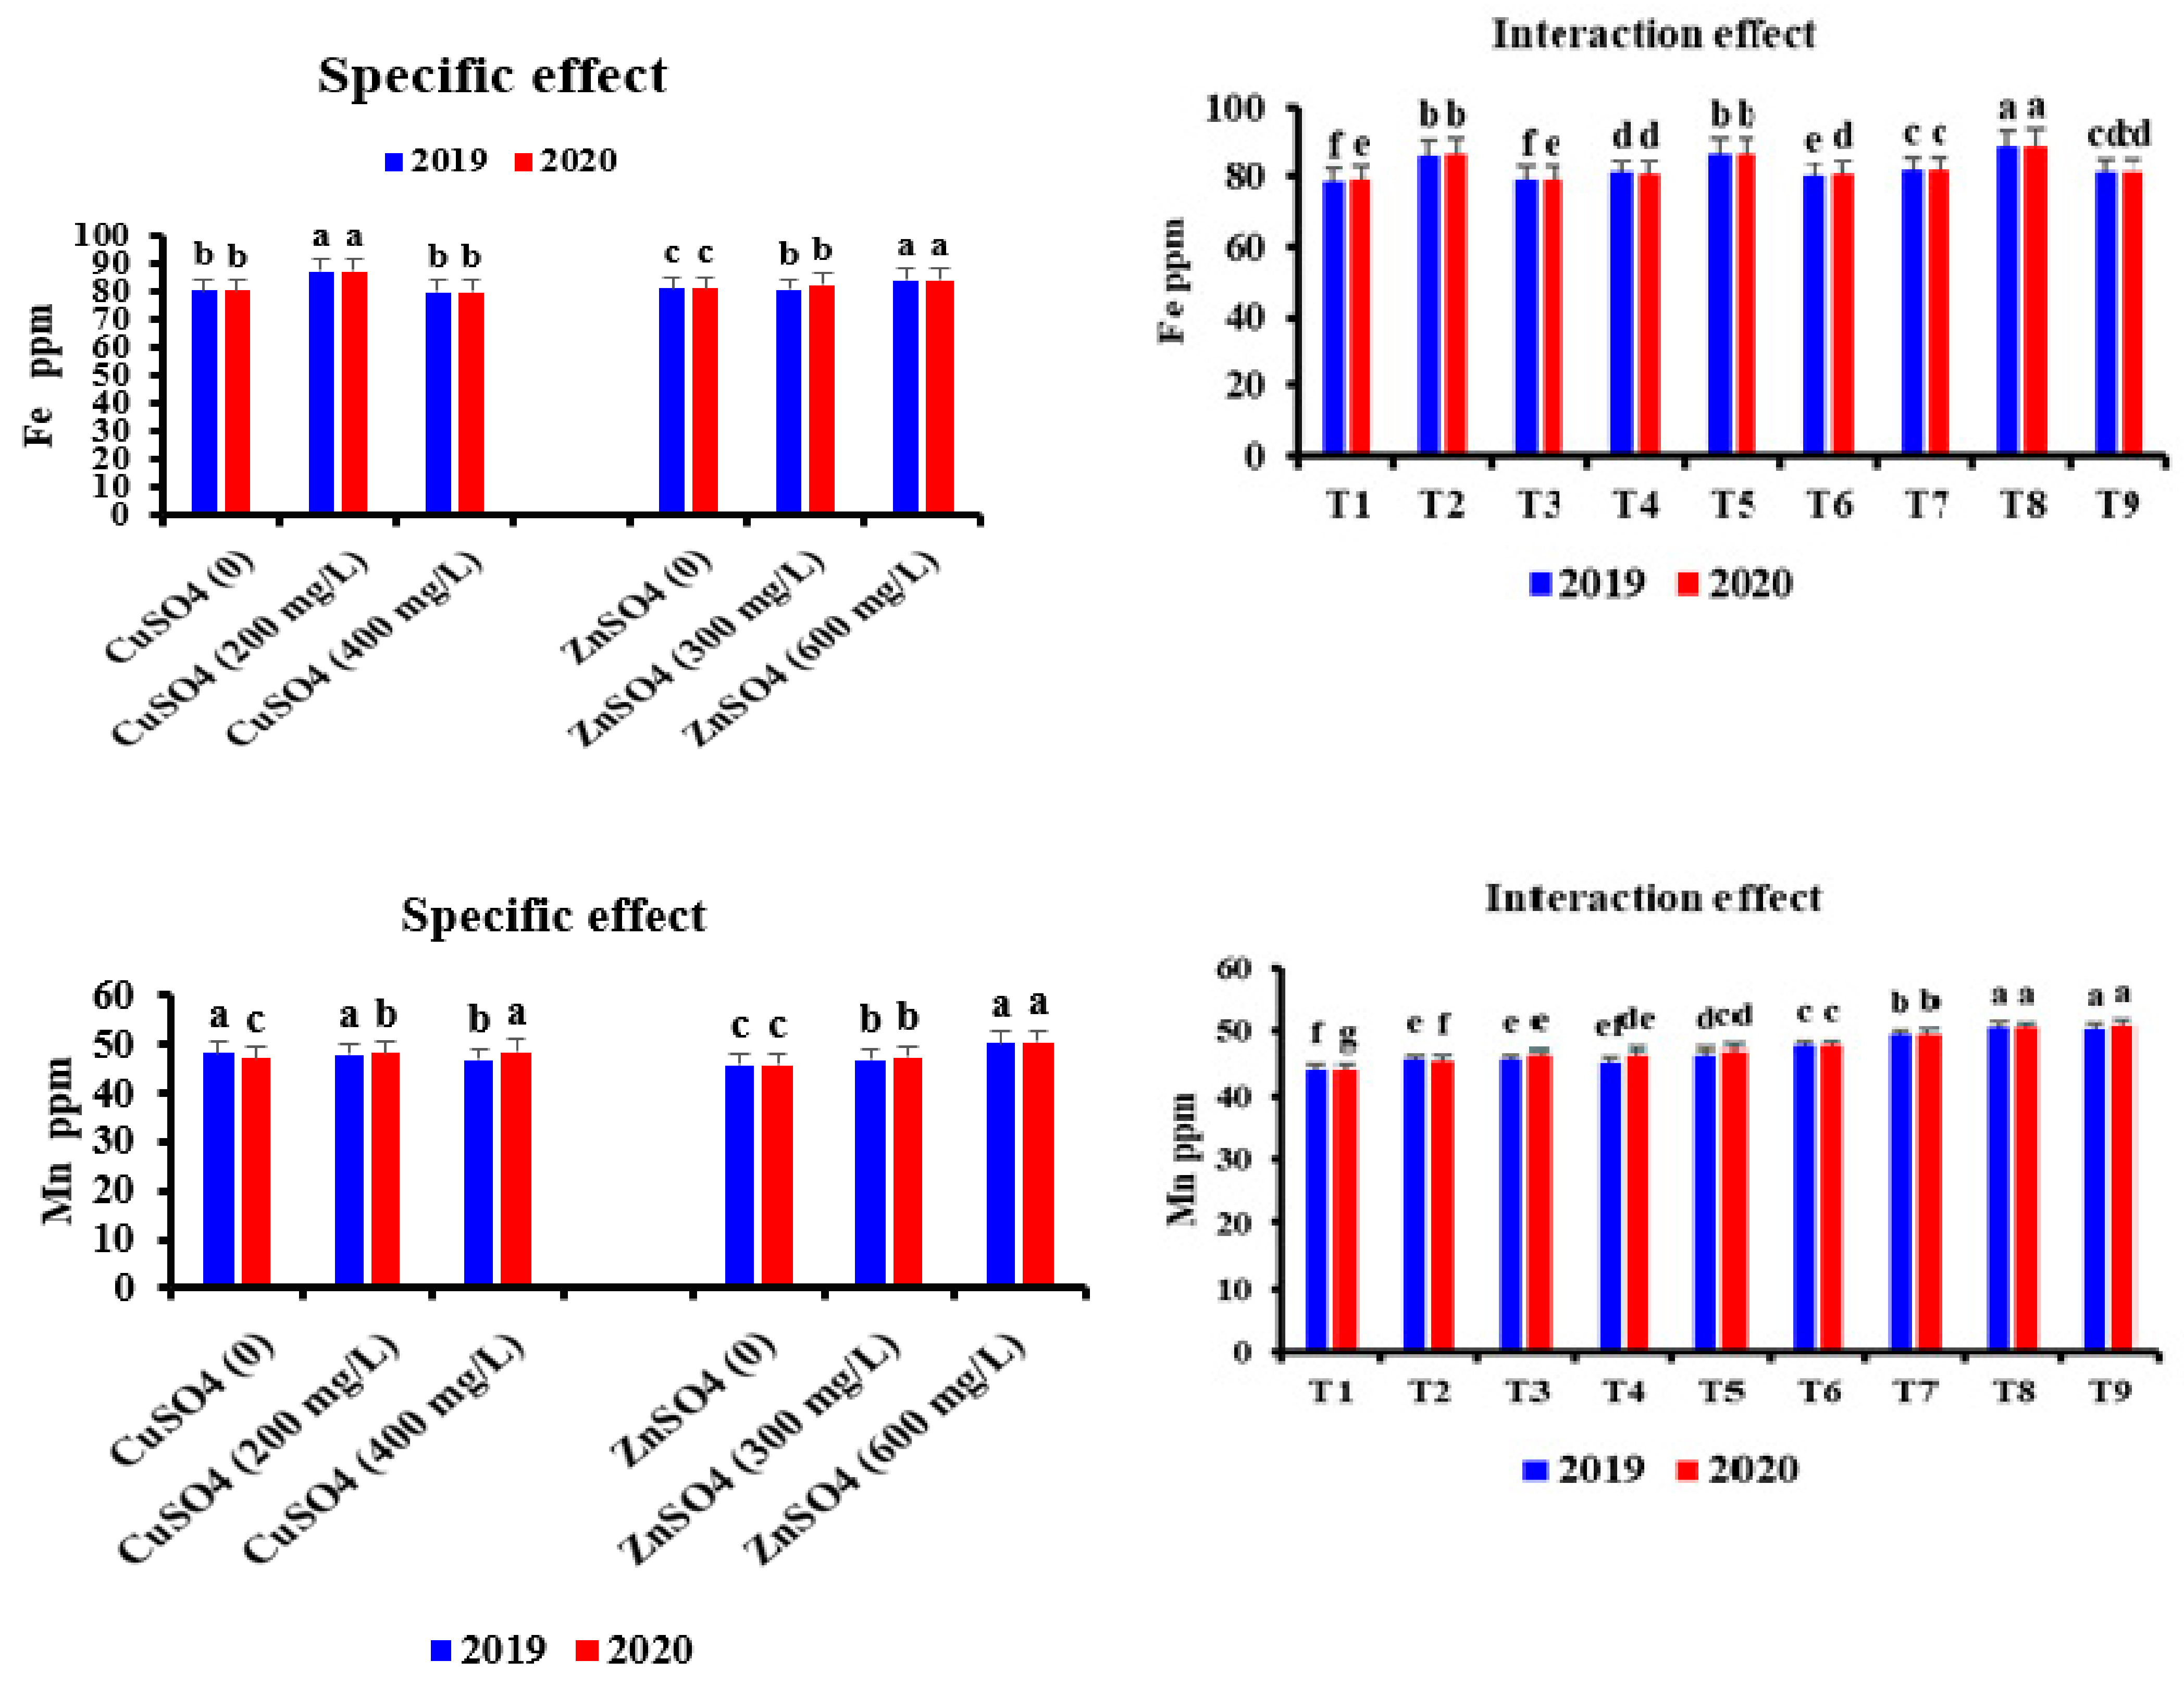
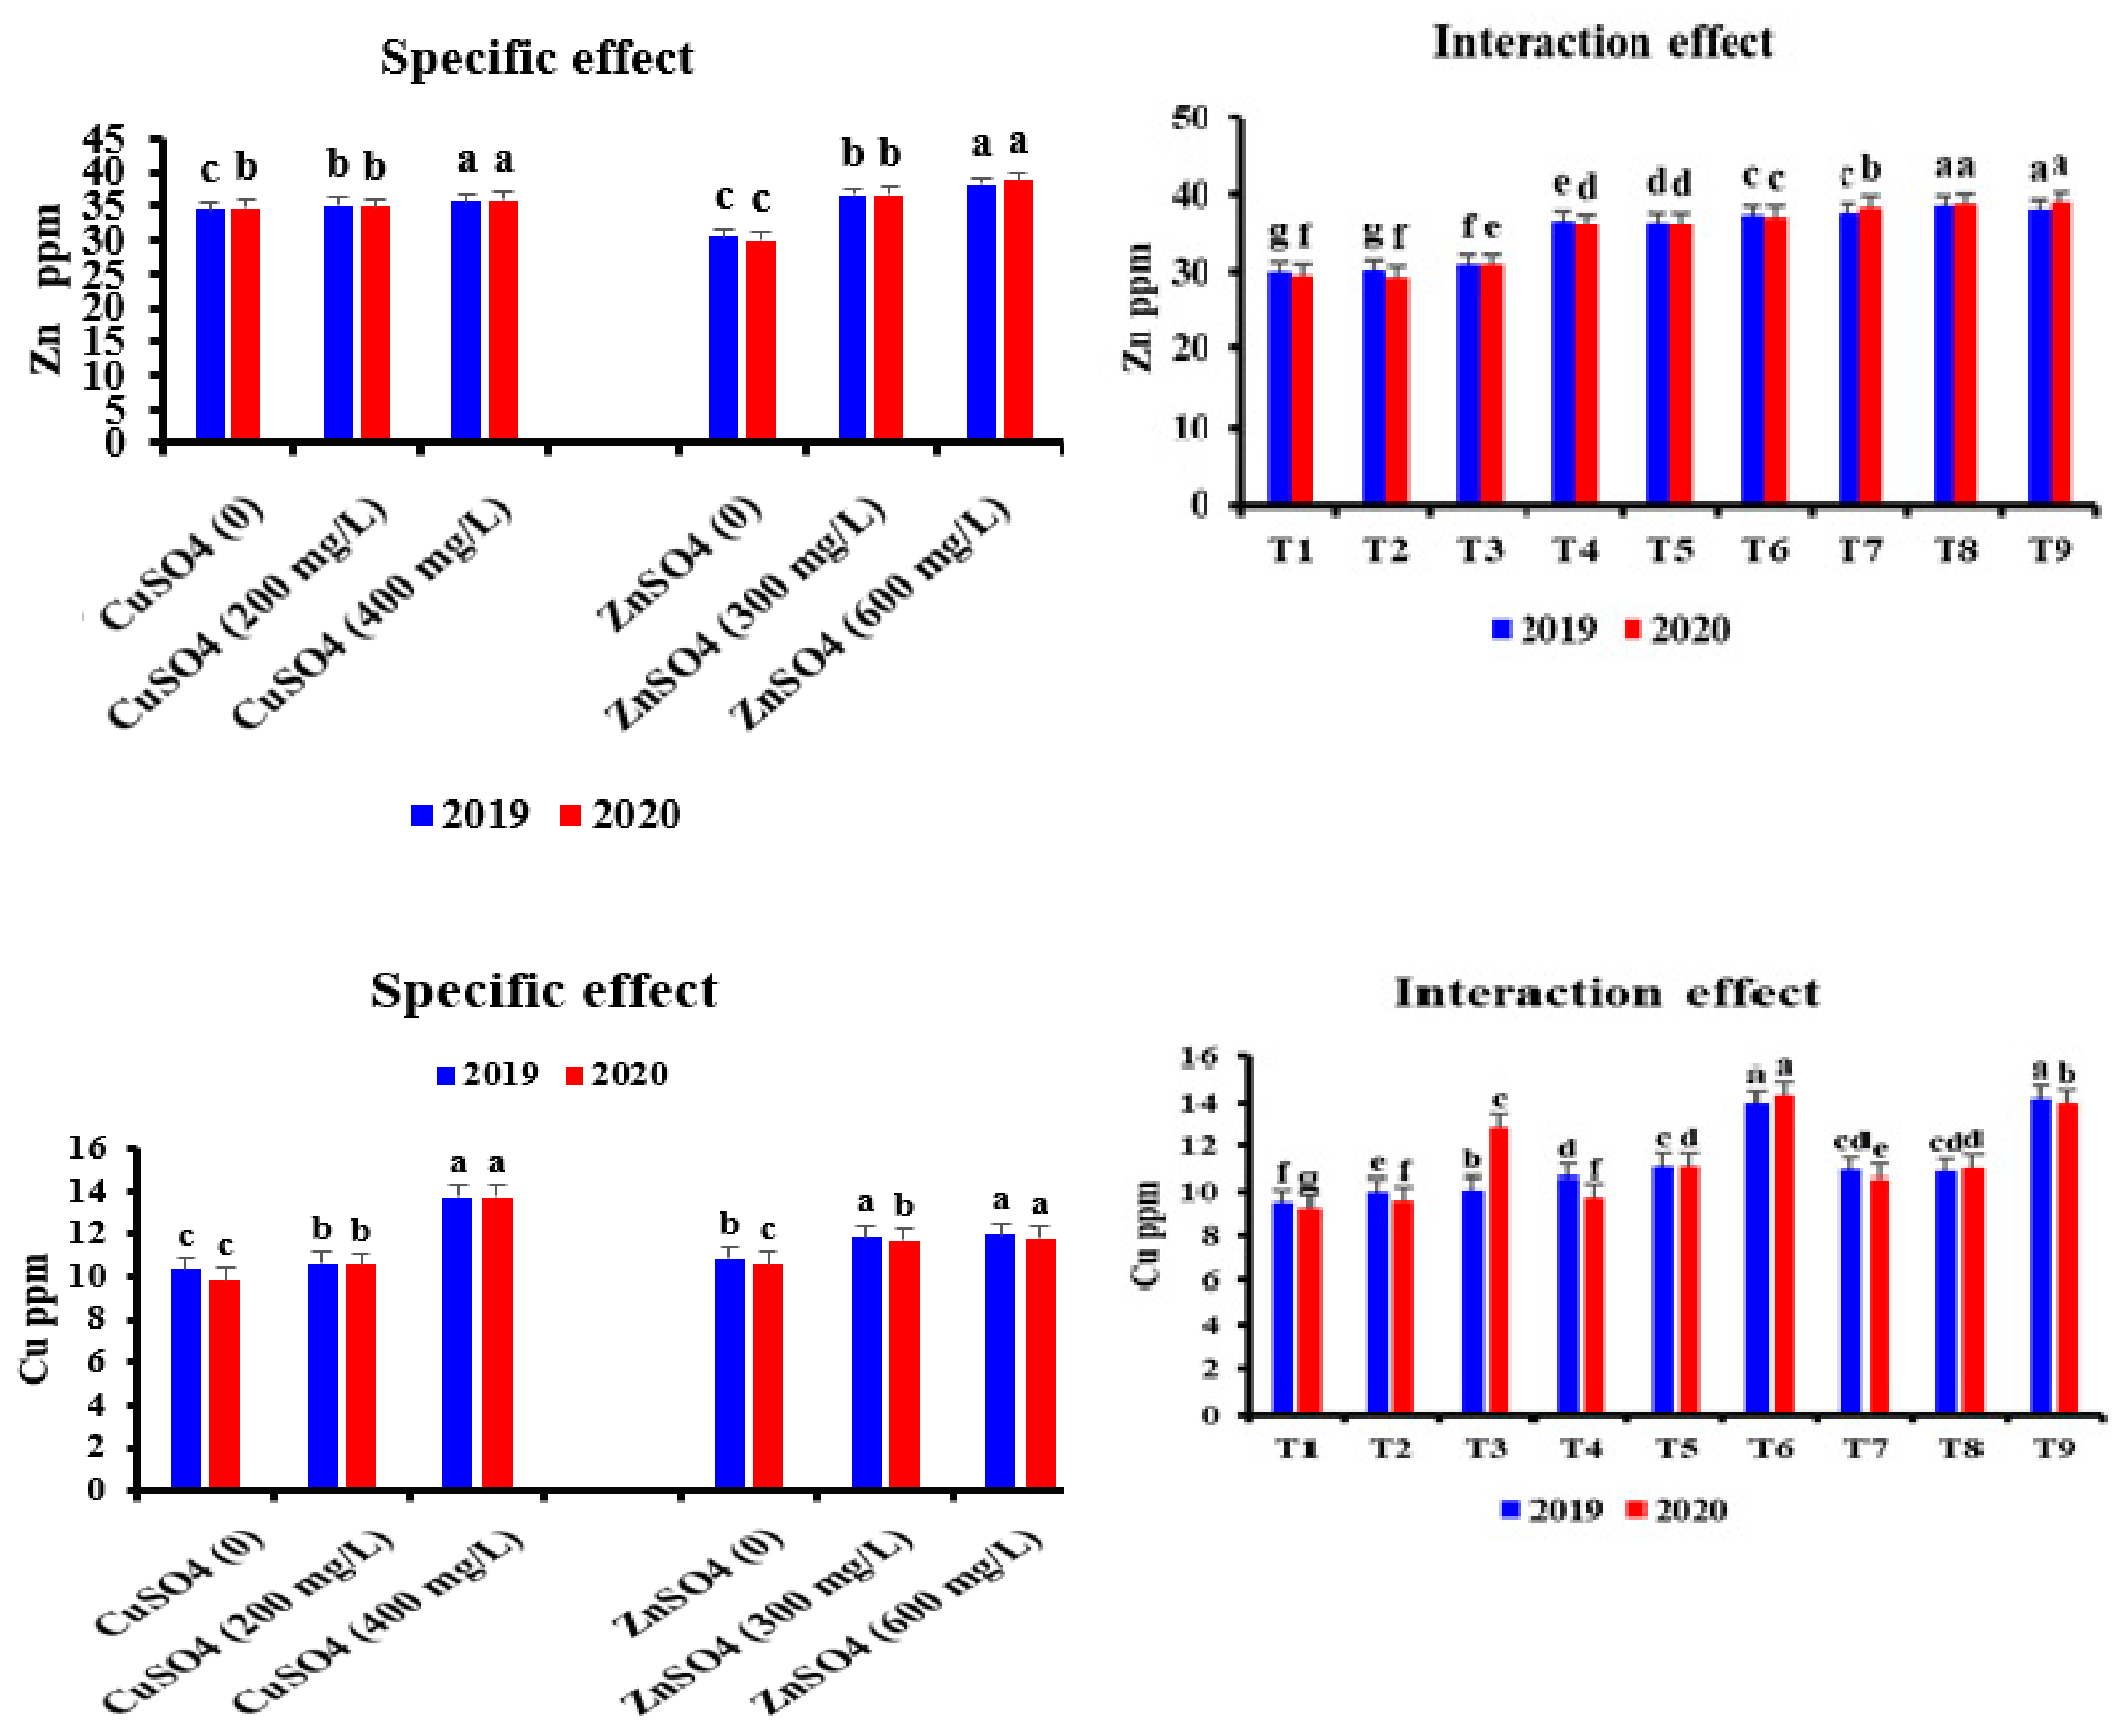
3.2. Total Chlorophyll and Macro and Micronutrient Contents in the Leaves

The data presented in Figure 3, Figure 4 and Figure 5 indicates that the total chlorophyll content together with the nutritional status of Washington navel orange trees, i.e., N, P, K, Ca, Mg, Fe, Mn, Zn, and Cu contents, were influenced by specific and interaction effects of different concentrations of ZnSO4 and CuSO4 and their combinations during 2019 and 2020 seasons.
As for the specific effect of ZnSO4 spray solutions, all concentrations significantly increased all investigated leaf chemical compositions compared with the control. Such a trend was seen during both seasons. Moreover, the most effective ZnSO4 was significantly coupled with its highest concentration (600 mg/L) in terms of the response of total chlorophyll content and macro and micronutrient contents. However, the high concentration of CuSO4 (400 mg/L) resulted in a slight increase in the total leaf chlorophyll content and level of macro and micronutrient contents.

3.3. Interaction Effect

Concerning the interaction effect between ZnSO4 concentrations and CuSO4 concentration on the total leaf chlorophyll, and furthermore on the macro and micronutrients contents. The data presented in Figure 3, Figure 4 and Figure 5 indicates that the different combinations varied in terms of their effect on the leaf chemical compositions of Washington navel orange trees. However, the most effective combinations were generally in a relationship with those between the highest concentration of ZnSO4 (600 mg/L) and the highest CuSO4 concentration (400 mg/L). Moreover, the trend of response varied greatly or slightly from one leaf chemical constituent to another. The highest leaf mineral contents were significantly coupled with the treatment of 600 mg/LZnSO4 with 400 mg/LCuSO4 in both seasons. On the contrary, the lowest values of all or most leaf chemical constituents were usually concomitant with combinations between the lowest ZnSO4 concentration (0 mg/L) and other CuSO4 concentration (200 mg/L and 400 mg/L). In addition, other combinations were in the middle of the aforementioned two extremes. The obtained results can explain the basis of the more pronounced response of various nutritional status measurements to the specific effect of ZnSO4 concentration rather than the specific effect of CuSO4 concentration.

3.4. Some Fruiting Characterization in Response to ZnSO4 and CuSO4 Foliar Application

The data obtained for the fruit set %, fruit retention %, number of fruits/tree, average fruit weight (g), yield/tree (kg), and yield/ha (ton) as productivity measurements in response of the two evaluated factors during the 2019 and 2020 seasons are presented in Figure 6 and Figure 7.

3.4.1. Specific Effect

It is undeniable that all the aforementioned fruiting measurements responded specifically to each investigated factor. Even so, not only did the grade of response vary from one fruiting parameter to another, but the rates of difference in the investigated measurements exhibited by ZnSO4 were also more pronounced than the corresponding ones produced by CuSO4. However, in general, the two ZnSO4 spray solutions (300 and 600 mg/L) significantly increased all fruiting measurements compared with the control (water spray). Such a trend was seen with all fruiting measurements during the two seasons. The response of these fruiting parameters to the specific effect of ZnSO4 and CuSO4 concentrations emphasized unequivocally that the highest values of such measurements were significantly close to the highest ZnSO4 and CuSO4 concentrations (600 and 400 mg/L).

3.4.2. Interaction Effect

Figure 6 and Figure 7 clearly show that in both seasons, the recorded fruiting parameters (fruit set %, fruit retention %, number of fruits/tree, average fruit weight/tree, yield/tree, and yield per hectare) were all favorably influenced by the different concentrations of ZnSO4 and CuSO4. Moreover, the values recorded for the different parameters showed steady significant increases when raising the application rates of ZnSO4 and/or CuSO4. Accordingly, the highest values for the different parameters were recorded when the highest level of ZnSO4 was combined with the highest level of CuSO4.
In addition, all investigated fruiting parameters that responded specifically to any investigated factor were also influenced by the factors’ combinations. Consequently, a combination of the highest ZnSO4 concentration (600 mg/L) and either CuSO4 concentration (200 and 400 mg/L) exhibited, statistically, the greatest values of such measurements.

3.5. Fruit Quality

3.5.1. Fruit Physical Properties

The fruit dimensions (equatorial and polar diameters), fruit shape index, peel thickness, juice %, and weight were the evaluated fruit physical properties of Washington navel oranges in response to the differential investigated foliar spray treatments. The data obtained during both the 2019 and 2020 experimental seasons are presented in Figure 8 and Figure 9.

3.5.2. Specific Effect

It is abundantly clear that all the above-mentioned fruiting measurements responded specifically to each investigated factor. However, not only did the grade of response vary from one fruiting measurement to the next, but the rates of difference of the examined parameters exhibited by ZnSO4 were greater than the analogous ones exhibited by CuSO4. In general, the two ZnSO4 spray solutions (300 and 600 mg/L) and CuSO4 spray solutions (200 and 400 mg/L) significantly increased all fruit physical properties compared with the control (water spray). Such a trend was observed for all fruit physical properties during the two seasons with only one exception is the fruit shape index, and a significant difference between all ZnSO4 and CuSO4 concentrations was absent. The response of these fruit physical properties to the specific effects of ZnSO4 and CuSO4 concentration pointed out that these parameters were in a significantly strong relationship with the highest ZnSO4 and CuSO4 concentrations.

3.5.3. Interaction Effect

Concerning the interaction effect of different combinations among ZnSO4 and CuSO4 concentrations on the differential abovementioned parameters of Washington navel oranges, the data presented in Figure 8 and Figure 9. In addition, all investigated fruit physical parameters that responded specifically to any investigated factor. Consequently, the combinations of the highest ZnSO4 concentration (600 mg/L) and CuSO4 concentration (400 mg/L) exhibited, statistically, the greatest values of such measurements exactly (fruit dimensions (equatorial and polar diameters), fruit shape index, peel thickness, and juice % and weight).
On the contrary, the lowest values of the previous parameters were always in a close relationship with the control (ZnSO4 concentration (0 mg/L) and CuSO4 concentrations (0 mg/L). Such a trend was seen during both seasons, with only one exception, the fruit shape index, which did not significantly respond to any investigated combination.

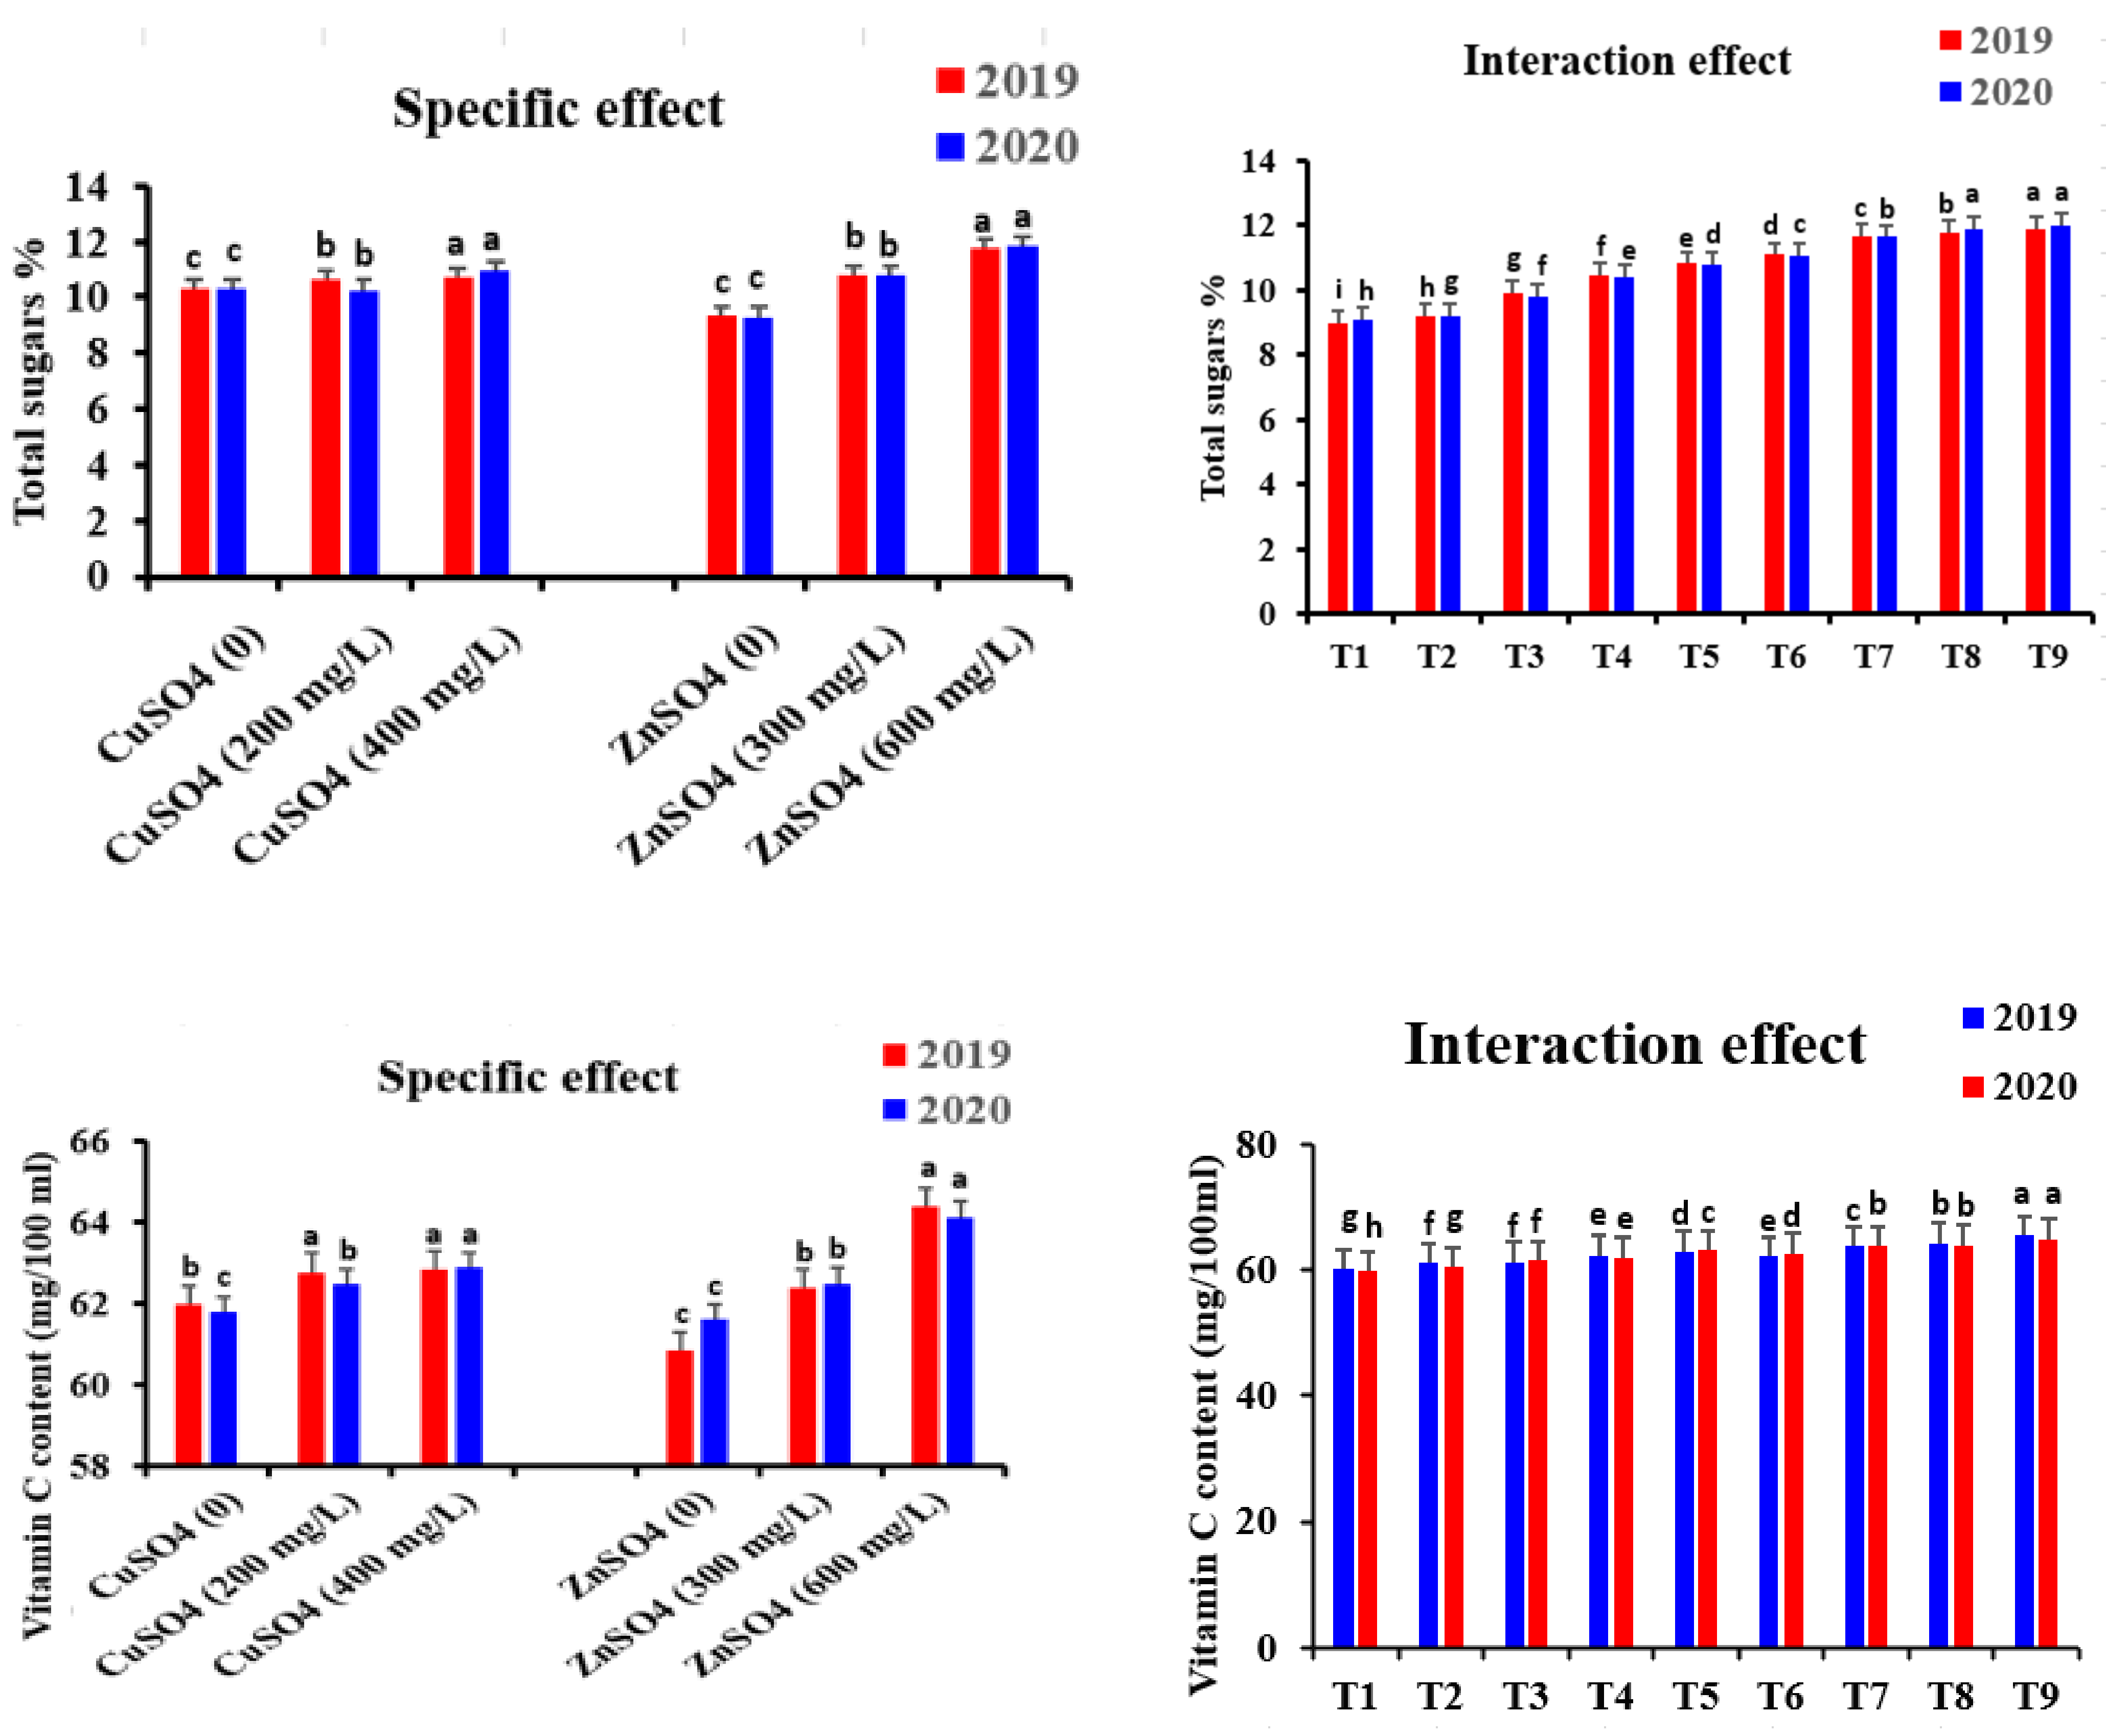
3.6. Fruit Chemical Characteristics

TSS %, total acidity %, TSS/acid ratio, total sugar %, and ascorbic acid (vitamin C) contents, the five investigated fruit juice chemical properties for Washington navel orange cv., were influenced by different concentrations of ZnSO4 and CuSO4 and their combinations. The data obtained during both the 2019 and 2020 experimental seasons are displayed in Figure 10 and Figure 11.

3.6.1. Specific Effect

It is noted in Figure 10 and Figure 11 that the highest values for the different fruit chemical characteristics were recorded when the highest level of ZnSO4 or the highest level of CuSO4 was used. In addition, the rates of difference of the investigated parameters resulting from ZnSO4 treatment were more noticeable than the analogous ones resulting from CuSO4 treatment. Such a trend was observed with all fruit chemical characteristics during the 2019 and 2020 experimental seasons.

3.6.2. Interaction Effect

Concerning the interaction effect of different combinations among ZnSO4 and CuSO4 concentrations on the different investigated fruit chemical characteristics of Washington navel orange cv., Table 5. In each case, all investigated fruit chemical characteristics that responded specifically to any investigated factor were also influenced by these factors’ combinations. Consequently, the combinations of the highest ZnSO4 concentration (600 mg/L) and the highest concentration of CuSO4 (400 mg/L) exhibited, statistically, the greatest values of such measurements, especially fruit chemical characteristics (TSS%, TSS/acid ratio, and total sugar and vitamin C contents). On the contrary, the lowest values of the previous measurements were always in strong relationship with these combinations, which are representative of the lowest concentration (0.05%), particularly when combined with ZnSO4 at 0 mg/L + CuSO4 at 0 mg/L or the control treatment. In addition, the other combinations were situated in the middle of the aforementioned extremes. Such a trend was observed during both seasons, with only one exception, the total acidity of fruit juice, whose trend showed opposite effect.

4. Discussion

These findings could theoretically be interpreted based on the following three facts. 1—The more pronounced effect of ZnSO4 relative to the comparatively mild reaction to CuSO4 is a real explanation to understand the pattern of the response of the majority of the measurements under examination. 2—Simultaneous reaction rates were observed for both fruit measurements (polar and equatorial diameters), while both were similar in their response to a given spray treatment (combination) and were thus assumed to be the most responsible for the shortage of meaning between the various combinations. 3—Fruit juice total acidity reduction by various ZnSO4 and CuSO4 concentration combinations may be due either to the dilution effect, arising from a rise in fruit juice weight by different spray treatments (ZnSO4 & CuSO4 combinations), or to a reduction in fruit juice total acidity, typically associated with an earlier fruit maturity combined with a reduction in fruit juice total acidity.
There have been several studies published on citrus micronutrient deficiencies, and extensive research has been conducted on the effect of micronutrient application. The foliar application of these nutrients resulted in noticeable changes in several aspects of citrus species growth, flowering, fruit set, yield, and quality [23]. Nutrient application to the foliage often produces a faster response than application to the soil [24,25].
Citrus growth, on the other hand, is affected by the application of micronutrients, such as Zn, Boron (B), Manganese (Mn), and Cu. These elements have an impact on the metabolic functions of the plant system. Zn is an important microelement that is required by plants because it is involved in the production of tryptophan [5].
Zn is required for dehydrogenase activity, as well as isomerases, transphosphorylases, and RNA and DNA polymerases [8,9]. It is important in starch metabolism and acts as a cofactor for several enzymes. According to [10,11], many enzymes require zinc ions (Zn2+) to function, and zinc. Copper (Cu) is involved in plant cell wall lignification, photosynthesis, and electron transport in plant enzyme systems [12]. It is essential for the formation and stability of chlorophyll and other plant pigments. Copper is involved in the biosynthesis of lignin and thus in the stabilization and lignification of cell walls, according to Bergmann [10,26]. Copper affects the chemical composition and formation of cell walls. Furthermore, [27,28] discovered that copper salts, such as the Bordeaux mixture, have long been used for spraying in horticulture. Fruit cracking was reduced by spraying with a CuSO4 solution.
According to Bouazizi et al. [29], fluorescence microscopy revealed increased thickening of the secondary cell walls for both copper concentrations tested (50 and 75M CuSO4).
In this regard, the fruit set is considered one most important indices of improved response fruit yield; [30,31] reported that fruit set and yield in citrus were significantly influenced by Zn fertilization. In addition, Cu deficiency is common in citrus trees that do not bear fruits during the first years after orchard establishment because of the increase in plant vigor through the application of high levels of nitrogen-containing fertilizers [32,33,34,35]. Zinc, on the other hand, is required for the production of auxin, the plant hormone responsible for cell elongation and growth [36].
Citrus fruit quality improved after 0.5% zinc sulfate (zinc sulfate) fertilization [37], whereas guava fruit quality improved after being micro-fertilized with copper sulfate (cupric sulfate), and the lowest deciduous fruit and best fruit quality were obtained by administering 0.5 percent copper sulfate through the leaves [38].
Zn participates in the activity of several enzymes (RNA, DNA polymerases, and dehydrogenases), as well as the maintenance of membrane structure and cell division [39,40,41]. Moreover, [42] demonstrated that providing B and Zn through foliar application to orange plants increased nutrient concentrations in leaves and promoted plant growth. Micronutrients are essential macronutrients for plant growth, yield, and quality. Plants only require trace amounts of it [43,44]. In addition, foliar application of combined micronutrients in Khasi Mandarin with {Zn (0.5%) & Cu (0.4%) + B(0.1%)} resulted in the highest fruit set percentage, number of fruits/plant, yield, total fruit retention %, total sugar percentage, and ascorbic acid content, compared with using {Zn (0.5%) + Mn (0.4%) + Cu (0.4%)}. As a result, it was determined that treatment with {Zn (0.5%) + Cu (0.4%) + B (0.1%)} was the best in terms of fruit growth and development [45].

5. Conclusions

In conclusion, the data obtained show that spraying Washington navel orange trees grown under comparable environmental conditions and horticulture practices every month from March to July with 600 mg/L ZnSO4 or 400 mg/L CuSO4 alone improved all the studied parameters, particularly productivity and fruit quality. However, spraying Washington navel orange trees with 600 mg/L ZnSO4 in combination with 400 mg/L CuSO4 or 600 mg/L ZnSO4 in combination with 200 mg/L CuSO4 every month from March to July offered the best results in terms of vegetative growth, nutritional status, productivity, yield, and fruit quality. This combination increased the yield by up to 17%.

Author Contributions

Methodology, sample collection, and lab analysis, S.F.E.-G.; investigation, S.F.E.-G., H.M.A.E.-G. and M.S.G.; writing—original draft preparation, S.F.E.-G.; writing—original draft, R.S.; A.A.M.A.-M. and K.A.I.; review and editing, R.M.Y.Z. All authors have read and agreed to the published version of the manuscript.

Funding

This research received no external funding.

Institutional Review Board Statement

Not applicable.

Informed Consent Statement

Not applicable.

Data Availability Statement

Available upon request from the corresponding author.

Acknowledgments

The authors would like to thank Horticulture and Botany Departments, Faculty of Agriculture, Benha University, Egypt. Taif University Researchers Supporting Project Number (TURSP-2020/117), Taif University, Taif, Saudi Arabia. Also, the authors thank Prince Sattam Bin Abdulaziz University, Al-Kharj for their scientific contributions.

Conflicts of Interest

The authors declared no conflict of interest.

References

  1. Embleton, T.W.; Jones, W.W.; Labanauskas, C.K.; Reuther, W. Leaf analysis as a diagnostic tool and guide to fertilization. In Citrus Industry of California Division of Agriculture Science; California Department of Food and Agriculture: Sacramento, CA, USA, 1973; pp. 83–210. [Google Scholar]
  2. Tariq, M.; Sharif, M.; Shah, Z.; Khan, R. Effect of Foliar Application of Micronutrients on the Yield and Quality of Sweet Orange (Citrus sinensis L.). Pak. J. Biol. Sci. 2007, 10, 1823–1828. [Google Scholar] [CrossRef] [PubMed]
  3. Świetlik, D. Zinc nutrition of fruit trees by foliar sprays. Acta Hortic. 2002, 594, 123–129. [Google Scholar] [CrossRef]
  4. Wietlik, D.; Faust, M. Foliar Nutrition of Fruit Crops. Hortic. Rev. 1984, 6, 287–355. [Google Scholar] [CrossRef]
  5. Ahmad, S.K.; Ullah, W.; Aman, U.M.; Ahmad, R.; Saleem, B.A.; Rajwana, I.A. Exogenous application of boron and zinc influence leaf nutrient status, tree growth and fruit quality of Feutrell’s Early (Citrus reticulate Blanco). Pak. J. Agric. Sci. 2012, 49, 113–119. [Google Scholar]
  6. Central Bank of Egypt. Annual Reports of Statistical Institute and Agricultural Economic Research in Egypt; Central Bank of Egypt: Cairo, Egypt, 2016. [Google Scholar]
  7. Abobatta, W. Improving Navel orange (Citrus sinensis L.) productivity in Delta Region, Egypt. Adv. Agric. Environ. Sci. Open Access 2018, 1, 36–38. [Google Scholar] [CrossRef] [Green Version]
  8. Świetlik, D. Zinc Nutrition in Horticultural Crops; Wiley: Hoboken, NJ, USA, 2010; pp. 109–178. [Google Scholar]
  9. Alloway, B.J. Zinc in Soils and Crop Nutrition; International Zinc Association: Brussel, Belgium, 2008. [Google Scholar]
  10. Bergmann, W. Nutritional Disorders of Plants: Development, Visual and Analytical Diagnosis; Gustav Fischer Verlag: Jena, Germany, 1992; pp. 204–223. [Google Scholar]
  11. Taiz, L.; Zeiger, E. Plant Physiology, 2nd ed.; Sinauer Associates, Inc.: Sunderland, MA, USA, 1994; pp. 104–113. [Google Scholar]
  12. Somasundaram, J.; Meena, H.R.; Singh, R.K.; Prasad, S.N.; Parandiyal, A.K. Diagnosis of Micronutrient Imbalance in Lime Crop in Semi-arid Region of Rajasthan, India. Commun. Soil Sci. Plant Anal. 2011, 42, 858–869. [Google Scholar] [CrossRef]
  13. Yruela, I. Copper in plants. Braz. J. Plant Physiol. 2005, 17, 145–156. [Google Scholar] [CrossRef] [Green Version]
  14. Black, C.A.; Evans, D.O.; Ensminger, L.E.; White, J.L.; Clark, F.E.; Dinauer, R.C. Methods of soil analysis, Part 2. In Chemical and Microbiological Properties, 2nd ed.; Soil Science Society of America: Madison, WI, USA, 1982. [Google Scholar]
  15. Pregl, E. Quantitative Organic Micro Analysis, 4th ed.; Chundril: London, UK, 1945. [Google Scholar]
  16. Piper, C.S. Soil and Plant Analysis; Inderscience Publishers Ltd.: New York, NY, USA, 1958; pp. 213–217. [Google Scholar]
  17. Brown, J.D.; Lilliand, O. Rapid determination of potassium and sodium in plant material and soil extract by flame photometer. Proc. Am. Soc. Hort. Sci. 1946, 48, 341–346. [Google Scholar]
  18. Chapman, H.D.; Pratt, P.F. Methods of Analysis for Soils, Plants, and Waters; University of California: Riverside, CA, USA, 1961. [Google Scholar]
  19. The Association of Official Analytical Chemists. Official Methods of Analysis, 17th ed.; The Association of Official Analytical Chemists: Gaithersburg, MD, USA, 2020. [Google Scholar]
  20. Smith, F.; Cilles, A.M.; Hamilton, K.J.; Gedes, A.P. Colorimetric methods for determination of sugar and related substances. Anal. Chem. 1956, 28, 350–356. [Google Scholar]
  21. Snedecor, G.W.; Cochran, W.G. Statistical Methods, 7th ed.; Iowa State University Press: Ames, IA, USA, 1980; 593p. [Google Scholar]
  22. Duncan, D.B. Multiple Range and Multiple F Tests. Biometrics 1955, 11, 1–42. [Google Scholar] [CrossRef]
  23. Babu, K.D.; Yadav, D.S. Foliar spray of micronutrients for yield and quality improvement in Khasi mandarin (Citrus reticulata Blanco.). Indian J. Hort. 2005, 62, 280–281. [Google Scholar]
  24. Obreza, T.A.; Zekri, M.; Hanlon, E.A. Nutrition of Florida Citrus Trees: Chapter 4. Soil and Leaf Tissue Testing, 3rd ed.; University of Florida, Institute of Food and Agricultural Sciences: Gainesville, FL, USA, 2020. [Google Scholar]
  25. Anees, M.; Tahir, F.M.; Shahzad, J.; Mahmood, N. Effect of foliar application of micronutrient on the quality of mango (Mangifera indica L.) cv. Dusheri fruit. Mycopathologia 2011, 9, 25–28. [Google Scholar]
  26. Lolkema, P.C. Copper Resistance in Higher Plants; Free University Press: Amsterdam, The Netherlands, 1985. [Google Scholar]
  27. Bennett, W.F. Nutrient Deficiencies and Toxicities in Crop Plants; American Phytopathological Society: St. Paul, MN, USA, 1993; pp. 168–171. [Google Scholar]
  28. Simon, G. Review on rain induced fruit cracking of sweet cherries (Prunus avium L.), its causes and the possibilities of prevention. Int. J. Hortic. Sci. 2006, 12, 27–35. [Google Scholar] [CrossRef] [Green Version]
  29. Bouazizi, H.; Jouili, H.; Geitmann, A.; El Ferjani, E. Cell Wall Accumulation of Cu Ions and Modulation of Lignifying Enzymes in Primary Leaves of Bean Seedlings Exposed to Excess Copper. Biol. Trace Element Res. 2010, 139, 97–107. [Google Scholar] [CrossRef]
  30. Srivastava, A.K.; Singh, S. Zinc Nutrition in ‘Nagpur’ Mandarin on Haplustert. J. Plant Nutr. 2009, 32, 1065–1081. [Google Scholar] [CrossRef]
  31. Abd El Motty, Z.E.; Shahin, M.F.M.; Hagagg, L.F. Response of Valencia oranges trees budded on Troyer citrange and Sour orange to foliar application of some macro and micronutrients. J. Appl. Sci. Res. 2006, 2, 952–965. [Google Scholar]
  32. Ramos, U.M.; Quaggio, J.A.; Furlani, P.R. Nitrogênio e cobre na produção de mudas de citros em diferentes porta-enxertos. Bragantia 2010, 69, 135–147. [Google Scholar] [CrossRef]
  33. Hippler, F.W.; Cipriano, D.O.; Boaretto, R.M.; Quaggio, J.A.; Gaziola, S.A.; Azevedo, R.A.; Mattos, D., Jr. Citrus rootstocks regulate the nutritional status and antioxidant system of trees under copper stress. Environ. Exp. Bot. 2016, 130, 42–52. [Google Scholar] [CrossRef]
  34. Hippler, F.W.R.; Boaretto, R.M.; Quaggio, J.A.; De Mattos, D. Copper in Citrus Production: Required but avoided. Citrus Res. Technol. 2017, 38, 99–106. [Google Scholar] [CrossRef]
  35. Mann, M.S.; Josan, J.S.; Chohan, G.S.; Vij, V.K. Effect of foliar application of micronutrient on leaf composition, fruit yield and quality of sweet orange (Citrus sinensis L.) cv. Blood red. Indian. J. Hortic. 1985, 42, 45–49. [Google Scholar]
  36. Beede, R.H.; Brown, P.H.; Kallsen, C.; Weinbaum, S.A. Diagnosing and correcting nutrient deficiencies. In Pistachio Production Manual, 4th ed.; University of California: Oakland, CA, USA, 2005; pp. 147–157. [Google Scholar]
  37. Ashraf, M.Y.; Yaqub, M.; Akhtar, J.; Athar Khan, M.; Ali Khan, M.; Ebert, G. Control of Excessive Fruit Drop and Improvement in Yield and Juice Quality of Citrus nobilis through Nutrient Management. Pak. J. Bot. 2012, 44, 259–265. [Google Scholar]
  38. Yadav, M.K.; Solanki, V.K. Use of micronutrients in tropical and sub-tropical fruit crops: A review. Afr. J. Agric. Res. 2015, 10, 416–422. [Google Scholar] [CrossRef] [Green Version]
  39. Vaghar, M.S.; Sayfzadeh, S.; Zakerin, H.R.; Kobraee, S.; Valadabadi, S.A. Foliar application of iron, zinc, and manganese nano-chelates improves physiological indicators and soybean yield under water deficit stress. J. Plant Nutr. 2020, 43, 2740–2756. [Google Scholar] [CrossRef]
  40. Davarpanaha, S.; Tehranifara, A.; Davarynejada, G.; Abadía, J.; Khorasanic, R. Effects of foliar applications of zinc and boron nano-fertilizers on pomegranate (Punica granatum cv. Ardestani) fruit yield and quality. Sci. Hortic. 2016, 210, 57–64. [Google Scholar] [CrossRef] [Green Version]
  41. Abbasifar, A.; Shahrabadi, F.; ValizadehkKaji, B. Effects of green synthesized zinc and copper nano-fertilizers on the morphological and biochemical attributes of basil plant. J. Plant Nutr. 2020, 43, 1104–1118. [Google Scholar] [CrossRef]
  42. Macedo, L.O.; Júnior, D.M.; Jacobassi, R.; Hippler, F.W.R.; Quaggio, J.A.; Boaretto, R.M. Efficiency of foliar application of sparingly soluble sources of boron and zinc in citrus. Sci. Agric. 2021, 78. [Google Scholar] [CrossRef]
  43. Ma, J.-Z.; Zhang, M.; Liu, Z.-G.; Wang, M.; Sun, Y.; Zheng, W.-K.; Lu, H. Copper-based-zinc-boron foliar fertilizer improved yield, quality, physiological characteristics, and microelement concentration of celery (Apium graveolens L.). Environ. Pollut. Bioavailab. 2019, 31, 261–271. [Google Scholar] [CrossRef] [Green Version]
  44. Hemant, S.; Vijay, S.; Poonam, S. Differential responses of Fe, Zn, B, Cu and Mg on growth and quality attributes of fruit crops. J. Pharmacogn. Phytochem. 2019, 8, 1–5. [Google Scholar]
  45. Jenny, Z.; Elizabeth, S.; Debashis, M. Foliar application of zinc, manganese, copper and boron influenced the fruit growth, development and quality of Khasi Mandarin (Citrus reticulata Blanco). J. Pharmacogn. Phytochem. 2019, 8, 3324–3327. [Google Scholar]
Figure 1. Shoot length (cm), shoot diameter (cm), and number of leaves/shoots of Washington navel orange trees in response to specific and interaction effects of different ZnSO4 and CuSO4 concentrations during the 2019 and 2020 seasons. The means of specific and interaction effects followed by the same letters did not significantly differ at the 5% level. Note: T1 = control, T2 = CuSO4 200 mg/L, T3 = CuSO4 400 mg/L, T4 = ZnSO4 300 mg/L, T5 = ZnSO4 300 mg/L + CuSO4 200 mg/L, T6 = ZnSO4 300 mg/L + CuSO4 400 mg/L, T7 = ZnSO4 600 mg/L, T8 = ZnSO4 600 mg/L+ CuSO4 200 mg/L, and T9 = ZnSO4 600 mg/L + CuSO4 400 mg/L.
Horticulturae 07 00233 g001aHorticulturae 07 00233 g001b
Figure 2. Number of new shoots, leaf area (cm2), and assimilation area m2/shoot of Washington navel orange trees in response to specific and interaction effects of different ZnSO4 and CuSO4 concentrations during the 2019 and 2020 seasons. The means of specific and interaction effects followed by the same letters didn’t significantly differ at the 5% level. Note: T1 = control, T2 = CuSO4 200 mg/L, T3 = CuSO4 400 mg/L, T4 = ZnSO4 300 mg/L, T5 = ZnSO4 300 mg/L + CuSO4 200 mg/L, T6 = ZnSO4 300 mg/L + CuSO4 400 mg/L, T7 = ZnSO4 600 mg/L, T8 = ZnSO4 600 mg/L + CuSO4 200 mg/L, and T9 = ZnSO4 600 mg/L + CuSO4 400 mg/L.
Horticulturae 07 00233 g002aHorticulturae 07 00233 g002b
Figure 3. Total leaf chlorophyll (mg/g F.W.), N, and P contents of Washington navel orange trees in response to the specific and interaction effects of different ZnSO4 and CuSO4 concentrations during the 2019 and 2020 seasons. The means of specific and interaction effects followed by the same letters did not significantly differ at the 5% level. Note: T1 = control, T2 = CuSO4 200 mg/L, T3 = CuSO4 400 mg/L, T4 = ZnSO4 300 mg/L, T5 = ZnSO4 300 mg/L + CuSO4 200 mg/L, T6 = ZnSO4 300 mg/L + CuSO4 400 mg/L, T7 = ZnSO4 600 mg/L, T8 = ZnSO4 600 mg/L + CuSO4 200 mg/L, and T9 = ZnSO4 600 mg/L + CuSO4 400 mg/L.
Horticulturae 07 00233 g003aHorticulturae 07 00233 g003b
Figure 4. Leaf K, Ca, and Mg contents of Washington navel oranges in response to specific and interaction effects of different ZnSO4 and CuSO4 concentrations during the 2019 and 2020 seasons. The means of specific and interaction effects followed by the same letters did not significantly differ at the 5% level. Note: T1 = control, T2 = CuSO4 200 mg/L, T3 = CuSO4 400 mg/L, T4 = ZnSO4 300 mg/L, T5 = ZnSO4 300 mg/L + CuSO4 200 mg/L, T6 = ZnSO4 300 mg/L + CuSO4 400 mg/L, T7 = ZnSO4 600 mg/L, T8 = ZnSO4 600 mg/L + CuSO4 200 mg/L, and T9 = ZnSO4 600 mg/L + CuSO4 400 mg/L.
Horticulturae 07 00233 g004aHorticulturae 07 00233 g004b
Figure 5. Fe, Cu, Zn, and Mn contents of Washington navel oranges in response to specific and interaction effects of different ZnSO4 and CuSO4 concentrations during the 2019 and 2020 seasons. The means of specific and interaction effects followed by the same letters did not significantly differ at the 5% level. Note: T1 = control, T2 = CuSO4 200 mg/L, T3 = CuSO4 400 mg/L, T4 = ZnSO4 300 mg/L, T5 = ZnSO4 300 mg/L + CuSO4 200 mg/L, T6 = ZnSO4 300 mg/L + CuSO4 400 mg/L, T7 = ZnSO4 600 mg/L, T8 = ZnSO4 600 mg/L + CuSO4 200 mg/L, and T9 = ZnSO4 600 mg/L + CuSO4 400 mg/L.
Horticulturae 07 00233 g005aHorticulturae 07 00233 g005b
Figure 6. Fruit set %, number of fruits/tree, and fruit retention % of Washington navel orange trees in response to specific and interaction effects of different ZnSO4 and CuSO4 concentrations during the 2019 and 2020 seasons. The means of specific and interaction effects followed by the same letters did not significantly differ at the 5% level. Note: T1 = control, T2 = CuSO4 200 mg/L, T3 = CuSO4 400 mg/L, T4 = ZnSO4 300 mg/L, T5 = ZnSO4 300 mg/L + CuSO4 200 mg/L, T6 = ZnSO4 300 mg/L + CuSO4 400 mg/L, T7 = ZnSO4 600 mg/L, T8 = ZnSO4 600 mg/L + CuSO4 200 mg/L, and T9 = ZnSO4 600 mg/L + CuSO4 400 mg/L.
Horticulturae 07 00233 g006aHorticulturae 07 00233 g006b
Figure 7. Average fruit weight (g), yield/tree (kg), yield/ha (ton) of Washington navel orange trees in response to specific and interaction effects of different ZnSO4 and CuSO4 concentrations during the 2019 and 2020 seasons. The means of specific and interaction effects followed by the same letters did not significantly differ at the 5% level. Note: T1 = Control, T2 = CuSO4 200 mg/L, T3 = CuSO4 400 mg/L, T4 = ZnSO4 300 mg/L, T5 = ZnSO4 300 mg/L + CuSO4 200 mg/L, T6 = ZnSO4 300 mg/L + CuSO4 400 mg/L, T7 = ZnSO4 600 mg/L, T8 = ZnSO4 600 mg/L + CuSO4 200 mg/L, and T9 = ZnSO4 600 mg/L + CuSO4 400 mg/L.
Horticulturae 07 00233 g007aHorticulturae 07 00233 g007b
Figure 8. Polar diameter (cm), equatorial diameter, and fruit shape index of Washington navel oranges in response to specific and interaction effects of different ZnSO4 and CuSO4 concentrations during the 2019 and 2020 seasons. The means of specific and interaction effects followed by the same letters did not significantly differ at the 5% level. Note: T1 = Control, T2 = CuSO4 200 mg/L, T3 = CuSO4 400 mg/L, T4 = ZnSO4 300 mg/L, T5 = ZnSO4 300 mg/L + CuSO4 200 mg/L, T6 = ZnSO4 300 mg/L + CuSO4 400 mg/L, T7 = ZnSO4 600 mg/L, T8 = ZnSO4 600 mg/L + CuSO4 200 mg/L, and T9 = ZnSO4 600 mg/L + CuSO4 400 mg/L.
Horticulturae 07 00233 g008aHorticulturae 07 00233 g008b
Figure 9. Peel thickness, juice content %, juice weight g/fruit of Washington navel oranges in response to specific and interaction effects of ZnSO4 & CuSO4 concentrations during 2019 & 2020 seasons. Means of specific and interaction effects followed by the same letters didn’t significantly differ at the 5% level. Note: T1 = Control, T2 = CuSO4 200 mg/L, T3 = CuSO4 400 mg/L, T4 = ZnSO4 300 mg/L, T5 = ZnSO4 300 mg/L + CuSO4 200 mg/L, T6 = ZnSO4 300 mg/L + CuSO4 400 mg/L, T7 = ZnSO4 600 mg/L, T8 = ZnSO4 600 mg/L + CuSO4 200 mg/L and T9 = ZnSO4 600 mg/L + CuSO4 400 mg/L.
Horticulturae 07 00233 g009aHorticulturae 07 00233 g009b
Figure 10. Fruit juice TSS %, acidity, and TSS acid ratio of Washington navel oranges in response to specific and interaction effects of different ZnSO4 and CuSO4 concentrations during the 2019 and 2020 seasons. The means of specific and interaction effects followed by the same letters did not significantly differ at the 5 % level. Note: T1 = control, T2 = CuSO4 200 mg/L, T3 = CuSO4 400 mg/L, T4 = ZnSO4 300 mg/L, T5 = ZnSO4 300 mg/L + CuSO4 200 mg/L, T6 = ZnSO4 300 mg/L + CuSO4 400 mg/L, T7 = ZnSO4 600 mg/L, T8 = ZnSO4 600 mg/L + CuSO4 200 mg/L, and T9 = ZnSO4 600 mg/L + CuSO4 400 mg/L.
Horticulturae 07 00233 g010
Figure 11. Total sugar % and vitamin C (mg/100 mL) of Washington navel oranges in response to specific and interaction effects of different ZnSO4 and CuSO4 concentrations during the 2019 and 2020 seasons. The means of specific and interaction effects followed by the same letters did not significantly differ at the 5% level. Note: T1 = Control, T2 = CuSO4 200 mg/L, T3 = CuSO4 400 mg/L, T4 = ZnSO4 300 mg/L, T5 = ZnSO4 300 mg/L + CuSO4 200 mg/L, T6 = ZnSO4 300 mg/L + CuSO4 400 mg/L, T7 = ZnSO4 600 mg/L, T8 = ZnSO4 600 mg/L + CuSO4 200 mg/L, and T9 = ZnSO4 600 mg/L + CuSO4 400 mg/L.
Horticulturae 07 00233 g011
Table 1. Physical and chemical properties of the soil under investigation.
Physical AnalysisValueChemical Analysis
Cations meq/LAnions meq/L
Coarse sand11%Ca2+8.8CO32−Zero
Fine sand19.4%Mg2+3.25HCO34.5
Silt19.0%Na+4.30Cl6.45
Clay49.4%K+1.08SO42−8.00
Texture classClay loamAvailable N 24.5 mg/kg
Soil pH7.3Available P 11.94 mg/kg
E.C, ds/m1.65Available K 170.5 mg/kg
Organic matter3.6%
Table 2. Weather data on the air temperature, rainfall, and relative humidity of the study area: Toukh Qalubia, Egypt (2019–2020 growing years and long-term data).
MonthMin Temp.Max Temp.HumidityWindSunRadEff. RainETo
°C°C%km/DayHoursMJ/m2/Daymmmm/Day
January7.220.8512067.813.51.12.83
February7.623.9422458.617.01.23.80
March10.624.8382768.920.015.12
April14.830.7302779.222.616.90
May18.535.33126210.225.108.02
June21.236.93327111.426.708.81
July22.239.13922311.326.208.00
August22.437.43220510.425.107.42
September19.433.2442149.522.206.21
October17.231.3472139.218.105.12
November10.624.5531808.314.503.53
December7.620.7571937.813.10.582.70
Abbreviation explanations: Min Temp—minimum temperature recorded during the night; Max Temp—maximum temperature recorded during the day; Humidity—total amount of vapor in the atmosphere, Wind—the wind speed in km/h; Sun—sun hours; Rad—radiation amount per day; Eff. rain—total amount of rain during the month in mm; ETO—evapotranspiration per day in mm. Source: Meteorological Station of Qalubia, Egypt.
Publisher’s Note: MDPI stays neutral with regard to jurisdictional claims in published maps and institutional affiliations.

