Article

Effect of the Flow Rate on Plant Growth and Flow Visualization of Nutrient Solution in Hydroponics

1
United Graduate School of Agricultural Sciences, Tottori University, Tottori 680-8550, Japan
2
Faculty of Agriculture, Tottori University, Tottori 680-8553, Japan
3
Graduate School of Sustainability Science, Tottori University, Tottori 680-8550, Japan
4
Faculty of Agriculture, Yamaguchi University, Yamaguchi 753-8515, Japan
*
Author to whom correspondence should be addressed.
Horticulturae 2021, 7(8), 225; https://doi.org/10.3390/horticulturae7080225
Submission received: 7 July 2021 / Revised: 28 July 2021 / Accepted: 2 August 2021 / Published: 5 August 2021
(This article belongs to the Special Issue Hydroponics in Vegetable Production)

Abstract

:
In hydroponics, the flow pattern of nutrient solution in a cultivation container affects the growth of plants. Even if the flow rate of nutrient solution is the same between containers, the flow pattern may differ based on the size and shape of the containers. Therefore, the flow pattern cannot be comprehensively described by flow rate alone. In order to identify the relationship between plant growth, root morphology, nutrient uptake, and flow pattern, a hydroponic cultivation of Swiss chard was carried out. In addition, in order to describe the flow pattern in a specific cultivation container, hydroponic flow patterns were observed via flow field visualization using particle image velocimetry. As a result, with the increase in flow rate, it was found that a specific flow rate can form an ideal flow pattern for plant growth. Under this flow pattern, nutrient absorption is promoted and roots are elongated, thereby absorbing more nutrients and further promoting plant growth. However, when the flow rate exceeds the ideal value, plant growth is hindered. In summary, identifying the ideal nutrient solution flow pattern in hydroponics can facilitate better crop production.

1. Introduction

Currently, hydroponics is popular globally because of its efficient resource utilization and high-quality food production [1]. Hydroponics is a type of controlled environment agriculture where adjustments can be made to create a suitable environment for plant growth to increase crop yield and improve crop quality. One of the main advantages of hydroponics is that it reduces the amount of water and nutrients necessary for crop cultivation. Because of its water-saving qualities and ability to produce high yields, hydroponics is widely used in the drylands where water resources are scarce [2]. However, hydroponics is an artificial environment for cultivation, which requires strict environmental regulation to ensure the normal growth of crops [3]. Compared with conventional soil culture, hydroponics requires greater environmental control, especially for the nutrient solution.
The effects of physical and chemical properties of hydroponic nutrient solutions, such as pH, temperature, dissolved oxygen concentration, composition, and nutrient concentrations, on crop growth have been well-studied [4,5,6,7]. Among such properties, the effect of the flow rate of nutrient solution on crop growth has gained increasing attention in recent years. Genuncio et al. [8] compared the fresh weights of three lettuce cultivars (“Lucy Brown”, “Izabela”, and “Veneza Roxa”) under different ionic concentrations and flow rates. Their experimental results revealed that the application of nutrient solution with a flow rate of 1.5 L/min and a 100% ionic concentration increased the fresh weight of “Izabela” and “Veneza Roxa”. Al-Tawaha et al. [9] investigated the effect of three different nutrient solution flow rates on lettuce growth and found that a 20 L/min flow rate increased the lettuce weight. Dalastra et al. [10] evaluated the nutrition and production of lettuce in relation to the nutrient solution flow in hydroponics. The treatments consisted of nutrient solution application at 0.5, 1, 2, and 4 L/min flow rates in each cultivation channel. Due to the greater nutrient accumulation in the shoots and use efficiency of these elements, the highest production (g/plant) of lettuce was obtained with a flow rate of 1 L/min of nutrient solution. Soares et al. [11] used brackish water for hydroponic vegetable production and tested the flow rates of two nutrient solutions in the hydroponic channels. The best shoot fresh weight and dry weight, leaf area, number of leaves, plant height, and shoot diameter values were obtained at a flow rate of 1.5 L/min.
Many studies have investigated the optimal flow rates for hydroponics as well as aquaponics, a food system derived from hydroponics that incorporates aquatic animal production. Nuwansi et al. [12] conducted a study to optimize the water flow rate in a recirculating aquaponic system to produce fish and spinach. Flow rates of 0.8, 2.4, and 4 L/min were maintained. Values for plant height, percentage height gain, and yield of spinach were greatest for the 0.8 L/min treatment. The plant growth and nutrient uptake (nitrogen (N), phosphorus (P), and potassium (K)) increased with a decrease in flow rate. The effects of five water flow rates were investigated by Endut et al. [13] to determine the association between nutrient removal and water quality for plant growth. The authors found that all flow rates were efficient for nutrient removal and for maintaining the water quality parameters within the acceptable and safe limits for plant growth and the survival of fish. Khater et al. [14] investigated the effects of the source of nutrients, flow rate, and length of the gully on nutrient uptake, dry weight, and N content in plants. They found that the fresh and dry weights of shoots decreased with an increase in the flow rate and the length of the gully, and the dry weight of roots and N content decreased with an increase in the flow rate and the length of the gully.
The findings of these studies demonstrate that the flow rate in hydroponic systems influences the growth of plants, and the flow rate can be regulated to improve crop yield. Ideal flow rates to promote the growth of hydroponic crops provide adequate contact time [9] and collision frequency between roots and nutrient ions to promote nutrient absorption, which subsequently enhances plant growth.
Although previous studies have provided conclusive evidence of ideal flow rates, they have some limitations. Many previously published articles lack information on the size and shape of the cultivation containers used in experiments. From a hydrodynamic point of view, the flow pattern may change depending on the size and shape of the container [15], even if the flow rate is the same between containers. The flow pattern around the root, not just the flow rate, affects the growth of plants. Therefore, evaluating the flow rate alone does provide a noncomprehensive picture of the flow pattern in hydroponic systems. Flow pattern should be described using a method concerning both the specific container size and the specific flow rate (for example, fluid visualization method).
Until now, to our knowledge, no studies have investigated the effects of the flow pattern around the roots on nutrient uptake and crop growth in hydroponics. These studies are necessary to provide information on how to obtain the greatest yield and lowest energy consumption, optimally design the cultivation containers, identify the ideal flow rate, and provide effective nutrition management for hydroponic plants. In this study, we investigated the relationship between plant growth, root morphology, nutrient uptake, and flow pattern using cultivation experiments. Moreover, we visualized the nutrient solution flow field in our hydroponic system using particle image velocimetry (PIV) to explain the effects of flow pattern on plant growth.

2. Materials and Methods

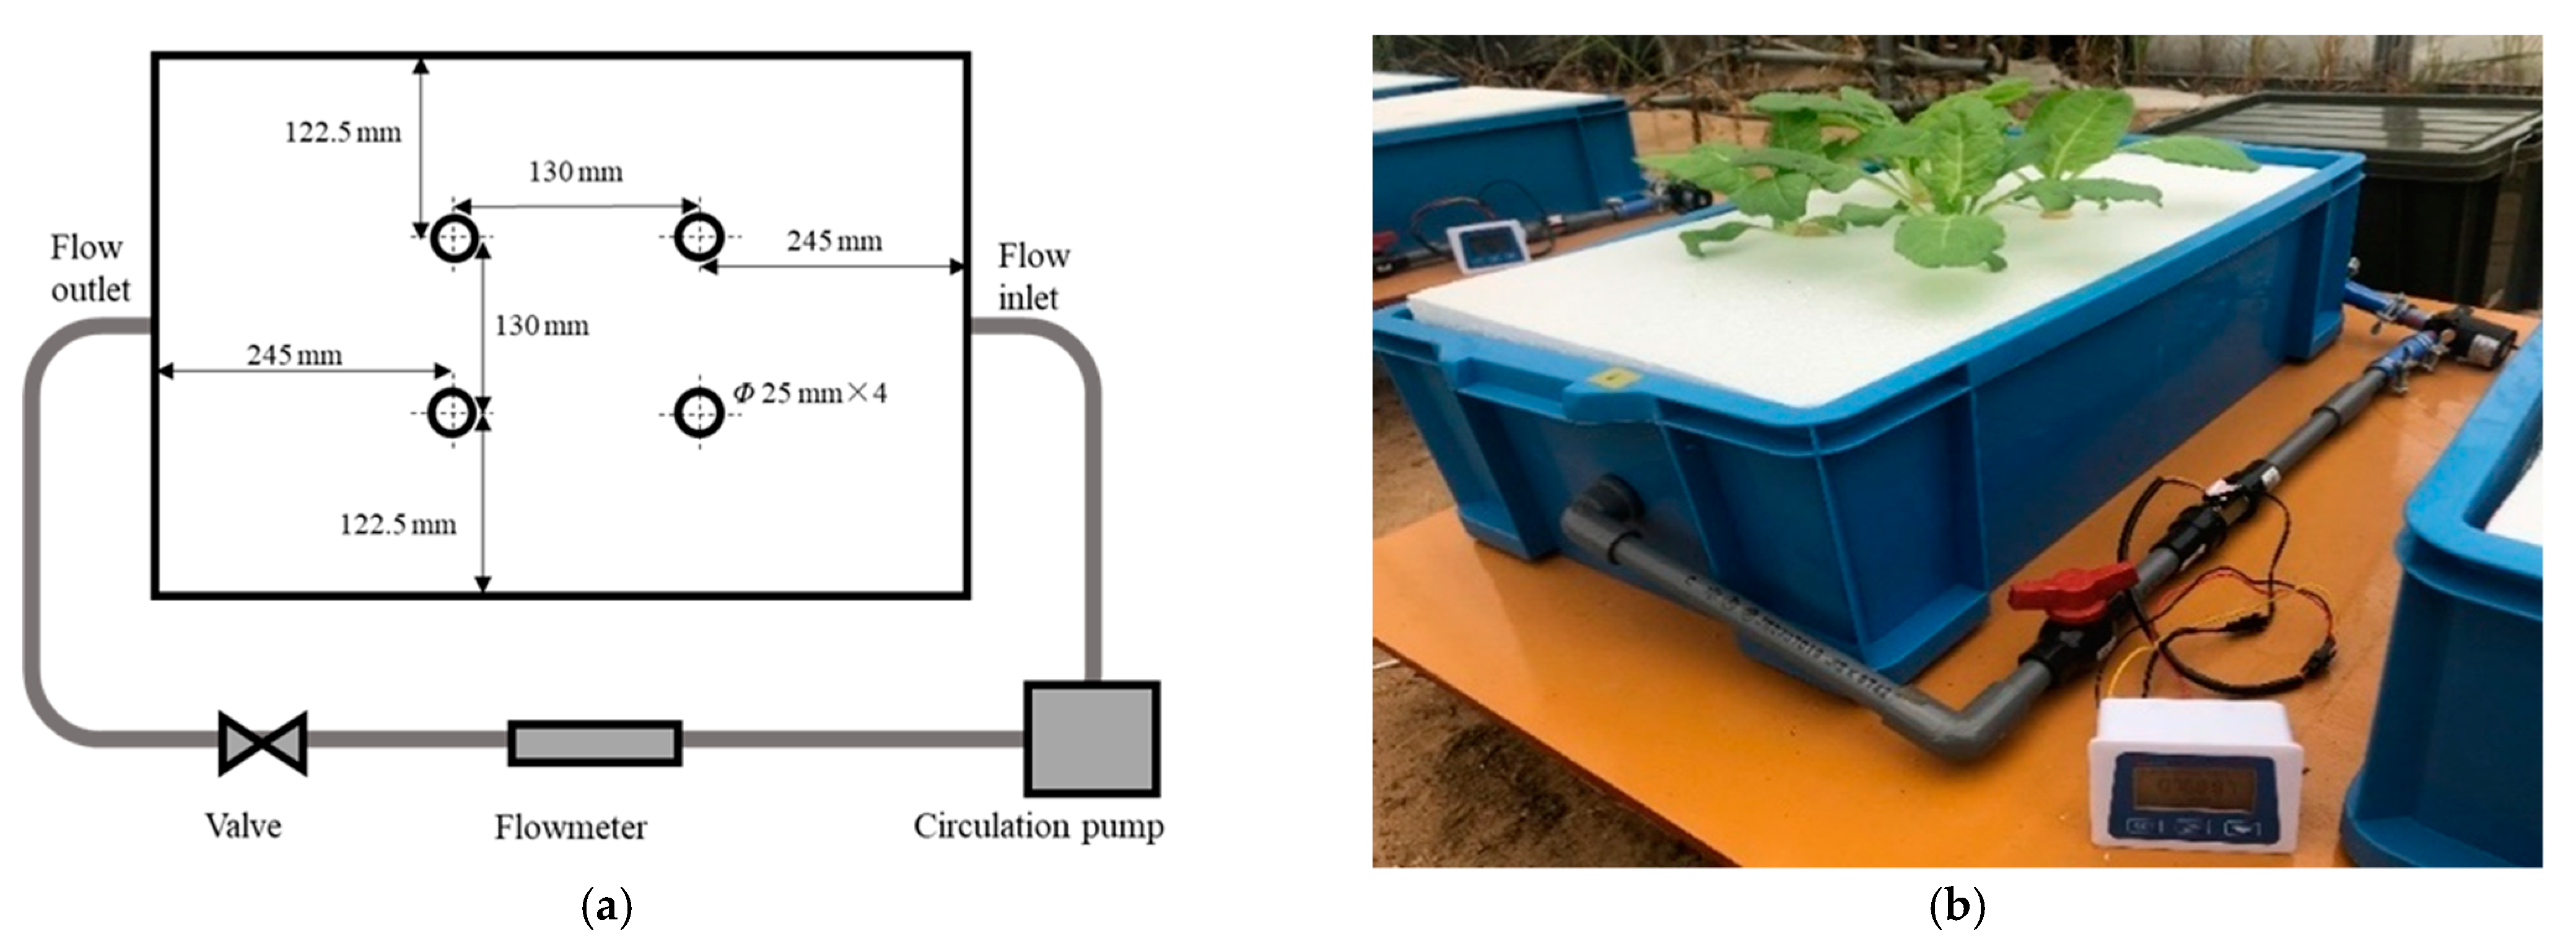
2.1. Cultivation and Measurement

The hydroponic cultivation experiment was carried out in the greenhouse of the Arid Land Research Center of Tottori University (35°32′09.0″ N 134°12′42.7″ E). During the cultivation period (04 November 2020 to 23 November 2020), we used a solar irradiance meter (PYR, METER Group, Inc. Pullman, WA, USA) and temperature sensor (VP-4, METER Group, Inc. Pullman, WA, USA) to record solar irradiance and ambient temperature, respectively, in the greenhouse. To describe the meteorological conditions during cultivation, the greenhouse environmental data are provided in Figure 1. In this study, a hydroponics system was established for cultivation, as shown in Figure 2. The nutrient solution was circulated by a pump (DC40A, ZKSJ, Shenzhen, China), and flow rates of 0, 2, 4, 6, and 8 L/min were obtained using valves. Each cultivation container was equipped with a flowmeter (digital flow sensor, Sea Zhongjiang Guangdong, China) to monitor the flow rate of nutrient solution. OTA No.1 fertilizer, OTA No.2 fertilizer, and tap water (pH 6.9, EC 0.09 mS/cm) were used to prepare standard nutrient solution OTA fertilizer A [16]. The composition and concentration of OTA fertilizer A are shown in Table 1.
The plant used in this experiment was Swiss chard (Beta vulgaris L. spp. cicla cv. Seiyou Shirokuki). Swiss chard is a leafy vegetable popular for its nutritional value. It is an annual cool weather crop that is well-adapted to hot conditions and long days in drylands [17]. In this study, on 22 October, seeds were sown and germinated in plastic containers with a mesh base (470 mm L × 330 mm W × 80 mm H) filled with moistened vermiculite. After one week, all seedlings were transplanted into plastic containers (580 mm L × 370 mm W × 150 mm H), filled with 30 L of nutrient solution (0.25 times concentration of OTA fertilizer A solution; pH 6.5; EC 0.62 mS/cm; no flowing condition), and were grown for seven days. On 4 November, seedlings in plastic containers were transplanted into hydroponic cultivation containers with different flow rates. Then, a 40 L 0.5 times concentration of standard OTA fertilizer A (pH 6.5; EC 1.32 mS/cm) was poured into each cultivation container. Each treatment (flow rate) was conducted with three replications (cultivation containers) and four plants were planted in each cultivation container. To maintain the EC and pH, the nutrient solution was replaced every 10 days. The plants in each cultivation container were harvested on 23 November, after 20 days of cultivation under different flow rates, respectively. After harvest, plants were divided into shoots and roots, and the fresh weight of the plants was measured. The leaf area, root length, and root surface area were measured by leaf area meter (LI3000A, LI-COR, Lincoln, Nebraska USA) and root scanner and software (WinRhizo 2008a, REGENT INS, Quebec, Canada). The plants were then placed into a convection oven (DKM600, Yamato, Tokyo, Japan) at 75 °C and dried for 72 h before dry weights were measured. Next, for nitrogen (N) content measurements, the dry samples were decomposed by sulfuric acid (10 vol.). N content was determined by the Kjeldahl method [18], then the N uptake by a plant was calculated from the dry weight and N content (measurement objectives and instruments are shown in Table 2).

2.2. Visualisation of the Flow Field in Hydroponic Cultivation

A PIV system was used in this study to accurately observe the flow field around the root system region. PIV [19] is a non-intrusive laser optical measurement technique for flow visualization. The fluid was seeded with tracer particles which, as sufficiently small particles, were assumed to follow the flow dynamics. The fluid with entrained particles was illuminated so that the particles were visible. The motion of the seeding particles was used to calculate the velocity field of the flow being studied. In this study, in order to observe the flow pattern in the cultivation container, we used acrylic to make a colorless and transparent water tank the same size as the hydroponic system described in Figure 2, Section 2.1. The cultivation plate used was also the same as that described in Section 2.1. The water flow in the water tank was driven by a circulating water pump, and the flow rate (0, 2, 4, 6, and 8 L/min) in the tank was controlled by the accessory valve and digital flowmeter. The plants harvested in this study were used to observe the flow field. The plants growing under different flow rates were placed in the corresponding flow rate to observe the flow field.
As shown in Figure 3, the laser (GPOL-5W, JAPAN LASER, Tokyo, Japan) was arranged on the left side of the acrylic water tank, aimed towards the longitudinal section of the cultivation part. The high-speed camera (FASTCAM-MAX 120KC, Photron, Tokyo, Japan) with a lens (Micro-NIKKOR 55 mm f/2.8, Nikon, Tokyo, Japan) was placed outside the acrylic water tank perpendicular to its middle section. Several tracer particles, for which the average particle diameter is about 0.55 mm and density is 1.01 g/cm3 (HP20, DIAION, Tokyo, Japan), were added to the circulating water, which can be illuminated by the laser light sheet, and the motion of the particles was recorded using the high-speed camera with a resolution of 1024 × 1024 pixels at 60 frames per second. The observation experiment was carried out in a dark room. The flow field without plants and with plants under different flow rates was photographed for 10 s, respectively. The PIV flow field calculation software (PIVlab 2.31 [20] built into MATLAB (MATLAB 2019a, MathWorks, Massachusetts, USA)) was used to batch process the images continuously collected for each condition. The image area shown in Figure 4 was selected as the region of interest in this study. Based on the instantaneous picture of 600 continuous flow fields, the mean velocity distribution and vorticity distribution of each flow field were obtained. The mean velocity and vorticity distribution maps of different flow patterns show the velocity and vorticity of flow around the root region, explaining the effect of flow pattern on plant growth and nutrient uptake.

2.3. Data Analysis

Each treatment (flow rate) was conducted with three replications. The value of each replicate was obtained by calculating the average value of all the plants in the same cultivation container. The Statistical Package for Social Sciences software version 25 (SPSS Inc, Chicago, IL, USA) was used to statistically analyze the data. The statistical analysis methods used in this study were one-way analysis of variance followed by Duncan’s Multiple Range Test at p < 0.05. The statistical results were expressed as means ± SE with n = 3.

3. Results

3.1. The Effect of Flow Rate on Plant Growth, Root Morphology and Nutrient Uptake

The plant growth and root morphology under different flow patterns are shown in Figure 4 (the detail values are shown in Table S1). From Figure 4a,b, results showed that the fresh and dry weights of the whole plant differed significantly (p < 0.05) among flow rates. No significant differences in the dry and fresh weight of plants were observed between 0 L/min to 2 L/min. The dry and fresh weight of plants in 4 L/min and 6 L/min were significantly higher than that in 0 L/min. Compared with 0 L/min, fresh weight under 4 L/min and 6 L/min increased by 6.4% and 11.8%, and dry weight increased by 8.2% and 15.2%, respectively. When the flow rate increased to 8 L/min, the dry and fresh weight of plants were 7.4% and 15.3% lower than those under 6 L/min, respectively.
The leaf areas of plants grown under the tested flow patterns are shown in Figure 4c. The leaf area increases with increasing flow rate from 0 L/min to 6 L/min. Compared with 0 L/min, the leaf area of plants in 2 L/min, 4 L/min, and 6 L/min increased by 8.2%, 10.3%, and 15.2%, respectively. However, the leaf area in 8 L/min was lower than those of 2–6 L/min and not significantly different from that of 0 L/min.
From Figure 4d,e, results showed that root length and root surface area increased gradually from 0 L/min to 6 L/min. In 2 L/min, 4 L/min, and 6 L/min, the root length increased by 10.6%, 18.6%, and 29.5%, respectively, compared with 0 L/min. When the flow rate increased to 8 L/min, the root length and root surface area were significantly lower than those under all other flow rates. Compared with 0 L/min, the 8 L/min root length and root surface area decreased by 13.4% and 23.5%, respectively.
Comparing Figure 4f with Figure 4b, it can be observed that the trends of N uptake were similar to that of dry weight with an increased flow rate. Under different flow rates, the uptake of N by a plant was also different. Under the five tested flow rates, the average N uptake was 36.4, 44.0, 45.6, 49.5, and 41.1 mg/plant, respectively. The accumulation of nutrients and plant dry weight were the greatest under the 6 L/min.

3.2. Visualisation of the Flow Field in a Hydroponic Cultivation Container

As described in Section 2.2, the observation experiment was carried out in a dark room. However, in order to better describe the movement of roots with water flow, we also observed the shape of roots at a bright condition (light turn on) before the PIV experiment. The shapes of roots under different flow rates are shown in Figure 5 (the relevant videos are in the Supplementary Videos). The velocity distribution of the flow field under different flow patterns is shown in Figure 6. Collectively, these figures show that the swing shapes of roots differ among flow patterns. From Figure 5, at 0 L/min, the root is not inclined in the nutrient solution. With the increase in flow, the root is gradually inclined with the flow direction of the nutrient solution. In 8 L/min, the root was rolled up and swung with the direction of the water flow.
As the flow rates increase, the average velocity in the flow field gradually increases (Figure 6). When the nutrient solution flows through the root, the flow pattern of the nutrient solution is also affected by the root. Under 2 L/min and 4 L/min, as the low flow rates have little kinetic energy, the roots do not show a large swing due to the flow. In this situation, the nutrient solution will form a backflow to the upstream side after it hits the root. As shown in Figure 6b,d, the flow velocity near the flow inlet of the container (X-axis: 400–620 mm) is higher than that in other regions due to the backflow. As the flow rate increases, the force from the water flow increases gradually. As shown in Figure 6f, the root swings due to the action of water flow, and the nutrient solution flows under the root. The flow velocity around the root, especially underneath the root (X-axis: 200–400 mm), is accelerated. As the flow rate continues to increase, the force of the flow increases. As shown in Figure 6h, because of the flow of nutrient solution, the roots float upward, the nutrient solution flows under the root, and backflow occurs after hitting the sidewall, resulting in an increased velocity in the flow outlet area (X-axis: 0–200 mm).
Moreover, comparing Figure 6a–h, the average velocity of flow without plants was larger than that with plants; the average velocity decreases because of the implantation of plant roots. The roots of plants hinder the nutrient solution flow, which may hinder the circulation of nutrient solution around the root region.
Because there is no flow at 0 L/min, the velocity of water flow is 0 m/s around the root region. As shown in Figure 6b, the flow velocity around the root region in 2 L/min was also extremely close to 0, which explains why no significant changes in dry and fresh weights were observed between 0 L/min and 2 L/min. However, as shown in Figure 6d,f,h, the velocity of flow around the roots increased gradually from 4 L/min to 8 L/min, and the nutrient circulation in the root region was promoted.
The style of nutrient transport to the root surface differs among cultivation substrates. Plant nutrients in the soil reach the root surface by root extension, mass-flow, and diffusion [21]. In hydroponic cultivation, nutrients are mainly transported to the root surface by turbulent diffusion, which includes molecular diffusion and eddy diffusion. In turbulent fluid, molecular diffusion and eddy diffusion contribute to the transfer simultaneously, however, fluid particles are clusters of a large number of molecules, and the scale and speed of fluid-particle transfer are much larger than those of a single molecule; therefore, the effect of eddy diffusion plays a major role. Molecular diffusion also exists in turbulent fluid, however, it can be ignored in most cases. Eddy diffusion refers to the transfer of nutrient ions in turbulent fluid, which mainly depends on the irregular motion of fluid particles. The vortices in turbulent flow cause violent mixing of the fluids. Under composition and concentration differences, the nutrient ions will be transferred to the direction of the lower composition and concentration. Eddy diffusion transfers nutrient ions by means of the vortex motion of fluid particles. Vorticity is one of the most important physical quantities to describe vortex motion, which is defined as the vorticity of the fluid velocity vector. Vortex motion is measured by vorticity, which describes both strength and direction.
The vorticity distribution of the flow field in hydroponic cultivation is shown in Figure 7. It can be seen that the distribution of vorticity was different between the flow fields with plants and without plants. The vorticity distribution is different throughout the container, particularly around the plant roots.
Similar to the change in velocity distribution, under 2 L/min and 4 L/min, when the flow rate is low, backflow will form after colliding with the root. As shown in Figure 7b,d, the area with higher vorticity is concentrated at the flow inlet of the container (X-axis: 400–620 mm) due to the backflow. When the flow rate increases, the flow force increases gradually. As shown in Figure 7f, the nutrient solution flows under the root, resulting in increased flow velocity around the root, especially underneath the root (X-axis: 200–400 mm). Six L/min allows the nutrient solution to circulate better, and the vorticity distribution in the whole flow field is more uniform than that under other flow patterns in this study. As the flow rate continues to increase, the force of the flow also increases. As shown in Figure 7h, a large number of vortices were generated in 8 L/min, especially in the flow outlet area (X-axis: 0–200 mm) and part of the flow inlet area (X-axis: 400–500), due to the backflow of water after hitting the sidewall.
Overall, there was almost no vortex around the root region in 2 L/min, and the vorticity increased gradually from 4 L/min to 8 L/min. Figure 7 illustrates the high vorticity of 8 L/min compared with the other flow patterns. However, as shown in Figure 4, the plants in 8 L/min neither accumulated the heaviest dry weight nor absorbed the most nutrients. The high vorticity promotes the diffusion of nutrient solution; however, excessive agitation may not provide sufficient contact time between the plant roots and nutrient ions. It takes time for roots to absorb ions, and excessive velocity or excessive vorticity will affect the absorption process.

4. Discussion

When dry weight or fresh weight is used as an indicator to estimate yield, higher weights are believed to be better [22]. The leaf is the most important organ for plants to produce energy by means of photosynthesis. Leaf area and photosynthetic capacity are closely related to plant growth [23]. As shown in Figure 4a–c, from the perspective of plant growth, dry weight, fresh weight, and leaf area increased with increasing flow rate. However, after exceeding the ideal flow rate, the dry weight, fresh weight, and leaf area were reduced. These findings show that, in a certain range, increased flow rate promotes the growth of plants; however, excessive flow rates will inhibit the growth of plants. Furthermore, no significant difference in weight was observed between the low flow rate and no flow rate, indicating that a small flow rate has no evident effect on plant growth. As shown in Figure 4d,e, for root growth, under certain conditions, the root length gradually increased with increasing flow rates. However, the root length and root surface area significantly decreased after exceeding the ideal flow rate, reaching values even lower than those observed without flow. The regulation of flow rate will increase yield, however, if the regulation is unreasonable, plant growth may be inhibited. If the flow rate is too slow, the effect of flow rate on plant growth will not be obvious, and if the flow is too fast, the effect of flow rate on plant growth will be negative.
Roots are the main organs of plants responsible for nutrient absorption. Total nutrient uptake depends on root length and root surface area [24]. The root length influences nutrient uptake [25]. The results in Section 3.1 indicate that the root length and surface area were different under different flow rates. The differences in root morphology led to differences in the total amounts of nutrient uptake [24]. With the increase in root length and root surface area, the total nutrient absorption gradually increases, promoting plant growth. As shown in Figure 4b,f, with the increase in flow rate, nutrient uptake and dry weight of plants showed a similar trend. In terms of plant nutrient uptake, there were differences in the nutrient contents under different flow patterns. Moreover, the amount of nutrients absorbed by plants differed among flow patterns. These results indicate that the absorption of ions is affected by the flow pattern, and the ideal flow pattern provides a reasonable collision frequency and contact time [9] between nutrient ions and roots. Under the ideal flow pattern, nutrient ion absorption is promoted, and the roots elongate due to reasonable physical stimulation from water flow, so as to further absorb more nutrients and promote plant growth.
From the visualization of the flow field in this study, it was found that the flow velocity near the root region was almost static when the flow rate was low, and a promotion effect of the low flow rate on nutrient solution circulation was not apparent. With the increase in flow rate, the root swayed with water flow, and the flow velocity was gradually generated around the root region, which promoted the circulation of nutrient solution. Moreover, with the increase in flow velocity, the roots also receive kinetic energy from the water flow when the water flow impinges on the roots. The kinetic energy can also be regarded as physical stimulation, which can improve plant growth [26]. The kinetic energy from the water flow may promote the elongation of the root, which may also explain why the root lengths differed among flow patterns. Thus, increasing the flow rate will increase the root length and yield in a certain range. Alternatively, if the flow rate is too high, the root receives excessive physical stimulation, which not only prevents the ideal nutrient root contact time [9] but may also affect plant growth [27].
The distribution of vorticity and velocity around plant roots is the reason that flow affects the growth and nutrient absorption of hydroponic plants. The distribution of vorticity and velocity represents the interaction between the nutrient solution flow and the plant roots. In this study, by comparing dry weight and nutrient uptake, the 6 L/min flow pattern was found to be a suitable flow pattern for the hydroponic cultivation of Swiss chard (Beta vulgaris L. spp. cicla cv. Seiyou Shirokuki). However, this does not mean that this flow pattern is suitable for all hydroponically cultivated crops. The studies cited in Table 3 investigated the effects of different flow rates on plant growth. The conclusions regarding the impact of flow rate on plant growth can be analyzed based on the experimental flow rate settings and results of previous research.
The formation of an ideal flow field structure suitable for hydroponic cultivation is related to flow and root properties, especially the shape, elastic modulus, and stiffness. For different plant species, the characteristics of roots are different [29]. Furthermore, the fluid-structure interactions between plants and flow differ between species [30]. As the response of roots with different characteristics to different flows varies (with the swing and the obstruction of flow), the distribution of velocity and vorticity may also vary, even in the same flow rate. Similarly, even for the same species of plants, the characteristics (shape, elastic modulus, and stiffness) of plants in different growth stages may be different, and their responses to the same flow pattern may also differ [31]. As shown in Table 3, in hydroponics, it can be speculated that there are different ideal flow patterns for different species of plants as well as different growth periods of the same plant species. Compared with other flow patterns, plants under the ideal flow pattern absorbed the most nutrients and accumulated the heaviest dry weights. In the hydroponic cultivation process, it is feasible to maximize the yield of plants by regulating the flow pattern. In addition, multiple environmental factors affect plant growth. Not only the flow rate and container size, but also the plant spacing [32] and position impact the characteristics of the flow field in hydroponics. Furthermore, the optimum flow pattern may also be linked with the width, slope [33], and length [14] of the cultivation container, as these will affect the solution depth and root aeration [28]. The relationship between these factors should be investigated in future studies. To further understand the relationship between plant growth and flow patterns in hydroponics, it is essential to study the combined effects of flow patterns with other environmental factors (nutrient solution composition and concentration [8], temperature [28], salinity [11], light intensity and wavelength [34], dissolved oxygen [35], etc.) on the roots and whole plant. These topics will be the focus of our future studies, with the aim of increasing the yield of hydroponically cultivated crops and the rational use of energy and resources (e.g., fertilizer and water), which is of great value to the industry. We believe that this study provides a foundation for further research in this area.
In hydroponic cultivation for vegetable production, increasing the yield by regulating the flow rate is recommended [9]. However, in practice, increasing the flow rate affects energy consumption [10]. Although abundant solar power can be used on drylands to try to reduce energy costs [36], if the increase in flow rate is too low, it will have little effect on the flow of the nutrient solution, which is not cost-efficient. If the increase in flow rate is too high, it will reduce the overall crop yield. Therefore, it is necessary to identify a reasonable flow rate for production in hydroponics.

5. Conclusions

In this study, a fluid visualization method was introduced to describe the flow pattern, not just the flow rate, to explain the relationship between plant growth, root morphology, and flow pattern through crop cultivation experiments. In addition, PIV digital image analysis was newly utilized to observe the flow field of nutrient solutions in hydroponics.
According to the results of this study, changes in the flow rate impact the growth of Swiss chard (Beta vulgaris L. spp. cicla cv. Seiyou Shirokuki). Specifically, (1) increasing the flow rate promoted the growth of plants, however, the promotion effect of a low flow rate on the growth of plants is not apparent. (2) With the increase in flow rate, there exists a certain flow rate that is ideal for plant growth. Under this flow rate, ion absorption is promoted, and the root system elongates due to reasonable physical stimulation, so as to further absorb more nutrients and promote plant growth. (3) When the flow rate exceeds the ideal flow rate, plant growth is hindered, and for some indicators, performs even worse than when there is no flow rate. In addition, the variation trend of N uptake with the increase in flow rate was similar to that of dry weight with the increase in flow rate.
Therefore, in hydroponic crop production systems, adjusting the flow rate can improve plant yield; however, if the flow is set too fast or too slow, it will not sufficiently increase the yield or be economical. Thus, a reasonable flow pattern must be carefully selected. Because increasing the flow means increasing electricity consumption, it increases the cost of operation. Therefore, it is important to balance plant yield, nutrient management, and energy utilization.
We must mention that, although we have done some work on this topic, there are still some remaining problems that have not been completely solved. In this study, the flow field was visualized as two-dimensional. However, hydroponic plants in containers experience water flow from all directions. To observe the flow field of hydroponics under different flow patterns from a three-dimensional standpoint (by 3D-PIV), the relationship between plant growth and flow pattern would be explained more comprehensively. In addition, as basic research, this study was carried out in a specifically sized device, and we can explore how the flow field inside the device affects plant growth by PIV. However, in the large-scale hydroponics cultivation, the influence of flow patterns on plants is more complex. Moreover, it is extremely difficult to visualize a whole large-scale hydroponics container by PIV. The flow pattern in hydroponics is affected by the interaction of flow rate, container size, and plant root. It is necessary to put forward a general index, not only including the flow rate, to guide the flow pattern regulation and cultivation device design in hydroponics production. How to find a general index or method to guide the regulation of flow pattern in hydroponics is also a future topic in this field.

Supplementary Materials

The following are available online at https://www.mdpi.com/article/10.3390/horticulturae7080225/s1, Table S1: Detail data of plant growth, root morphology and nutrient uptake under different flow rates in this study.

Author Contributions

Conceptualization, K.T., S.Y. (Satoshi Yamada) and B.B.; methodology, K.T., S.Y. (Satoshi Yamada) and B.B.; software, B.B.; Investigation, B.B., X.W. and M.Y.; formal analysis, X.W. and B.B.; resources, K.T. and S.Y. (Satoshi Yamada); data curation, X.W. and B.B.; writing—original draft preparation, B.B.; writing—review and editing, K.T., B.B., S.Y. (Satoshi Yamada), M.Y., X.W., S.Y. (Sadahiro Yamamoto) and Y.I.; supervision, K.T., S.Y (Satoshi Yamada) and M.Y.; funding acquisition, K.T. and S.Y. (Satoshi Yamada). All authors have read and agreed to the published version of the manuscript.

Funding

This research was funded by the Japan Science and Technology Agency (JST)/Japan International Cooperation Agency (JICA), grant number JPMJSA1405.

Data Availability Statement

All data generated or analyzed during this study are included in this published article.

Acknowledgments

Thanks to the Organization for Research Initiative and Promotion of Tottori University for supporting us with technical support. Thanks to the Arid land Research Center of Tottori University for supporting us with experimental equipment and experimental site. Thanks to the International Platform for Dryland Research and Education (IPDRE) of Tottori University.

Conflicts of Interest

The authors declare no conflict of interest.

References

  1. Sharma, N.; Acharya, S.; Kumar, K.; Singh, N.; Chaurasia, O. Hydroponics as an advanced technique for vegetable production: An overview. J. Soil Water Conserv. 2018, 17, 364. [Google Scholar] [CrossRef]
  2. Bradley, P.; Marulanda, C. Simplified Hydroponics to Reduce Global Hunger. Acta Hortic. 2001, 289–296. [Google Scholar] [CrossRef]
  3. Jones, J.B., Jr. Hydroponics: A Practical Guide for the Soilless Grower; CRC press: Boca Raton, FL, USA, 2016. [Google Scholar]
  4. Wortman, S. Crop physiological response to nutrient solution electrical conductivity and pH in an ebb-and-flow hydroponic system. Sci. Hortic. 2015, 194, 34–42. [Google Scholar] [CrossRef]
  5. Chun, C.; Takakura, T. Rate of Root Respiration of Lettuce under Various Dissolved Oxygen Concentrations in Hydroponics. Environ. Control. Biol. 1994, 32, 125–135. [Google Scholar] [CrossRef]
  6. Nxawe, S.; Laubscher, C.P.; Ndakidemi, P.A. Effect of regulated irrigation water temperature on hydroponics production of spinach (Spinacia oleracea L.). Afr. J. Agric. Res. 2009, 4, 1442–1446. Available online: https://academicjournals.org/journal/AJAR/article-full-text-pdf/A04898631697.pdf (accessed on 9 May 2021).
  7. Sakamoto, M.; Suzuki, T. Effect of Nutrient Solution Concentration on the Growth of Hydroponic Sweetpotato. Agronomy 2020, 10, 1708. [Google Scholar] [CrossRef]
  8. Genuncio, G.D.C.; Gomes, M.; Ferrari, A.C.; Majerowicz, N.; Zonta, E. Hydroponic lettuce production in different concentrations and flow rates of nutrient solution. Hortic. Bras. 2012, 30, 526–530. [Google Scholar] [CrossRef] [Green Version]
  9. Al-Tawaha, A.R.; Al-Karaki, G.; Al-Tawaha, A.R.; Sirajuddin, S.N.; Makhadmeh, I.; Wahab, P.E.M.; Massadeh, A. Effect of water flow rate on quantity and quality of lettuce (Lactuca sativa L.) in nutrient film technique (NFT) under hydroponics conditions. Bulg. J. Agric. Sci. 2018, 24, 791–798. Available online: http://agrojournal.org/24/05-09.html (accessed on 9 May 2021).
  10. Dalastra, C.; Filho, M.C.T.; Da Silva, M.R.; Nogueira, T.A.; Fernandes, G.C. Head lettuce production and nutrition in relation to nutrient solution flow. Hortic. Bras. 2020, 38, 21–26. [Google Scholar] [CrossRef]
  11. Soares, H.R.; Silva, Ê.F.; Silva, G.F.; Cruz, A.F.; Santos, J.A.; Rolim, M.M. Salinity and flow rates of nutrient solution on cauliflower biometrics in NFT hydroponic system. Rev. Bras. Eng. Agrícola Ambient. 2020, 24, 258–265. [Google Scholar] [CrossRef]
  12. Nuwansi, K.K.T.; Verma, A.K.; Prakash, C.; Tiwari, V.K.; Chandrakant, M.H.; Shete, A.P.; Prabhath, G.P.W.A. Effect of water flow rate on polyculture of koi carp (Cyprinus carpio var. koi) and goldfish (Carassius auratus) with water spinach (Ipomoea aquatica) in recirculating aquaponic system. Aquac. Int. 2015, 24, 385–393. [Google Scholar] [CrossRef]
  13. Endut, A.; Jusoh, A.; Ali, N.; Nik, W.W.; Hassan, A. Effect of flow rate on water quality parameters and plant growth of water spinach (Ipomoea aquatica) in an aquaponic recirculating system. Desalination Water Treat. 2009, 5, 19–28. [Google Scholar] [CrossRef]
  14. Khater, E.S.; Ali, S.A. Effect of Flow Rate and Length of Gully on Lettuce Plants in Aquaponic and Hydroponic Systems. J. Aquac. Res. Dev. 2015, 6, 1. [Google Scholar] [CrossRef]
  15. Durst, F. Fluid Mechanics: An Introduction to the Theory of Fluid Flows; Springer Science & Business Media: Berlin/Heidelberg, Germany, 2008. [Google Scholar]
  16. OAT House Fertilizer Series. Product Information, OAT Agrio Co., Ltd. Available online: https://www.oat-agrio.co.jp/cgi/psearch/item/2013101716413104/ (accessed on 9 May 2021).
  17. Maboko, M.M.; Du Plooy, C.P. Effect of plant spacing and harvesting frequency on the yield of Swiss chard cultivars (Beta vulgaris L.) in a closed hydroponic system. Afr. J. Agric. Res. 2013, 8, 936–942. [Google Scholar] [CrossRef]
  18. Jones Jr, J.B. Kjeldahl Method for Nitrogen Determination.Kjeldahl Method for Nitrogen Determination, 1991. Available online: https://www.cabdirect.org/cabdirect/abstract/19921969818 (accessed on 9 May 2021).
  19. Grant, I. Particle image velocimetry: A review. Proc. Inst. Mech. Eng. Part C J. Mech. Eng. Sci. 1997, 211, 55–76. [Google Scholar] [CrossRef]
  20. Thielicke, W.; Stamhuis, E.J. PIVlab—Towards User-friendly, Affordable and Accurate Digital Particle Image Velocimetry in MATLAB. J. Open Res. Softw. 2014, 2, e30. [Google Scholar] [CrossRef] [Green Version]
  21. Barber, S.A.; Walker, J.M.; Vasey, E.H. Mechanisms for Movement of Plant Nutrients from Soil and Fertilizer to Plant Root. J. Agric. Food Chem. 1963, 11, 204–207. [Google Scholar] [CrossRef]
  22. Dorward, A.; Chirwa, E. A Review of Methods for Estimating Yield and Production Impacts, 2010. Available online: https://eprints.soas.ac.uk/16731/ (accessed on 9 May 2021).
  23. Huang, W.; Ratkowsky, D.A.; Hui, C.; Wang, P.; Su, J.; Shi, P. Leaf Fresh Weight Versus Dry Weight: Which is Better for Describing the Scaling Relationship between Leaf Biomass and Leaf Area for Broad-Leaved Plants? Forests 2019, 10, 256. [Google Scholar] [CrossRef] [Green Version]
  24. Barber, S.A.; Silberbush, M. Plant Root Morphology and Nutrient Uptake. Asaspecial 2015, 65–87. [Google Scholar] [CrossRef]
  25. Crawford, N.M. Nitrate: Nutrient and signal for plant growth. Plant Cell 1995, 7, 859–868. [Google Scholar] [CrossRef] [Green Version]
  26. Aladjadjiyan, A. 2007. The use of physical methods for plant growing stimulation in Bulgaria. J. Cent. Eur. Agric. 2007, 8, 369–380. Available online: https://hrcak.srce.hr/19607 (accessed on 9 May 2021).
  27. Jaffe, M.J. Thigmomorphogenesis: The response of plant growth and development to mechanical stimulation. Planta 1973, 114, 143–157. [Google Scholar] [CrossRef]
  28. Hussain, T.; Verma, A.K.; Tiwari, V.K.; Prakash, C.; Rathore, G.; Shete, A.P.; Saharan, N. Effect of water flow rates on growth of Cyprinus carpio var. koi (Cyprinus carpio L., 1758) and spinach plant in aquaponic system. Aquac. Int. 2014, 23, 369–384. [Google Scholar] [CrossRef]
  29. Lynch, J. Root Architecture and Plant Productivity. Plant Physiol. 1995, 109, 7–13. [Google Scholar] [CrossRef] [PubMed]
  30. Gosselin, F.P. Mechanics of a plant in fluid flow. J. Exp. Bot. 2019, 70, 3533–3548. [Google Scholar] [CrossRef] [PubMed]
  31. De Langre, E. Effects of Wind on Plants. Annu. Rev. Fluid Mech. 2008, 40, 141–168. [Google Scholar] [CrossRef] [Green Version]
  32. Guzmán-Valdivia, C.H.; Talavera-Otero, J.; Désiga-Orenday, O.; Valdivia, G.; Otero, T.; Orenday, D. Turbulent Kinetic Energy Distribution of Nutrient Solution Flow in NFT Hydroponic Systems Using Computational Fluid Dynamics. AgriEngineering 2019, 1, 21. [Google Scholar] [CrossRef] [Green Version]
  33. Grigas, A.; Kemzūraitė, A.; Steponavičius, D.; Steponavičienė, A.; Domeika, R. Impact of Slope of Growing Trays on Productivity of Wheat Green Fodder by a Nutrient Film Technique System. Water 2020, 12, 3009. [Google Scholar] [CrossRef]
  34. Kim, B.-S.; Youm, S.; Kim, Y.-K. Sterilization of Harmful Microorganisms in Hydroponic Cultivation Using an Ultraviolet LED Light Source. Sensors Mater. 2020, 32, 3773. [Google Scholar] [CrossRef]
  35. Goto, E.; Both, A.; Albright, L.; Langhans, R.; Leed, A. Effect of dissolved oxygen concentration on lettuce growth in floating hydroponics. Acta Hortic. 1996, 205–210. [Google Scholar] [CrossRef]
  36. Baiyin, B.; Tagawa, K.; Gutierrez, J. Techno-Economic Feasibility Analysis of a Stand-Alone Photovoltaic System for Combined Aquaponics on Drylands. Sustainability 2020, 12, 9556. [Google Scholar] [CrossRef]
Figure 1. Solar irradiance and ambient temperature of the greenhouse during hydroponic cultivation.
Horticulturae 07 00225 g001
Figure 2. The hydroponic system used in this study. (a) Diagram of up view; (b) photograph; the cultivation container dimensions were 620 mm length (L) × 375 mm width (W) × 195 mm height (H). The flow inlet and flow outlet were located at the center of the sidewall, and the flow inlet and outlet diameters were both 18 mm.
Horticulturae 07 00225 g002
Figure 3. Observation method of the flow field and roots in hydroponics: (a) without plants; (b) with plants.
Horticulturae 07 00225 g003
Figure 4. Plant growth, root morphology, and nutrient uptake under different flow rates. (a) Fresh weight; (b) dry weight; (c) leaf area; (d) root length; (e) root surface area; (f) N uptake by a plant. Bars labelled with different letters differ significantly (p < 0.05), data are expressed as M.S.E (n = 3).
Horticulturae 07 00225 g004
Figure 5. Plant roots under different flow rates. (a) 0 L/min; (b) 2 L/min; (c) 4 L/min; (d) 6 L/min; (e) 8 L/min.
Horticulturae 07 00225 g005aHorticulturae 07 00225 g005b
Figure 6. Flow velocity distribution of the flow field in hydroponics under different flow rates. (a) 2 L/min (without plants); (b) 2 L/min (with plants); (c) 4 L/min (without plants); (d) 4 L/min (with plants); (e) 6 L/min (without plants); (f) 6 L/min (with plants); (g) 8 L/min (without plants); (h) 8 L/min (with plants). The magnetic map of velocity is shown in the figure, blue indicates a velocity of 0 m/s, and red indicates the highest velocity (0.05 m/s).
Horticulturae 07 00225 g006
Figure 7. Vorticity distribution of the flow field in hydroponics in different flow rates. (a) 2 L/min (without plants); (b) 2 L/min (with plants); (c) 4 L/min (without plants); (d) 4 L/min (with plants); (e) 6 L/min (without plants); (f) 6 L/min (with plants); (g) 8 L/min (without plants); (h) 8 L/min (with plants). The magnetic map of vorticity is shown in the figure, green means no vorticity, red means clockwise vorticity, and blue means counter-clockwise vorticity.
Horticulturae 07 00225 g007
Table 1. Composition and concentration of the standard nutrient solution OTA fertilizer A.
CompositionT-NP2O5K2OCaOMgOMnOB2O3FeCuZnMo
Concentration (ppm)260120405230601.51.52.70.030.090.03
Table 2. Measurement objectives and instruments used.
Measurement ObjectiveMeasurement Instrument
Plant growthLeaf areaLeaf area meter (LI3000A, LI-COR, Lincoln, Nebraska USA)
Fresh weightPrecision balance (UP623Y, SHIMAZU, Kyoto, Japan)
Dry weight
Root morphologyLengthRoot scanner and software (WinRhizo 2008a, REGENT INS, Quebec, Canada)
Surface area
Nutrient contentNDigest system (K-437, BUCHI, Wilmington, USA), Distillation Unit (K-355, BUCHI, Wilmington, USA)
Table 3. Studies regarding the effect of flow rate on plant growth in hydroponics.
Authors and TimeFlow Rate (L/min)
(Optimal Flow Rate)
PlantMeasurement for Plant Growth
Genuncio et al. (2000) [8]0.75, 1, 1.5 (1.5)LettuceFresh weight
Tawaha et al. (2018) [9]10, 20, 30 (20)Plant height, dry weight, fresh weight, number of leaves
Dalastra et al. (2020) [10]0.5, 1.0, 2.0, 4.0 (1.0)Dry weight, fresh weight, nutrient accumulation
Khater et al. (2015) [14]1.0, 1.5, 2.0 (1.0)Nutrient uptake, fresh weight, dry weight, N content
Nuwansi et al. (2016) [12]0.8, 2.4, 4.0 (0.8)SpinachPlant height, leaf length, yield, percentage of height gain
Endut et al. (2009) [13]0.8, 1.6, 2.4, 3.2, 4.0 (1.6)Plant height, growth rate
Hussain et al. (2015) [28]1.0, 1.5, 3.2 (1.5)Plant height, percentage of height gain, yield
Soares et al. (2020) [11]1.5, 2.5 (1.5)CauliflowerLeaf area, number of leaves, plant height, shoot diameter
Publisher’s Note: MDPI stays neutral with regard to jurisdictional claims in published maps and institutional affiliations.

