Article

High-Throughput SSR Marker Development and the Analysis of Genetic Diversity in Capsicum frutescens

1
State Key Laboratory for Managing Biotic and Chemical Threats to the Quality and Safety of Agro-Products, Institute of Vegetables, Zhejiang Academy of Agricultural Sciences, Hangzhou 310021, China
2
Wulanchabu Academy of Agricultural and Husbandry Sciences, Wulanchabu 012000, China
3
China-Australia Research Centre for Crop Improvement, Zhejiang Academy of Agricultural Sciences, Hangzhou 310021, China
*
Author to whom correspondence should be addressed.
Horticulturae 2021, 7(7), 187; https://doi.org/10.3390/horticulturae7070187
Submission received: 1 June 2021 / Revised: 28 June 2021 / Accepted: 3 July 2021 / Published: 8 July 2021
(This article belongs to the Special Issue Advances in Molecular Breeding of Vegetable Crops)

Abstract

:
Capsicum frutescens, one of the domesticated species of pepper grown worldwide, is thought to be highly advantageous due to its strong resistance against plant pathogenesis, high productivity, and intense aroma. However, a shortage of molecular markers limits the efficiency and accuracy of genetic breeding for pepper. With the newly developed next-generation sequencing technology, genome sequences of C. frutescens can be generated, which are now available for identifying SSR markers via data mining. In this study, a total of 278,425 SSRs were detected from the pepper genome using MISA software. It was observed that trinucleotides were the dominant repeat motif. This was followed by dinucleotides, tetranucleotides, pentanucleotides, and the hexanucleotides repeat types. (AT)n (TTG)n (AAAT)n (AAATA)n (TATAGA)n is known to be the most common repeat motifs corresponding to dinucleotide to hexanucleotide repeats, respectively. In addition, a total of 240 SSR primers evenly distributed over all 12 chromosomes were designed and screened against 8 C. frutescens cultivars. Of these, 33 SSR markers that have high polymorphism, have been scrutinized for 147 accessions from 25 countries. The dendrogram constructed clustered these accessions into seven major groups. The groups were found to be consistent with their origins. The results obtained in this study provided resources of SSR molecular markers and insight into genetic diversity of the C. frutescens.

1. Introduction

Pepper is an indispensable spice, as well as an important vegetable crop which is cultivated around the globe. It originated in South America and belongs to the genus Capsicum (Solanaceae) [1,2,3]. This genus has many varieties of cultivated and wild species. However, only five of the species are commonly cited in the current literature as domesticated and culinary species. These include C. annuum, C. chinense, C. frutescens, C. baccatum, and C. pubescens [4]. Among those, C. annuum is considered to be the predominant species, which is comprised of many commercial varieties with major variations in the size, shape, color of the fruit, and, in particular, the pungency. However, after a long period of artificial selection, continuous cultivation, and domestication, the characteristic performance of pepper has tended to become diversified with narrowing genetic backgrounds. Consequently, the reduced genetic diversity index has engendered a straggle in the production of the piquant/hot pepper varieties. This has entailed searching and restoring potent traits from related wild species/wild pepper varieties in order to improve the quality traits [5]. Furthermore, the enriched genetic diversity in the other four species, along with the rest of the wild species, has significantly rendered the possibility of improving C. annuum through various new technologies [6]. The genetic diversity analyses of the aforementioned accessions have provided excellent research resources, thereby utilizing their advantages and also the potential of reasonably allocating parent traits, which will definitely guarantee future breeding efficiency [7].
C. frutescens is a domesticated annual/perennial shrub crop bearing small erect, wheat-shaped fruit, which are often strongly spicy in flavor. The unripe fruit are green to pale yellow, which turn red as ripening occurs. This species has many wild types, particularly one of the most commonly reported wild pepper species in China, which are mainly distributed in tropical areas such as Yunnan and Hainan provinces in China. A member of C. frutescens is locally known as ‘Xiaomijiao’ (Kunming Institute of Botany, Chinese Academy of Sciences, 1979) [8]. In addition, this plant species is known to be highly resistant to various biotic and abiotic stresses [8,9,10,11]. It also has the ability to withstand pathogenic attacks [9]. C. frutescens is characterized by high yield capacity, delicate flesh fragrance, and is also of ethnomedicinal importance. Therefore, investigating the genetic diversity of the germplasm resources of C. frutescens can potentially provide a basis for the improvement of existing cultivated pepper in China.
Simple sequence repeats (SSRs), or microsatellites, are a group of tandemly repeated DNA sequences comprised of one to six nucleotide units. These are ubiquitous in the genomes of prokaryotic and eukaryotic organisms [12,13]. SSRs are the most highly recognized genetic markers that are actively employed in plant breeding due to their distinguished traits of co-dominant inheritance, multi-allelic nature, extensive genome coverage, high abundance, and especially high reproducibility [12,14]. The polymorphism resulting from SSRs can be detected from amplifying genes by employing primers flanking the repeated motifs [15]. SSR markers are widely used when examining plants and animals from different aspects, such as analyzing population characteristics [16], functional diversity [17,18,19], constructing linkage maps [20,21], DNA fingerprinting [22,23,24,25], and assisted breeding techniques [26,27,28]. There are many SSR markers which have been developed and successfully used. However, it is imperative to develop a few with strong stability and highly polymorphic SSR markers in order to comply with such intricate studies as high-density genetic mapping, genome comparative mapping, and genome-wide association analysis.
It has been found that examining the diversity of the pepper germplasm via assessing the morphological characteristics is not only very stringent, but often results in misguidance. Furthermore, such attributes may be equally impacted by environmental conditions. However, molecular markers have been found to have several advantages in representing colossal amounts of information, as well as better stability and high analysis efficiency when used to study the genetic diversity of plant germplasm resources. Therefore, molecular markers are widely used in genetic diversity research [29]. For example, in recent years, molecular markers have been extensively employed for analyzing the genetic diversity of pepper germplasm resources. In addition, among the many types of molecular markers, SSRs are highly preferred for examining diversity due to their high polymorphism, ample repeatability, and co-dominance traits [30]. These characteristics have been supported by many earlier reports. For example, in the study conducted by Gu [31] regarding pepper diversity, 1904 pepper materials were accommodated into two categories by employing 29 pairs of polytropic SSR markers. Similarly, Zhang [32] used SSR labeling technology to analyze 372 pepper materials and then cluster them into three groups. The results were found to be consistent with the botanical characteristics. Chen [5], when comparing the efficiency of SRAP and SSR for the genetic diversity analyses of eight pepper germplasm, found that the SSRs were more efficient, with higher polymorphism and detection ability. In another related study, 14 pairs of SSR polymorphic primers were employed by Li [33], who also analyzed the genetic diversity of 169 pepper materials. It was observed that when classifying them into seven groups and validating the findings, the results were in exact congruence with the basic classification of the pepper species.
Pepper germplasm resources are the prime material basis for the breeding and production of pepper crops. However, the genetic background of the pepper germplasm resources in China is relatively narrow. Therefore, it is indicated that an emphasis should be placed on gaining significant data resources with efficient utilization values from the collection and proper exploitation of wild germplasm resources. Among the available resources, ‘Xiaomijiao’ is the only wild C. frutescens plant found in China. As a result, this research focused on the objectives of studying the development of SSR molecular markers for C. frutescens on the basis of the ‘Xiaomijiao’ sequence data (unpublished), and then analyzed the genetic diversity of the germplasm resources collected from the genome levels through SSR markers. These new polymorphic microsatellite markers provide the basis for further population research. In this paper, the genetic diversity of 147 C. frutescens germplasm from 25 countries was analyzed to understand the genetic relationships and genetic composition of various accessions, so as to provide basis for more effective utilization of these germplasm resources in the future.

2. Materials and Methods

2.1. Plant Materials and DNA Extraction

A total number of 147 pepper (C. frutescens) accessions, which had been collected from 25 countries, were used in this study. The details of the samples encompassing their English names, cultivation regions, DNA concentrations (ng/uL), and the type of selected species (wild/cultivated) are summarized in Supplementary File S1. Following the sampling processes, young leaves were immediately frozen under liquid nitrogen and transferred to −80 °C conditions for future DNA extraction. Then, following the process described by Murray and Thompson [34], CTAB (Cetyl Trimethyl Ammonium Bromide) methods were used for genomic DNA extraction. In addition, the quality of isolated DNA was ascertained using an NanoDropOneC Microvolume UV-Vis Spectrophotometer. Finally, the DNA concentrations were adjusted to 10 to 35 ng/μL for use in the subsequent polymerase chain reactions (PCR).

2.2. Source of Genic Sequences, SSR Identification and Primer Design

In this study, the wild pepper ‘Xiaomijiao’ (C. frutescens) was sequenced at Beijing Nuohe Zhiyuan Technology Co., Ltd. The genome sequencing of ‘Xiaomijiao’ (C. frutescens) was performed with Illumina HiSeq4000 (300x coverage) and PacBio Sequel (30x coverage). The assembled sequences, which totaled 2.95 G bases, were used in this study to characterize the distribution of microsatellites in the pepper genome. The completeness of the 2.95 Gbp assembly is supported by the mapping of over 99% of ~3 million EST reads (generated using HiSeq4000 technology) from ‘Xiaomijiao’ (C. frutescens) leaf, stem and root tissues. A MISA (MIcroSAtellite) SSR identification tool program was employed for the sequence identification [35]. It was confirmed that 2 to 6 nucleotide motifs could be considered for identifying the presence of microsatellites. The minimum repeating units for the dinucleotides, trinucleotides, tetranucleotides, pentanucleotides, and hexanucleotides were defined as 6, 5, 4, 4, and 4, respectively. We allowed up to 5 nucleotide mismatches at the 5’ end of the primer, but no mismatches at the 3’ end, and a minimum of 80% overall match homology. For a given primer pair, we considered that a specific amplicon was generated if both forward and reverse primers were mapped to the same chromosomes/scaffold. Then, based on the MISA results, Primer 5 software was employed for designing the SSR primers. They generated amplicon sizes of 100 to 300 bp with the following criteria: 22 to 25 bp lengths with 40 to 70% GC content levels; 45 to 65 °C melting temperature (Tm); and the remaining parameters used the program’s default values. Eight pepper cultivars, referred to as GRIF 9194, GRIF 9316, PI 439309, PI 439489, PI 631142, VI029462, VI062180, and LJ091, respectively, were selected for validating the primers via PCR and electrophoretic techniques. A total number of 240 SSR markers, which were distributed among 12 linkage groups, were screened. Finally, 33 markers were identified as being evenly distributed along the linkage groups, which produced clear bands with high polymorphism. These markers were further used to analyze all of the accessions, as detailed in Table 1.

2.3. PCR Amplification and Polyacrylamide Gel Electrophoresis

PCR were carried out in the final volume of the 10 μL reaction mixture (1 μL DNA, 1 μL forward primer, 1 μL reverse primer (100 ng/μL), 5 μL of 2 × T5 Super PCR Mix, and 2 μL nuclease-free water) on a thermocycler (Applied Biosystems, StepOnePlus ABI7500) with the following reaction conditions: initial denaturation at 94 °C for 3 min, then 30 cycles at 94 °C for 30 s; annealing at 55 °C for 30 s, extension at 72 °C for 1 min; and final extension at 72 °C for 5 min. Electrophoretic analysis was completed in order to assess the PCR amplicons, employing 8% polyacrylamide gel and 0.5 × TBE buffer at a constant voltage of 180 V, 150 mA, and 50 W for three hours, along with a 100 bp DNA ladder. When the electrophoresis was completed, the gel was carefully retrieved, rinsed with sterile water, and kept incubated with 1% silver nitrate (AgNO3) (1 L) for 20 min under shaking conditions. Following the incubation, the gel was washed 3 times with sterile water and immersed in 1 L of developing solution (1.5% sodium hydroxide (NaOH) and 4 mL formaldehydes (CHHO)) until the bands were clearly visible (approximately 5 min). Then, based on the number of clearly visible bands, the alleles in each pepper variety were visually determined.

2.4. Data Statistics and Analysis Results

The scoring was given as 1 (presence) and 0 (absence) for the amplified fragments in each microsatellite loci, and data matrixes were constructed accordingly. Then, employing Popgen (version 1.32) software, several indices were calculated, such as the observed number of alleles (Na), effective number of alleles (Ne), observed heterozygosity (Ho), expected heterozygosity (He), and the Shannon information index (I) [36]. The major allele frequency (MAF), polymorphism information content (PIC), and gene diversity index were calculated using PowerMarker (version 3.0) software [37]. In addition, the cluster analysis of the germplasms was based on the Nei genetic distance [38] and a neighbor joining (NJ) method was used to construct a dendrogram via PowerMarker (version 3.0) software. The dendrogram tree was visualized and edited using MEGA7 (version 7.0) [39].

3. Results

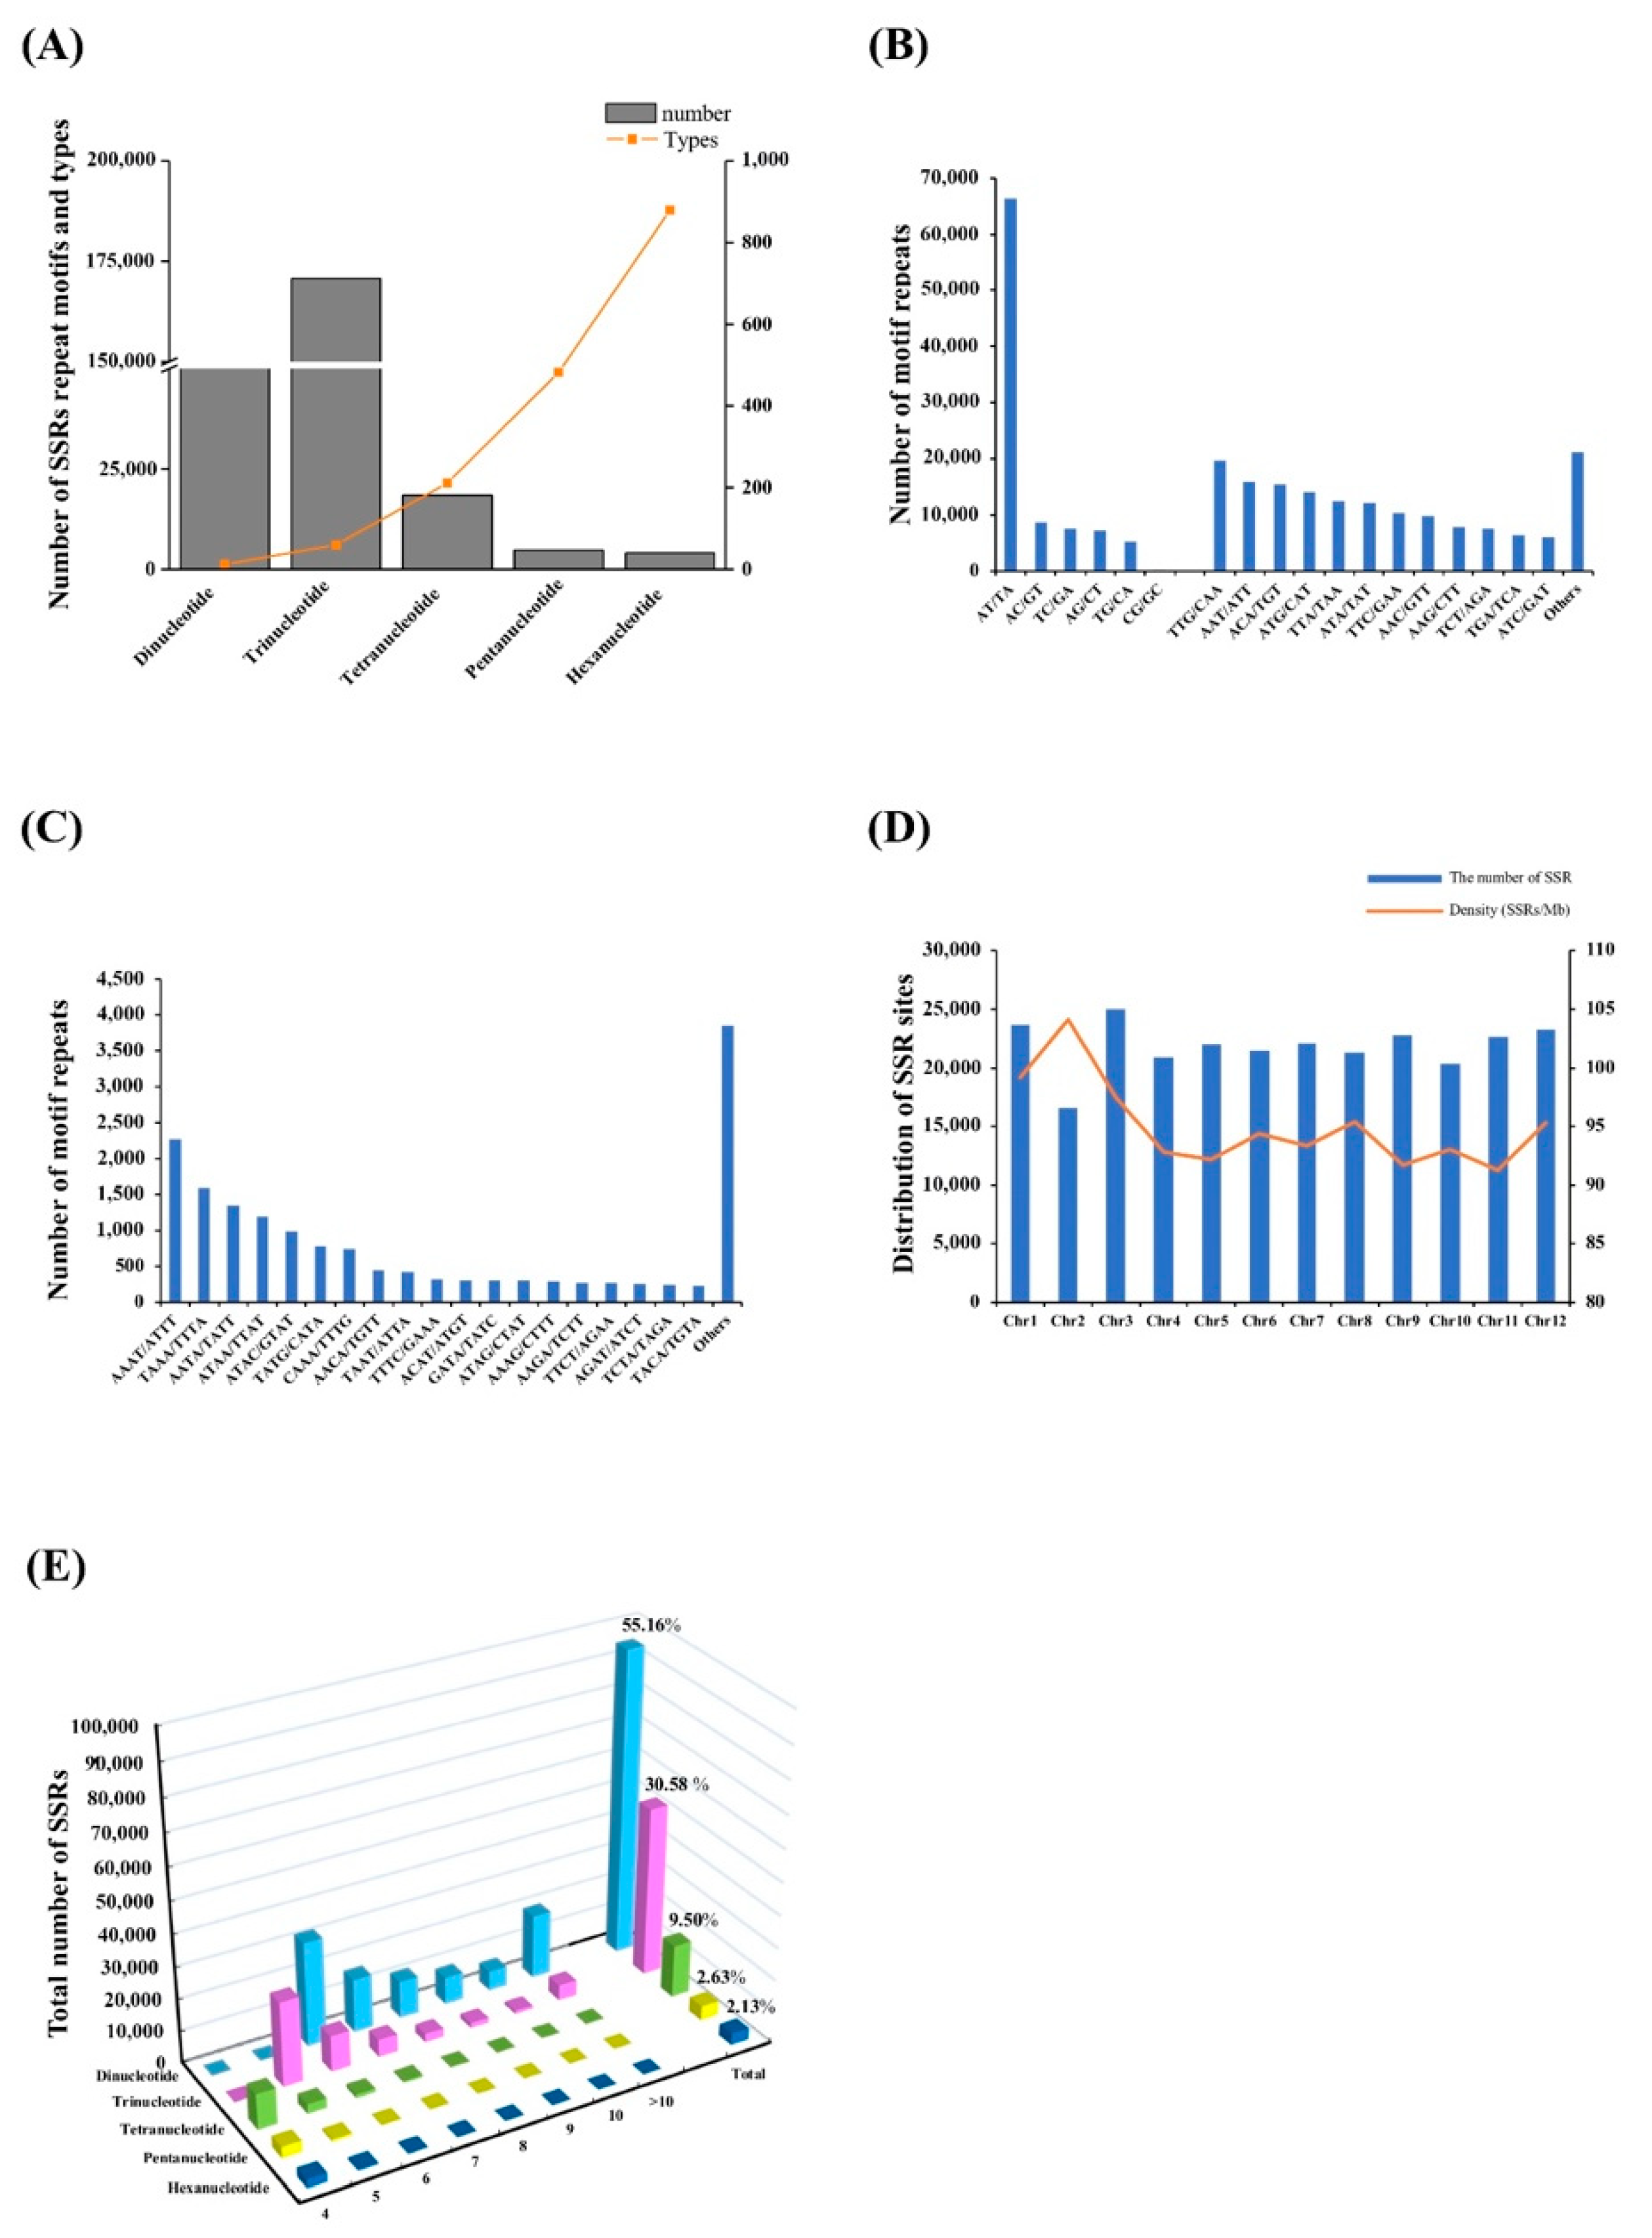
3.1. Distribution of the SSRs in the Capsicum Frutescens Genome

The search results of the genome sequences of C. frutescens resulted in a total number of 278,425 SSR loci being identified. (AT)n(TTG)n(AAAT)n(AAATA)n(TATAGA)n is the most common repeat motifs corresponding to the dinucleotide to hexanucleotide repeat, respectively. The SSR repeat types were found to be different. For example, the dominant amongst the 1638 SSR repeats were the trinucleotides and dinucleotides, which accounted for 57.1% (158,967) and 34.1% (94,916), respectively. The remaining was occupied by tetranucleotide, pentanucleotide, and hexanucleotide repeat motifs, accounting for 5.9% (16,351), 1.6% (4531), and 1.3% (3660), respectively. Taken together, it was found that the majority of the SSR repeat motifs along the entirety of genome sequences were trinucleotide repeats, and the hexanucleotide repeats were the fewest, as illustrated in Figure 1A. The frequencies of each of SSR motif types along the entire C. frutescens genome were also detected. Among the dinucleotide motifs, AT/TA was observed to be the most common (69.91%; 66,356). This was followed by AC/GT (9.14%; 8671) and TC/GA (7.88%; 7476). Meanwhile, the CG/GC motif repeats were rarely observed (0.05%). The trinucleotide repeat motif consisted of 30 different types. The predominant motifs were TTG/CAA and AAT/ATT, which accounted for 12.41 and 10.02%, respectively (Figure 1B). In addition, AAAT/ATTT (13.85%) were the predominantly found tetranucleotide repeats (Figure 1C).
The statistical data showed that the SSR loci were widely distributed on all 12 chromosomes of the C. frutescens genome. These were mainly found in Chr3 (25,014), followed by Chr1 (23,644), Chr12 (23,240), Chr9 (22,761), Chr11 (22,617), Chr7 (22,066), Chr5 (21,976), Chr6 (21,448), Chr8 (21,286), Chr4 (20,939), Chr10 (20,333), and Chr2 (16,579), respectively. In addition, 16,522 SSR loci were unable to allocate in the chromosomes. It was found that, while analyzing the distribution frequency of the SSR loci/Mb, the results revealed that the number of SSR loci/Mb on each chromosome ranged from 91.27 to 104.13. However, the number of SSR loci on Chr3 was the highest. The density of the SSR loci on Chr3 was found to be the third highest, with an average of 97.45 SSR loci/Mb. Moreover, although the number of SSR loci on Chr2 was found to the fewest, the density of the SSR loci was the highest overall (104.13 SSR loci/Mb), as shown in Figure 1D.

3.2. Analysis of the SSR Repeat Motif Types and Frequencies

As shown in Figure 1E, the distributions of the SSRs were also examined from the aspect of the number of repeat units. It was observed that for all the SSR types, the SSR frequencies decreased as the number of repeat units increased. Meanwhile, the change rates became more gradual for the dinucleotides when compared with the longer repeat motif types. The dominant numbers of repeats in the pepper SSR loci ranged between 4 and 10, with the exception of a few (more than 10). At the same time, the majority of the observed repeat times were 6, accounting for 26.20% (45,076). The dinucleotides were found to be the most abundant number of repeats, accounting for 55.16% (94,916), whereas the number of repeats for remaining trinucleotide, tetranucleotide, pentanucleotide, and hexanucleotide were determined to be 30.58% (52,614), 9.50% (16,351), 2.63% (4531), and 2.13% (3660), respectively, as shown in Figure 1E.

3.3. Primer Design of the Pepper Plant Genomic SSR Markers

For the designing of the primers in the current study, a total of 240 SSRs, which were distributed on different chromosomes, were selected. Then, the reliability was evaluated on eight pepper cultivars. It was determined that out of the total primer sets tested, 41 were successfully amplified showing full length polymorphisms. The remaining 199 primers were found to be either non-polymorphic, non-specific amplification with ambiguous bands, or not amplified, as evidenced from the gel results. Of the 41 amplified primer sets, only 33 (13.75%) were found to have generated both polymorphic and unambiguous bands on the gel. Therefore, those primer sets were selected for further analysis, as detailed in Table 1. Among the 33 SSR loci, 1 was observed to be dinucleotides, 11 were trinucleotides, 4 were tetranucleotides, 4 were pentanucleotides, and 13 were hexanucleotides, respectively.

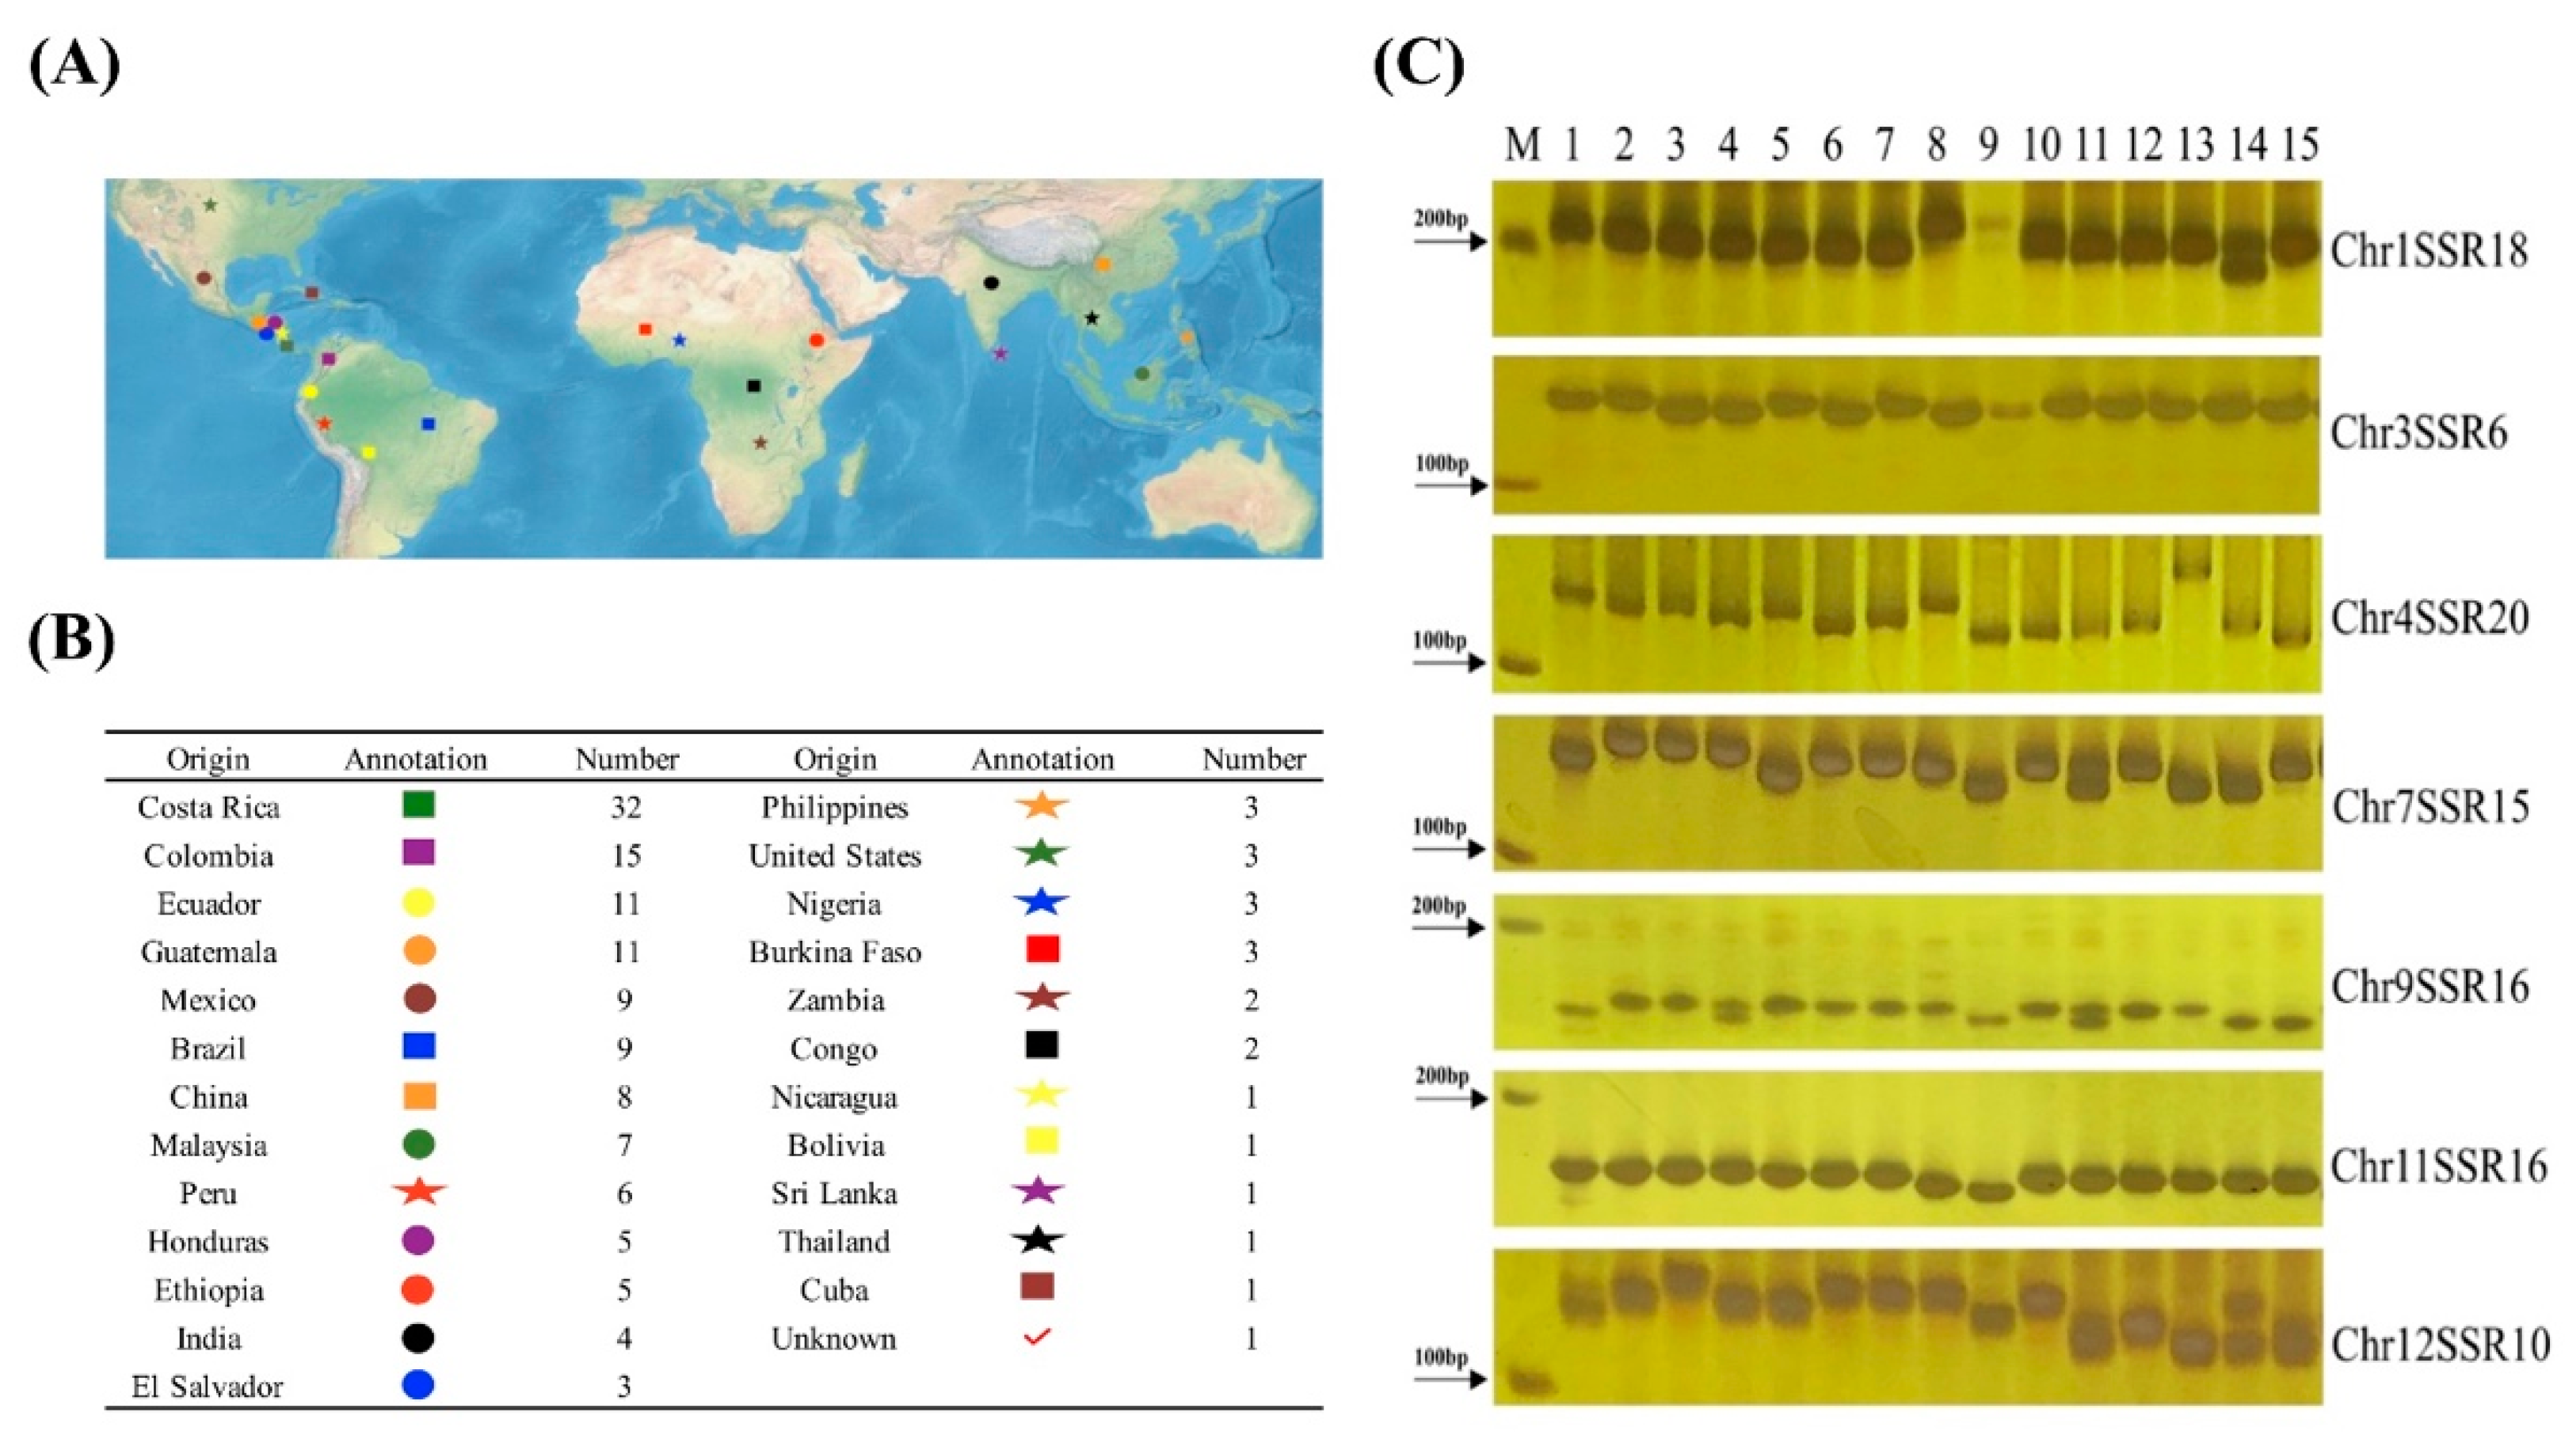
3.4. Polymorphism Analysis with SSR

The results of polyacrylamide gel electrophoresis of several highly polymorphic SSR markers are shown in Figure 2C. In total, 91 alleles were obtained with the aforementioned 33 amplified SSR primers. Among those markers, the Number of Alleles (Na) per locus ranged from 2 (Chr1SSR8, Chr2SSR12, Chr2SSR14, Chr3SSR5, Chr3SSR6, Chr4SSR11, Chr5SSR13, Chr5SSR14, Chr6SSR12, Chr6SSR20, Chr7SSR2, Chr8SSR6, Chr9SSR16, Chr10SSR14, Chr11SSR14, and Chr11SSR16) to 6 (Chr4SSR20), with an observed average of 2.8 alleles. The Effective Number of Allele (Ne) per locus ranged from 1.0288 (Chr7SSR2) to 3.6226 (Chr7SSR15), with an observed average of 1.7055 alleles. The major allele frequency (MAF) ranged from a low of 0.3231 (Chr7SSR15) to a high reaching 0.9858 (Chr7SSR2), with an average of 0.7547. In addition, the Observed Heterozygosity (Ho) ranged from 0.000 (Chr1SSR8, Chr4SSR11, Chr6SSR17, Chr7SSR2, Chr10SSR12, Chr11SSR4, and Chr11SSR14) to 0.9863 (Chr5SSR16), with an average of 0.0989 observed. It was also determined that the Expected Heterozygosity (He) ranged from 0.0281 (Chr7SSR2) to 0.7264 (Chr7SSR15), with an average of 0.3313. Also, the Shannon information index (I) ranged between 0.0744 and 1.3273, with an average of 0.5758, and the polymorphic information content (PIC) ranged from 0.0276 to 0.6718, with a mean value of 0.2893. In the present study, the calculation of the mean gene diversity confirmed it to be 0.3300 for all of the 147 types of material, as shown in Table 2. It was observed that the different markers had displayed different polymorphism. For example, primer Chr7SSR15 was found to be the most informative (PIC value: 0.6718), whereas primer Chr7SSR2 was the least informative (PIC value: 0.0276). Therefore, this study concluded that when considered altogether, the performances of the selected SSR markers were very effective in detecting genetic diversity.

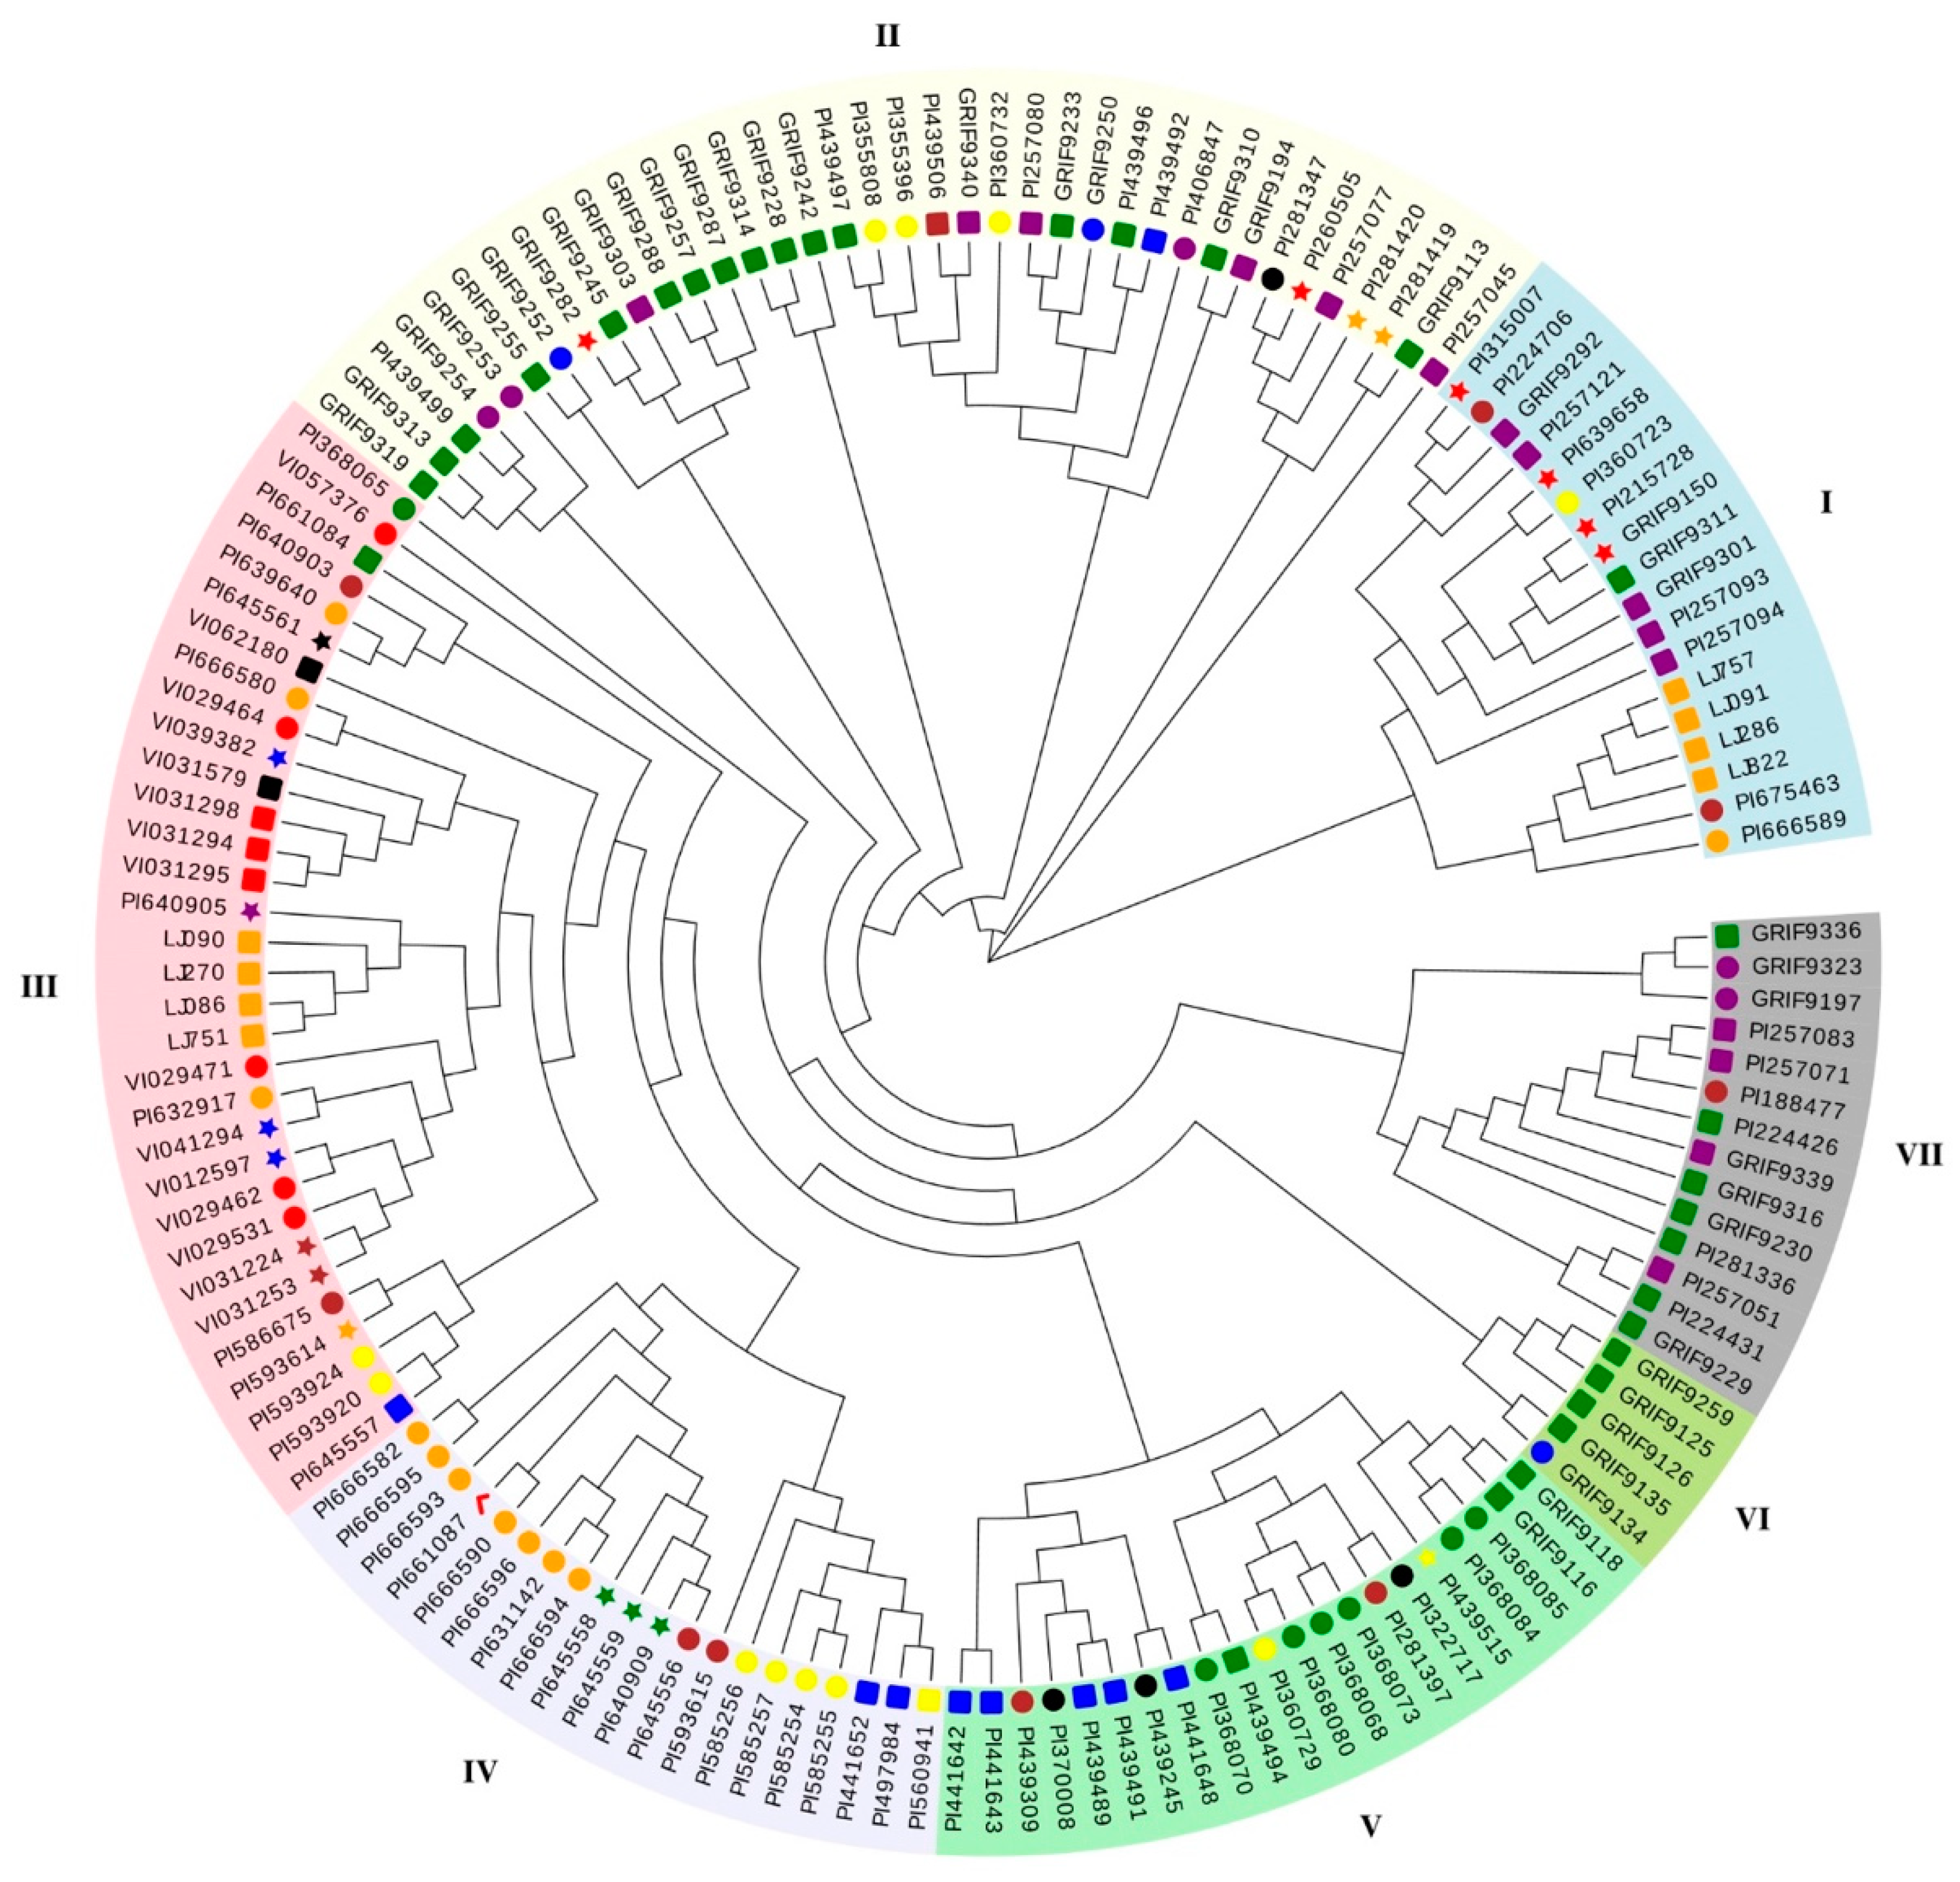
3.5. Genetic Diversity Analysis

The genetic diversity and phylogenetic relationships were determined using 147 collected pepper cultivars from 26 different countries around the world (Figure 2 and Supplementary File S1). This study adopted Nei genetic distance and neighbor-joining methods, and a dendrogram was constructed based on the genotypes detected by the newly developed SSR markers (Figure 3). These were clustered into seven main groups (designated in this study as Groups I, II, III, IV, V, VI, and VII), which were comprised of 18, 37, 32, 20, 21, 5, and 14 members, respectively.
The dendrogram not only reflected the phylogenetic relationships of the cultivars, but was also consistent with their places of origin. Remarkably, the dendrogram revealed that Group I had become a unique branch. Furthermore, Group II consisted of 37 accessions, majority of which were from Latin America, with the exception of 3 accessions (PI 281,419 and PI 281,420 from the Philippines, and PI 281,347 from India). Of plant material collected from 15 countries, 32 types comprised Group III. All of the materials collected in Africa were found to be clustered in that group. In addition, 4 Chinese cultivars were also assigned to Group III. Group IV consisted of 20 accessions, among which 7 were from Guatemala; 7 were from South America; 3 were from United States; 2 were from Mexico; and 1 was from an unknown country, which this study speculated may have been of North American origin. Group V was composed of 21 accessions which were from various geographical origins, such as North America, South America, and other Asian areas. The five members which were clustered in Group VI included four cultivars derived from Costa Rica, and one derived from El Salvador. In addition, 20 accessions derived from Latin America were clustered together in Group VII (Figure 3). These results suggested that the newly developed SSR markers were both stable and suitable for assessing the genetic relationships among C. frutescens cultivars.

4. Discussion

The genome wide analysis of SSRs could provide the opportunity to decipher the optimal functions of these repeats in the regulation and organization of a genome. Also, the potential uses of these markers, such as diversity and population analyses, evolutionary history, and genome and comparative mapping, are currently being explored [19,20,21,40,41,42]. In previous studies, based on the results of sequencing analyses, assessments of the high-quality genome sequences of C. frutescens were made possible, thereby accrediting the opportunity to develop suitable SSR primers. In the present study, it was observed that the dinucleotide and trinucleotide motif repeats were the most abundant, accounting for 85.74%. The remainder of the repeats (14.26%) were contributed by the tetranucleotides, pentanucleotides, and hexanucleotides, as illustrated in Figure 1E. This phenomenon has also been reported in other plants, such as Radix codonopsis, Anthuriumand raeanum, and Camellia sinensis, respectively [43,44,45]. Nevertheless, a few reports have found high abundance of tetranucleotide repeats in some plants, such as Cucumis sativus, Medicago truncatula, and Vitis vinifera [46,47,48]. The differences in the previous finding may have been due to the dissimilarities in paradigms adopted for the SSR identifications. Moreover, the examination of the SSR motif frequency manifested that the scatterings of the dinucleotides, trinucleotides, tetranucleotides, pentanucleotides, and hexanucleotides repeats were generally skewed toward fewer numbers of repeats. These findings indicated that there were predominantly fewer repeats along the pepper genome. The results obtained in this study indicated that higher repeats were found in dinucleotide and trinucleotide SSRs. However, repeats were fewer in number or absent among the tetranucleotide, pentanucleotide, and hexanucleotide SSRs (Figure 1A). Similarly, in other plants, such as citrus, watermelon, and tea, the same trends were observed [18,19,45]. This may be due to the obvious differences in the frequencies and types of SSR motifs. In the pepper genome, this study found AT/TA was the most common, while the CG/GC motif was very rare in the dinucleotide repeats (Figure 1B). These findings were consistent with the motif frequencies found among cucumber, strawberry, maize, Radix codonopsis, potato, plum, watermelon, and horseradish [19,43,48,49,50,51,52,53]. However, our results greatly differed from the motif frequencies observed in rice, citrus, onion, and Atremisia frigida [18,54,55,56], where AG/CT has been found to be the most dominant type. Similarly, TTG, AAT, and ATT were the prevailing motifs of the trinucleotide in this study, with CCG and AGG being the predominant motifs in the monocotyledons, such as barley, rice, and corn. It was found that the number of SSRs, along with their structure and repeat motifs, will greatly differ compared with those in plant species.
It has been found that SSR markers are very much beneficial in population genetics and molecular breeding. However, their effectiveness mainly relies on the marker quality and the accuracy of the experimentation [25]. In the present study, 240 selected SSR loci markers were scrutinized, resulting in 33 unique markers. It was found that when evaluating 147 pepper cultivars, these markers demonstrated remarkable and unambiguous amplification bands (Table 1). The screened SSR polymorphism primers accounted for 13.8% of the total. Previously, Li et al. obtained 17 pairs of SSR polymorphism primers with clear bands and high polymorphism from 152 pairs of SSR primers covering 12 chromosomes [33]. These accounted for 11.2% of the total number of SSR primers, which was slightly lower than that obtained in this result. Liu et al. evaluated 85 pairs of SSR polymorphic primers and 12 pairs were scrutinized [57]. These accounted for 14.1% of the total, which was similar to this study’s research results. Wu et al. used three different peppers as templates to select 65 pairs of SSR polymorphism primers from 153 pairs of SSR primers [42]. These accounted for 42.5% of the total number, which was substantially higher than that obtained in this study. Therefore, it was determined that the proportion of SSR polymorphism primers screened in this study was relatively low, which may have been attributed to the small differences existing in these peppers However, although the proportion of polymorphic primers was low, the results could still be used to analyze the genetic diversity of the pepper population. In regard to pepper, many SSR markers have been developed and mapped to linkage groups [58,59,60], which provide a key basis for analyzing pepper genetic diversity. However, such factors as the number, size, and types of SSR markers, frequencies of the SSR motifs, as well as the various sampling schemes, apparently result in differences in genetic diversity [25,61].
It is of major significance for the collection and efficient utilization of germplasm resources to continue to carry out genetic diversity evaluations. Highly polymorphic, as well as stable markers, are the prerequisites for studying genetic relationships and diversity. Nevertheless, it was found that the SSR loci showed less diversity, as evidenced by low polymorphism information index and gene diversity when compared to earlier reports. For example, in the study conducted by Nicolaï [62], a PIC of 0.67 and a gene diversity of 0.7 were reported, which were 0.38% and 0.37% higher than those of the current study (PIC: 0.29; Gene Diversity: 0.33). However, this may have been due to the volume and types of test sampling. In the aforementioned study, 1352 accessions from 89 countries were utilized, including 11 species of Capsicum. However, this study only examined a single species, C. frutescens. Therefore, compared with Li’s report [33], the amount of accessions used was approximate. The PIC was approximate (slightly higher than this study), but the number of markers was different. Therefore, it was considered that the hypothesis that the difference in genetic diversity was influenced by the number of SSR markers had been confirmed.
Previously, researchers reported that genetic diversity of some peppers (Capsicum spp.) accessions, including Capsicum chinense, Capsicum annuum. In 2016, 71 C. chinense accessions from different Brazilian geographic regions, using fruit morphological descriptors and AFLP molecular markers, were analyzed [63]. The results found no association between the morphological descriptors and AFLP markers [63]. In the same year, the researchers investigated patterns of molecular diversity using a transcriptome-based 48 single nucleotide polymorphisms (SNPs) in a large germplasm collection comprising 3821 accessions. Among the 11 species examined, Capsicum annuum showed the highest genetic diversity (HE = 0.44, I = 0.69), whereas the wild species C. galapagoense showed the lowest genetic diversity (HE = 0.06, I = 0.07). The Capsicum germplasm collection was divided into 10 clusters (cluster 1 to 10) based on population structure analysis, and five groups (group A to E) based on phylogenetic analysis [64]. The dendrogram constructed in this study from 147 pepper accessions using NJ methods, indicated that the genetic relatedness of the pepper cultivars clustered in the majority of the groups were in good agreement with their geographic origins. This study’s analysis results were also consistent with the previous findings reported by Luo et al. and Jia et al. [7,65]. Moreover, the geographical sources of the Group III and Group V materials were found to be diverse, and not only attributed to Asian and African countries, but also to Latin American countries. It was observed that the pepper plants of the same geographical origin were not strictly divided into the same groups. For example, the eight pepper materials from China were grouped into Group I and Group III. These findings suggested that numerous complex migrations had occurred in the pepper genotype as the result of human migration, which had led to their adoption, acclimatization, and local selection.

5. Conclusions

In the present study, 278,425 SSRs were identified by searching the C. frutescens genome sequences. The AT/TA, TTG/CAA, and AAAT/ATTT were observed to be the most common repeat motifs in the dinucleotide, trinucleotide, and tetranucleotide repeats, respectively. Among them, dinucleotides were the most abundant number of repeats, accounting for 55.16%. In this research investigation, the genetic diversity of C. frutescens germplasms was investigated using 33 SSR markers, which were evenly distributed on all of the chromosomes. The 147 experimental materials used in this study were wild peppers with rich genetic diversity. Their eminent properties (withstanding pathogenic attacks, high yielding capacity, and so on) will potentially provide excellent genes for the acquisition of pepper breeding accessions. They may also provide a basis for improving the existing cultivated pepper species, as well as having important significance in expanding the narrow genetic basis of pepper breeding in China. In addition, it was considered that the genome-wide identification and development of SSR markers could be very useful and may possibly provide insights into various research areas regarding C. frutescens in the future, such as high-density genetic mapping, genome comparative mapping, and genome-wide association analyses.

Supplementary Materials

The following are available online at https://www.mdpi.com/article/10.3390/horticulturae7070187/s1, Supplementary File S1, Detailed information for the 147 pepper (C. frutescens) cultivars used in this study.

Author Contributions

Y.Z., Y.C. and H.W. conceived and designed the research; M.R., Q.Y. and R.W. performed the experiments; Z.Y. and G.Z. analyzed the data and wrote the paper; Y.Z., J.L. and J.Y. revised the manuscript. All authors have read and agreed to the published version of the manuscript.

Funding

This research was partially supported by China Agriculture Research System of MOF and MARA (CARS-23-G-44), National Key Research and Development Program of China (2017YFE0114500, 2018YFD1000800) and National Natural Science Foundation of China (31772294, 31960601, 32060446).

Institutional Review Board Statement

Not applicable.

Informed Consent Statement

Not applicable.

Data Availability Statement

The data used for the analysis in this study are available within the article and supplementary materials.

Conflicts of Interest

The authors declare no conflict of interest.

References

  1. Moscone, E.A.; Scaldaferro, M.; Grabiele, M.; Cecchini, N.; García, Y.S.; Jarret, R.; Daviña, J.; Ducasse, D.; Barboza, G.; Ehrendorfer, F. The evolution of chili peppers (Capsicum-solanaceae): A cytogenetic perspective. Acta Hortic. 2007, 745, 137–169. [Google Scholar] [CrossRef]
  2. Olmstead, R.G.; Bohs, L.; Migid, H.A.; Santiago-Valentin, E.; Garcia, V.F.; Collier, S.M. A molecular phylogeny of the solanaceae. TAXON 2008, 57, 1159–1181. [Google Scholar] [CrossRef]
  3. Qin, C.; Yu, C.; Shen, Y.; Fang, X.; Chen, L.; Min, J.; Cheng, J.; Zhao, S.; Xu, M.; Luo, Y.; et al. Whole-genome sequencing of cultivated and wild peppers provides insights into Capsicum domestication and specialization. Proc. Natl. Acad. Sci. USA 2014, 111, 5135–5140. [Google Scholar] [CrossRef] [Green Version]
  4. Nee, M. Peppers, the domesticated Capsicums. Brittonia 1985, 37, 218. [Google Scholar] [CrossRef]
  5. Chen, X.; Zhou, K.; Zong, H.; Fang, R. Genetic diversity of Capsicum frutescens in China as revealed by SRAP and SSR markers. Acta Bot. Boreali-Occident. Sin. 2012, 32, 2201–2205. [Google Scholar]
  6. Zhao, H.; Cao, Y.; Zhang, Z.; Zhang, B.; Bai, R.; Zhao, Y.; Wang, L. Analysis and evaluation of genetic diversity of pepper (Capsicum spp.) Core Germplasm Resources in China. China Veg. 2018, 1, 25–34. [Google Scholar]
  7. Jia, H.; Wei, X.; Yao, Q.; Yuan, Y.; Wang, Z.; Jiang, J.; Yang, S.; Zhao, Y.; Wang, B.; Zhang, X. Genetic diversity analysis of Capsicum genus germplasm resources using SSR markers. Mol. Plant Breed. 2017, 15, 353–363. [Google Scholar]
  8. Deng, M.; Wen, J.; Zhu, H.; Zou, X. The hottest pepper variety in China. Genet. Resour. Crop Evol. 2009, 56, 605–608. [Google Scholar] [CrossRef]
  9. Liu, S.; Li, W.; Wu, Y.; Chen, C.; Lei, J. De Novo Transcriptome Assembly in Chili Pepper (Capsicum frutescens) to Identify Genes Involved in the Biosynthesis of Capsaicinoids. PLoS ONE 2013, 8, e48156. [Google Scholar] [CrossRef] [Green Version]
  10. Wei, J.; Zheng, J.; Yu, J.; Zhao, D.; Cheng, Y.; Ruan, M.; Ye, Q.; Yao, Z.; Wang, R.; Zhou, G.; et al. Production and identification of interspecific hybrids between pepper (Capsicum annuum L.) and the wild relative (Capsicum frutescens L.). J. Agric. Sci. Technol. 2019, 21, 761–769. [Google Scholar]
  11. Wei, J.; Li, J.; Yu, J.; Cheng, Y.; Ruan, M.; Ye, Q.; Yao, Z.; Wang, R.; Zhou, G.; Deng, M.; et al. Construction of high-density bin map and QTL mapping of horticultural traits from an interspecific cross between Capsicum annuum and Chinese wild Capsicum frutescens. Biotechnol. Biotechnol. Equip. 2020, 34, 549–561. [Google Scholar] [CrossRef]
  12. Tautz, D.; Renz, M. Simple sequences are ubiquitous repetitive components of eukaryotic genomes. Nucleic Acids Res. 1984, 12, 4127–4138. [Google Scholar] [CrossRef] [Green Version]
  13. Tóth, G.; Gáspári, Z.; Jurka, J. Microsatellites in different eukaryotic genomes: Survey and analysis. Genome Res. 2000, 10, 967–981. [Google Scholar] [CrossRef] [Green Version]
  14. Powell, W.; Machray, G.C.; Provan, J. Polymorphism revealed by simple sequence repeats. Trends Plant Sci. 1996, 1, 215–222. [Google Scholar] [CrossRef]
  15. Chen, C.; Zhou, P.; Choi, Y.A.; Huang, S.; Gmitter, F.G. Mining and characterizing microsatellites from citrus ESTs. Theor. Appl. Genet. 2006, 112, 1248–1257. [Google Scholar] [CrossRef]
  16. Cheng, Z.; Huang, H. SSR fingerprinting Chinese peach cultivars and landraces (Prunus persica) and analysis of their genetic relationships. Sci. Hortic. 2008, 120, 188–193. [Google Scholar] [CrossRef]
  17. Mccouch, S.; Teytelman, L.; Xu, Y.; Lobos, K.; Clare, K.; Walton, M.; Fu, B.; Maghirang, R.; Li, Z.; Xing, Y.; et al. Development and mapping of 2240 new SSR markers for rice (Oryza sativa L.). DNA Res. 2002, 9, 199–207. [Google Scholar] [CrossRef]
  18. Liu, S.; Li, W.; Long, D.; Hu, C.; Zhang, J. Development and characterization of genomic and expressed SSRs in citrus by genome-wide analysis. PLoS ONE 2013, 8, e75149. [Google Scholar] [CrossRef]
  19. Zhu, H.; Song, P.; Dal-Hoe, K.; Guo, L.; Li, Y.; Sun, S.; Weng, Y.; Yang, L. Genome wide characterization of simple sequence repeats in watermelon genome and their application in comparative mapping and genetic diversity analysis. BMC Genom. 2016, 17, 557–583. [Google Scholar] [CrossRef] [Green Version]
  20. Tan, L.; Wang, L.; Wei, K.; Zhang, C.; Wu, L.; Qi, G.; Cheng, H.; Zhang, Q.; Cui, Q.; Liang, J. Floral transcriptome sequencing for SSR marker development and linkage map construction in the tea plant (Camellia sinensis). PLoS ONE 2013, 8, e81611. [Google Scholar] [CrossRef] [Green Version]
  21. Bali, S.; Mamgain, A.; Raina, S.N.; Yadava, S.K.; Bhat, V.; Das, S.; Pradhan, A.K.; Goel, S. Construction of a genetic linkage map and mapping of drought tolerance trait in Indian beveragial tea. Mol. Breed. 2015, 35, 1–20. [Google Scholar] [CrossRef]
  22. Li, L.; He, W.; Ma, L.; Liu, P.; Xu, H.; Xu, J.; Zheng, X. Construction Chinese cabbage (Brassica rapa L.) core collection and its EST-SSR finger print database by EST-SSR molecular markers. Genom. Appl. Biol. 2009, 28, 76–88. [Google Scholar]
  23. Sarao, N.K.; Vikal, Y.; Singh, K.; Joshi, M.A.; Sharma, R.C. SSR marker-based DNA fingerprinting and cultivar identification of rice (Oryza sativa L.) in Punjab state of India. Plant Genet. Resour. 2009, 8, 42–44. [Google Scholar] [CrossRef]
  24. Tan, L.; Peng, M.; Xu, L.; Wang, L.; Chen, S.; Zou, Y.; Qi, G.; Cheng, H. Fingerprinting 128 Chinese clonal tea cultivars using SSR markers provides new insights into their pedigree relationships. Tree Genet. Genomes 2015, 11, 1–12. [Google Scholar] [CrossRef]
  25. Liu, S.; Liu, H.; Wu, A.; Hou, Y.; An, Y.; Wei, C. Construction of fingerprinting for tea plant (Camellia sinensis) accessions using new genomic SSR markers. Mol. Breed. 2017, 37, 1–14. [Google Scholar] [CrossRef]
  26. Ercisli, S.; Ipek, A.; Barut, E. SSR marker-based DNA fingerprinting and cultivar identification of olives (Olea europaea). Biochem. Genet. 2011, 49, 555–561. [Google Scholar] [CrossRef]
  27. Hameed, U.; Pan, Y.B.; Muhammad, K.; Afghan, S.; Iqbal, J. Use of simple sequence repeat markers for DNA fingerprinting and diversity analysis of sugarcane (Saccharum spp.) cultivars resistant and susceptible to red rot. Genet. Mol. Res. 2012, 11, 1195–1204. [Google Scholar] [CrossRef] [PubMed]
  28. Lanteri, S.; Portis, E.; Acquadro, A.; Mauro, R.; Mauromicale, G. Morphology and SSR fingerprinting of newly developed Cynara cardunculus genotypes exploitable as ornamentals. Euphytica 2012, 184, 311–321. [Google Scholar] [CrossRef]
  29. Zhebentyayeva, T.; Reighard, G.; Gorina, V.; Abbott, A. Simple sequence repeat (SSR) analysis for assessment of genetic variability in apricot germplasm. Theor. Appl. Genet. 2003, 106, 435–444. [Google Scholar] [CrossRef]
  30. Grover, A.; Sharma, P.C. Development and use of molecular markers: Past and present. Crit. Rev. Biotechnol. 2016, 36, 290–302. [Google Scholar] [CrossRef]
  31. Gu, X.; Cao, Y.; Zhang, Z.; Zhang, B.; Zhao, H.; Zhang, X.; Wang, H.; Li, X.; Wang, L. Genetic diversity and population structure analysis of Capsicum germplasm accessions. J. Integr. Agric. 2019, 18, 1312–1320. [Google Scholar] [CrossRef]
  32. Zhang, X.; Zhang, Z.; Gu, X.; Mao, S.; Li, X.; Chadoeuf, J.; Palloix, A.; Wang, L.; Zhang, B. Genetic diversity of pepper (Capsicum spp.) germplasm resources in China reflects selection for cultivar types and spatial distribution. J. Integr. Agric. 2016, 15, 1991–2001. [Google Scholar] [CrossRef]
  33. Li, Y.; Zhao, H.; Wang, Y.; Jiang, J.; Meng, X.; Wei, X.; Li, J. Genetic diversity analysis of 169 accessions of Capsicum. J. Henan Agric. Sci. 2018, 47, 91–97. [Google Scholar]
  34. Murray, M.G.; Thompson, W.F. Rapid isolation of high molecular weight plant DNA. Nucleic Acids Res. 1980, 8, 4321–4325. [Google Scholar] [CrossRef] [Green Version]
  35. Thiel, T.; Michalek, W.; Varshney, R.; Graner, A. Exploiting EST databases for the development and characterization of gene-derived SSR-markers in barley (Hordeum vulgare L.). Theor. Appl. Genet. 2003, 106, 411–422. [Google Scholar] [CrossRef]
  36. Yeh, F.; Boyle, T.B. Population genetic analysis of co-dominant and dominant markers and quantitative traits. Belg. J. Bot. 1997, 129, 157. [Google Scholar]
  37. Liu, K.; Muse, S.V. PowerMarker: An integrated analysis environment for genetic marker analysis. Bioinformatics 2005, 21, 2128–2129. [Google Scholar] [CrossRef] [Green Version]
  38. Nei, M. Estimation of average heterozygosity and genetic distance from a small number of individuals. Genetics 1978, 89, 583–590. [Google Scholar] [CrossRef]
  39. Kumar, S.; Stecher, G.; Tamura, K. MEGA7: Molecular evolutionary genetics analysis version 7.0 for bigger datasets. Mol. Biol. Evol. 2016, 33, 1870–1874. [Google Scholar] [CrossRef] [PubMed] [Green Version]
  40. Zhao, D.; Yang, J.; Yang, S.; Kenji, K.; Luo, J. Genetic diversity and domestication origin of tea plant Camellia taliensis (Theaceae) as revealed by microsatellite markers. BMC Plant Biol. 2014, 14, 14. [Google Scholar] [CrossRef] [Green Version]
  41. Göl, Ş.; Göktay, M.; Allmer, J.; Doğanlar, S.; Frary, A. Newly developed SSR markers reveal genetic diversity and geographical clustering in spinach (Spinacia oleracea). Mol. Genet. Genom. 2017, 292, 847–855. [Google Scholar] [CrossRef] [PubMed]
  42. Wu, J.; Cheng, F.; Cai, C.; Zhong, Y.; Jie, X. Association mapping for floral traits in cultivated Paeonia rockii based on SSR markers. Mol. Genet. Genom. 2017, 292, 187–200. [Google Scholar] [CrossRef] [PubMed]
  43. Wang, D.; Cao, L.; Gao, J. Data mining of simple sequence repeats in Codonopsis pilosula transcriptome. Chin. Tradit. Herb. Drugs 2014, 45, 2390–2394. [Google Scholar]
  44. Yu, Y.; Tian, D.; Pan, X.; Jin, L.; Ge, Y. Mining and developing SSR molecular markers based on transcriptome sequences of Anthurium. Mol. Plant Breed. 2015, 13, 1349–1354. [Google Scholar]
  45. Liu, S.; An, Y.; Li, F.; Li, S.; Liu, L.; Zhou, Q.; Zhao, S.; Wei, C. Genome-wide identification of simple sequence repeats and development of polymorphic SSR markers for genetic studies in tea plant (Camellia sinensis). Mol. Breed. 2018, 38, 1–13. [Google Scholar] [CrossRef]
  46. Mun, J.; Kim, D.; Choi, H.; Gish, J.; Debéllé, F.; Mudge, J.; Denny, R.; Endré, G.; Saurat, O.; Dudez, A.; et al. Distribution of microsatellites in the genome of Medicago truncatula: A resource of genetic markers that integrate genetic and physical maps. Genetics 2006, 172, 2541–2555. [Google Scholar] [CrossRef] [Green Version]
  47. Jaillon, O.; Aury, J.; Noel, B.; Policriti, A.; Clépet, C.; Casagrande, A.; Choisne, N.; Aubourg, S.; Vitulo, N.; Jubin, C.; et al. The grapevine genome sequence suggests ancestral hexaploidization in major angiosperm phyla. Nature 2007, 449, 463–467. [Google Scholar]
  48. Cavagnaro, P.F.; Senalik, D.A.; Yang, L.M.; Simon, P.W.; Harkins, T.T.; Kodira, C.D.; Huang, S.W.; Weng, Y.Q. Genome-wide characterization of simple sequence repeats in cucumber (Cucumis sativus L.). BMC Genom. 2010, 11, 569–587. [Google Scholar] [CrossRef] [Green Version]
  49. Dong, Q.; Wang, X.; Zhao, M.; Song, C.; Ge, A.; Wang, J. Development of EST-derived SSR markers and their application in strawberry genetic diversity analysis. Sci. Agric. Sin. 2011, 44, 3603–3612. [Google Scholar]
  50. Xu, J.; Liu, L.; Xu, Y.; Chen, C.; Rong, T.; Ali, F.; Zhou, S.; Wu, F.; Liu, Y.; Wang, J.; et al. Development and characterization of simple sequence repeat markers providing genome-wide coverage and high resolution in maize. DNA Res. 2013, 20, 497–509. [Google Scholar] [CrossRef] [Green Version]
  51. Gong, L.; Cheng, Y.; Gan, X.; Chen, Y.; Nie, F.; Zhang, L.; Shi, L.; Song, Y.; Guo, Z.; Wang, F. Mining EST-SSRs based on potato transcriptome and analyzing their polymorphism. Mol. Plant Breed. 2015, 13, 1535–1544. [Google Scholar]
  52. Fang, Z.; Ye, X.; Zhou, D.; Jiang, C.; Pan, S. Analysis on SSR information in ‘Furongli’ plum transcriptome and development of molecular markers in Prunus salicina Lindl. J. Fruit Sci. 2016, 33, 416–424. [Google Scholar]
  53. Zhang, Y.; Wei, X.; Wang, X.; Pan, S.; Ye, X. SSR loci in transcriptome of Moringa oleifera lam. Fujian J. Agric. Sci. 2017, 32, 955–958. [Google Scholar]
  54. Zhang, Z.; Deng, Y.; Tan, J.; Hu, S.; Yu, J.; Xue, Q. A Genome-wide microsatellite polymorphism database for the indica and japonica Rice. DNA Res. 2007, 14, 37–45. [Google Scholar] [CrossRef] [PubMed] [Green Version]
  55. Li, M.; Zhang, S.; Deng, P.; Hou, X.; Wang, J. Analysis on SSR information in transcriptome of onion and the polymorphism. Acta Hortic. Sin. 2015, 42, 1103–1111. [Google Scholar]
  56. Yue, C.; Chen, C.; Guo, F.; Li, H.; Sun, H.; Pei, D.; Ma, X.; Chen, F.; Yang, H.; Li, Q. Data mining of simple sequence repeats in transcriptome sequences of mongolia medicinal plant artemisia frigida willd. J. Agric. Sci. Technol. 2016, 18, 31–43. [Google Scholar]
  57. Liu, Z.; Yang, Y.; Sun, J.; Liu, Z.; Cao, Z. Purity identification of Rela No.2 pepper and genetic diversity analysis of excellent pepper inbred lines. Chin. J. Trop. Crop. 2014, 35, 847–853. [Google Scholar]
  58. Rivera, A.; Monteagudo, A.B.; Igartua, E.; Taboada, A.; García-Ulloa, A.; Pomar, F.; Riveiro-Leira, M.; Silvar, C. Assessing genetic and phenotypic diversity in pepper (Capsicum annuum L.) landraces from North-West Spain. Sci. Hortic. 2016, 203, 1–11. [Google Scholar] [CrossRef] [Green Version]
  59. Yuan, X.; Zhou, K.; Wu, Y.; Fang, R.; Chen, X. Genetic Diversity and population structure analysis of pepper core collections. Mol. Plant Breed. 2019, 17, 3090–3104. [Google Scholar]
  60. Uncu, A.T. Genome-wide identification of simple sequence repeat (SSR) markers in Capsicum chinense Jacq. with high potential for use in pepper introgression breeding. Biologia 2019, 74, 119–126. [Google Scholar] [CrossRef]
  61. Yao, M.; Ma, C.; Qiao, T.; Jin, J.; Chen, L. Diversity distribution and population structure of tea germplasms in China revealed by EST-SSR markers. Tree Genet. Genomes 2012, 8, 205–220. [Google Scholar] [CrossRef]
  62. Nicolaï, M.; Cantet, M.; Lefebvre, V.; Sage-Palloix, A.M.; Palloix, A. Genotyping a large collection of pepper (Capsicum spp.) with SSR loci brings new evidence for the wild origin of cultivated C. annuum and the structuring of genetic diversity by human selection of cultivar types. Genet. Resour. Crop Evol. 2013, 60, 2375–2390. [Google Scholar] [CrossRef]
  63. Baba, V.Y.; Rocha, K.; Gomes, G.P.; Ruas, C.F.; Ruas, P.; Rodrigues, R.; Gonçalves, L. Genetic diversity of Capsicum chinense accessions based on fruit morphological characterization and AFLP markers. Genet. Resour. Crop Evol. 2015, 63, 1371–1381. [Google Scholar] [CrossRef]
  64. Lee, H.; Ro, N.; Jeong, H.; Kwon, J.; Jo, J.; Ha, Y.; Jung, A.; Han, J.; Venkatesh, J.; Kang, B. Genetic diversity and population structure analysis to construct a core collection from a large Capsicum germplasm. BMC Genet. 2016, 17, 142–154. [Google Scholar] [CrossRef] [Green Version]
  65. Luo, Y.; Li, J.; Li, M. Analysis of genetic diversity of Capsicum germplasm resources by using SSR markers. Biotechnol. Bull. 2006, S1, 337–341. [Google Scholar]
Figure 1. Total number, distribution, frequency, and distinct motif types of SSRs in the entire genome of C. frutescens: (A) Distribution of the SSR in the ‘Xiaomijiao’ genome; (B) Number of dinucleotide and trinucleotide repeat motifs in the genome; (C) Number of tetranucleotide repeat motifs in the genome; (D) Distribution and frequency of the SSR loci in the genome; (E) Relative frequency (%) of the SSR types with different repeat numbers in the ‘Xiaomijiao’ genome.
Horticulturae 07 00187 g001
Figure 2. Regional distribution of the 147 pepper (C. frutescens) cultivars, and the detailed information material collected from these countries. (A) Regional distribution of the 147 pepper cultivars in this study, mainly collected from Central and South America, Africa, and Asia; (B) Labeling of 25 countries on the map, and information material collected from these countries (including an unidentified source); (C) Polyacrylamide gel electrophoresis analysis of 7 SSR markers with high polymorphism on samples 1 to 15.
Horticulturae 07 00187 g002
Figure 3. Dendrogram was constructed based on the genotypes from 33 SSR markers using neighbor-joining methods, and the icons indicated the information of material source, which was shown in Figure 2B.
Horticulturae 07 00187 g003
Table 1. Details of 33 SSR primers used in the study.
No.PrimersForward Primer Sequence (5′-3′)Reverse Primer Sequence (5′-3′)Repeat UnitRepeat Number
1Chr1SSR8GACTATAGCAAACATGTCCCCAGCCAGATTTTGTGGATCCTATTGATCA4
2Chr1SSR12ATTCAAAGAGGGCATGATGTAGATGTCAACTTAGTGGGTGGGTTAGGGTAGG6
3Chr1SSR18TTAGTGTTGTCAAAATACCCGTGCAATAAACATATCACACGTGCAACATAG6
4Chr2SSR12GAAAGATCCGTCTAAGCAAACAAAAATCTCATGATTTTCGGTGATGAAT4
5Chr2SSR14TGAATTTCGGAGTGTTACGTAGAGGCGAAGGTGAGTCTGTTCAATTATAA4
6Chr2SSR15AATTTGAAGAGCGTGCATAAAAAACCATACCATACCATGGAAACAAATGGT4
7Chr3SSR5ATAAAATAGACCCCACCCACTTCGGGCTGCTGTACTAAAGAAGAAGATTC4
8Chr3SSR6CTCTCTAGAATGAAAAGTGCCGATTGTCGATTTGTTCTTCTTCCATCAC4
9Chr3SSR13ACCCTAAAAGCTATGGAGTTGCTCCCACCATTCTTCTAAACTTTCCAC6
10Chr4SSR11CCTACAAGTGAGGTCTGAGGAGACAGCAAGTTGGAGAAACTAATGCACCCT4
11Chr4SSR14AGTGGAAAGTGCTGTTACGATGTGCGTGATAATTTTTCCACAAGAATTTA5
12Chr4SSR20AAAACAACACGACACACAGCTTATATATTTTTCTTGGGAACGAGCATATAT6
13Chr5SSR13TAAAACCTTGTCACATGTACCCCAAATGAATAAATCCTCTGCATGGTGCA4
14Chr5SSR14TAAGTTGTTCGAGAAATCAGACGCTGTCTCGTATTGAAGGGTGTTTCGGTGA4
15Chr5SSR16CACTGTGAGAGCAACTTTCTGTGCACTATTTTCTCATGCACTTTACCAACGGGC4
16Chr6SSR12TTCGACCTCCGTATCACTATCAGCGTACTCTATCGCTTGTTGCTTTACTC7
17Chr6SSR17TCTGAAAAATCCTCGGCTAAAGTACTGTCCCACCTTACATCCCTATAAAAG5
18Chr6SSR19CAGAGGCAGTTAGGTAGTAGCGATGCTAAACCCACCTTCAGTCTTAGGATTC4
19Chr6SSR20TCTGCTTTCCCACAGTATCTCTCTCAACAGATAAGCGTCAAGTGAATCACCA4
20Chr7SSR2CTGCTTAAAAAGTTGAAGATGAGAATTGATACGCTAATAAAATTGTTGAAAAAT4
21Chr7SSR15GCCTGGCATGTTTTGTATTTCTATTTGGTGACCGACAATATAAAGGATT4
22Chr8SSR6TGAGTCAAGAAAACTTGCAGAAATTTGAAAATAATTGAAGTTCCGCAAAGCA4
23Chr8SSR13TAGATGTTGAACCCCTATTGGAAGGTAGAGGGTAGAGTGTACGCAGTACCAC4
24Chr8SSR15GGTGTCATGCGTAAGCTCATAGTGGTGTCATGCGTAAGCTCATAGTGAGTTG4
25Chr9SSR16CCCCACCGATGAATTTAGTAGATGATGATGTGTCATGGTGTATGACCCCCA4
26Chr9SSR17ATTCCCCATATCGAAACTTCTTCAAATCAAGGAGACGATTGTTGAACTGGTG5
27Chr10SSR12ACGAGAGTTTGCTTTCTTTTCCTTCAGAGGTAGAGGTATGGACTGCAAC4
28Chr10SSR14TTTTTCAGGCTTTTGTGTATGTAAACGGAAACAACCTCTCTACTTCAGCAA5
29Chr11SSR4AATTTTCAACAACAAACTCCACGCAGCAGTGAGGATGAAAAAGTTTAGAG4
30Chr11SSR14TTTTAACTTTTTGTAATTTCGTGTCAATCCAATTTTGTTAGGCCTATTGATCAAA4
31Chr11SSR16ACGAGTGAACACGTACATGAAAAGGTAGGAGCTAGGAGTAGTGACGTTA6
32Chr12SSR10AAAAGGGACTTGTTTTCCTATCAAAATGGGAATGCGATTATCTAAAAAAAAT4
33Chr12SSR19TCTTTCCTTCGGATTAAGTTTCCGAGGCAAGAAATAAGAGATGCCTCAAATC4
Table 2. Polymorphism analysis of the 147 C. frutescens accessions with SSR primers.
PrimerAllele SizeNaNeMAFHoHeIPICGene Diversity
Chr1SSR81342.00001.06150.97010.00000.05840.13420.05620.0579
Chr1SSR122943.00001.21320.90480.18370.17630.36800.16650.1757
Chr1SSR182784.00002.79990.45320.03600.64521.15450.57580.6428
Chr2SSR122862.00001.11040.94760.03500.09970.20570.09450.0994
Chr2SSR142942.00001.17640.91840.02720.15040.28270.13870.1499
Chr2SSR152783.00001.37430.84170.20140.27330.49980.24520.2723
Chr3SSR52862.00001.12590.94060.11890.11220.22540.10560.1118
Chr3SSR62902.00001.37290.83790.03450.27250.44310.23470.2716
Chr3SSR132723.00001.45430.81620.20590.31350.57840.28370.3124
Chr4SSR112902.00001.10120.95170.00000.09220.19340.08770.0919
Chr4SSR142043.00002.12760.53920.05880.53260.82420.42520.5300
Chr4SSR202926.00002.35990.58220.01370.57821.09460.51750.5763
Chr5SSR132822.00001.43020.81560.34040.30190.47800.25560.3008
Chr5SSR142782.00001.05160.97480.02160.04930.11760.04790.0491
Chr5SSR162923.00002.19920.50680.98630.54720.85780.44260.5453
Chr6SSR122482.00001.95410.57660.00810.49020.68140.36910.4883
Chr6SSR172883.00001.16560.92360.00000.14260.29310.13380.1421
Chr6SSR192943.00001.32760.85710.01360.24760.43750.21950.2467
Chr6SSR202802.00001.08940.95710.08570.08230.17690.07870.0820
Chr7SSR22822.00001.02880.98580.00000.02810.07440.02760.0280
Chr7SSR152944.00003.62260.32310.04760.72641.32730.67180.7240
Chr8SSR62882.00001.57320.76040.04860.36560.55060.29800.3644
Chr8SSR132943.00001.43080.82650.13610.30210.57750.27950.3011
Chr8SSR152864.00003.42820.40210.06990.71081.30230.65660.7083
Chr9SSR162502.00001.96780.56400.05600.49380.68490.37090.4918
Chr9SSR172943.00001.60310.77210.07480.37750.68730.34300.3762
Chr10SSR122704.00003.50140.35560.00000.71711.30580.66060.7144
Chr10SSR142922.00001.50260.78770.04110.33560.51700.27850.3345
Chr11SSR42923.00001.30600.86990.00000.23510.47230.22060.2343
Chr11SSR14762.00001.23210.89470.00000.19090.33650.17060.1884
Chr11SSR162942.00001.73060.69730.08840.42360.61320.33310.4222
Chr12SSR102783.00002.51790.49280.10070.60500.99210.52260.6028
Chr12SSR192944.00001.33990.85710.23130.25460.51400.23660.2537
Mean2712.75761.70550.75470.09890.33130.57580.28930.3300
Publisher’s Note: MDPI stays neutral with regard to jurisdictional claims in published maps and institutional affiliations.

