Article

The Effects of Nutrient Solution Feeding Regime on Yield, Mineral Profile, and Phytochemical Composition of Spinach Microgreens

by
Spyridon A. Petropoulos
1,*,†,
Christophe El-Nakhel
2,†,
Giulia Graziani
3,
Marios C. Kyriacou
4 and
Youssef Rouphael
2
1
Department of Agriculture Crop Production and Rural Environment, University of Thessaly, Fytokou Street, N. Ionia, 38446 Magnissia, Greece
2
Department of Agricultural Sciences, University of Naples Federico II, Via Universita 100, 80055 Portici, Italy
3
Department of Pharmacy, University of Naples Federico II, 80131 Naples, Italy
4
Department of Vegetable Crops, Agricultural Research Institute, Nicosia 1516, Cyprus
*
Author to whom correspondence should be addressed.
These authors have contributed equally to this work.
Horticulturae 2021, 7(7), 162; https://doi.org/10.3390/horticulturae7070162
Submission received: 19 May 2021 / Revised: 13 June 2021 / Accepted: 23 June 2021 / Published: 25 June 2021

Abstract

:
Microgreens are receiving increasing popularity as functional and healthy foods due to their nutritional value and high content of bioactive compounds. The aim of the present study was to evaluate the effects of nutrient deprivation through the regulation of nutrient solution (NS) feeding days on the plant growth and chemical composition of spinach microgreens. For this purpose, spinach microgreens were subjected to four different fertigation treatments—namely, 0 (control), 5, 10, and 20 NS feeding days before harvesting—and harvested tissues were evaluated with regard to fresh and dry yield, color of true leaves, antioxidant activity, and chlorophyll, carotenoid, and phenolic compound contents. The results of our study revealed that prolonged NS feeding (20 NS) resulted in the highest fresh yield and photosynthetic pigment contents (chlorophylls, lutein, and β-carotene). In contrast, mineral concentrations (P, K, Ca, and Mg) were the lowest for the 20 NS, whereas the control (0 NS) and 5 NS recorded the highest concentrations. Apart from that, spinach microgreens subjected to 10 NS treatment recorded 70.7% less nitrates, better mineral concentrations, 7.0% higher total ascorbic acid, similar polyphenol contents, higher DM%, and only 12.6% yield decrease compared to 20 NS treatment. In conclusion, although the highest overall fresh yield was recorded with the 20 NS treatment, the highest nitrate concentrations and the lowest mineral concentrations may raise food safety concerns. On the other hand, 10 NS treatment seems to be the most promising, since it combined high yields with high mineral concentrations and low nitrate concentrations, without compromising bioactive compound (e.g., polyphenols) contents, presenting a cost-effective and sustainable practice for microgreen cultivation.

1. Introduction

Microgreens are a novel and emerging category of food products obtained from harvesting the aerial parts of young seedlings of various species—such as vegetables, herbs, and aromatic plants—while wild edible species have recently been included in this category of food products [1,2]. They are distinct from sprouts and baby leaves since they are harvested at the cotyledon stage and before the true leaves emerge [3]. They usually contain high contents of bioactive molecules, such as polyphenols, carotenoids, vitamins, tocopherols, and other antioxidant compounds, which has raised the interest of consumers who are seeking to include new healthy and functional foods in their diets [4]. Their high concentrations of valuable nutrients also make them perfect candidates in health-supporting diets, since the consumption of low amounts of microgreens may prevent nutrient deficiencies and chronic diseases that plague the modern world [5]. Moreover, the biofortification of microgreens through nutrient solution management is easier to facilitate than conventional growing systems, and may also help to achieve food and nutrition security [6,7,8]. Therefore, the farming sector, forced by consumer needs and marketing trends for newly designed healthy food products, is seeking new agronomic approaches that may improve the quality of the final product, while at the same time decreasing production costs.
Microgreens’ shelf life is relatively limited, and spans 2–4 days at ambient temperatures, but may extend to up to 10–14 days at 5 °C. This is perhaps the most serious limitation encountered in their supply chain, but it mainly reflects changes in visual quality induced by dehydration and ageing, which also impact sensory quality [9,10]. The changes in the phytonutrient contents and in vitro/in vivo bioactive values of microgreens introduced by the postharvest period and conditions constitute an area that has not yet received extensive research attention; in fact, literature on this subject remains scarce, although some reports suggest the use of coating and packaging techniques to extend shelf life [11,12]. However, the general rule is that microgreens should be consumed as closely to their harvest as possible in order to ensure a full organoleptic experience. It is therefore unsurprising that they are commonly grown by chefs in upscale restaurants and by consumers at home in order to ensure immediate use after harvest [1,5,13].
Abiotic stressors such as water and nutrient deficiency stress have a significant impact on plant growth and quality and, depending on the severity of the stress, may have negative or positive effects on crops [14]. In this context, the use of nutrient deprivation techniques has been considered a cost-effective agronomic practice, which may beneficially affect plants through the increase in the secondary metabolites that plants synthesize to cope with this eustress [15,16]; Their application in hydroponic systems is easy to facilitate, also allowing the regulation of nutrient solution composition in favor of plant growth and quality [7,17]. This approach has also been studied in field crops, aiming to exploit the plasticity of plants’ ionomes via the expression of specific genes that regulate root transporters [18]. However, the line between nutrient deficiency and regulated deprivation is very fine, and the critical threshold up to which nutrients should be deprived from plants in order to have beneficial effects has yet to be defined. This situation is more complex in hydroponic systems, where plants rely on constant nutrient supplementation in order to obtain the required amounts of nutrients due to limited buffering of the growing medium [19,20]. However, the cultivation of microgreens has completely different requirements due to the early harvesting of the plants, and nutrient deprivation may result in significant benefits for producers and consumers alike via the reduced cost of production and improved functional properties [3].
Spinach (Spinacia oleracea L.) is a very popular and highly nutritious vegetable of the Amaranthaceae family, which is widely consumed throughout the world in fresh, frozen, or canned form [9]. It is a rich source of vitamins, minerals, and trace elements, as well as various bioactive compounds including carotenoids, flavonoids, and tocopherols [9,21]. The harvesting stage has a great impact on the chemical composition of spinach microgreens, which are harvested earlier than conventionally grown spinach and, therefore, present a different chemical profile. Ghoora et al. [22] suggested that spinach microgreens contained significantly higher amounts of α-tocopherol and lower amounts of oxalic acid than mature leaves, while similar findings were reported by Lester et al. [23] for baby spinach leaves compared to mature ones with regard to carotenoid and vitamin contents. Moreover, in the study of Ghoora et al. [22], it was noted that spinach microgreens achieved a 2.5–3.0 times higher nutrient quality score (NQS) than mature spinach, which further highlights the importance of microgreens in healthy diets. Despite its high content of beneficial compounds, spinach is also considered to be a hyperaccumulator of nitrates, which may have a negative impact on human health when consumption exceeds recommended daily intake (RDI) values [24,25]. Pre-harvest factors—such as genotype selection and cultivation practices—and post-harvest factors may regulate chemical composition and improve the quality of the final product [14]. For example, Erfani et al. [26] studied the impact of genotype minerals, vitamins, fatty acids, macronutrients, and oxalic acid, and suggested significant differences among the various genotypes tested. Moreover, according to Bergquist et al. [27], the growth stage at harvest is also essential for the nutritional value and chemical composition of edible spinach leaves, while the early harvesting of baby spinach leaves was found to increase their flavonoid contents [27].
The aim of the present study was to evaluate the effects of nutrient solution application in spinach grown for microgreen production, and to further elucidate how nutrient solution deprivation may affect plant growth and—most importantly—the chemical composition of the final product. For this purpose, spinach plants were supplemented with nutrient solution for 0, 5, 10, and 20 days, and harvested tissues were analyzed for plant growth parameters (fresh and dry weight), as well as for their chemical composition (minerals, nitrates, total ascorbic acid, chlorophylls, carotenoids, and phenolic compounds content). The results of our study could be useful, and offer cost-effective practices to improve the nutritional value of the final product without severe effects on crop performance, further increasing the added value of microgreen products.

2. Materials and Methods

2.1. Genetic Material, Growth Chamber Settings, and Nutrient Feeding

Spinacia oleracea L. var. Palco F1 (CN Seeds Ltd., Pymoor, Ely, Cambrigeshire, UK) was chosen as a nitrate-accumulating species to be grown as microgreens under diverse nutrient solution (NS) feeding days (0, 5, 10, and 20 days of NS application). Spinach microgreens were sown at a density of 60,000 seeds m−2 in plastic trays (19 × 14 × 6 cm) filled with a peat-based medium (pH 5.48 and EC = 282 μS cm−1; Special Mixture, Floragard Vertriebs-GmbH, Oldenburg, Germany) mixed with vermiculite (50% v/v). The peat-based medium was characterized by the following elements: NO3 (11 mg kg−1), PO4 (140 mg kg−1), K (796 mg kg−1), Ca (2402 mg kg−1), Mg (303 mg kg−1), SO4 (235 mg kg−1), and Na (540 mg kg−1), expressed on a dry weight basis. The NS consisted of a quarter-strength modified Hoagland solution (pH = 6 ± 0.2 and EC = 500 ± 50 μS cm−1), described in detail in the work of Kyriacou et al. [15]. The NS was replaced by osmotic water (pH = 6 ± 0.2 and EC = 100 ± 25 μS cm−1) when the feeding treatment was over.
The experiment was conducted in a controlled growth chamber (KBP-6395F, Termaks, Bergen, Norway) at the Department of Agricultural Sciences, University of Naples Federico II, Portici, Italy. The growth chamber settings were: 24/18 ± 2 °C, day/night temperatures, 12 h photoperiod provided by an LED panel (K5 Series XL 750, Kind LED, Santa Rosa, CA, USA) delivering a mean intensity of 300 ± 15 μmol m−2 s−1 at canopy level (optimal absorption spectrum for the photosynthesis; 400–700 nm), and a relative humidity of 65–75 ± 5%. A completely randomized design (CRD) with three replicates (e.g., trays) was used to compare four NS feeding treatments (0, 5, 10, and 20 days of NS application). A daily rotation scheme was performed during the growing cycle. Spinach microgreens were harvested when they formed the first two fully expanded true leaves, at 25 days after sowing (DAS) for 0 and 5 days of NS feeding, and at 20 DAS for the 10- and 20-day NS feeding treatments.

2.2. CIELAB Color Space Parameters Measurement of Spinach Microgreens’ Canopy, Sampling, and Yield Assessment

The CIELAB color space parameters (L*, a* and b*) of spinach microgreens’ canopy were measured before harvesting using a portable Minolta Chroma Meter (CM-2600d, Minolta Camera Co. Ltd., Osaka, Japan), and then the hue angle (h◦) and chroma (C*) were calculated as follows: hue angle = tan−1 (b*/a*), and chroma = ((a*)2 + (b*)2)0.5. Eight measurements per replicate/tray were taken into consideration, accounting for twenty-four measurements per treatment. Afterwards, the microgreens (stems and leaves) of each tray/replicate were cut with scissors at the substrate level, and the fresh weight of each replicate was assessed and expressed as kg of fresh weight m−2. One part of the batch sample of each replicate was dried at 65 °C in a forced-air oven until reaching constant dry weight, which was used to calculate dry matter percentage. These oven-dried microgreen materials (stems and leaves) were ground and used for macromineral concentration analysis. The remaining part of each batch sample was stored at −80 °C for subsequent qualitative analysis (chlorophyll pigments and total ascorbic acid), while a part of the frozen material was lyophilized in a freeze drier (Christ, Alpha 1–4, Osterode, Germany) for ABTS antioxidant activity, carotenoids (lutein and β-carotene), and polyphenol profile determination.

2.3. Determination of Minerals, Nitrates, and Total Ascorbic Acid

The oven-dried microgreen materials were used to determine the concentrations of minerals and nitrates, following a previously described methodology [28]. In brief, 250 mg of plant tissues were extracted with 50 mL of ultrapure water and put in a water bath (ShakeTemp SW 22, Julabo, Seelbach, Germany) for 10 min at 80 °C, with constant shaking. After that, the extracts were centrifuged, and the supernatant was collected and stored in a vial for chromatographic analysis with an ion chromatography instrument (ICS-3000, Dionex, CA, USA) coupled with an electrical conductivity detector. Nitrate (NO3) and mineral (phosphorus (P), potassium (K), calcium (Ca), magnesium (Mg), sulfur (S), and sodium (Na)) concentrations were determined on a dry weight basis (g kg−1) and then converted to mg kg−1 fresh weight (fw), based on the recorded dry matter content. For the determination of total ascorbic acid (TAA), 400 mg of fresh material kept at deep-freezing conditions was extracted according to the protocol of Kampfenkel et al. [29] and analyzed at 525 nm using an UV–Vis spectrophotometer (Hach DR 4000; Hach Co, Loveland, CO, USA). The results were expressed as mg 100 g−1 fw.

2.4. Chlorophyll Pigments, ABTS Antioxidant Activity, Carotenoid Extraction, and Quantification by HPLC-DAD

Total chlorophylls and chlorophyll a and b contents were determined according to the protocol previously described by Lichtenthaler and Buschmann [30]. In particular, 500 mg of fresh material stored at deep-freezing conditions was extracted in 10 mL of 90% acetone. The extracts were centrifuged, and then the supernatant was collected and the absorbance at 662 and 645 nm was measured via spectrophotometry (Hach DR 4000; Hach Co., Loveland, CO, USA) in order to quantify chlorophylls a and b, respectively. The total chlorophyll content was calculated as the sum of chlorophylls a and b, and expressed as mg 100 g−1 fw.
200 mg of freeze-dried material was extracted with methanol. The ABTS antioxidant activity of this extract was measured with the 2,20-azino-bis-3-ethylbenzothiazoline-6-sulfonic acid ABTS method [31]. The results were expressed in mol Trolox equivalents 100 g−1 fw.
For lutein and β-carotene determination, the method of Kim et al. [30], as modified by Kyriacou et al. [12], was implemented. In brief, 100 mg of the lyophilized microgreen materials was extracted in 6 mL ethanol + 0.1% butylated hydroxytoluene. The quantification of lutein and β-carotene followed a reversed-phase HPLC separation using a Shimadzu HPLC LC-10 (Shimadzu, Osaka, Japan). The results were expressed as µg g−1 fw.

2.5. Phenolic Compound Extraction and Conditions of UHPLC-HRMS Analysis

Freeze-dried material was extracted according to the method of Huang et al. [32] after modifications. In brief, 100 mg of freeze-dried samples were extracted in 2.5 mL of methanol/water (70:30, v/v) acidified with formic acid (0.5%), and then sonicated for 30 min at room temperature. The extracts were centrifuged at 4000 rpm for 10 min at 4 °C, and the supernatant was collected after filtering through a 0.2 µm nylon membrane syringe filter (Phenomenex, Castel Maggiore, BO, Italy); 5 μL were used for UHPLC-HRMS analysis.
The analysis of phenolic compounds was performed using a UHPLC system (Thermo Fisher Scientific, Waltham, MA, USA) equipped with a degassing system, a quaternary UHPLC pump, and an autosampler device (Dionex Ultimate 3000). The separation of polyphenols was performed using a thermostatted (25 °C) column (Luna Omega PS 1.6 µm; Phenomenex; 50 mm × 2.1 mm). The volume of the injected sample was 5 µL. Two mobile phases were used—namely, Phase A (water with 0.1% formic acid v/v), and Phase B (acetonitrile with 0.1% formic acid v/v) [33]. The Q Exactive Orbitrap LC-MS/MS equipment was calibrated on a daily basis before the analysis of samples using a reference standard mixture. In full scan MS and AIF modes, a 5 ppm mass tolerance window was set, while the Xcalibur software v. 3.0.63 (Xcalibur, Thermo Fisher Scientific, Waltham, MA, USA) was used to analyze and process the obtained data. All of the results were expressed as µg 100 g−1 fw.

2.6. Statistics

The experiment was performed according to randomized complete blocks (RCB), with three replicates per feeding treatment, and all of the data are presented as mean ± standard error (SE). The mean values of the studied parameters were subjected to analysis of variance (ANOVA), and the means were compared according to Duncan’s multiple range test (DMRT) at p ≤ 0.05 using the SPSS 20 software package (SPSS Inc., Chicago, IL, USA). Regression analysis was conducted in order to identify relationships between the measured parameters (fresh yield, dry biomass, dry matter percentage, nitrates, P, K, and total ascorbic acids) and nutrient solution feeding days. This analysis was also performed with the SPSS 20 software package (SPSS Inc., Chicago, IL, USA).

3. Results and Discussion

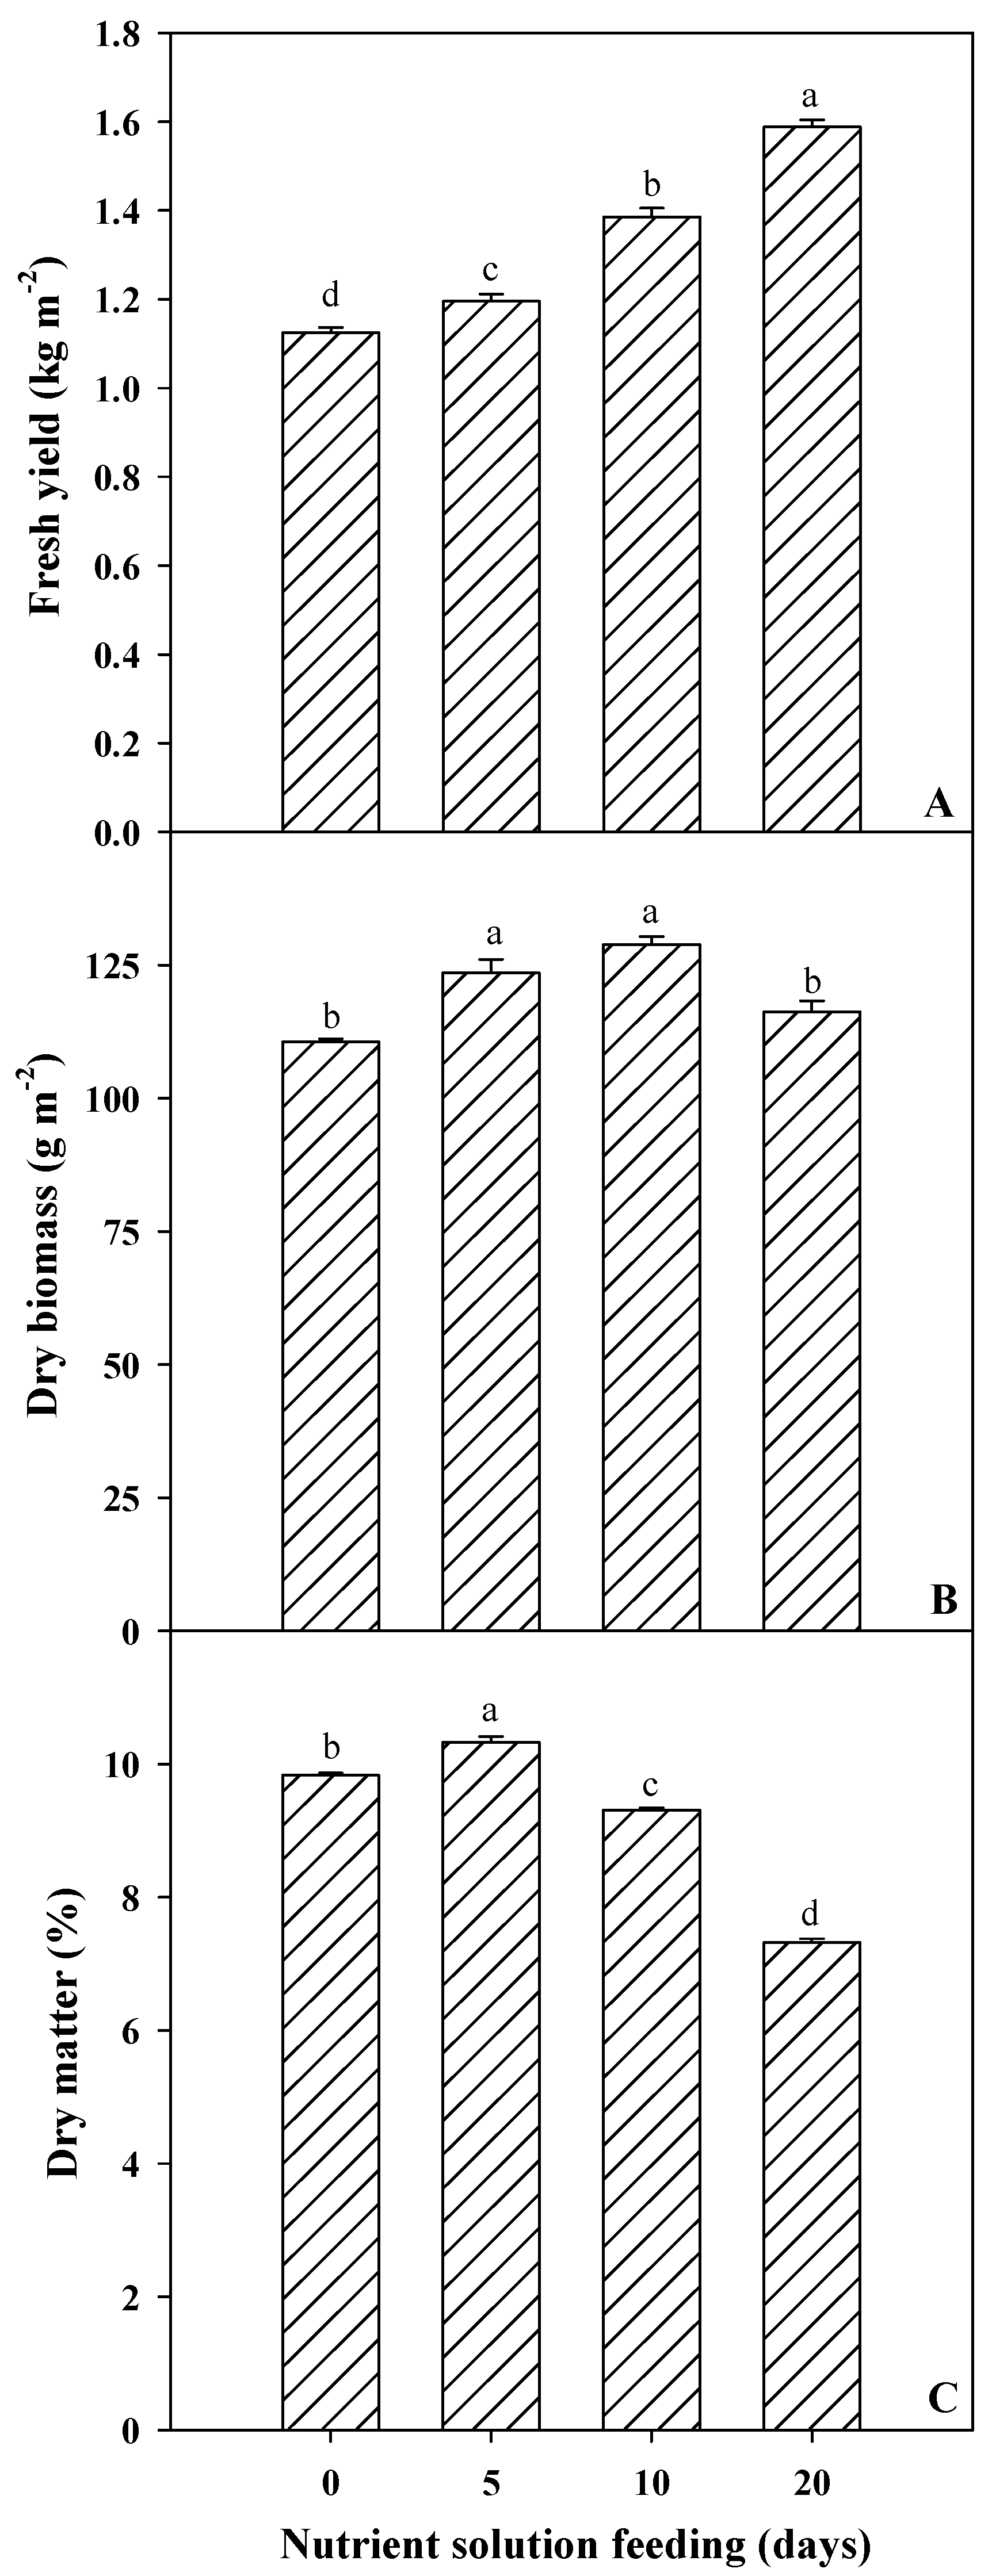
3.1. Spinach Microgreens’ Biometric and Colorimetric Parameters

Figure 1 illustrates the yield, dry biomass, and dry matter percentage of Spinacia oleracea L. var. Palco F1 microgreens, subjected to the four NS feeding regimes (0, 5, 10, and 20 days). The yield of spinach increased linearly (Supplementary Figure S1) and significantly when additional days of NS were supplemented. At 20 days of NS feeding, the yield increased by 41.97% compared to 0 days of NS feeding, and registered 1.59 kg m−2. Interestingly, our results demonstrated that 10 days of NS feeding caused a marginal decrease in fresh biomass of spinach microgreens (12.5%) compared to 20 days of NS feeding. As for dry biomass (g m−2), 5 and 10 days of NS feeding presented the highest values (123.5 and 128.9 g m−2, respectively) compared to the other two treatments (Figure 1B). Finally, the highest dry matter percentage was registered with 5 days of NS feeding (10.33%; Figure 1C). The relationship resulting from the regression analysis of the dry biomass and dry matter percentages is best described by a quadratic function (Supplementary Figure S1). These findings are of great importance, since plants that received the highest number of feeding days (20 days) not only showed a higher yield, but also were harvested 5 days earlier than the plants with 0 and 5 days of NS feeding. The low dry matter content for the 20-day NS treatment also indicates that the highest yield is attributed to high moisture content in plant tissues, probably due to better functioning of the roots. Similar results were reported by El-Nakhel et al. [17], who studied the effects of macronutrient deprivation on lettuce plants, and suggested that lower availability of nutrients resulted in reduced fresh weight, while it increased dry matter content. Fallovo et al. [34] also reported the importance of nutrient solution concentration to fresh yield in lettuce plants grown in a floating system, while Murphy and Pill [35] and Wieth et al. [36] suggested similar findings in the case of arugula and red cabbage microgreens, respectively. Moreover, the higher DM% in plants with 0, 5, and 10 days of NS feeding compared to 20-day NS is in line with other studies on lettuce [37], rocket, and Brussels sprout microgreens [33], when NS was completely replaced with water thorughout the whole growing cycle. Based on these reports, the findings of our study could be attributed to the osmotic stress and nutrient deficiency that plants experienced when nutrient solution feeding was applied for less than 20 days. This is also corroborated by the earlier harvesting of plants that received prolonged NS feeding for 10 and 20 days compared to the rest of the treatments (0 and 5 days of feeding), which indicates that plant growth was held back under the latter conditions. In contrast, Chen et al. [38] did not find any decrease in lettuce plants’ fresh weight when N, P, and K concentration in nutrient solution was reduced to 10% of the control treatment, while Murphy and Pill [35] also did not observe a significant decrease in the fresh weight of cabbage and Brussels sprouts when they were deprived of nitrogen. Therefore, it seems that plants’ responses to nutrient deprivation may have genotypic implications, and different species or cultivars may respond differently to such conditions.
The three coordinates of CIELAB are presented in Table 1. The perceptual lightness (L*) presented the lowest value in the 10-day NS feeding treatment—8.06% lower than the other treatments. The 20-day NS feeding treatment exhibited a significantly darker green than then other treatments (+15.98%), as marked by the measured a* parameter, in addition to having a significantly higher hue angle. Concomitantly, the same treatment manifested a significant lower yellow color compared to the other treatments, as supported by a lower b* value. On the other hand, the 0- and 5-day NS feeding treatments generated spinach microgreens with lighter green canopies, as demonstrated by the lower a* and higher b* values presented in Table 1, as well as showing higher saturation of their color as indicated by significantly higher chroma values. These differences in color parameters between the various NS feeding treatments indicate that plants that received prolonged feeding presented a darker green color than the rest of the treatments, meaning better visual quality and less chlorosis. This finding could be further justified by the very low nitrate concentrations (see description in the following sections) in the control treatment and the 5-day NS feeding treatment, which also recorded the highest b* and chroma values and the lowest values for hue angle. According to the literature, low nutrient availability—and particularly that of nitrogen—is associated with low chlorophyll content in leaves and more yellowish leaves [34,39]. Similarly to our study, El-Nakhel et al. [33] reported that nutrient availability may affect the color of microgreens’ leaves and, thus, improve the visual quality of the final product.

3.2. Spinach Microgreens’ Nitrate and Macromineral Concentrations

As illustrated in Table 2, the nitrate concentration of spinach microgreens proved to be directly correlated with NS feeding days, as it increased exponentially from 10 to 20 days of NS feeding (Supplementary Figure S1), reaching 1698 mg kg−1 fw at the highest feeding treatment, whereas this concentration was about 498 mg kg−1 fw in the 10-day NS feeding treatment (−70.67%). In addition, it was 85.87% and 90.64% less when NS feeding lasted 5 days or when it was completely replaced by osmotic water, respectively. Quadratic equations were fitted to quantify the effects of NS feeding days on P and K concentrations in spinach microgreens (Supplementary Figure S1). When irrigated constantly for 20 days with a quarter-strength NS, spinach microgreens accumulated the lowest values of phosphorus, potassium, calcium, and magnesium concentrations when expressed on a fresh weight basis and compared to the other NS feeding treatments (Table 2). These latter macroelements accumulated significantly when the NS feeding days were reduced. Indeed, the P concentration of microgreens was higher in the other three NS treatments (0, 5, and 10 days), while K and Mg accumulated the most in the 5-day NS feeding treatment, and Ca accumulated the most when microgreens were only irrigated with osmotic water. Overall, K was the most abundant macroelement detected in spinach microgreens, followed by Mg, P, and Ca. The highest concentrations of P, K, and Mg, and the second highest concentration of Ca, for 5-day NS feeding could be partly attributed to this treatment having the highest dry matter content (see Figure 1), which is also justified by the fact that the 20-day NS treatment—which had the lowest dry matter content—also recorded the lowest values for mineral concentrations. Therefore, the dilution effect should be partially responsible for this trend.
The observed highest concentration of nitrates for prolonged NS feeding is in agreement with other reports, where another explanation for the increase in nitrate concentration under prolonged NS feeding could be that nitrogen is preferably used by plants as an osmoticum [40]; therefore, considering that prolonged feeding may increase osmotic levels in growth media, plants counteract by accumulating nitrates in order to increase turgor pressure and maintain nutrient uptake. In any case, the recorded values of nitrate concentration are within the safety limits established by the European Commission Regulation (EU) No 1258/2011, although high concentrations of nitrates in food products should be avoided considering the contribution they may have to overall nitrate intakes on a daily basis [7].
The lowest concentration of minerals found in the 20-day NS treatment should be associated with the highest fresh yield observed in the same treatment, which indicates that apart from the dilution effect discussed above, plants treated with prolonged NS feeding used the absorbed minerals more efficiently for biosynthetic purposes. The same trends were observed in the study of El-Nakhel et al. [33], who also reported lower mineral concentrations in plants fed with nutrient solution compared to untreated plants—without statistically significant differences being observed, however. Similarly, El-Nakhel et al. [17] suggested that plants grown in nutrient solution with higher concentrations of minerals had lower concentrations of Ca and Mg compared to plants grown in quarter-strength nutrient solution, whereas the opposite trends were observed with regard to P concentration. Finally, apart from the dilution effect mentioned above, the high concentration of Ca in the 0-day NS treatment plants could be partially associated with the presence of stress conditions, since Ca is involved in the signaling pathways of plants’ responses to stress [41]. Therefore, despite the highest yield being observed for prolonged NS feeding (20 days), the 10-day NS feeding treatment was also promising in terms of fresh yield and nitrate and mineral concentrations, which are important parameters for the nutritional value of the final product.

3.3. Spinach Microgreens’ Pigments, Total Ascorbic Acid, and ABTS Antioxidant Activity

Table 3 reflected the investigation of pigments (total chlorophylls and carotenoids), ABTS antioxidant activity, and the total ascorbic acid content of spinach microgreens subjected to the tested NS feeding treatments. Total chlorophylls increased starting at 10 NS feeding days, and reached their maximum at 20 NS feeding days; total chlorophylls proved to be correlated (0.73) with the a* parameter listed previously in Table 1, and inversely correlated (−0.96) with b*. This finding also confirms the deeper green color and better visual quality of leaves for these treatments compared to 0 and 5 NS feeding days; however, it is interesting to highlight the fact that total chlorophyll content was lower in the 0- and 5-day NS feeding treatments, despite the higher concentration of Mg in plant tissues, which helps in the light harnessing process as a basic ingredient in chlorophyll molecules [42]. This contradiction could be attributed to the fact that chlorophyll-bound Mg concentration depends on the species, and in specific species such as spinach and lettuce a significant amount of Mg is bound to chlorophylls [43]. Therefore, the high free Mg concentration detected in plants with 0 and 5 NS feeding days could be partly related to the chlorophyll content for the same treatments being the lowest. Another explanation could be associated with less nutrient availability in the 0 and 5 NS feeding day treatments, which results in reduced chlorophyll biosynthesis [34]. Moreover, the highest total chlorophyll contents in the 10- and 20-day NS treatments are associated with the highest fresh yields recorded for these treatments, since chlorophyll is the main photosynthetic pigment that allows plants to harvest energy from soil and transform it into biosynthetic products [44].
Moreover, lutein and β-carotene exhibited the same trend as total chlorophylls, registering the highest values in plants with 20 NS feeding days, at 54.2 and 44 μg g−1 fw, respectively. These latter were positively correlated with ABTS antioxidant activity (0.87 and 0.9, respectively), which also increased when the NS feeding days increased, and proved by a significant margin to be the highest in spinach microgreens under 20-day NS feeding treatment (994.8 mmol Trolox eq. 100−1 fw). According to the literature, nutritional stress may result in decreased carotenoid contents, as suggested in the studies of El-Nakhel et al. [17], who subjected hydroponically grown lettuce plants under nutrient deprivation, and of Pannico et al. [37], who applied nutrient stress to lettuce microgreens. The increased contents of carotenoids in 10- and 20-day NS feeding treatments are in line with the increased fresh yields observed in the same treatments, since, along with chlorophylls, carotenoids are also very important pigments for the light-harvesting photosystem II and the light-harvesting antenna complexes of plants [45,46]. Regarding the high antioxidant activity recorded in the 10- and 20-day NS feeding treatments, this finding could be attributed to the high content of antioxidant compounds detected in these treatments, such as chlorophylls and carotenoids, as already described (Table 3), as well as phenolic compounds (described in the following section). The correlation between antioxidant compound content and antioxidant activity in the plant tissues of leafy vegetables is well established, and has been confirmed in numerous literature reports [47,48]. In contrast, total ascorbic acid accumulated more in microgreens under 10-day NS feeding treatment, being 6.97% higher than the closest 20-day NS feeding treatment. Particularly, regression analysis indicated a quadratic relationship between NS feeding days and total ascorbic acid (Supplementary Figure S1). Total ascorbic acid ranged from 130.5 to 167.3 mg 100 g−1 fw, and reached its maximum at 10 NS, then started to decrease with NS feeding days (Table 3; Supplementary Figure S1). From this finding, it could be assumed that although ascorbic acid is considered to be one of the major antioxidant compounds, several other compounds may also contribute to the overall antioxidant mechanism of plants, as already observed in our study and in other literature reports [49,50].

3.4. Spinach Microgreens’ Polyphenol Profiles and Total Polyphenols

The phenolic compound profiles of spinach microgreens in relation to NS feeding days are presented in Table 4. Sixteen individual compounds were detected in all of the tested samples, including fourteen flavonoids and two phenolic acids. The most abundant compounds were patuletin derivative (peak 16) and 5,3′,4′-trihydroxy-3 methoxy-6,7-methylendioxyflavone 4′ glucuronide (peak 15), followed by quercetin-3-sophoroside-7-glucoside, kaempferol-3-sinapoylsophoroside-7-glucoside, and spinacetin derivative (peaks 2, 4, and 14, respectively). The two major compounds have been previously reported by Berquist et al. [9], who also identified various patuletin derivatives and 5,3′,4′-trihydroxy-3 methoxy-6,7-methylendioxyflavone 4′ glucuronide.
All of the studied polyphenols in this study showed a varied content when subjected to diverse NS feeding treatments, except for kaempferol-3-sinapoylsophoroside-7-glucoside and spinacetin derivative (peaks 4 and 14) which were not significantly affected by NS feeding days (Table 4). Moreover, total polyphenols increased gradually when more NS was administered to spinach microgreens—the 20-day NS feeding treatment resulted in the highest accumulation of total polyphenols (8021 μg 100 g−1 fw), without being significantly different from 10-day NS feeding (7528 μg 100 g−1 fw). In contrast, when irrigated with only osmotic water throughout the growing cycle (0 NS feeding days), spinach microgreens accumulated the least polyphenols (6323 μg 100 g−1 fw), and around 11.91% less than the closest treatment (5 NS feeding days). Spinach microgreens irrigated with NS throughout the growing cycle (20 NS feeding days) accumulated significantly more quercetin-3-sophoroside-7-glucoside, kaempferol-3-p-coumaroyl-sophoroside-7glucoside, and patuletin derivative. Moreover, kaempferol-3-diglucoside content was the highest in the 20-day NS treatment, without being significantly different from the 5-day NS treatment, while rutin content was the highest in the 10-day NS treatment, without being different from the 20-day NS treatment. In contrast, spinach microgreens subjected to the 10-day NS feeding treatment accumulated the highest content of 5,3′,4′-trihydroxy-3 methoxy-6,7-methylendioxyflavone 4′ glucuronide, caffeoylquinic acid, and isorhamnetin-3-gentiobioside, and when completely deprived of NS they accumulated the highest amounts of kaempferol-3-hydroxyferuloylsophorotrioside-7-glucoside, kaempferol-3-sinapoylsophorotrioside-7-glucoside, and quercetin-3-sinapoyltriglucoside. Coumaroyl-diglucoside content was the highest in the 5-day NS treatment. In contrast to our study, El-Nakhel et al. [17] suggested that nutrient deprivation may increase the content of phenolic compounds in hydroponically grown lettuce, while El-Nakhel [33] reported an increase in total phenolic compounds in rocket microgreens that received nutrient solution compared to untreated ones. Moreover, the same authors observed a varied effect of nutrient solution supplementation on individual phenolic compounds—a finding that is consistent with our study. The contradictory results in the literature reports indicate that plants’ response to nutrient stress varies according to the species and the severity of the stress. Therefore, although nutrient deprivation is expected to increase the content of phenolic compounds as part of plants’ defense mechanisms against nutrient stress [17,46], this was not the case in our study—probably due to the genotype-dependent response to nutrient stress suggested in the literature [51].

4. Conclusions

Microgreens are a novel category of crop products of increasing interest to consumers and the marketing sector. The ease of facilitating cropping—even in domestic conditions—and the shortness of their growth cycle are very promising features that may contribute to addressing food security and malnutrition. Moreover, the supplementation of macro- and micronutrients through fertigation allows the manipulation of their chemical composition and production of tailor-made products with improved bioactive and functional properties. In this context, the application of nutritional eustress via the regulation of nutrient solution feeding might be a cost-effective cultivation practice to further improve the nutritional value of microgreens. Our results demonstrated that mild nutritional stress through the supplementation of nutrient solution for 10 consecutive days resulted in a slight decrease in fresh yield, without compromising quality features such as mineral and bioactive compound contents, whereas it increased total ascorbic acid content and reduced nitrates by 70.67%, and still generated the same growth cycle and days until harvest as the 20-day NS ftreatment. Therefore, with the aim being the production of not only more but also better products, the application of mild nutritional stress is a cost-effective and sustainable practice for microgreen cultivation. However, considering the species-dependent response to nutritional stress, further studies with varied species are needed in order to establish cultivation protocols and best practices guides accordingly.

Supplementary Materials

The following are available online at https://www.mdpi.com/article/10.3390/horticulturae7070162/s1: Figure S1: Relationships between the fresh yield (A), dry yield (B), dry matter percentage (C), nitrate concentrations (D), P and K concentrations (E and F), and total ascorbic acid content (TAA) (G) in relation to nutrient solution feeding days.

Author Contributions

Conceptualization, S.A.P. and C.E.-N.; methodology, C.E.-N.; software, C.E.-N.; validation, C.E.-N. and G.G.; formal analysis, C.E.-N.; investigation, C.E.-N. and G.G.; resources, S.A.P. and Y.R.; data curation, C.E.-N. and G.G.; writing—original draft preparation, S.A.P. and C.E.-N.; writing—review and editing, S.A.P., M.C.K., and Y.R.; supervision, S.A.P. and Y.R.; project administration, S.A.P.; funding acquisition, S.A.P. All authors have read and agreed to the published version of the manuscript.

Funding

This research received no external funding.

Data Availability Statement

The study did not report any data.

Acknowledgments

The authors would like to thank Francesco Cristofano, Luigi Formisano, Luigi G. Duri, and Michele Ciriello from OrtoLab UNINA for their technical assistance during the experiment, Antonio Pannico for data analysis, and Maria Giordano for laboratory analysis.

Conflicts of Interest

The authors declare no conflict of interest.

References

  1. Kyriacou, M.C.; Rouphael, Y.; Di Gioia, F.; Kyratzis, A.; Serio, F.; Renna, M.; De Pascale, S.; Santamaria, P. Micro-scale vegetable production and the rise of microgreens. Trends Food Sci. Technol. 2016, 57, 103–115. [Google Scholar] [CrossRef]
  2. Palmitessa, O.D.; Renna, M.; Crupi, P.; Lovece, A.; Corbo, F.; Santamaria, P. Yield and Quality Characteristics of Brassica Microgreens as A ff ected by the NH4:NO3 Molar Ratio and Strength of the Nutrient Solution. Foods 2020, 9, 677. [Google Scholar] [CrossRef]
  3. Mir, S.A.; Shah, M.A.; Mir, M.M. Microgreens: Production, shelf life, and bioactive components. Crit. Rev. Food Sci. Nutr. 2017, 57, 2730–2736. [Google Scholar] [CrossRef]
  4. Di Gioia, F.; Renna, M.; Santamaria, P. Sprouts, Microgreens and “Baby Leaf” Vegetables. In Minimally Processed Refrigerated Fruits and Vegetableså; Yildiz, F., Wiley, R.C., Eds.; Springer: Boston, MA, USA, 2017; pp. 403–432. ISBN 978-1-4939-7016-2. [Google Scholar]
  5. Choe, U.; Yu, L.L.; Wang, T.T.Y. The Science behind Microgreens as an Exciting New Food for the 21st Century. J. Agric. Food Chem. 2018, 66, 11519–11530. [Google Scholar] [CrossRef]
  6. Di Gioia, F.; Petropoulos, S.A.; Ozores-Hampton, M.; Morgan, K.; Rosskopf, E.N. Zinc and iron agronomic biofortification of Brassicaceae microgreens. Agronomy 2019, 9, 677. [Google Scholar] [CrossRef] [Green Version]
  7. Rouphael, Y.; Kyriacou, M.C.; Petropoulos, S.A.; De Pascale, S.; Colla, G. Improving vegetable quality in controlled environments. Sci. Hortic. 2018, 234, 275–289. [Google Scholar] [CrossRef]
  8. Giordano, M.; El-Nakhel, C.; Pannico, A.; Kyriacou, M.C.; Stazi, S.R.; De Pascale, S.; Rouphael, Y. Iron biofortification of red and green pigmented lettuce in closed soilless cultivation impacts crop performance and modulates mineral and bioactive composition. Agronomy 2019, 9, 290. [Google Scholar] [CrossRef] [Green Version]
  9. Bergquist, S.Å.; Gertsson, U.E.; Knuthsen, P.; Olsson, M.E. Flavonoids in baby spinach (Spinacia oleracea L.): Changes during plant growth and storage. J. Agric. Food Chem. 2005, 53, 9459–9464. [Google Scholar] [CrossRef] [PubMed]
  10. Xiao, Z.; Lester, G.E.; Park, E.; Saftner, R.A.; Luo, Y.; Wang, Q. Evaluation and correlation of sensory attributes and chemical compositions of emerging fresh produce: Microgreens. Postharvest Biol. Technol. 2015, 110, 140–148. [Google Scholar] [CrossRef]
  11. Renna, M.; Paradiso, V.M. Ongoing research on microgreens: Nutritional properties, shelf-life, sustainable production, innovative growing and processing approaches. Foods 2020, 9, 862. [Google Scholar] [CrossRef]
  12. Ghoora, M.; Srividya, N. Effect of Packaging and Coating Technique on Postharvest Quality and Shelf Life of Raphanus sativus L. and Hibiscus sabdariffa L. Microgreens. Foods 2020, 9, 653. [Google Scholar] [CrossRef] [PubMed]
  13. Sharma, A.; Rasane, P.; Dey, A.; Singh, J.; Kaur, S.; Dhawan, K.; Kumar, A.; Joshi, H.S. Optimization of a Process for a Microgreen and Fruit Based Ready to Serve Beverage. Int. J. Food Stud. 2021, 10, SI41–SI56. [Google Scholar] [CrossRef]
  14. Schlering, C.; Zinkernagel, J.; Dietrich, H.; Frisch, M.; Schweiggert, R. Alterations in the chemical composition of spinach (Spinacia oleracea L.) as provoked by season and moderately limited water supply in open field cultivation. Horticulturae 2020, 6, 25. [Google Scholar] [CrossRef] [Green Version]
  15. Kyriacou, M.C.; El-Nakhel, C.; Pannico, A.; Graziani, G.; Soteriou, G.A.; Giordano, M.; Zarrelli, A.; Ritieni, A.; De Pascale, S.; Rouphael, Y. Genotype-Specific Modulatory Effects of Select Spectral Bandwidths on the Nutritive and Phytochemical Composition of Microgreens. Front. Plant Sci. 2019, 10, 1501. [Google Scholar] [CrossRef]
  16. Tomasi, N.; Pinton, R.; Dalla Costa, L.; Cortella, G.; Terzano, R.; Mimmo, T.; Scampicchio, M.; Cesco, S. New “solutions” for floating cultivation system of ready-to-eat salad: A review. Trends Food Sci. Technol. 2014, 46, 267–276. [Google Scholar] [CrossRef]
  17. El-Nakhel, C.; Pannico, A.; Kyriacou, M.C.; Giordano, M.; De Pascale, S.; Rouphael, Y. Macronutrient deprivation eustress elicits differential secondary metabolites in red and green-pigmented butterhead lettuce grown in a closed soilless system. J. Sci. Food Agric. 2019, 99, 6962–6972. [Google Scholar] [CrossRef]
  18. Courbet, G.; D’Oria, A.; Lornac, A.; Diquélou, S.; Pluchon, S.; Arkoun, M.; Koprivova, A.; Kopriva, S.; Etienne, P.; Ourry, A. Specificity and Plasticity of the Functional Ionome of Brassica napus and Triticum aestivum Subjected to Macronutrient Deprivation. Front. Plant Sci. 2021, 12, 1–15. [Google Scholar] [CrossRef]
  19. Sardare, M.D.; Admane, S. A Review on Plant without Soil—Hydroponics. Int. J. Res. Eng. Technol. 2013, 2, 299–304. [Google Scholar] [CrossRef]
  20. Hajnos, M.; Hajnos, M. Buffer Capacity of Soils BT. In Encyclopedia of Agrophysics; Gliński, J., Horabik, J., Lipiec, J., Eds.; Springer: Dordrecht, The Netherlands, 2011; pp. 94–95. ISBN 978-90-481-3585-1. [Google Scholar]
  21. Yadav, L.P.; Koley, T.K.; Tripathi, A.; Singh, S. Antioxidant Potentiality and Mineral Content of Summer Season Leafy Greens: Comparison at Mature and Microgreen Stages Using Chemometric. Agric. Res. 2019, 8, 165–175. [Google Scholar] [CrossRef]
  22. Ghoora, M.D.; Babu, D.R.; Srividya, N. Nutrient composition, oxalate content and nutritional ranking of ten culinary microgreens. J. Food Compos. Anal. 2020, 91, 103495. [Google Scholar] [CrossRef]
  23. Lester, G.; Hallman, G.; Pérez, J.A. γ -Irradiation Dose: Effects on Baby-Leaf Spinach Ascorbic Acid, Carotenoids, Folate, r -Tocopherol, and Phylloquinone Concentrations. J. Agric. Food Chem. 2010, 58, 4901–4906. [Google Scholar] [CrossRef]
  24. Elia, A.; Santamaria, P.; Serio, F. Nitrogen nutrition, yield and quality of spinach. J. Sci. Food Agric. 1998, 76, 341–346. [Google Scholar] [CrossRef]
  25. Tamme, T.; Reinik, M.; Roasto, M. Chapter 21-Nitrates and Nitrites in Vegetables: Occurrence and Health Risks. In Bioactive Foods in Promoting Health Fruits and Vegetables; Watson, R.R., Preedy, V., Eds.; Academic Press: San Diego, CA, USA, 2010; pp. 307–321. ISBN 978-0-12-374628-3. [Google Scholar]
  26. Erfani, F.; Hassandokht, M.R.; Jabbari, A.; Barzegar, M. Effect of cultivar on chemical composition of some Iranian spinach. Pak. J. Biol. Sci. 2007, 10, 602–606. [Google Scholar]
  27. Bergquist, S.Å.M.; Gertsson, U.E.; Olsson, M.E. Influence of growth stage and postharvest storage on ascorbic acid and carotenoid content and visual quality of baby spinach (Spinacia oleracea L.). J. Sci. Food Agric. 2006, 86, 346–355. [Google Scholar] [CrossRef]
  28. Kyriacou, M.C.; El-Nakhel, C.; Graziani, G.; Pannico, A.; Soteriou, G.A.; Giordano, M.; Ritieni, A.; De Pascale, S.; Rouphael, Y. Functional quality in novel food sources: Genotypic variation in the nutritive and phytochemical composition of thirteen microgreens species. Food Chem. 2019, 277, 107–118. [Google Scholar] [CrossRef]
  29. Kampfenkel, K.; Montagu, M.; Inzé, D. Extraction and determination of ascorbate and dehydroascorbate from plant tissue. Anal. Biochem. 1995, 225, 165–167. [Google Scholar] [CrossRef] [PubMed]
  30. Lichtenthaler, H.K.; Buschmann, C. Chlorophylls and Carotenoids: Measurement and Characterization by UV-VIS Spectroscopy. Curr. Protoc. Food Anal. Chem. 2001, 1, F4.3.1–F4.3.8. [Google Scholar] [CrossRef]
  31. Fellegrini, N.; Ke, R.; Yang, M.; Rice-Evans, C.B.T.-M. Screening of dietary carotenoids and carotenoid-rich fruit extracts for antioxidant activities applying 2,2′-azinobis(3-ethylenebenzothiazoline-6-sulfonic acid radical cation decolorization assay. In Oxidants and Antioxidants Part A; Academic Press: Cambridge, MA, USA, 1999; Volume 299, pp. 379–389. ISBN 0076-6879. [Google Scholar]
  32. Huang, H.; Jiang, X.; Xiao, Z.; Yu, L.; Pham, Q.; Sun, J.; Chen, P.; Yokoyama, W.; Yu, L.L.; Luo, Y.S.; et al. Red Cabbage Microgreens Lower Circulating Low-Density Lipoprotein (LDL), Liver Cholesterol, and Inflammatory Cytokines in Mice Fed a High-Fat Diet. J. Agric. Food Chem. 2016, 64, 9161–9171. [Google Scholar] [CrossRef] [PubMed]
  33. El-Nakhel, C.; Pannico, A.; Graziani, G.; Kyriacou, M.C.; Gaspari, A.; Ritieni, A.; De Pascale, S.; Rouphael, Y. Nutrient Supplementation Configures the Bioactive Profile and Production Characteristics of Three Brassica L. Microgreens Species Grown in Peat-Based Media. Agronomy 2021, 11, 346. [Google Scholar] [CrossRef]
  34. Fallovo, C.; Rouphael, Y.; Rea, E.; Battistelli, A.; Colla, G. Nutrient solution concentration and growing season affect yield and quality of Lactuca sativa L. var. acephala in floating raft culture. J. Sci. Food Agric. 2009, 89, 1682–1689. [Google Scholar] [CrossRef]
  35. Murphy, C.J.; Pill, W.G. Cultural practices to speed the growth of microgreen arugula (roquette; Eruca vesicaria subsp. sativa). J. Hortic. Sci. Biotechnol. 2010, 85, 171–176. [Google Scholar] [CrossRef]
  36. Wieth, A.R.; Pinheiro, W.D.; Duarte, T.D.S. Purple cabbage microgreens grown in different substrates and nutritive solution concentrations. Rev. Caatinga 2019, 32, 976–985. [Google Scholar] [CrossRef] [Green Version]
  37. Pannico, A.; Graziani, G.; El-Nakhel, C.; Giordano, M.; Ritieni, A.; Kyriacou, M.C.; Rouphael, Y. Nutritional stress suppresses nitrate content and positively impacts ascorbic acid concentration and phenolic acids profile of lettuce microgreens. Italus Hortus 2020, 27, 41–52. [Google Scholar] [CrossRef]
  38. Chen, X.G.; Gastaldi, C.; Siddiqi, M.Y.; Glass, A.D.M. Growth of a lettuce crop at low ambient nutrient concentrations: A strategy designed to limit the potential for eutrophication. J. Plant Nutr. 1997, 20, 1403–1417. [Google Scholar] [CrossRef]
  39. Van Iersel, M. Fertilizer Concentration Affects Growth and Nutrient Composition of Subirrigated Pansies. HortScience 1999, 34, 660–663. [Google Scholar] [CrossRef] [Green Version]
  40. Blom-Zandstra, M.; Lampe, J.A.N.E.M. The Role of Nitrate in the Osmoregulation of Lettuce (Lactuca sativa L.) Grown at Different Light Intensities. J. Exp. Bot. 1985, 36, 1043–1052. [Google Scholar] [CrossRef]
  41. Ramakrishna, A.; Ravishankar, G.A. Influence of abiotic stress signals on secondary metabolites in plants. Plant Signal. Behav. 2011, 6, 1720–1731. [Google Scholar] [CrossRef]
  42. Borah, K.D.; Bhuyan, J. Magnesium porphyrins with relevance to chlorophylls. Dalt. Trans. 2017, 46, 6497–6509. [Google Scholar] [CrossRef] [PubMed]
  43. Bohn, T.; Walczyk, T.; Leisibach, S.; Hurrell, R. Chlorophyll-bound Magnesium in Commonly Consumed Vegetables and Fruits: Relevance to Magnesium Nutrition. J. Food Sci. 2004, 69, 347–350. [Google Scholar] [CrossRef]
  44. Niroula, A.; Khatri, S.; Timilsina, R.; Khadka, D. Profile of chlorophylls and carotenoids of wheat (Triticum aestivum L.) and barley (Hordeum vulgare L.) microgreens. J. Food Sci. Technol. 2019, 56, 2758–2763. [Google Scholar] [CrossRef]
  45. Pannico, A.; El-nakhel, C.; Kyriakou, M.C.; Giordano, M.; Stazi, S.R.; De Pascale, S.; Rouphael, Y. Combating Micronutrient Deficiency and Enhancing Food Functional Quality through Selenium Fortification of Select Lettuce Genotypes Grown in a Closed Soilless System. Front. Plant Sci. 2019, 10, 1495. [Google Scholar] [CrossRef] [PubMed] [Green Version]
  46. Becker, C.; Urli, B.; Juki, M.; Kläring, H. Nitrogen Limited Red and Green Leaf Lettuce Accumulate Flavonoid Glycosides, Caffeic Acid Derivatives and Sucrose while Losing. PLoS ONE 2015, 10, e0142867. [Google Scholar] [CrossRef] [PubMed]
  47. Petropoulos, S.A.; Fernandes, Â.; Dias, M.I.; Pereira, C.; Calhelha, R.; Gioia, F.D.; Tzortzakis, N.; Ivanov, M.; Sokovic, M.; Barros, L.; et al. Wild and cultivated Centaurea raphanina subsp. mixta: A valuable source of bioactive compounds. Antioxidants 2020, 9, 314. [Google Scholar] [CrossRef] [PubMed]
  48. Liberal, Â.; Fernandes, Â.; Polyzos, N.; Petropoulos, S.A.; Dias, M.I.; Pinela, J.; Petrović, J.; Soković, M.; Ferreira, I.C.F.R.; Barros, L. Bioactive Properties and Phenolic Compound Profiles of Turnip-Rooted, Plain-Leafed and Curly-Leafed Parsley Cultivars. Molecules 2020, 25, 5606. [Google Scholar] [CrossRef] [PubMed]
  49. Pereira, C.; Dias, M.I.; Petropoulos, S.A.; Plexida, S.; Chrysargyris, A.; Tzortzakis, N.; Calhelha, R.C.; Ivanov, M.; Stojković, D.; Soković, M.; et al. The effects of biostimulants, biofertilizers and water-stress on nutritional value and chemical composition of two spinach genotypes (Spinacia oleracea L.). Molecules 2019, 24, 4494. [Google Scholar] [CrossRef] [Green Version]
  50. Petropoulos, S.A.; Fernandes, Â.; Dias, M.I.; Pereira, C.; Calhelha, R.C.; Chrysargyris, A.; Tzortzakis, N.; Ivanov, M.; Sokovic, M.D.; Barros, L.; et al. Chemical composition and plant growth of Centaurea raphanina subsp. mixta plants cultivated under saline conditions. Molecules 2020, 25, 2204. [Google Scholar] [CrossRef] [PubMed]
  51. Senizza, B.; Zhang, L.; Miras-Moreno, B.; Righetti, L.; Zengin, G.; Ak, G.; Bruni, R.; Lucini, L.; Sifola, M.I.; El-Nakhel, C.; et al. The strength of the nutrient solution modulates the functional profile of hydroponically grown lettuce in a genotype-dependent manner. Foods 2020, 9, 1156. [Google Scholar] [CrossRef]
Figure 1. The effect of nutrient solution feeding (number of days) on plant growth parameters (fresh yield (A), dry biomass (B), and dry matter content (C)). Different letters within the above bars indicate significant differences according to Duncan’s multiple range test (p = 0.05).
Horticulturae 07 00162 g001
Table 1. CIELAB color space parameters, chroma, and hue angles of spinach microgreens in relation to nutrient solution feeding regime.
Nutrient Solution Feeding
(Days)
L *a *b *ChromaHue Angle
038.52 ± 0.35 a−7.61 ± 0.42 a31.21 ± 0.32 a16.05 ± 0.16 a103.7 ± 0.61 c
538.04 ± 0.71 a−7.51 ± 0.04 a30.60 ± 0.22 a15.81 ± 0.09 a103.8 ± 0.08 c
1035.31 ± 0.61 b−7.42 ± 0.35 a25.67 ± 0.57 b13.87 ± 0.22 b106.2 ± 0.96 b
2038.66 ± 0.95 a−8.71 ± 0.02 b22.41 ± 0.75 c12.73 ± 0.29 c111.3 ± 0.71 a
***********
* and ***: Significant at p ≤ 0.05 and 0.001, respectively. Different letters within each column indicate significant differences according to Duncan’s multiple range test p = 0.05). All data are expressed as mean ± standard error, n = 3.
Table 2. Nitrate and mineral concentrations (mg kg−1 fw) in relation to nutrient solution feeding regime.
Nutrient Solution Feeding
(Days)
NO3PKCaMg
(mg kg−1 fw)(mg kg−1 fw)(mg kg−1 fw)(mg kg−1 fw)(mg kg−1 fw)
0159 ± 14 c789 ± 19 a8225 ± 72 c147 ± 12 a1038 ± 18 b
5240 ± 8.3 c775 ± 12 a8897 ± 84 a115 ± 8.4 b1110 ± 2.8 a
10498 ± 43 b817 ± 15 a8568 ± 86 b95.6 ± 1.5 b893 ± 28 c
201698 ± 24 a694 ± 7.6 b6115 ± 89 d53.5 ± 3.9 c618 ± 18 d
***************
*** significant at p ≤ 0.001. Different letters within each column indicate significant differences according to Duncan’s multiple range test (p = 0.05). All data are expressed as mean ± standard error, n = 3.
Table 3. Antioxidant activity, pigments, and total ascorbic acid content in relation to nutrient solution feeding regime (means ± SD).
Nutrient Solution Feeding
(Days)
ABTSTotal ChlorophyllsLuteinβ-CaroteneTotal Ascorbic Acid
mol Trolox eq. 100g−1 fwmg 100g−1 fwµg g−1 fwµg g−1 fwmg 100g−1 fw
0663.7 ± 22.2 b43.0 ± 1.19 c33.9 ± 0.59 c19.3 ± 0.86 c130.5 ± 1.61 d
5725.8 ± 26.2 b41.3 ± 0.87 c37.4 ± 0.46 c21.4 ± 0.87 c145.1 ± 2.47 c
10751.6 ± 15.9 b56.9 ± 2.07 b48.8 ± 1.04 b27.2 ± 2.34 b167.3 ± 5.03 a
20994.8 ± 36.2 a82.8 ± 5.36 a54.2 ± 2.33 a44.0 ± 0.96 a156.4 ± 3.04 b
***************
*** Significant at p ≤ 0.001. Different letters within each column indicate significant differences according to Duncan’s multiple range test (p = 0.05).
Table 4. Polyphenol composition (µg 100 g−1 fw) in relation to nutrient solution feeding regime (means ± SD).
Nutrient Solution Feeding (Days)Sig.
Peak NoPhenolic Compounds051020
1Km 3-hydroxyferuloylsophorotrioside-7-glucoside46.36 ± 3.41 a35.65 ± 1.12 b34.98 ± 1.58 b28.20 ± 0.57 c***
2Qn 3-sophoroside-7-glucoside539.8 ± 27.0 c529.5 ± 42.1 c690.1 ± 15.5 b861.9 ± 35.4 a***
3Kaempferol-3-diglucoside1.34 ± 0.13 c2.50 ± 0.04 ab2.40 ± 0.17 b2.91 ± 0.18 a***
4Km 3-sinapoylsophoroside-7-glucoside464.8 ± 16.1464.8 ± 9.51489.7 ± 29.7556.8 ± 30.8ns
5Km 3-sinapoylsophorotrioside-7-glucoside36.99 ± 0.15 a31.25 ± 2.78 b29.00 ± 0.92 b19.78 ± 1.11 c***
6Qn 3-sinapoyltriglucoside113.7 ± 5.95 a101.0 ± 2.34 b87.68 ± 1.72 c90.85 ± 1.81 bc**
7Synapoyl-hexose86.54 ± 2.88 ab90.78 ± 0.74 a81.98 ± 3.35 b34.63 ± 1.38 c***
8Caffeoylquinic acid9.81 ± 0.33 c14.08 ± 0.46 b33.05 ± 1.18 a5.37 ± 0.21 d***
9Rutin1.35 ± 0.08 c1.94 ± 0.15 bc3.13 ± 0.58 a2.86 ± 0.30 ab*
10Coumaroyl-diglucoside9.71 ± 0.22 b11.87 ± 1.01 a6.73 ± 0.55 c4.35 ± 0.17 d***
11Ferulic acid141.9 ± 5.28 b189.3 ± 7.81 a182.0 ± 3.99 a154.1 ± 8.40 b**
12Km 3-p-coumaroylsophoroside-7-glucoside1.90 ± 0.06 b1.30 ± 0.03 c2.17 ± 0.10 b2.95 ± 0.16 a***
13Isorhamnetin-3-gentiobioside5.56 ± 0.20 c14.31 ± 0.40 b25.13 ± 1.06 a13.93 ± 1.01 b***
14Spinacetin derivative368.6 ± 5.66369.9 ± 15.6410.5 ± 34.5436.2 ± 23.3ns
155,3′,4′-trihydroxy-3 methoxy-6,7-methylendioxyflavone 4′ glucuronide2015 ± 77.9 b2314 ± 43.8 a2335 ± 44.6 a1933 ± 32.2 b***
16Patuletin derivative2479 ± 221 c3005 ± 232 bc3114 ± 136 b3874 ± 102 a**
Total phenols6323 ± 321 c7178 ± 247 b7528 ± 78.2 ab8021 ± 146 a**
ns,*,**, ***: Non-significant or significant at p ≤ 0.05, 0.01, and 0.001, respectively. Km: kaempferol; Qn: quercetin. Different letters within each row indicate significant differences according to Duncan’s multiple range test (p = 0.05). All data are expressed as mean ± standard error, n = 3.
Publisher’s Note: MDPI stays neutral with regard to jurisdictional claims in published maps and institutional affiliations.

