Article

Impact of Salinity on the Growth and Chemical Composition of Two Underutilized Wild Edible Greens: Taraxacum officinale and Reichardia picroides

by
Alexios A. Alexopoulos
1,
Anna Assimakopoulou
2,*,
Panagiotis Panagopoulos
1,
Maria Bakea
2,
Nikolina Vidalis
3,
Ioannis C. Karapanos
3 and
Spyridon A. Petropoulos
4,*
1
Laboratory of Agronomy, Department of Agriculture, University of the Peloponnese, Antikalamos, 241 00 Kalamata, Greece
2
Laboratory of Plant Physiology, Department of Agriculture, University of the Peloponnese, Antikalamos, 241 00 Kalamata, Greece
3
Laboratory of Vegetable Production, Department of Crop Science, Agricultural University of Athens, Iera Odos 75, 118 55 Athens, Greece
4
Laboratory of Vegetable Production, Department of Agriculture, Crop Production and Rural Environment, University of Thessaly, Fytokou Street, 384 46 Volos, Greece
*
Authors to whom correspondence should be addressed.
Horticulturae 2021, 7(7), 160; https://doi.org/10.3390/horticulturae7070160
Submission received: 5 June 2021 / Revised: 18 June 2021 / Accepted: 19 June 2021 / Published: 22 June 2021

Abstract

:
Soil salinization is one of the major environmental factors responsible for limited crop production throughout the world. Therefore, there is urgent need to find tolerant/resistant species to exploit in commercial cultivation systems. In this context, the valorization of wild edible greens for human consumption and/or medicinal purposes is gaining more and more interest. The aim of the present work was to study the effect of salinity, e.g., electrical conductivity: 2 mS cm−1 (nutrient solution EC), 6 mS cm−1 and 10 mS cm−1 on plant growth and chemical composition of Reichardia picroides and Taraxacum officinale plants grown in a floating hydroponic system. The results showed that R. picroides is a moderately salt-tolerant species, as the majority of plant growth parameters determined were not negatively affected under the treatment of 6 mS cm−1. On the other hand, the growth parameters of T. officinale plants were severely affected under the same conditions. Moreover, high salinity levels (EC at 10 mS cm−1) impaired the growth of both species. The content of leaves in chlorophylls (a, b and total), carotenoids+xanthophylls and total soluble solids was not significantly affected by the tested EC levels in both species, whereas the titratable acidity increased under the treatment of 10 mS cm−1. Moreover, R. picroides exhibited a more effective adaptation mechanism against saline conditions than T. officinale, as evidenced by the higher accumulation of osmolytes such as proline and the higher shoot K content, probably through a more efficient K/Na selectivity. In conclusion, both species were severely affected by high salinity; however, R. picroides showed promising results regarding its commercial cultivation under moderate salinity levels, especially in regions where resources of high-quality irrigation water are limited.

1. Introduction

Soil salinization is one of the most important environmental stressors around the globe with significant implications on crop productivity, especially in arid and semi-arid regions such as the broad Mediterranean area [1]. Among the various crops, vegetables are considered susceptible to environmental extremities which become more and more frequent due to the ongoing climate change [2,3,4]. The cultivation of conventional crops under these new limiting conditions is becoming difficult and less profitable for farmers due to yield losses and the increased production cost [5]. Therefore, urgent measures are needed to ensure food security, especially when considering the rapidly increasing global population and the growing demands for quality foods [6]. For this purpose, several means have been suggested during the last years including the use of cost-effective practices such as the application of biostimulants, the grafting of vegetables to tolerant rootstocks and the cropping of alternative and tolerant species, among others [7,8,9,10,11,12].
According to FAO, a significant part of world food production is obtained from only nine crops, which entails increased risk of genetic erosion due to agrobiodiversity degradation [13]. In this context, wild edible greens are a promising solution toward the sustainable increase in agrobiodiversity since they are tolerant to arduous conditions and can easily adapt to climate changes [14,15]. Most of these species are an integral part of local cuisines and are traditionally used for culinary and medicinal purposes [16,17,18]. Recently, the commercial cultivation of such species has gained interest both by farmers and consumers, and several studies have reported the potential of using wild edible species in sustainable cropping systems for the production of high value-added products due to increased health beneficial effects [19,20,21,22]. Considering that these species are usually collected in the wild or confronted as weeds within the fields, there is a lack of information regarding the best practice guides that should be applied to ensure high yields without compromising the quality and food safety of the final products. Therefore, several reports have suggested cultivation practices related to harvesting stage, growing period, the fertilization regimes or cropping under stress conditions and soilless cultivation systems [23,24,25,26,27,28,29,30,31].
Taraxacum officinale and Reichardia picroides are two unexploited species of the Asteraceae family with limited information regarding their requirements in agronomic practices. According to González et al. [32], who carried out an ethnobotanical survey in the Iberian peninsula, it was suggested that a cultural importance index based on the frequency and versatility of uses and T. officinale scored very low values. However, it is not uncommon for wild edible greens to have local interest, and their importance may vary from region to region. Recently, our team reported the soilless cultivation of both species in nutrient solution with different pH values (e.g., 4.0, 5.5 and 7.0), and the results showed that not only can these species be cultivated under unfavorable conditions, but they also can improve their bioactive properties through the increased phytochemicals content [33]. Moreover, in the earlier study of Petropoulos et al. [28], both T. officinale and R. picroides recorded a high content in phenolic compounds and tocopherols, which were significantly affected by the growing period.
The response of horticultural crops to abiotic stressors is complex and includes changes in plant physiology and morphology through the induction of secondary metabolites biosynthesis, the expression of stress-related genes and the hormonal regulation of plants [34]. The mechanisms of salt tolerance in plants have received the attention of researchers for many years focusing on the effects of soil water potential and water availability decrease on plant physiology, as well as on ion-specific impacts that limit plant growth under saline conditions, especially those caused by NaCl [35,36,37]. In particular, salinity may affect nutritional balance in plant tissues, since significant antagonism may be observed in the absorption and transfer of nutrients [36]. Moreover, saline conditions may variably change the pH and redox potential in nutrient solution, depending on the severity of salinity and the plant species, thus resulting in reduction of micronutrients solubility [38]. Nitrogen absorption is negatively affected under saline conditions due to the interaction and the antagonistic effects observed in Cl- and NO3- and/or Na+ and NH4+ [36]. However, the various plants may differ in their response to saline conditions and several species may exhibit significant tolerance under elevated salinity without significant yield reductions [39]. In addition, given that soil infertility is often associated with the presence of large amounts of salts, the identification of tolerant genotypes is considered to be a promising approach toward food security through saline agriculture [40,41].
Regarding salinity effects, sodium chloride affects the transport of ions across plasmalemma of root cells through rupturing of the cellular membranes [42], and salt tolerance in crops is based on specific physiological characteristics such as shoot- or leaf-specific ion accumulation or the production of specific osmolytes [43]. Furthermore, in order to adapt to salt stress, plants have developed various hormonal-based strategies that help to regulate plant growth through mediation of salinity stress signals [44]. Other adaptation mechanisms include the biosynthesis of bioactive compounds (e.g., phenolic compounds) and osmoprotectants such as glutames and γ-aminobutyric acid [11]. Several studies have confirmed the tolerance of wild edible greens under environmental constraints, and species such as Reichardia picroides, Cichorium spinosum, Sonchus oleraceus and Urospermum picroides have been identified as salt tolerant and should be suggested as alternative/complementary crops or for the phytoremediation of saline soils [25,45,46,47].
Considering the increasing interest in wild edible greens and the lack of information regarding their cultivation practices, the aim of the present study was to evaluate the effect of salinity on plant growth parameters and chemical composition of the two native to the Mediterranean basin unexploited species, namely T. officinale and R. picroides. For this purpose, plants of both species were cultivated in a floating hydroponic system under greenhouse conditions, and three electrical conductivity (EC) levels in nutrient solution were implemented, e.g., 2.0, 6.0 and 10.0 mS cm−1. The results of this study increase the knowledge regarding agronomic requirements and help the domestication and commercial cultivation of these valuable species.

2. Materials and Methods

2.1. Plant Material, Experimental Treatments and Growing Conditions

The experiment was performed in the experimental greenhouse at the University of the Peloponnese (Kalamata, Messinia, Southern Greece, 37°3′22″ N, 22°1′43″ E). Seeds of dandelion (Taraxacum officinale (L.) Weber ex F.H.Wigg.-T. officinale, hereafter) and common brighteyes (Reichardia picroides (L.) Roth-R. picroides, hereafter) were collected in the wild (Vicinity of Kalamata, Greece) and stored at 4–7 °C [33]. Seeds of both species were sown on 28/11/2018 at a depth of 0.5–1 cm in germination containers of 19 cm × 13 cm × 5 cm filled with white peat (pH 5.5–6.5, without fertilization-base substrate, Klasmann-Deilmann GmbH, Geeste, Germany). Germination containers were placed in a walk-in growth chamber at 20 °C with 16 h photoperiod and light intensity of 55 µmol m−2 s−1 provided by fluorescent lamps. On 28/01/2019 (61 days after sowing) and when they reached the 3–4 true-leaf stage, young seedlings were transplanted to polystyrene seedling trays (cell dimension 5 × 5 × 5 cm3) containing the same media, at a distance of 15 × 15 cm2 (namely 44.44 plants m2) following the method described by Alexopoulos et al. [33]. The trays were transferred in the greenhouse and placed in containers (volume of 0.25 m3) filled with 0.2 m3 of nutrient solution (NS). The composition of NS and its preparation process have been previously described by Alexopoulos et al. [33].
Three different treatments, namely 2.0 mS cm−1 (EC-2; control treatment), 6.0 mS cm−1 (EC-6) and 10.0 mS cm−1 (EC-10), were applied to plants by adding NaCl to the control NS until the desired values of EC were obtained. These levels were selected based on previous studies with wild edible greens [25,46,48]. The EC and pH values of NS were recorded on a daily basis. During the experimental period, the nutrient solution pH of all the three treatments ranged from 5.9 to 6.2, whereas the EC ranged from 2.0 to 2.2 mS cm−1 in treatment EC-2, from 6.0 to 6.2 mS cm−1 in EC-6 and from 10.0 to 10.2 mS cm−1 in EC-10. The temperature in the greenhouse ranged from 8.0 to 31.1 °C, whereas the temperature of nutrient solution in all the containers during the cultivation period ranged from 13 to 17 °C. The experiment was carried out in a completely randomized experimental design. Each container included 44 plants, while 10 plants were harvested for plant growth assessment and chemical analyses. For each species, four replications per treatment were implemented (24 containers in total). Harvest of plants from each species was performed when plants were adequately grown but still young and tender and before anthesis, based on the harvesting stage when collected in the wild. In T. officinale, the harvest was carried out on 08/03/2019 (49 days after transplanting-DAT) whereas in R. picroides on 22/03/2019 (63-DAT).

2.2. Growth Parameters

Growth parameters were assessed according to the methodology of Alexopoulos et al. [33]. In brief, plant leaf number, rosette diameter, and length and width of the largest leaf of the plant were measured in 10 plants from each replication and for each plant species. Then, yield parameters were recorded, e.g., the number of nonmarketable leaves (not green, dried or injured), total plant fresh weight (FW), the FW of the upper plant part and roots, and the FW of marketable leaf were assessed. The leaves obtained from the 10 plants of each replication were pooled in two batch samples, one of which was used to determine dry matter content (% DMC) and mineral composition, while the other one was stored at −80 °C for chemical analyses [33]. Similarly, roots were only used for the determination of % DMC and minerals content, since this plant part is not edible.

2.3. Leaf and Root Minerals and Nitrate Content

Minerals and nitrates content were determined according to the methodology previously described by Alexopoulos et al. [33], following the protocols of Kalra [49] for dry-ashing of samples; Boltz and Lueck [50] for P determination through the vanado-molybdo-phosphate yellow color method; the azomethin-H method for B determination [49]; atomic absorption spectrometry (SpectrAA, 240 Atomic Absorption FS; Varian, Palo Alto, CA, USA) for K, Ca, Mg, Na, Fe, Mn, Zn and Cu determination [49]; the indophenol-blue method N determination [51]; the method of Cataldo et al. [52] for the determination of N-NO3- in leaves; and the titration with 0.1 N silver nitrate for Cl content determination [33]. The analyses were performed in triplicate, and all the results were expressed in dry weight (DW), except for nitrates content, which was expressed in fresh weight (FW).

2.4. Chemical Composition Analyses in Leaves

Total soluble solids content (TSSC) of leaves was recorded in the juice of leaves with a portable refractometer (model HR32B, Schmidt & Haensch GmbH & Co., Berlin, Germany) after homogenized fresh samples at 20 °C [33]. Titratable acidity was assessed in aqueous extracts of homogenized samples after titration with NaOH, up to pH 8.1 [33]. The results were presented as mg of malic acid per 100 g of FW [33].
The chlorophyll content of leaves was determined using the methods described by Alexopoulos et al. [33]. In particular, one method included the use of SPAD-502 Chlorophyll Meter (Konica-Minolta Co. Ltd., Tokyo, Japan) to record SPAD index of leaves, while the other method recorded chlorophyll a, b and total chlorophyll content in acetone extracts of homogenized samples of leaves, according to Karapanos et al. [53]. The same extracts were used for carotenoids+xanthophylls quantification (absorbance at 470 nm), following the protocol of Lichtenthaler and Buschmann [54]. The results were expressed as mg per 100 g of FW.

2.4.1. Total Phenolic Compounds Content

Total phenolic compounds (TPC) were determined in methanolic extracts according to the Folin–Ciocalteu protocol [55] after slight modifications [53]. The results were expressed as mg of gallic acid equivalents (GAE) per 100 g of FW.

2.4.2. Proline Content

Free proline content was measured using the acid-ninhydrin method of Bates et al. [56]. In particular, leaf samples were extracted in 3% aqueous sulfosalicylic acid, and extracts were combined with acid ninhydrin and glacial acetic acid (1:1:1) and then incubated at 90 °C. The reaction was terminated after 1 h by putting the samples in an ice bath. The chromophore was extracted using 2 mL of toluene, and its absorbance was measured at 520 nm using a spectrophotometer (Lambda 1A, Perkin-Elmer, Waltham, MA, USA). Pure proline was used as standard, and the results were expressed as μmole of proline per g FW.

2.5. Statistical Analysis

For each plant species separately, the statistical analysis was performed with one-way ANOVA, and means were separated according to the least significant difference (LSD) test at p ≤ 0.05. For each plant species and each treatment, four replications (n = 4) with 10 plants each were used, as described in detail in Section 2.1, Section 2.2 and Section 2.3. The correlations between growth parameters and minerals content in R. picroides and T. officinale were examined using the Pearson’s correlation test. All statistical analyses were carried out with StatGraphics Centurion-XVI statistical package (StatPoint Technologies Inc., Warrenton, VA, USA).

3. Results and Discussion

3.1. Plant Growth

Reichardia picroides and Taraxacum officinale plants grown under either EC-6 or EC-10 treatment did not show any salt toxicity symptoms, i.e., local wilting or necrotic spots in the leaves. In R. picroides, the number of leaves per plant was the highest in EC-6 treatment (40.65 leaves per plant), followed by EC-2 and EC-10 treatments (32.28 and 24.75 leaves per plant, respectively) (Table 1). Nonmarketable leaf number per plant, leaf SPAD index values, root FW and root/shoot ratio were not affected by the studied EC treatments. On the other hand, EC-10 treatment caused a significant reduction in rosette diameter, the maximum leaf length and width, total plant FW, upper part plant FW and marketable leaves FW per plant in comparison with the EC-2 and the EC-6 treatments, whereas EC-6 treatment caused a significant reduction in leaf DMC compared to the EC-2 treatment and did not differ from the EC-10 (Table 1). In the case of T. officinale, the effect of EC treatments on plant growth was more profound. In particular, EC-6 and EC-10 treatments caused a significant reduction in leaf number per plant, rosette diameter, maximum leaf length and width, total plant FW, upper plant part FW, root FW and marketable leaves FW per plant compared to the EC-2 treatment. By contrast, a significant increase was observed in the case root/shoot ratio and leaf DMC for the same treatments (EC-6 and EC-10), while the number of nonmarketable leaves and the SPAD index values were not affected by the tested treatments (Table 2). According to the literature, a similar reduction in the number of leaves per plant due to high salinity was also observed in Brassica species [57], as was the case for T officinalis in our study. In addition, the reduction in leaf FW per plant in T. officinale with increasing salinity is in accordance with the findings of Wang and Nil [58] and El-Hendawy et al. [59], who reported that salinity mainly affects the leaf surface expansion, thus limiting leaf area and negatively influencing the development of the photosynthetically active surface area.
Regarding the other growth parameters, the response of R. picroides and T. officinale to the presence of NaCl in the nutrient solution also varied. In particular, EC-6 treatment led to a 79% reduction in the upper plant FW and to a 67% reduction in root FW in T. officinale plants, whereas in R. picroides EC-6 treatment increased both the upper plant part and the root FW (Table 1 and Table 2). It has been reported that salt stress may lead to a considerable decrease in the FW of leaves, upper plant part and roots of various plants resulting in stunted growth habit [60,61,62,63,64,65]. Plant growth restriction occurred because of the accumulation of specific ions that affect plant metabolism and physiology or/and due to the adverse water relations which have an impact on water and nutrients uptake [36,66]. However, there is considerable variation in salinity tolerance among plant species that may belong to the same family or even to the same genus. In the Asteraceae family, in which several important leafy crops and numerous wild edible herbs (including the tested species) belong, there are also included moderately salt-sensitive species (e.g., lettuce-Lactuca sativa [67]), moderately to highly resistant ones (e.g., wild chicory-Cichorium intybus [68] and spiny chicory-Cichorium spinosum [25]) and halophytes (e.g., sea fennel-Crithmum maritimum [41,69]). Differences in salt tolerance based on the plant growth restriction have been also reported between genotypes of the same plant species [70]. In addition, the higher root/shoot ratio in salt-treated plants of T. officinale may indicate its sensitivity to saline conditions. Pérez-Alfocea et al. [71] suggested a greater proportion of assimilates for the root compared to assimilates for the shoot in salt-treated tomato plants, leading to a greater reduction in the growth of the aboveground plant part compared to the roots. Moreover, stress hormones are involved in the plant defense mechanism and could be involved in mediating salinity stress signals and in controlling the balance between growth and stress responses [44,72,73]. Moreover, the increased DMC (by up to 31%) in combination with the significant decrease in T. officinale growth could be attributed to the high concentrations of NaCl in the nutrient solution resulting in hyperosmotic conditions which hinder water and nutrients uptake [66,74]. On the contrary, the values for R. picroides growth parameters such as the root/shoot ratio and the upper plant weight indicate moderate tolerance of the species which retains its ability to uptake water and nutrients from the nutrient solution up to EC-6.
Available data on the salinity tolerance of the tested species are scarce in the literature. However, in agreement with our results, high salt content in soil (> 0.7%) significantly reduced plant growth in Taraxacum erythropodium, whereas at salt content below 0.7% the declining trend weakened [45]. On the other hand, there is evidence that R. picroides is resistant to high salinity levels, as its natural habitats include saline sand dunes in the coastal areas of the Mediterranean [75], while other reports indicate the effectiveness of the species to withstand saline irrigation water of 8 dS m−1 without significantly compromising plant growth [46].

3.2. Leaf and Root Minerals Concentrations

3.2.1. Total Leaf Nitrogen Content

In R. picroides, total leaf N was higher in the EC-10 treatment than in EC-6 and EC-2 treatments, whereas in T. officinale, the lowest N content was observed in EC-10 treatment (Table 3). Moreover, leaf N content did not significantly differ between EC-2 and EC-6 treatments in both plant species. Our results for T. officinale are in accordance with those of Pessarakli and Tucker [76] who reported that nitrogen concentration in tomato leaves was not significantly affected at relatively low salt concentrations, but at 140 and 200 mM NaCl, it was reduced by approximately 33% compared to plants grown under nonsaline conditions. Similarly, Camalle et al. [77] suggested that high salinity may lead to nitrogen deficiency since Na and Cl exhibit antagonistic effects to nitrate uptake. On the other hand, the fact that the total leaf N in R. picroides plants for the EC-10 was the highest could be attributed to the efficient defense mechanism that allowed plants to retain root functionality and nutrients uptake, as well as to the variable effects of salinity on the activities of N metabolizing enzymes which may depend on the species and numerous soil/nutrient solution parameters [78].

3.2.2. Leaf and Root Phosphorus Content

Leaf and root P content of R. picroides and leaf P content of T. officinale increased with increasing NaCl concentration in the nutrient solution (Table 3 and Table 4), whereas root P content of T. officinale was the lowest in treatment EC-6 (Table 4). Based on the recommended dietary allowances (RDA) for P (700 mg per day for adults) [79], the consumption of 100 g FW of R. picroides leaves can cover up to 36.5% of RDI when plants are grown under highest salinity (10 mS cm−1), whereas 100 g of fresh T. officinale leaves can cover only 15.9% of RDI (plants grown at EC-10 treatment). In contrast to the findings of the present work, salinity decreased the concentration of P in tomato plant tissues [80], whereas other studies indicated that salinity either increased or had no effect on P uptake [81]. Moreover, plant tissue is also important, since according to Villora et al. [82], increased salinity resulted to P accumulation in zucchini leaves, while in fruit P accumulation differed among the different parts (pulp, skin and whole fruit). Finally, P availability is also a key factor, and Tang et al. [83] suggested that salinity affected differently maize plants depending on the available P amount, while P deficiency improved tolerance to salinity through the selective absorption of K and Na.

3.2.3. Leaf and Root Potassium Content

In R. picroides plants, leaf K content decreased gradually with increasing salinity (Table 3), whereas K content in roots of the same species as well as K content in both tissues (leaves and roots) of T. officinale were significantly decreased at both salinity treatments compared to the control (Table 3 and Table 4). Moreover, the reduction of K concentration in the leaves of both species was higher (36–45% in EC-6 and 46–48% in EC-10 treatments, compared to the control) in relation to that in the roots (10–24% in EC-6 and 16–31% in EC-10 treatments, compared to the control). This finding is in accordance with that of Pérez-Alfocea et al. [71], who reported decreased K levels in all tissues of tomato plants grown under salt stress, although the lowest relative reduction in K concentrations was found in the roots. Our results also indicate competition effects between Na+ and K+ ions which most likely share the same transport system at the root surface [84], an effect of Na+ on the K+ transport into the xylem, or indirect inhibition of the uptake process, i.e., through the H+-ATPase activity [85]. The role of K homeostasis in salt-tolerance mechanisms of salinized plants is highly recognized [86], due to the fact that high NaCl uptake competes with the uptake of other nutrient ions, especially K, resulting in growth and yield reduction of various crops [87,88,89,90]. Contrary to our results, Semiz et al. [91] did not find any effect of salinity on K and Mg concentrations in pepper leaves, whereas Assimakopoulou et al. [80] have reported increased leaf K, Ca and Mg concentrations in salt-treated tomato plants. According to Shahid et al. [92], the salinity-tolerance mechanisms are still highly controversial and are influenced by growth conditions, growth medium (soil or soilless culture), stress duration and plant genotype, among others. Regarding the nutritional value of edible leaves, the RDA values for potassium are 3400 and 2600 mg per day for adult males and females, respectively [93]. Considering the suggested values, the consumption of 100 g of fresh from either R. picroides or T. officinale plants grown at EC-2 treatment were the most nutritious, since they could cover up to approximately 19.0% and 25.0% of RDI for male and female adults, respectively.

3.2.4. Leaf and Root Calcium and Magnesium Content

In both species, leaf Ca and Mg contents were the highest in the EC-2 treatment (Table 3). On the other hand, no significant effects of salinity treatments were observed for root Ca content in both species (Table 4). According to Yu et al. [44], this finding could be due to plant adaptation to salinity stress through a flexible system of hormone regulation and/or through signaling via glycosyl inositol phosphorylceramide (GIPC) sphingolipids in the plasma membrane, which allow the sensing of Na+ in the apoplastic space and increasing of Ca2+ influx channels in plants. The exploration of potential Na+ receptors has undoubtedly provided new opportunities to the understanding of salt-stress perception by plants [94]. Similarly to our study, Bolarin et al. [95] reported slight changes in root Ca and K of tomato plants grown under saline conditions. The retention of root Ca content under saline conditions at levels similar to control could also induce the retention of K, since the presence of Ca seems to be necessary for K-Na selectivity and for the retention of the required K content in plant cells [62,96]. Saline conditions reduced the nutritional value of edible leaves in the case of T. officinale, whereas increasing salinity increased Ca and Mg content in fresh leaves of R. picroides. According to the literature, the RDI values for Ca 1000 mg per day for male adults and between 1000 and 1200 mg per day for female adults [97]. Therefore, the consumption of 100 g of fresh edible leaves of R. picroides plants grown under high salinity can cover 12% and 10.0% of RDA values for male and female adults. In the case of T. officinale, leaves collected from plants grown under the EC-2 treatment can provide only 8% and 7% of daily requirements of male and female adults, respectively. Regarding the Mg, the allowance intake (AI) refers to 400–420 mg per day for male adults and to 310–320 mg per day for female adults [79]. Considering the results of our study, 100 g of fresh R. picroides leaves (grown at EC-10 treatment) can cover 10.4% and 13.7% of male and female adults, respectively, whereas T. officinale leaves (grown at EC-2 treatment) can cover only 4.3% and 5.8% of AI of male and female adults, respectively.

3.2.5. Leaf and Root Sodium and Leaf Chlorine Content

Na and Cl content increased with increasing salinity in both species, although no significant differences were observed between EC-2 and EC-6 treatments in the case of leaf Cl content of R. picroides, as well as between EC-6 and EC-10 treatments in root Cl content of the same species (Table 3 and Table 4). Moreover, R. picroides plants under both salinity levels presented increased leaf Na+ concentration by 6.6 and 7.3 times compared to the control; however, the relevant leaf Na+ increase in T. officinale was much higher (by 41 and 79 times, respectively) (Table 3). Taking into consideration that the leaf Na content in R. picroides was equal to 3.7 g kg−1 DW and the growth was unaffected in EC-6 treatment, whereas in T. officinale, the relevant leaf Na content was 2.0 g kg−1 DW with severe effects on plant growth, and it could be suggested that T. officinale cannot tolerate Na accumulation in the leaves. According to the literature, the regulation of root-to-leaf Na and Cl transport is important for increased tolerance under saline conditions since it may affect photosynthetic activity [98], while the presence of ion specific transporters in cell membranes is pivotal in plant defense system against salinity [99].
Regarding the nutritional parameters of edible leaves, high intake of Na and Cl is associated with high blood pressure; therefore, AI values of 1500 mg per day and 3100 mg per day for male and female adults have been set for Na and Cl, respectively [93,100]. Based on that, high salinity (EC-10) results to final products that may significantly contribute to the overall daily intake of Na; therefore, excessive consumption should be avoided. In particular, the consumption of 100 g of fresh leaves accounts to 23.1% of Na and 5.0% of Cl of AI values in the case of T. officinale and 38.7% of Na and 7.7% Cl of AI in the case of R. picroides. This indicates that consumption of high amounts of the latter species should be avoided when plants are grown under high salinity.

3.2.6. Leaf K/Na and Ca/Na Ratios

The leaf K/Na and Ca/Na ratios of R. picroides and T. officinale decreased significantly in EC-6 and EC-10 treatments compared to control without significant differences with each other (Table 3). The K/Na ratio, which is widely used as a salinity tolerance predictor in many plant species, was found to be 10 times lower in EC-6 treatment and 14 times lower in EC-10 treatment compared to control in R. picroides, while in the case of T. officinale, the reduction was even higher (by 91 and 176 times in EC-6 EC-10 treatments, respectively). Similarly, a significant reduction was also observed in leaf Ca/Na ratio, namely 8 times lower in EC-6 and 10 times lower in EC-10 treatment compared to the control in the case of R. picroides and 62 times lower in EC-6 and 108 times in EC-10 treatment compared to the control in the case of T. officinale. These differences in K/Na and Ca/Na in the EC-2 treatment between the species are due to the very low content of Na in T. officinale, which consequently results in considerably higher K/Na and Ca/Na values. These findings indicate the differences in salt tolerance between the studied species, since the high K+/Na+ ratio in cytosol is associated with high salinity tolerance [101], which was the case for R. picroides in our study. Moreover, the present results are in agreement with previous reports [3,70], while Pérez-Alfocea et al. [71] also suggested that high values of K/Na and Ca/Na ratios indicate an equilibrium of nutrients more similar to the nonsalinized plants.

3.2.7. Leaf and Root Micronutrients Content

In the case of R. picroides, leaf Fe and Cu as well as root Mn, Cu and B contents were not significantly affected by salinity treatments (Table 3 and Table 4). On the other hand, the highest content of leaf Mn, Zn and B was the highest for the highest salinity level (EC-10), while Fe and Zn content in roots was the highest at moderate salinity levels (EC-6) (Table 4). Regarding T. officinale plants, Mn, Cu and B content in leaves as well as leaf Fe, Mn and Zn content were not affected by salinity treatments, while increasing trends with increasing salinity were observed in the case of leaf Fe and Zn content (Table 3 and Table 4). Finally, Cu content in roots was significantly reduced under saline conditions compared to the control treatment, whereas the highest content of B was observed in the EC-6 treatment (Table 4). According to Bingham et al. [102], no significant effects of salinity on B content were observed in wheat plants, while Hasana et al. [103] reported a varied response for different micronutrients content under salinity stress in maize plants. Contrary to our results, a reduced Mn uptake with salinity had been reported in corn [104,105], while Shibli et al. [106] mentioned that leaf Fe, B, Zn, Mn and Cu content decreased with elevated salinity. Regarding the Fe uptake in plants under salinity, inconsistent results are reported as salinity increased or decreased leaf Fe content in red lettuce [107] and tomato plants [107], respectively.
Comparing leaf Zn content between the two plant species under the same salinity level, leaf Zn concentration in R. picroides under EC-6 and EC-10 was increased by 75% and 101%, respectively, whereas in T. officinale the increase was only 17% and 29% compared to the control (Table 3). According to Rahman et al. [104] salinity increased Zn content in corn shoots, while the increase in zinc content via foliar spraying alleviated salinity stress effects in pak choi plants through the decrease in oxidative damage [108]. The importance of increased Zn concentration on plants’ adaptation to salinity stress could also be related to the role of zinc in auxin biosynthesis, as phytohormones under salinity stress play a crucial role in modulating plant physiological responses [73]. In addition, Zn is required for scavenging of reactive oxygen species (ROS) that are produced under salinity stress [92,109].
Regarding the intake of the tested micronutrients on a daily basis, different thresholds have been set. In particular, RDI values of 8 mg per day (male and female adults) have been suggested for Fe, 8–11 mg per day for Zn (female and male adults, respectively), and 900 mg per day for Cu (male and female adults) [97]. In the case of Mn, an AI value of 2.3 mg per day (male and female adults) has been suggested, while for B the tolerable upper intake level (UL) has been set to 20 mg per day (male and female adults) [97]. The results of our study show that the consumption of 100 g of fresh leaves of both species does not significantly contribute to the overall daily intake for most of the micronutrients, especially in the case of B, Zn and Cu. However, Fe intake accounts for 13.0% in the case of R. picroides (EC-10 treament) and for 6.9% of RDI in the case of T. officinale (EC-2 treatment), while the intake of Mn is even higher (16.0% and 28.7% of AI values for R. picroides and T. officinale plants grown at EC-10 treatment, respectively).

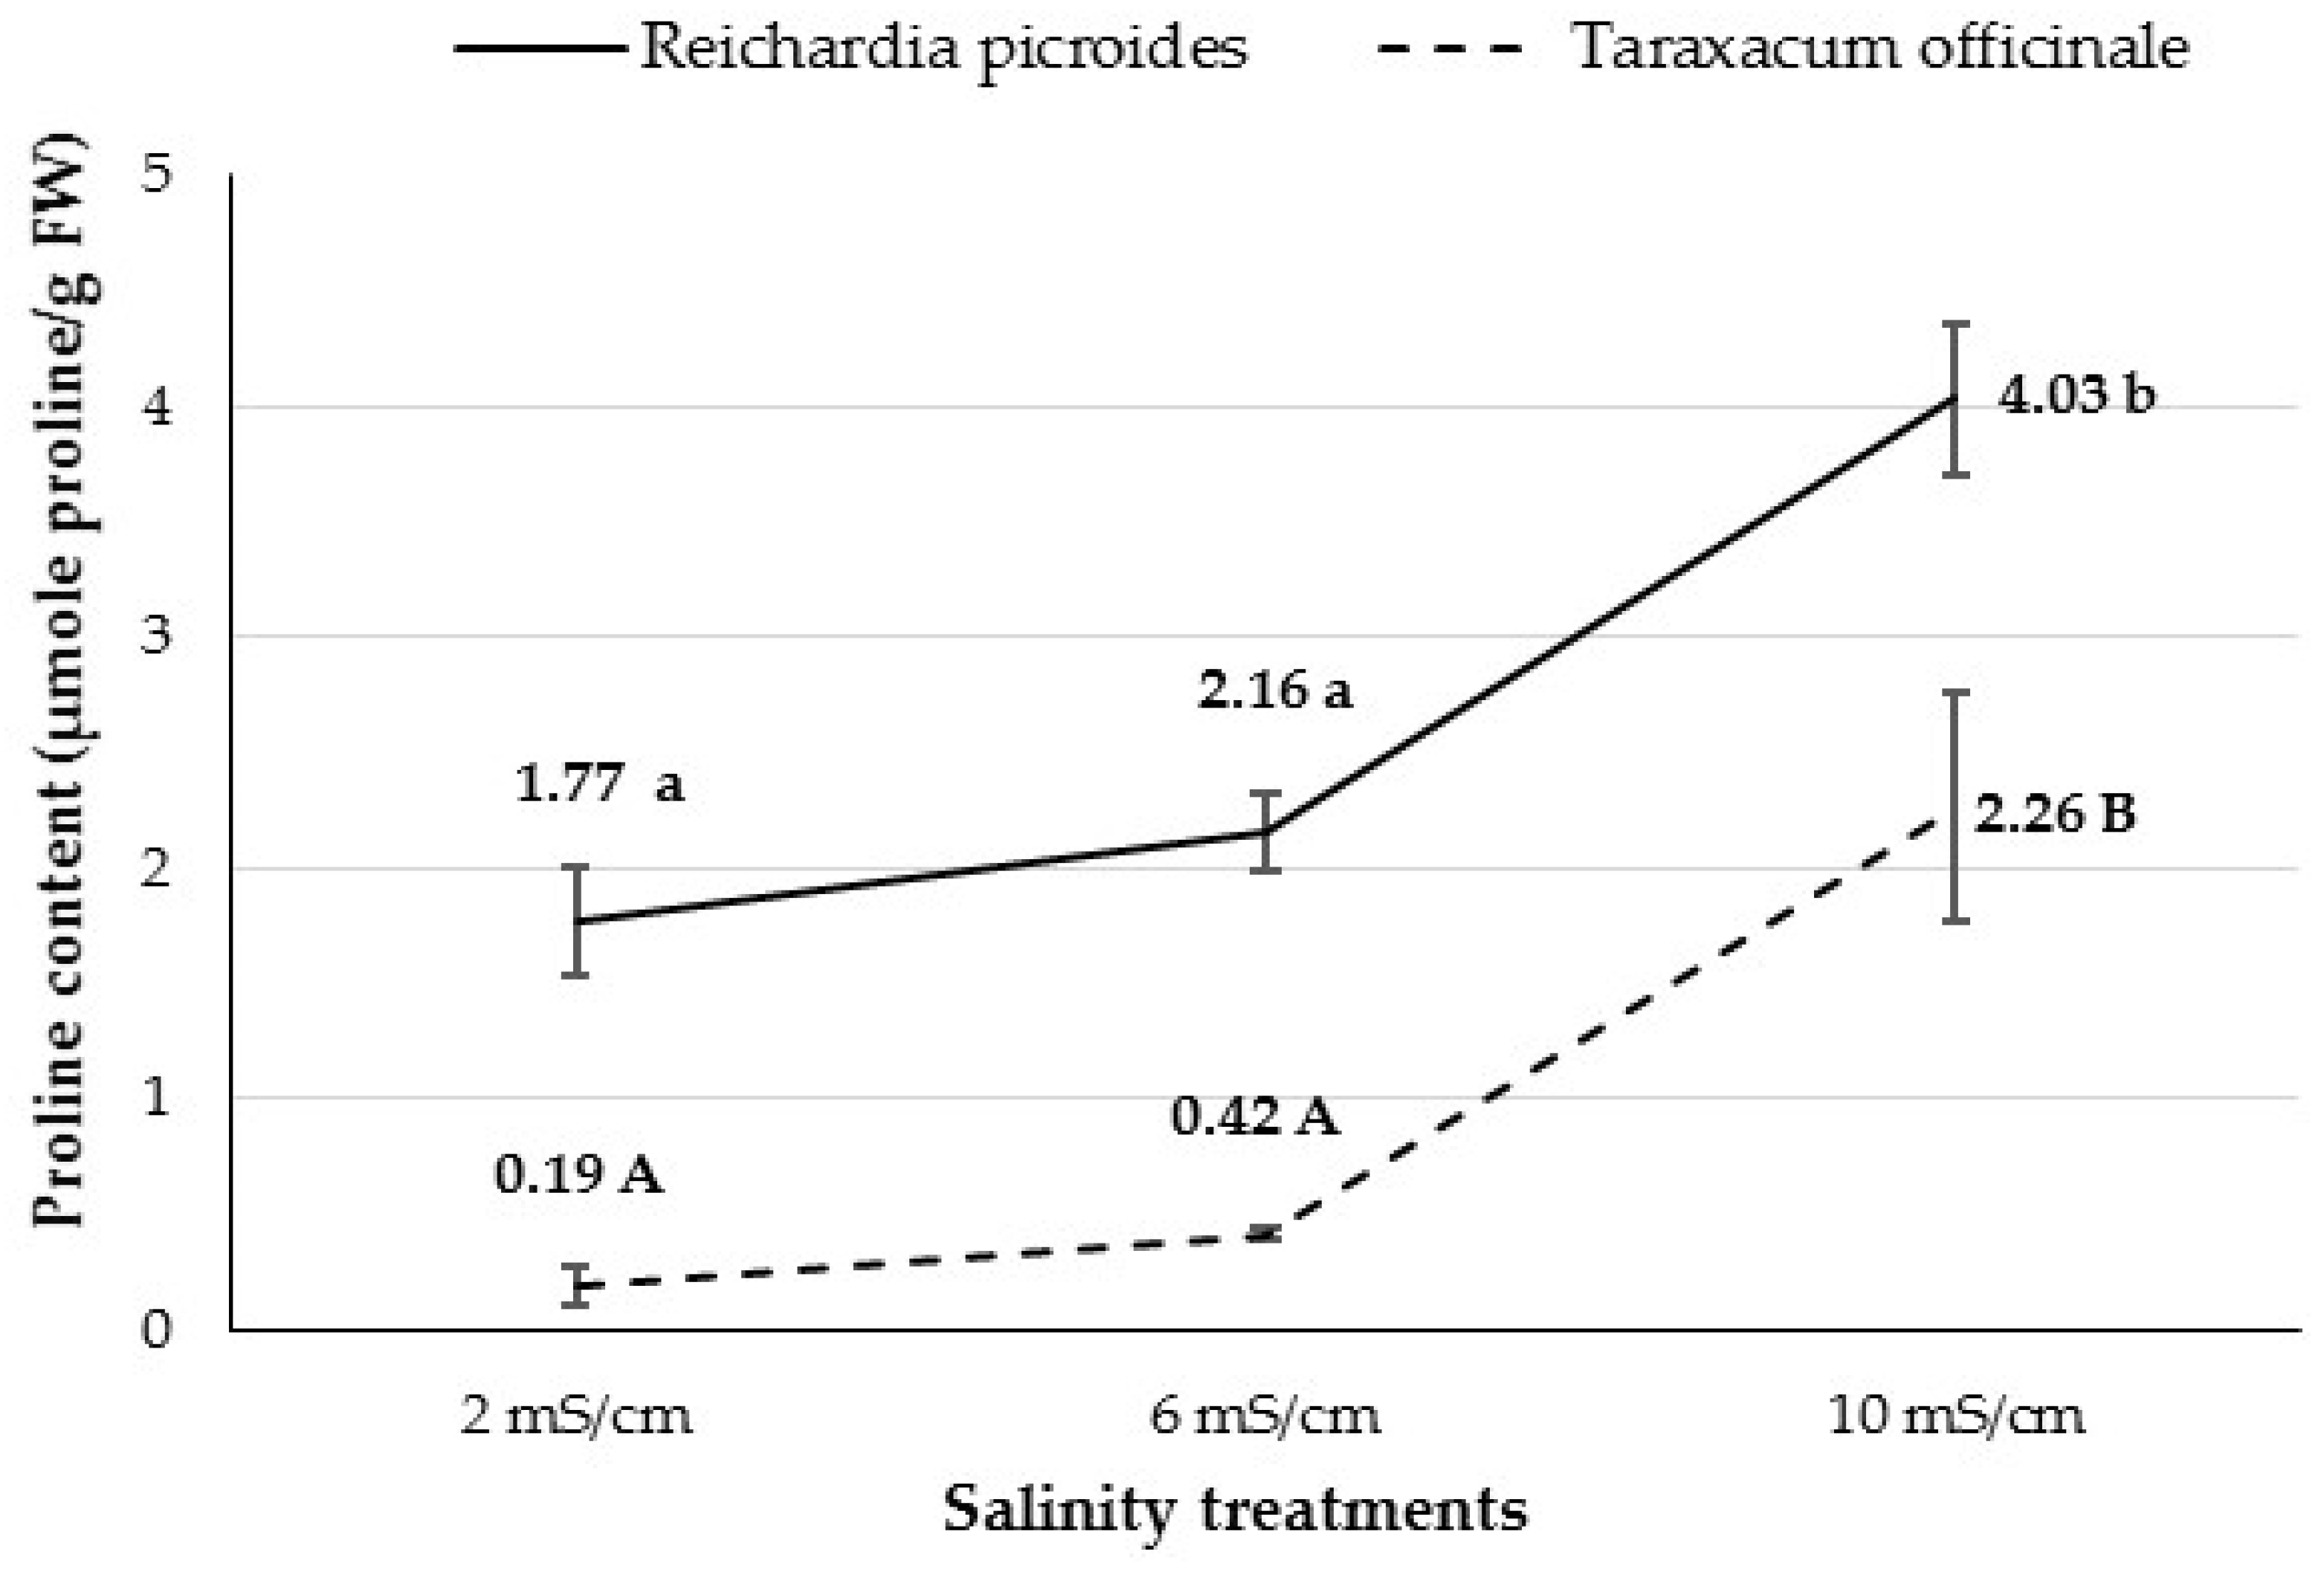
3.2.8. Proline Content

Regardless of salt treatment, R. picroides and T. officinale plants accumulated higher amounts of proline compared to control, although no significant differences were observed between the control and the EC-6 treatment (Figure 1). Given that proline is an important osmolyte for the osmotic adjustment under salinity stress conditions [110], the salt tolerance of R. picroides based on the recorded growth results could be attributed to the induction of proline biosynthesis, especially at the highest salinity level (EC-10), where an increase by 127.7% was observed. Moreover, R. picroides contained higher amounts of proline compared to T. officinale in all the studied treatments, which also indicates the better adaptation of the species under saline conditions compared to T. officinale. On the other hand, the increase in proline content in T. officinale was 1089.5 times higher than the control treatment, a finding which probably indicates that accumulation of proline indicates a symptom of salt injury instead of salt tolerance of the species [111,112]. Moreover, the increased biosynthetic rate of proline in T. officinale highlights the high energy expenditure for the alleviation of salt stress and the deficit of energy for biomass production, as indicated by the limited growth of plants under saline conditions [112,113]. Moreover, the increased leaf K concentration (7.04% DW) determined in R. picroides compared to the leaf K (5.48% DW) of T. officinale (Table 3) could be related to the higher proline biosynthesis in R. picroides, since Chou et al. [114] mentioned that proline accumulation depends on the availability of potassium. As mentioned before, in both species, proline content in EC-6 treatment did not differ from the control; however, the increase in T. officinale was more profound than that in R. picroides, a finding which is in agreement with the results of Wu et al. [45], who reported that Taraxacum erythropodium plants exhibited a rapid response to the increased salinity by increasing leaf proline content. Similar results were reported by Slabbert and Krüger [115] for Amaranthus sp., Xue et al. [113] for Brassica napus and Saleh [116] for Vigna radiata plants.

3.3. Chemical Composition

The studied EC treatments had no effect on chlorophylls (a, b and total), carotenoids+xanthophylls of leaves in both species (Table 5). In general, the effect of salinity on the content and function of photosynthetic pigments in green vegetables is related to the salt tolerance of the species, the severity of the stress, the plant growth stage, the duration and the method of stress application [117]. In agreement to our results, the photosynthetic pigments content in Cichorium spinosum leaves was not affected by 20 and 40 mM NaCl [118], whereas total chlorophyll content of Taraxacum erythropodium decreased when soil salt content exceeded 0.4% [45]. The fact that the chlorophyll content was not affected even when both plants were grown under high salinity (EC-10) indicates that despite the reduced plant growth, the harvested leaves retained their greenness and thus their visual quality [119,120]. Total soluble solids content (TSSC) of leaves was also not affected by salinity in both species, whereas titratable acidity (TA) increased with increasing salinity, particularly in EC-10 treatment (Table 5). It is well established that mild salt stress (salinity eustress) may favor both TSSC and TA in fruit vegetables, apart from other flavor and taste characteristics [121]. However, in leafy greens, salinity has been proven either beneficial (e.g., in lettuce, in combination with elevated CO2 [122]) or detrimental (e.g., spiny chicory [25]) in regards to sugar accumulation. On the other hand, the observed elevated titratable acidity could be partly attributed to the enhanced biosynthesis of organic acids in plants grown under EC-10 in order to counteract the excess of cations in relation to anions [123] or to concentration effects due to the increasing DMC with increasing salinity (see Table 1).
Regarding total phenolics content (TPC), contrasting effects of salinity treatments were observed in the studied species. In particular, TPC was not significantly affected in the case of T. officinale, whereas a significant decrease (by 45.2%) was observed for the EC-10 treatment in R. picroides plants. According to the literature, abiotic stress factors such as salinity may induce the biosynthesis of phenolic compounds content in various species, including wild and commercially cultivated leafy vegetables [124,125,126]. However, this is not always the case, and decreasing trends of TPC content have also been recorded under saline conditions, as for example in romaine lettuce following a long-term mild salt stress (5 mM NaCl) [127], or in green and red baby lettuce under 10 mM NaCl [107]. Moreover, salinity was not beneficial for biosynthesis of phenolic compounds, as shown by Kim et al. [127], in green and red baby lettuce under 10 mM NaCl, or in spiny chicory under 8 dS m−1 [25].
The leaf nitrate content in R. picroides plants was the highest for the EC-6 treatment without being significantly different from the control treatment, while the lowest content was recorded for the EC-10 treatment (Table 5). On the other hand, nitrate content was significantly reduced when plants were subjected to EC-6 or EC-10 treatments. The observed trends for nitrates content follow the pattern of organic acids content, since according to Gent [128], organic acids and nitrates content are inversely related. Moreover, according to Bonasia et al. [129] and Cantabella et al. [130], the decrease in nitrates content could be related to the competitive effects of Cl- on NO3-, which may inhibit nitrates accumulation in plant tissues under saline conditions. As nitrates are considered an important antinutrient factor in leafy vegetables [131], the reduction of leaf nitrates content under the EC-10 in R. picroides or EC-6 in T. officinale is of high importance for the commercial cultivation of these species in saline areas, due to the compensation of yield loss by the production of a safer produce. Moreover, the decrease in nitrates was more profound in the case of T. officinale under the EC-6 and EC-10 treatments compared to control (reduced by 63% and 75%, respectively), while in R. picroides the decrease for the EC-10 treatment was 17% (Table 5). These findings are in accordance with those reported by Kafkafi et al. [132], who suggested that in tomato and melon plants, salt-tolerant genotypes exhibited higher nitrate influx rates than the more sensitive ones. Moreover, the dramatic decrease in plant growth in T. officinale under saline treatments could be related to the severe limitations in water uptake as that species showed significant growth decrease in combination with significant increased DMC. On the contrary, plant growth of R. picroides was unaffected and was followed by lower DMC under the EC-6 treatment (Table 1 and Table 2). These findings are in accordance with those of Abdelgadir et al. [133], who suggested that the inhibition of nitrates absorption by tomato plants was more strongly related to the reduced water uptake than to Cl- antagonism from salt stress. For the same reason, the uptake of nitrates by R. picroides was not hindered by salinity up to EC-6 as the water uptake and growth of the species was found to be unaffected despite the high presence of NaCl in nutrient solution.

3.4. Correlations

Most of plant growth parameters of T. officinale (i.e., the total plant FW, the upper plant part FW, the root FW, the marketable leaf FW, the leaf number per plant, the rosette diameter, the maximum leaf length and the maximum leaf width) were found to be significantly positively correlated with the leaf nitrate concentration, root P, leaf and root K, leaf Ca, leaf Mg, leaf K/Na and Ca/Na ratios, root Zn and root Cu but significantly negatively correlated with leaf and root Na concentrations (see Supplementary Material Table S1). In particular, the correlation coefficients between the rosette diameter, maximum leaf length and maximum leaf width of T. officinale with leaf Na concentration were r = −0.81, r = −0.80 and r = −0.78, respectively, whereas the relevant correlation coefficients with leaf K were r = 0.99, r = 0.99 and r = 0.98. By contrast, the determined growth parameters of R. picroides were not significantly correlated with the majority of minerals content. Significant correlations were detected mainly between the rosette diameter (and the maximum leaf length) of the species with the leaf N (r = −0.79), P (r = −0.85), K (r = 0.70), Na (r = −0.68), Mn (r = −0.74), Zn (r = −0.77) and B (r = 0.78), root K (r = 0.64) and root Na (r = −0.79), as well as with proline (r = −0.88) and malic acid contents (r = −0.81). Significant correlations between plant growth parameters and ion contents under salinity have been indicated by several researchers [71,110,134], while Bosiacka et al. [47] reported that the strongest correlations were found between soil salinity and the leaf Na, Mn, Ca, Fe, K and Zn content of three Taraxacum microspecies.

4. Conclusions

The wild edible greens R. picroides and T. officinale tested in the present study responded differently to salinity treatments indicating different tolerance mechanisms. In particular, plant growth of R. picroides was negatively affected only when grown under nutrient solution with EC values equal to 10 mS cm−1 (EC-10 treatment), whereas T. officinale was more sensitive and plant growth rapidly decreased when EC increased at 6 mS cm−1. The leaf and root Na and Cl concentration changes under salinity could partially explain the aforementioned salt-tolerance differentiation between the two species as the more salt-tolerant R. picroides accumulated more Cl and Na in the leaves as compared to the sensitive T. officinale. Therefore, the higher salt tolerance of R. picroides could be due to its ability to develop a better adaptation mechanism of water uptake, to effectively accumulate osmolytes such as proline and to keep high shoot K probably through a more efficient K/Na selectivity, in combination with an increased Zn uptake ability under salinity stress. Moreover, the studied species differed in the contribution of secondary metabolites such as phenolic compounds to the overall antioxidant mechanism, since it seems that in R. picroides, phenolic compounds have an important role in plant defense against abiotic stressors, whereas in T. officinale, no such effect was observed. In conclusion, the response of R. picroides to moderate and high salinity (EC-6 and EC-10) is of great importance for its commercial exploitation under saline soils or in regions where irrigation water is of low quality. However, the ability of the species to adapt to saline conditions that are unsuitable for most leafy greens as well as the relevant adaptation mechanisms should be further studied.

Supplementary Materials

The following are available online at https://www.mdpi.com/article/10.3390/horticulturae7070160/s1, Table S1: Correlation coefficients of plant growth parameters and chemical composition of Reichardia picroides and Taraxacum officinale.

Author Contributions

Conceptualization, A.A.A.; methodology, A.A.A., A.A., P.P., M.B., N.V. and I.C.K.; software, A.A., P.P., M.B. and N.V.; validation, I.C.K. and A.A.; formal analysis, A.A.A. and I.C.K.; investigation, A.A.A., A.A., P.P., M.B. and N.V.; resources, A.A.A.; data curation, A.A., S.A.P. and I.C.K.; writing—original draft preparation, A.A.A., A.A., S.A.P. and I.C.K.; writing—review and editing, A.A.A., S.A.P. and I.C.K.; visualization, A.A.A.; supervision, A.A.A.; project administration, A.A.A., S.A.P. and I.C.K. All authors have read and agreed to the published version of the manuscript.

Funding

This research received no external funding.

Institutional Review Board Statement

Not applicable.

Informed Consent Statement

Not applicable.

Data Availability Statement

The study did not report any data.

Acknowledgments

The authors thank George Georgiopoulos for providing seeds and Anastasios Kotsiras for his technical advice for nutrient solution preparation.

Conflicts of Interest

The authors declare no conflict of interest.

References

  1. Raza, A.; Razzaq, A.; Mehmood, S.S.; Zou, X.; Zhang, X.; Lv, Y.; Xu, J. Impact of climate change on crops adaptation and strategies to tackle its outcome: A review. Plants 2019, 8, 34. [Google Scholar] [CrossRef] [Green Version]
  2. Dong, J.; Gruda, N.; Li, X.; Tang, Y.; Zhang, P.; Duan, Z. Sustainable vegetable production under changing climate: The impact of elevated CO2 on yield of vegetables and the interactions with environments—A review. J. Clean. Prod. 2020, 253, 119920. [Google Scholar] [CrossRef]
  3. Paranychianakis, N.V.; Chartzoulakis, K.S. Irrigation of Mediterranean crops with saline water: From physiology to management practices. Agric. Ecosyst. Environ. 2005, 106, 171–187. [Google Scholar] [CrossRef]
  4. Mahajan, S.; Tuteja, N. Cold, salinity and drought stresses: An overview. Arch. Biochem. Biophys. 2005, 444, 139–158. [Google Scholar] [CrossRef]
  5. Slama, I.; Abdelly, C.; Bouchereau, A.; Flowers, T.; Savouré, A. Diversity, distribution and roles of osmoprotective compounds accumulated in halophytes under abiotic stress. Ann. Bot. 2015, 115, 433–447. [Google Scholar] [CrossRef] [PubMed] [Green Version]
  6. Iriti, M.; Vitalini, S. Sustainable crop protection, global climate change, food security and safety—Plant immunity at the crossroads. Vaccines 2020, 8, 42. [Google Scholar] [CrossRef] [Green Version]
  7. Petropoulos, S.A. Practical applications of plant biostimulants in greenhouse vegetable crop production. Agronomy 2020, 10, 1569. [Google Scholar] [CrossRef]
  8. Shahrajabian, M.H.; Chaski, C.; Polyzos, N.; Petropoulos, S.A. Biostimulants Application: A Low Input Cropping Management Tool for Sustainable Farming of Vegetables. Biomolecules 2021, 11, 698. [Google Scholar] [CrossRef]
  9. Voutsela, S.; Yarsi, G.; Petropoulos, S.A.; Khan, E.M. The effect of grafting of five different rootstocks on plant growth and yield of tomato plants cultivated outdoors and indoors under salinity stress. Afr. J. Agric. Res. 2012, 7, 5553–5557. [Google Scholar] [CrossRef]
  10. Petropoulos, S.A.; Khah, E.M.; Passam, H.C. Evaluation of rootstocks for watermelon grafting with reference to plant development, yield and fruit quality. Int. J. Plant Prod. 2012, 6, 481–492. [Google Scholar]
  11. Petropoulos, S.A.; Karkanis, A.; Martins, N.; Ferreira, I.C.F.R. Edible halophytes of the Mediterranean basin: Potential candidates for novel food products. Trends Food Sci. Technol. 2018, 74, 69–84. [Google Scholar] [CrossRef] [Green Version]
  12. Shahrajabian, M.H.; Chaski, C.; Polyzos, N.; Tzortzakis, N.; Petropoulos, S.A. Sustainable Agriculture Systems in Vegetable Production Using Chitin and Chitosan as Plant Biostimulants. Biomolecules 2021, 11, 819. [Google Scholar] [CrossRef]
  13. FAO. The State of the World’s Biodiversity for Food and Agriculture. In The State of the World’s Biodiversity for Food and Agriculture; Pilling, D., Bélanger, J., Eds.; FAO Commission on Genetic Resources for Food and Agriculture Assessments: Rome, Italy, 2019; p. 572. ISBN 9789251312704. [Google Scholar]
  14. Corrêa, R.C.G.; Gioia, F.D.; Ferreira, I.C.F.R.; Petropoulos, S.A. Wild greens used in the Mediterranean diet. In The Mediterranean Diet: An Evidence-based Approach; Preedy, V., Watson, R., Eds.; Academic Press: London, UK, 2020; pp. 209–228. ISBN 9788578110796. [Google Scholar]
  15. Chatzopoulou, E.; Carocho, M.; Di Gioia, F.; Petropoulos, S.A. The beneficial health effects of vegetables and wild edible greens: The case of the mediterranean diet and its sustainability. Appl. Sci. 2020, 10, 9144. [Google Scholar] [CrossRef]
  16. Capurso, C.; Vendemiale, G. The Mediterranean Diet Reduces the Risk and Mortality of the Prostate Cancer: A Narrative Review. Front. Nutr. 2017, 4, 38. [Google Scholar] [CrossRef] [PubMed] [Green Version]
  17. Ceccanti, C.; Landi, M.; Benvenuti, S.; Pardossi, A.; Guidi, L. Mediterranean wild edible plants: Weeds or “new functional crops”? Molecules 2018, 23, 2299. [Google Scholar] [CrossRef] [PubMed] [Green Version]
  18. Guarrera, P.M.; Savo, V. Wild food plants used in traditional vegetable mixtures in Italy. J. Ethnopharmacol. 2016, 185, 202–234. [Google Scholar] [CrossRef] [PubMed]
  19. Benvenuti, S.; Maggini, R.; Pardossi, A. Agronomic, Nutraceutical, and Organoleptic Performances of Wild Herbs of Ethnobotanical Tradition. Int. J. Veg. Sci. 2017, 23, 270–281. [Google Scholar] [CrossRef]
  20. Johns, T.; Powell, B.; Maundu, P.; Eyzaguirre, P.B. Agricultural biodiversity as a link between traditional food systems and contemporary development, social integrity and ecological health. J. Sci. Food Agric. 2013, 93, 3433–3442. [Google Scholar] [CrossRef]
  21. Morales, P.; Ferreira, I.C.F.R.; Carvalho, A.M.; Sánchez-Mata, M.C.; Cámara, M.; Fernández-Ruiz, V.; Pardo-de-Santayana, M.; Tardío, J. Mediterranean non-cultivated vegetables as dietary sources of compounds with antioxidant and biological activity. LWT-Food Sci. Technol. 2014, 55, 389–396. [Google Scholar] [CrossRef] [Green Version]
  22. Zimmerer, K.S.; Vanek, S.J. Toward the integrated framework analysis of linkages among agrobiodiversity, livelihood diversification, ecological systems, and sustainability amid global change. Land 2016, 5, 10. [Google Scholar] [CrossRef] [Green Version]
  23. Conversa, G.; Elia, A. Effect of seed age, stratification, and soaking on germination of wild asparagus (Asparagus acutifolius L.). Sci. Hortic. 2009, 119, 241–245. [Google Scholar] [CrossRef]
  24. Cros, V.; Martínez-Sánchez, J.J.; Franco, J.A. Good yields of common purslane with a high fatty acid content can be obtained in a peat-based floating system. Horttechnology 2007, 17, 14–20. [Google Scholar] [CrossRef] [Green Version]
  25. Petropoulos, S.; Levizou, E.; Ntatsi, G.; Fernandes, Â.; Petrotos, K.; Akoumianakis, K.; Barros, L.; Ferreira, I. Salinity effect on nutritional value, chemical composition and bioactive compounds content of Cichorium spinosum L. Food Chem. 2017, 214, 129–136. [Google Scholar] [CrossRef] [Green Version]
  26. Petropoulos, S.; Fernandes, Â.; Karkanis, A.; Ntatsi, G.; Barros, L.; Ferreira, I. Successive harvesting affects yield, chemical composition and antioxidant activity of Cichorium spinosum L. Food Chem. 2017, 237, 83–90. [Google Scholar] [CrossRef] [Green Version]
  27. Petropoulos, S.; Fernandes, Â.; Karkanis, A.; Antoniadis, V.; Barros, L.; Ferreira, I. Nutrient solution composition and growing season affect yield and chemical composition of Cichorium spinosum plants. Sci. Hortic. 2018, 231, 97–107. [Google Scholar] [CrossRef] [Green Version]
  28. Petropoulos, S.A.; Fernandes, Â.; Tzortzakis, N.; Sokovic, M.; Ciric, A.; Barros, L.; Ferreira, I.C.F.R. Bioactive compounds content and antimicrobial activities of wild edible Asteraceae species of the Mediterranean flora under commercial cultivation conditions. Food Res. Int. 2019, 119. [Google Scholar] [CrossRef] [PubMed] [Green Version]
  29. Finimundy, T.C.; Karkanis, A.; Fernandes, Â.; Petropoulos, S.A.; Calhelha, R.; Petrović, J.; Soković, M.; Rosa, E.; Barros, L.; Ferreira, I.C.F.R. Bioactive properties of Sanguisorba minor L. cultivated in central Greece under different fertilization regimes. Food Chem. 2020, 327. [Google Scholar] [CrossRef] [PubMed]
  30. Petropoulos, S.A.; Fernandes, Â.; Dias, M.I.; Pereira, C.; Calhelha, R.C.; Ivanov, M.; Sokovic, M.D.; Ferreira, I.C.F.R.; Barros, L. The Effect of Nitrogen Fertigation and Harvesting Time on Plant Growth and Chemical Composition of Centaurea raphanina subsp. mixta (DC.) Runemark. Molecules 2020, 25, 1–21. [Google Scholar]
  31. Petropoulos, S.; Karkanis, A.; Fernandes, Â.; Barros, L.; Ferreira, I.C.F.R.; Ntatsi, G.; Petrotos, K.; Lykas, C.; Khah, E. Chemical composition and yield of six genotypes of common purslane (Portulaca oleracea L.): An alternative source of omega-3 fatty acids. Plant Foods Hum. Nutr. 2015, 70, 420–426. [Google Scholar] [CrossRef]
  32. González, J.A.; García-Barriuso, M.; Amich, F. The consumption of wild and semi-domesticated edible plants in the Arribes del Duero (Salamanca-Zamora, Spain): An analysis of traditional knowledge. Genet. Resour. Crop. Evol. 2011, 58, 991–1006. [Google Scholar] [CrossRef]
  33. Alexopoulos, A.A.; Marandos, E.; Assimakopoulou, A.; Vidalis, N.; Petropoulos, S.A.; Karapanos, I.C. Effect of Nutrient Solution pH on the Growth, Yield and Quality of Taraxacum officinale and Reichardia picroides in a Floating Hydroponic System. Agronomy 2021, 11, 1118. [Google Scholar] [CrossRef]
  34. Rao, N.S.; Shivashankara, K.S.; Laxman, R.H. Abiotic Stress Physiology of Horticultural Crops; Rao, N.S., Shivashankara, K.S., Laxman, R.H., Eds.; Springer India: New Delhi, India, 2016; ISBN 9788132227236. [Google Scholar]
  35. Hasegawa, P.M.; Bressan, R.A.; Zhu, J.-K.; Bohnert, H.J. Plant cellular and molecular responses to high salinity. Annu. Rev. Plant Physiol. Plant Mol. Biol. 2000, 51, 463–499. [Google Scholar] [CrossRef] [Green Version]
  36. Giordano, M.; Petropoulos, S.A. Response and Defence Mechanisms of Vegetable Crops against Drought, Heat and Salinity Stress. Agriculture 2021, 11, 463. [Google Scholar] [CrossRef]
  37. Giordano, M.; Petropoulos, S.A.; Cirillo, C. Biochemical, Physiological, and Molecular Aspects of Ornamental Plants Adaptation to Deficit Irrigation. Horticulturae 2021, 7, 107. [Google Scholar] [CrossRef]
  38. Parihar, P.; Singh, S.; Singh, R.; Singh, V.P.; Prasad, S.M. Effect of salinity stress on plants and its tolerance strategies: A review. Environ. Sci. Pollut. Res. 2015, 22, 4056–4075. [Google Scholar] [CrossRef] [PubMed]
  39. Parida, A.K.; Das, A.B. Salt tolerance and salinity effects on plants: A review. Ecotoxicol. Environ. Saf. 2005, 60, 324–349. [Google Scholar] [CrossRef] [PubMed]
  40. Cheeseman, J. Food Security in the Face of Salinity, Drought, Climate Change, and Population Growth. In Halophytes for Food Security in Dry Lands; Khan, M.A., Ozturk, M., Gul, B., Ahmed, M.Z., Eds.; Academic Press: Cambridge, MA, USA, 2016; pp. 111–123. ISBN 9780128018545. [Google Scholar]
  41. Correa, R.C.G.; Di Gioia, F.; Ferreira, I.; SA, P. Halophytes for Future Horticulture: The Case of Small-Scale Farming in the Mediterranean Basin. In Halophytes for Future Horticulture: From Molecules to Ecosystems towards Biosaline Agriculture; Grigore, M.-N., Ed.; Springer Nature Switzerland AG: Cham, Switzerland, 2020; pp. 1–28. ISBN 9783030178543. [Google Scholar]
  42. Alleva, K.; Niemietz, C.M.; Sutka, M.; Maurel, C.; Parisi, M.; Tyerman, S.D.; Amodeo, G. Plasma membrane of Beta vulgaris storage root shows high water channel activity regulated by cytoplasmic pH and a dual range of calcium concentrations. J. Exp. Bot. 2006, 57, 609–621. [Google Scholar] [CrossRef] [Green Version]
  43. Flowers, T.J. Improving crop salt tolerance. J. Exp. Bot. 2004, 55, 307–319. [Google Scholar] [CrossRef] [PubMed]
  44. Yu, Z.; Duan, X.; Luo, L.; Dai, S.; Ding, Z.; Xia, G. How Plant Hormones Mediate Salt Stress Responses. Trends Plant Sci. 2020, 25, 1117–1130. [Google Scholar] [CrossRef]
  45. Wu, Z.; Xue, Z.; Li, H.; Zhang, X.; Wang, X.; Lu, X. Cultivation of dandelion (Taraxacum erythropodium) on coastal saline land based on the control of salinity and fertilizer. Folia Hortic. 2019, 277–284. [Google Scholar] [CrossRef] [Green Version]
  46. Salonikioti, A.; Petropoulos, S.; Antoniadis, V.; Levizou, E.; Alexopoulos, A. Wild Edible Species with Phytoremediation Properties. Procedia Environ. Sci. 2015, 29, 98–99. [Google Scholar] [CrossRef] [Green Version]
  47. Bosiacka, B.; Mysliwy, M.; Bosiacki, M. Habitat conditions strongly affect macroand microelement concentrations in Taraxacum microspecies growing on coastal meadows along a soil salinity gradient. PeerJ 2020, 8. [Google Scholar] [CrossRef]
  48. Petropoulos, S.A.; Fernandes, Â.; Dias, M.I.; Pereira, C.; Calhelha, R.C.; Chrysargyris, A.; Tzortzakis, N.; Ivanov, M.; Sokovic, M.D.; Barros, L.; et al. Chemical composition and plant growth of Centaurea raphanina subsp. mixta plants cultivated under saline conditions. Molecules 2020, 25, 2204. [Google Scholar] [CrossRef]
  49. Kalra, Y. Handbook of Reference Methods for Plant. Analysis; CRC Press: New York, NY, USA, 1998. [Google Scholar]
  50. Boltz, D.F.; Lueck, C.H. Colorimetric Determination of Non-Metals; Interscience Publishers: New York, NY, USA, 1958. [Google Scholar]
  51. Allen, S. Chemical Analysis of Ecological Materials, 2nd ed.; Blackwell Scientific Publications: Oxford and London, UK, 1989. [Google Scholar]
  52. Cataldo, D.A.; Maroon, M.; Schrader, L.E.; Youngs, V.L. Rapid colorimetric determination of nitrate in plant tissue by nitration of salicylic acid. Commun. Soil Sci. Plant Anal. 1975, 6, 71–80. [Google Scholar] [CrossRef]
  53. Karapanos, I.; Papandreou, A.; Skouloudi, M.; Makrogianni, D.; Fernández, J.A.; Rosa, E.; Ntatsi, G.; Bebeli, P.J.; Savvas, D. Cowpea fresh pods—a new legume for the market: Assessment of their quality and dietary characteristics of 37 cowpea accessions grown in southern Europe. J. Sci. Food Agric. 2017, 97, 4343–4352. [Google Scholar] [CrossRef]
  54. Lichtenthaler, H.K.; Buschmann, C. Chlorophylls and Carotenoids: Measurement and Characterization by UV-VIS Spectroscopy. Curr. Protoc. Food Anal. Chem. 2001, 1, F4.3.1–F4.3.8. [Google Scholar] [CrossRef]
  55. Singleton, V.; Rossi, J.J. Colorimetry of Total Phenolics with Phosphomolybdic-Phosphotungstic Acid Reagents. Am. J. Enol. Vitic. 1965, 16, 144–158. [Google Scholar]
  56. Bates, L.S. Rapid determination of free proline for water-stress studies. Plant Soil 1973, 39, 205–207. [Google Scholar] [CrossRef]
  57. Uddin, M.N.; Tariqul Islam, M.; Karim, M.A. Salinity tolerance of three mustard/rapeseed cultivars. J. Bangladesh Agril. Univ. 2005, 3, 203–208. [Google Scholar]
  58. Wang, Y.; Nii, N. Changes in chlorophyll, ribulose bisphosphate carboxylase-oxygenase, glycine betaine content, photosynthesis and transpiration in Amaranthus tricolor leaves during salt stress. J. Hortic. Sci. Biotechnol. 2000, 75, 623–627. [Google Scholar] [CrossRef]
  59. El-Hendawy, S.E.; Hu, Y.; Schmidhalter, U. Growth, ion content, gas exchange, and water relations of wheat genotypes differing in salt tolerances. Aust. J. Agric. Res. 2005, 56, 123–134. [Google Scholar] [CrossRef]
  60. Chartzoulakis, K.; Klapaki, G. Response of two greenhouse pepper hybrids to NaCl salinity during different growth stages. Sci. Hortic. 2000, 86, 247–260. [Google Scholar] [CrossRef]
  61. Rangaiah, D. V High temperature and salt stress response in French bean (Phaseolus vulgaris). Aust. J. Crop. Sci. 2008, 2, 40–48. [Google Scholar]
  62. Turhan, A.; Eniz, V.; Kuşçu, H. Genotypic variation in the response of tomato to salinity. Afr. J. Biotechnol. 2009, 8, 1062–1068. [Google Scholar] [CrossRef]
  63. Ziaf, K.; Amjad, M.; Pervez, M.A.; Iqbal, Q.; Rajwana, I.A.; Ayyub, M. Evaluation of different growth and physiological traits as indices of salt tolerance in hot pepper (Capsicum annuum L.). Pak. J. Bot. 2009, 41, 1797–1809. [Google Scholar]
  64. Fageria, N.K.; Gheyi, H.R.; Moreira, A. Nutrient bioavailability in salt affected soils. J. Plant Nutr. 2011, 34, 945–962. [Google Scholar] [CrossRef]
  65. Akladious, S.A.; Mohamed, H.I. Ameliorative effects of calcium nitrate and humic acid on the growth, yield component and biochemical attribute of pepper (Capsicum annuum) plants grown under salt stress. Sci. Hortic. 2018, 236, 244–250. [Google Scholar] [CrossRef]
  66. Ryu, H.; Cho, Y.G. Plant hormones in salt stress tolerance. J. Plant Biol. 2015, 58, 147–155. [Google Scholar] [CrossRef]
  67. Shannon, M.C.; Grieve, C.M. Tolerance of vegetable crops to salinity. HortScience 1999, 78, 5–38. [Google Scholar] [CrossRef]
  68. Sergio, L.; de Paola, A.; Cantore, V.; Pieralice, M.; Cascarano, N.A.; Bianco, V.V.; Di Venere, D. Effect of salt stress on growth parameters, enzymatic antioxidant system, and lipid peroxidation in wild chicory (Cichorium intybus L.). Acta Physiol. Plant 2012, 34, 2349–2358. [Google Scholar] [CrossRef]
  69. Ksouri, R.; Ksouri, W.M.; Jallali, I.; Debez, A.; Magné, C.; Hiroko, I.; Abdelly, C. Medicinal halophytes: Potent source of health promoting biomolecules with medical, nutraceutical and food applications. Crit. Rev. Biotechnol. 2012, 32, 289–326. [Google Scholar] [CrossRef] [PubMed]
  70. Assimakopoulou, A.; Salmas, I.; Roussos, P.A.; Nifakos, K.; Kalogeropoulos, P.; Kostelenos, G. Salt tolerance evaluation of nine indigenous Greek olive cultivars. J. Plant Nutr. 2017, 40, 1099–1110. [Google Scholar] [CrossRef]
  71. Pérez-Alfocea, F.; Balibrea, M.E.; Santa Cruz, A.; Estañ, M.T. Agronomical and physiological characterization of salinity tolerance in a commercial tomato hybrid. Plant Soil 1996, 180, 251–257. [Google Scholar] [CrossRef]
  72. Zhou, J.; Li, Z.; Xiao, G.; Zhai, M.; Pan, X.; Huang, R.; Zhang, H. CYP71D8L is a key regulator involved in growth and stress responses by mediating gibberellin homeostasis in rice. J. Exp. Bot. 2020, 71, 1160–1170. [Google Scholar] [CrossRef] [PubMed]
  73. Iqbal, N.; Umar, S.; Khan, N.A.; Khan, M.I.R. A new perspective of phytohormones in salinity tolerance: Regulation of proline metabolism. Environ. Exp. Bot. 2014, 100, 34–42. [Google Scholar] [CrossRef]
  74. Mohamed, H.I.; Akladious, S.A.; Ashry, N.A. Evaluation of Water Stress Tolerance of Soybean Using Physiological Parameters and Retrotransposon-Based Markers. Gesunde Pflanz. 2018, 70, 205–215. [Google Scholar] [CrossRef]
  75. Maggini, R.; Benvenuti, S.; Leoni, F.; Pardossi, A. Terracrepolo (Reichardia picroides (L.) Roth.): Wild food or new horticultural crop? Sci. Hortic. 2018, 240, 224–231. [Google Scholar] [CrossRef]
  76. Pessarakli, M.; Tucker, T.C. Dry Matter Yield and Nitrogen-15 Uptake by Tomatoes under Sodium Chloride Stress. Soil Sci. Soc. Am. J. 1988, 52, 698–700. [Google Scholar] [CrossRef]
  77. Camalle, M.; Standing, D.; Jitan, M.; Muhaisen, R.; Bader, N.; Bsoul, M.; Ventura, Y.; Soltabayeva, A.; Sagi, M. Effect of salinity and nitrogen sources on the leaf quality, biomass, and metabolic responses of two ecotypes of Portulaca oleracea. Agronomy 2020, 10, 656. [Google Scholar] [CrossRef]
  78. Ashraf, M.; Shahzad, S.M.; Imtiaz, M.; Rizwan, M.S. Salinity effects on nitrogen metabolism in plants–focusing on the activities of nitrogen metabolizing enzymes: A review. J. Plant Nutr. 2018, 41, 1065–1081. [Google Scholar] [CrossRef]
  79. Pizzorno, L. 203-Osteoporosis, 5th ed.; Pizzorno, J.E., Murray, M.T., Eds.; Churchill Livingstone: St. Louis, MO, USA, 2020; pp. 1633–1658.e17. ISBN 978-0-323-52342-4. [Google Scholar]
  80. Assimakopoulou, A.; Nifakos, K.; Salmas, I.; Kalogeropoulos, P. Growth, Ion Uptake, and Yield Responses of Three Indigenous Small-Sized Greek Tomato (Lycopersicon esculentum L.) Cultivars and Four Hybrids of Cherry Tomato under NaCl Salinity Stress. Commun. Soil Sci. Plant Anal. 2015, 46, 2357–2377. [Google Scholar] [CrossRef]
  81. Grattan, S.R.; Grieve, C.M. Salinity-mineral nutrient relations in horticultural crops. Sci. Hortic. 1998, 78, 127–157. [Google Scholar] [CrossRef]
  82. Villora, G.; Moreno, D.A.; Pulgar, G.; Romero, L. Salinity affects phosphorus uptake and partitioning in zucchini. Commun. Soil Sci. Plant Anal. 2000, 31, 501–507. [Google Scholar] [CrossRef]
  83. Tang, H.; Niu, L.; Wei, J.; Chen, X.; Chen, Y. Phosphorus limitation improved salt tolerance in maize through tissue mass density increase, osmolytes accumulation, and Na+ uptake inhibition. Front. Plant Sci. 2019, 10. [Google Scholar] [CrossRef] [PubMed] [Green Version]
  84. Rus, A.; Lee, B.H.; Muñoz-Mayor, A.; Sharkhuu, A.; Miura, K.; Zhu, J.K.; Bressan, R.A.; Hasegawa, P.M. AtHKT1 facilitates Na+ homeostasis and K+ nutrition in planta. Plant Physiol. 2004, 136, 2500–2511. [Google Scholar] [CrossRef] [PubMed] [Green Version]
  85. Mansour, M.; Van Hasselt, P.; Kuiper, P. NaCl effects on root plasma membrane ATPase of salt tolerant wheat. Biol. Plant. 2000, 43, 61–66. [Google Scholar] [CrossRef]
  86. Zhang, J.L.; Flowers, T.J.; Wang, S.M. Mechanisms of sodium uptake by roots of higher plants. Plant Soil 2010, 326, 45–60. [Google Scholar] [CrossRef]
  87. Shibli, R.A.; Sawwan, J.; Swaidat, I.; Tahat, M. Increased phosphorus mitigates the adverse effects of salinity in tissue culture. Commun. Soil Sci. Plant Anal. 2001, 32, 429–440. [Google Scholar] [CrossRef]
  88. Essa, T.A. Effect of Salinity Stress on Growth and Nutrient Composition of Three Soybean (Glycine max L. Merrill) Cultivars. J. Agron. Crop. Sci. 2002, 188, 86–93. [Google Scholar] [CrossRef]
  89. Weisany, W.; Sohrabi, Y.; Heidari, G.; Siosemardeh, A.; Badakhshan, H. Effects of Zinc Application on Growth, Absorption and Distribution of Mineral Nutrients under Salinity Stress in Soybean (Glycine max L.). J. Plant Nutr. 2014, 37, 2255–2269. [Google Scholar] [CrossRef]
  90. Assimakopoulou, A.; Salmas, I.; Nifakos, K.; Kalogeropoulos, P. Effect of salt stress on Three Green Bean (Phaseolus vulgaris L.) Cultivars. Not. Bot. Horti Agrobot. Cluj-Napoca 2015, 43, 113–118. [Google Scholar] [CrossRef] [Green Version]
  91. Semiz, G.D.; Suarez, D.L.; Ünlükara, A.; Yurtseven, E. Interactive Effects of Salinity and N on Pepper (Capsicum annuum L.) Yield, Water Use Efficiency and Root Zone and Drainage Salinity. J. Plant Nutr. 2014, 37, 595–610. [Google Scholar] [CrossRef]
  92. Shahid, M.A.; Sarkhosh, A.; Khan, N.; Balal, R.M.; Ali, S.; Rossi, L.; Gómez, C.; Mattson, N.; Nasim, W.; Garcia-Sanchez, F. Insights into the physiological and biochemical impacts of salt stress on plant growth and development. Agronomy 2020, 10, 938. [Google Scholar] [CrossRef]
  93. Stallings, V.A.; Harrison, M.; Oria, M. Dietary Reference Intakes for Sodium and Potassium; Stallings, V.A., Harrison, M., Oria, M., Eds.; The National Academies Press: Washington, DC, USA, 2019. [Google Scholar]
  94. Jiang, Z.; Zhou, X.; Tao, M.; Yuan, F.; Liu, L.; Wu, F.; Wu, X.; Xiang, Y.; Niu, Y.; Liu, F.; et al. Plant cell-surface GIPC sphingolipids sense salt to trigger Ca2+ influx. Nature 2019, 572, 341–346. [Google Scholar] [CrossRef] [PubMed]
  95. Bolarín, M.C.; Fernández, F.G.; Cruz, V.; Cuartero, J. Salinity Tolerance in Four Wild Tomato Species using Vegetative Yield-Salinity Response Curves. J. Am. Soc. Hortic. Sci. 2019, 116, 286–290. [Google Scholar] [CrossRef] [Green Version]
  96. Subbarao, G.V.; Johansen, C.; Jana, M.K.; Kumar Rao, J.V.D.K. Effects of the Sodium/Calcium Ratio in Modifying Salinity Response of Pigeonpea (Cajanus cajan). J. Plant Physiol. 1990, 136, 439–443. [Google Scholar] [CrossRef]
  97. Hunt, C.D.; Johnson, L.A.K. Calcium requirements: New estimations for men and women by cross-sectional statistical analyses of calcium balance data from metabolic studies. Am. J. Clin. Nutr. 2007, 86, 1054–1063. [Google Scholar] [CrossRef]
  98. Onodera, M.; Nakajima, T.; Nanzyo, M.; Takahashi, T.; Xu, D.; Homma, K.; Kokubun, M. Regulation of root-to-leaf Na and Cl transport and its association with photosynthetic activity in salt-tolerant soybean genotypes. Plant Prod. Sci. 2019, 22, 262–274. [Google Scholar] [CrossRef] [Green Version]
  99. Cai, Z.Q.; Gao, Q. Comparative physiological and biochemical mechanisms of salt tolerance in five contrasting highland quinoa cultivars. BMC Plant Biol. 2020, 20, 1–15. [Google Scholar] [CrossRef] [Green Version]
  100. EFSA. Dietary Reference Values for chloride. EFSA J. 2019, 17, e05779. [Google Scholar]
  101. Almeida, D.M.; Margarida Oliveira, M.; Saibo, N.J.M. Regulation of Na+ and K+ homeostasis in plants: Towards improved salt stress tolerance in crop plants. Genet. Mol. Biol. 2017, 40, 326–345. [Google Scholar] [CrossRef] [PubMed] [Green Version]
  102. Bingham, F.T.; Strong, J.E.; Rhoades, J.D.; Keren, R. Effects of salinity and varying boron concentrations on boron uptake and growth of wheat. Plant Soil 1987, 351, 345–351. [Google Scholar] [CrossRef]
  103. Hasana, R.; Miyake, H. Salinity Stress Alters Nutrient Uptake and Causes the Damage of Root and Leaf Anatomy in Maize. KnE Life Sci. 2017, 3, 219. [Google Scholar] [CrossRef] [Green Version]
  104. Rahman, S.; Vance, G.F.; Munn, L.C. Salinity Induced Effects on the Nutrient Status of Soil, Corn Leaves and Kernels. Commun. Soil Sci. Plant Anal. 1993, 24, 2251–2269. [Google Scholar] [CrossRef]
  105. Izzo, R.; Navari-Izzo, F.; Quartacci, M.F. Growth and mineral absorption in maize seedlings as affected by increasing NaCl concentrations. J. Plant Nutr. 1991, 14, 687–699. [Google Scholar] [CrossRef]
  106. Shibli, R.A.; Kushad, M.; Yousef, G.G.; Lila, M.A. Physiological and biochemical responses of tomato microshoots to induced salinity stress with associated ethylene accumulation. Plant Growth Regul. 2007, 51, 159–169. [Google Scholar] [CrossRef]
  107. Neocleous, D.; Koukounaras, A.; Siomos, A.S.; Vasilakakis, M. Assessing the Salinity Effects on Mineral Composition and Nutritional Quality of Green and Red “Baby” Lettuce. J. Food Qual. 2014, 37, 1–8. [Google Scholar] [CrossRef]
  108. Fatemi, H.; Carvajal, M.; Rios, J.J. Foliar application of Zn alleviates salt stress symptoms of pak choi plants by activating water relations and glucosinolate synthesis. Agronomy 2020, 10, 1528. [Google Scholar] [CrossRef]
  109. Cakmak, I. Tansley Review No. 111 Possible roles of zinc in protecting plant cells from damage by reactive oxygen species. New Phytol. 2000, 146, 185–205. [Google Scholar] [CrossRef]
  110. Ashraf, M.; Foolad, M.R. Roles of glycine betaine and proline in improving plant abiotic stress resistance. Environ. Exp. Bot. 2007, 59, 206–216. [Google Scholar] [CrossRef]
  111. Dar, M.I.; Naikoo, M.I.; Rehman, F.; Naushin, F.; Khan, F.A. Proline Accumulation in Plants: Roles in Stress Tolerance and Plant Development BT-Osmolytes and Plants Acclimation to Changing Environment: Emerging Omics Technologies. In Osmolytes and Plants Acclimation to Changing Environment: Emerging Omics Technologies; Iqbal, N., Nazar, R., A. Khan, N., Eds.; Springer India: New Delhi, India, 2016; pp. 155–166. ISBN 978-81-322-2616-1. [Google Scholar]
  112. Hayat, S.; Hayat, Q.; Alyemeni, M.N.; Wani, A.S.; Pichtel, J.; Ahmad, A. Role of proline under changing environments: A review. Plant Signal. Behav. 2012, 7, 1456–1466. [Google Scholar] [CrossRef] [Green Version]
  113. Xue, X.; Liu, A.; Hua, X. Proline accumulation and transcriptional regulation of proline biothesynthesis and degradation in Brassica napus. BMB Rep. 2009, 42, 28–34. [Google Scholar] [CrossRef] [Green Version]
  114. Chou, I.T.; Chen, C.T.; Kao, C.H. Characteristics of the induction of the accumulation of proline by abscisic acid and isobutyric acid in detached rice leaves. Plant Cell Physiol. 1991, 32, 269–272. [Google Scholar] [CrossRef]
  115. Slabbert, M.M.; Krüger, G.H.J. Antioxidant enzyme activity, proline accumulation, leaf area and cell membrane stability in water stressed Amaranthus leaves. S. Afr. J. Bot. 2014, 95, 123–128. [Google Scholar] [CrossRef] [Green Version]
  116. Saleh, A.A.H. Amelioration of Chilling Injuries in Mung Bean (Vigna radiata L.) Seedlings by Paclobutrazol, Abscisic Acid and Hydrogen Peroxide. Am. J. Plant Physiol. 2007, 2, 318–332. [Google Scholar] [CrossRef] [Green Version]
  117. Xu, C.; Mou, B. Responses of spinach to salinity and nutrient deficiency in growth, physiology, and nutritional value. J. Am. Soc. Hortic. Sci. 2016, 141, 12–21. [Google Scholar] [CrossRef] [Green Version]
  118. Chatzigianni, M.; Alkhaled, B.; Livieratos, I.; Stamatakis, A.; Ntatsi, G.; Savvas, D. Impact of nitrogen source and supply level on growth, yield and nutritional value of two contrasting ecotypes of Cichorium spinosum L. grown hydroponically. J. Sci. Food Agric. 2017, 98, 1615–1624. [Google Scholar] [CrossRef]
  119. Colonna, E.; Rouphael, Y.; Barbieri, G.; De Pascale, S. Nutritional quality of ten leafy vegetables harvested at two light intensities. Food Chem. 2016, 199, 702–710. [Google Scholar] [CrossRef]
  120. Singh, H.; Dunn, B.; Payton, M.; Brandenberger, L. Fertilizer and cultivar selection of lettuce, Basil, and Swiss chard for hydroponic production. Horttechnology 2019, 29, 50–56. [Google Scholar] [CrossRef] [Green Version]
  121. Rouphael, Y.; Petropoulos, S.A.; Cardarelli, M.; Colla, G. Salinity as eustressor for enhancing quality of vegetables. Sci. Hortic. 2018, 234, 361–369. [Google Scholar] [CrossRef]
  122. Pérez-López, U.; Miranda-Apodaca, J.; Lacuesta, M.; Mena-Petite, A.; Muñoz-Rueda, A. Growth and nutritional quality improvement in two differently pigmented lettuce cultivars grown under elevated CO2 and/or salinity. Sci. Hortic. 2015, 195, 56–66. [Google Scholar] [CrossRef]
  123. Petersen, K.K.; Willumsen, J.; Kaack, K. Composition and taste of tomatoes as affected by increased salinity and different salinity sources. J. Hortic. Sci. Biotechnol. 1998, 73, 205–215. [Google Scholar] [CrossRef]
  124. Zhao, J.; Davis, L.C.; Verpoorte, R. Elicitor signal transduction leading to production of plant secondary metabolites. Biotechnol. Adv. 2005, 23, 283–333. [Google Scholar] [CrossRef]
  125. Klados, E.; Tzortzakis, N. Effects of substrate and salinity in hydroponically grown Cichorium spinosum. J. Soil Sci. Plant Nutr. 2014, 14, 211–222. [Google Scholar] [CrossRef] [Green Version]
  126. Garrido, Y.; Tudela, J.A.; Marín, A.; Mestre, T.; Martínez, V.; Gil, M.I. Physiological, phytochemical and structural changes of multi-leaf lettuce caused by salt stress. J. Sci. Food Agric. 2014, 94, 1592–1599. [Google Scholar] [CrossRef]
  127. Kim, H.J.; Fonseca, J.M.; Choi, J.H.; Kubota, C.; Dae, Y.K. Salt in irrigation water affects the nutritional and visual properties of romaine lettuce (Lactuca sativa L.). J. Agric. Food Chem. 2008, 56, 3772–3776. [Google Scholar] [CrossRef]
  128. Gent, M.P.N. Composition of hydroponic lettuce: Effect of time of day, plant size, and season. J. Sci. Food Agric. 2012, 92, 542–550. [Google Scholar] [CrossRef]
  129. Bonasia, A.; Lazzizera, C.; Elia, A.; Conversa, G. Nutritional, biophysical and physiological characteristics of wild rocket genotypes as affected by soilless cultivation system, salinity level of nutrient solution and growing period. Front. Plant Sci. 2017, 8, 1–15. [Google Scholar] [CrossRef] [Green Version]
  130. Cantabella, D.; Piqueras, A.; Acosta-Motos, J.R.; Bernal-Vicente, A.; Hernández, J.A.; Díaz-Vivancos, P. Salt-tolerance mechanisms induced in Stevia rebaudiana Bertoni: Effects on mineral nutrition, antioxidative metabolism and steviol glycoside content. Plant Physiol. Biochem. 2017, 115, 484–496. [Google Scholar] [CrossRef]
  131. Santamaria, P. Nitrate in vegetables: Toxicity, content, intake and EC regulation. J. Sci. Food Agric. 2006, 86, 10–17. [Google Scholar] [CrossRef]
  132. Kafkafi, U.; Yaeesh Siddiqi, M.; Ritchie, R.J.; Glass, A.D.M.; Ruth, T.J. Reduction of nitrate (13no3) influx and nitrogen (13n) translocation by tomato and melon varieties after short exposure to calcium and potassium chloride salts. J. Plant Nutr. 1992, 15, 959–975. [Google Scholar] [CrossRef]
  133. Abdelgadir, E.M.; Oka, M.; Fujiyama, H. Characteristics of nitrate uptake by plants under salinity. J. Plant Nutr. 2005, 28, 33–46. [Google Scholar] [CrossRef]
  134. Rameeh, V.; Rezai, A.; Saeidi, G. Study of salinity tolerance in rapeseed. Commun. Soil Sci. Plant Anal. 2004, 35, 2849–2866. [Google Scholar] [CrossRef]
Figure 1. Leaf proline content (μmole proline/g FW) of R. picroides and T. officinale plants grown under different nutrient solution electrical conductivities (2, 6 and 10 mS cm−1). Different lowercase and capital Latin letters indicate significant differences between salinity treatments for Recihardia picroides and Taraxacum officinale plants, respectively, according to the least significant difference (LSD) test (p < 0.05).
Horticulturae 07 00160 g001
Table 1. Growth parameters of R. picroides plants grown under different nutrient solution EC (2, 6 and 10 mS cm−1).
EC
(mS cm−1)
Leaf Number Plant−1Rosette Diameter (cm)Nonmarketable Leaf
Number Plant−1
SPAD IndexMaximum Leaf Length (cm)Maximum Leaf Width (cm)
2.032.28 b *35.56 b2.18 a 49.94 a18.41 b2.79 b
6.040.65 c28.60 b2.60 a54.61 a14.63 b2.48 b
10.024.75 a17.32 a1.93 a52.11 a8.97 a1.86 a
EC
(mS cm−1)
Total Plant FW (kg m−2)Upper Plant Part FW
(kg m−2)
Root
FW (kg m−2)
Root/Shoot RatioMarketable Leaves FW
(kg m−2)
Leaf
DMC (%)
2.01.40 b1.12 b0.27 a0.25 a0.99 b9.23 b
6.01.68 b1.30 b0.37 a0.29 a1.13 b7.89 a
10.00.96 a0.72 a0.23 a0.32 a0.62 a8.63 ab
* Means within the same column followed by the same letter do not differ significantly based on the least significant difference (LSD) at p < 0.05.
Table 2. Growth parameters of T. officinale plants grown under different nutrient solution EC (2, 6 and 10 mS cm−1).
EC
(mS cm−1)
Leaf Number Plant−1Rosette Diameter (cm)Nonmarketable Leaf Number Plant−1SPAD IndexMaximum Leaf Length (cm)Maximum Leaf Width (cm)
2.031.00 b *37.60 b1.80 a42.40 a19.15 b6.28 b
6.013.96 a18.73 a1.78 a42.59 a9.62 a3.41 a
10.016.09 a19.98 a1.62 a39.34 a10.41 a3.81 a
EC
(mS cm−1)
Total Plant FW (kg m−2)Upper Plant Part FW
(kg m−2)
Root
FW (kg m−2)
Root/Shoot RatioMarketable Leaves FW
(kg m−2)
Leaf DMC (%)
2.01.37 b1.01 b0.35 b0.35 a0.90 b11.59 a
6.00.35 a0.23 a0.12 a0.52 b0.20 a15.16 b
10.00.44 a0.29 a0.15 a0.53 b0.21 a15.14 b
* Means within the same column followed by the same letter do not differ significantly based on the least significant difference (LSD) test at p < 0.05.
Table 3. Leaf nutrient concentrations of R. picroides and T. officinale plants grown under different nutrient solution EC (2, 6 and 10 mS cm−1).
LeafNPKCaMgNaClFeMnZnCuBK/NaCa/Na
% leaf DWmg kg−1 leaf DW
EC (mS cm−1)Reichardia picroides
2.04.25 a *0.77 a7.04 c0.90 b0.20 b0.55 a0.82 a60.0 a42.9 a37.5 a4.8 a143.2 b12.7 b1.63 b
6.04.37 a1.04 b4.49 b0.72 a0.16 a3.68 b1.09 a57.2 a46.2 a65.7 b3.5 a138.2 ab1.23 a0.19 a
10.05.12 b1.29 c3.66 a0.63 a0.16 a4.02 c1.79 b55.6 a71.6 b75.4 c4.5 a129.1 a0.91 a0.16 a
Taraxacum officinale
2.04.77 b1.16 a5.48 b0.92 b0.33 c0.05 a0.53 a77.2 ab30.7 a39.1 a6.8 a46.8 a137.4 b23.18 b
6.04.81 b1.37 b3.02 a0.75 a0.26 a2.00 b0.99 b68.5 a23.7 a45.8 ab6.1 a35.0 a1.51 a0.38 a
10.04.17 a1.69 c2.99 a0.83 ab0.29 b3.84 c1.58 c90.0 b31.9 a50.3 b5.7 a38.8 a0.78 a0.22 a
* Means within the same column followed by the same letter do not differ significantly based on the least significant difference (LSD) test at p < 0.05.
Table 4. Root nutrient concentrations at harvest date of R. picroides and T. officinale plants grown under different nutrient solution EC (2, 6 and 10 mS cm−1).
RootPKCaMgNaFeMnZnCuB
% leaf DWmg kg−1 leaf DW
EC (dS m−1)Reichardia picroides
2.01.04 a *5.98 b0.37 a0.17 b0.19 a221.8 a60.3 a84.2 b15.1 a14.1 a
6.01.46 b5.35 a0.33 a0.15 ab1.02 b385.9 b46.2 a 98.8 c16.7 a15.4 a
10.01.67 c5.00 a0.41 a0.14 a1.22 b257.8 a55.5 a62.8 a14.9 a17.4 a
Taraxacum officinale
2.01.47 b5.27 b0.46 a0.18 a0.11 a162.1 a16.3 a50.8 a15.5 b16.7 a
6.01.18 a4.01 a0.43 a0.17 a0.71 b158.5 a16.7 a44.6 a10.7 a21.7 b
10.01.28 ab3.62 a0.51 a0.17 a1.20 c157.3 a20.0 a44.6 a9.4 a15.6 a
* Means within the same column followed by the same letter do not differ significantly based on the least significant difference (LSD) test at p < 0.05.
Table 5. Chlorophyll (a, b and total), carotenoids+xanthophylls, total phenolics, total soluble solids content (TSSC), titratable acidity (TA) and leaf nitrate content of Reichardia picroides and Taraxacum officinale grown under different nutrient solution EC (2, 6 and 10 mS cm−1).
Nutrient Solution ECChlorophyll aChlorophyll bTotal Chlorophyll Carotenoids+
Xanthophylls
Total PhenolicsTSSCTANitrate Content
EC (dS m−1)mg/100 g leaf FWmg GAE/100 g leaf FW0 Brixg malic acid/100 g leaf FWmg/kg leaf FW
Reichardia picroides
241.0 a *18.7 a59.6 a7.08 a113.6 b5.00 a0.16 a5509.8 ab
641.6 a19.0 a60.6 a7.21 a100.9 b4.58 a0.17 a6877.6 b
1041.4 a18.3 a59.7 a7.01 a62.2 a4.73 a0.22 b4586.9 a
Taraxacum officinale
277.7 a38.2 a115.9 a12.3 a79.6 a5.50 a0.16 a2410.5 b
682.4 a39.6 a122.0 a13.2 a91.6 a6.10 a0.20 ab885.7 a
1087.0 a43.0 a130.0 a13.5 a95.8 a5.85 a0.22 b597.7 a
* Means within the same column followed by the same letter do not differ significantly based on the least significant difference (LSD) test at p < 0.05.
Publisher’s Note: MDPI stays neutral with regard to jurisdictional claims in published maps and institutional affiliations.

