Article

Transcriptome Co-Expression Network Analysis Identifies Key Genes and Regulators of Sweet Cherry Anthocyanin Biosynthesis

1
School of Food Engineering, Ludong University, Yantai 264025, China
2
BioNanotechnology Institute, Ludong University, Yantai 264025, China
3
Cherry Research Department, Yantai Agricultural Science and Technology Institute, No. 26, West Gangcheng Street, Yantai 265500, China
*
Author to whom correspondence should be addressed.
Horticulturae 2021, 7(6), 123; https://doi.org/10.3390/horticulturae7060123
Submission received: 23 April 2021 / Revised: 16 May 2021 / Accepted: 17 May 2021 / Published: 24 May 2021
(This article belongs to the Collection Advances in Fruit Quality Formation and Regulation)

Abstract

:
Anthocyanin is the key factor that results in the attractive color of sweet cherry fruits. However, information regarding sweet cherry coloration and the potential mechanisms underlying anthocyanin biosynthesis is limited. In this study, we found that the anthocyanin accumulation varied in sweet cherry flesh and peel, while the anthocyanin content increased sharply in the dark red (DR) stage. Correlations between anthocyanin concentrations and RNA sequencing (RNA-seq), constructed with Weighted Gene Co-Expression Network Analysis (WGCNA), indicated that two structural genes (Pac4CL2, PacANS) and 11 transcription factors (PacbHLH13/74, PacDIV, PacERF109/115, PacGATA8, PacGT2, PacGTE10, PacMYB308, PacPosF21, and PacWRKY7) had similar expression patterns with the changes in anthocyanin content. Additionally, real-time PCR verified all of these gene expression patterns and revealed that PacANS exhibited the highest transcription level. In order to search for potential regulators for anthocyanin biosynthesis, a dual-luciferase assay was performed to investigate the regulatory activities of 11 transcription factors on the PacANS promoter. The results revealed that two novelty bHLHs, PacbHLH13 and PacbHLH74, can trans-activate the PacANS promoter and they might be the candidate genes for regulating anthocyanin synthesis in sweet cherry fruits. The present findings provide a novel viewpoint with regard to anthocyanin biosynthesis mechanisms and the regulatory transcriptional network of fruit coloration in sweet cherries.

1. Introduction

Anthocyanin is an important water-soluble natural pigment, which belongs to the group of polyphenols and contributes to the scarlet, orange, violet, and blue coloration of various plant tissues [1,2]. The appealing coloration of flowers makes them attractive to pollinators and dispersers [1]. Moreover, the level of fruit coloration plays a pivotal role in evaluating their sensory and nutritional value, serving as an indicator of fruit ripeness and quality, and further influencing consumers’ desire to purchase fruits [3]. In addition to various colors, anthocyanins also have a series of positive effects on human health. There have been many studies revealing that anthocyanin accumulation can not only achieve antioxidant effects by scavenging free radicals [4], but that it can also act as a health-promoting factor preventing cardiovascular diseases, some cancers, and protecting the liver [5,6].
Anthocyanin has been reported to be synthesized via a specific branch of the phenylpropanoid pathway, and there are three main stages that are involved in anthocyanin biosynthesis [2,7]. In the primary stage, the phenylpropanoid metabolic pathway is responsible for the production of precursor substrates, being regulated by phenylalanine ammonia-lyase (PAL), cinnamate-4-hydroxylase (C4H), and 4-coumarate-CoA ligase (4CL). In the second step, the early biosynthesis genes, including chalcone synthase (CHS), chalcone isomerase (CHI), and flavanone 3-hydroxylase (F3H), are involved in the precursor synthesis for flavonol and anthocyanin. Regarding the final stage, the specific processes of anthocyanin coloration and modification are influenced by the late biosynthetic genes, such as dihydroflavonol 4-reductase (DFR), anthocyanidin synthase/leucoanthocyanidin dioxygenase (ANS/LDOX), and UDP-glucose: flavonoid-3-O-glucosyltransferase (UFGT). Many structural anthocyanin biosynthesis genes have been isolated and verified in different species; for example, the expression of DFR was significantly correlated with anthocyanin accumulation in tomato [8]. In kiwifruit, AaLDOX was identified as a pivotal gene controlling the accumulation of anthocyanin [9]. Moreover, in apple and red-skinned pear, the ANS and UFGT genes participated in anthocyanin biosynthesis, acting as the decisive genes [10,11].
Previous studies have demonstrated that the accumulation of anthocyanins is also highly correlated with the regulation of transcription factors (TFs), particularly the DNA-binding R2R3-MYB factors, such as MdMYB10 and MdMYB6 in apple [12,13], VvmybA1 and VvMYB114 in grape [14,15], and PavMYB10.1 in sweet cherry [16]. In addition, several bHLHs (basic helix–loop–helixes) have been demonstrated to control anthocyanin pigment synthesis. For example, FvbHLH9 functioned as a positive regulator of anthocyanin biosynthesis in strawberry [17]. MdbHLH3 bound to the promoters of MdDFR, MdUFGT, and MdMYB1 to activate their expression in apple [18]. Furthermore, MYBs often partner with bHLH to form the MBW (MYB–bHLH–WD40) complex and participate in anthocyanin production. In apple, MdMYB308L interacted with MdbHLH33 to enhance the binding to the MdDFR promoter [19]. The LcMYB1–LcbHLH complex regulated the expression of DFR and ANS during anthocyanin accumulation in litchi [20]. In kiwifruit, the combinatorial action of AcMYB123 and AcbHLH42 played an essential role in activating the AcANS and AcF3GT1 promoters [21]. In addition to the MYB, bHLH, and MBW complex, several other TFs have been reported to be involved in the synthesis of anthocyanin in fruit crops, such as DIV, GT2/5, and GTE7 in strawberry [22], PyWRKY26/PyWRKY31 in red-skinned pears [23], NAC in peach [24], MADS-box in bilberry fruits [25], and MdERF38 in apple [26].
Sweet cherry (Prunus avium L.) is an economically important horticultural crop, which is extensively distributed in temperate regions worldwide. Sweet cherry fruits are found in a range of hues, from green and yellow to initial red and dark red [27]. The red-colored flesh and skin of sweet cherry fruits are mostly attributed to anthocyanin accumulation [28]. In sweet cherry fruits, six biosynthetic anthocyanin genes (PacCHS, PacCHI, PacF3H, PacDFR, PacANS, and PacUFGT) were analyzed by real-time PCR, showing that they were significantly correlated with anthocyanin synthesis in ‘Hong Deng’ sweet cherry [28]. When compared to the bicolored cherry cultivar, the expression levels of ANS and CHS were much higher in the red cherry cultivar [28,29]. Regarding the transcriptional level, PacMYBA has been suggested to play an important role in anthocyanin biosynthesis in ‘Hong Deng’ sweet cherry, and PacMYBA can physically interact with bHLHs to activate the PacDFR, PacANS, and PacUFGT promoters [27]. Similarly, PabHLH3 was revealed to promote MYB-induced anthocyanin synthesis, while PabHLH33 had strong inhibitory properties [30]. Sooriyapathirana et al. [31] demonstrated that PavMYB10 may be a major determining factor for fruit coloration using quantitative trait locus (QTL) analysis. Jin et al. [16] further confirmed that PavMYB10.1, together with the PavbHLH and PavWD40 proteins, formed an MBW activation complex, activated PavANS and PavUFGT transcription, and controlled anthocyanin biosynthesis and fruit coloration in sweet cherry. PavMYB10.1 has been used as a reliable molecular DNA marker for selecting the skin color of sweet cherries [16].
The molecular mechanism of anthocyanin biosynthesis has been frequently and extensively studied in many fruits, including apple [12,13,19], grape [15], pear [11,23], and kiwifruit [21]. However, in sweet cherry, the molecular control of red coloration (anthocyanin) has rarely been investigated with regard to fruit skin and flesh color. With the exception of the MBW complex, few TFs have been involved in anthocyanin biosynthetic research, meaning that the biosynthetic and regulatory anthocyanin mechanisms that occur during the coloration of sweet cherry are still unclear. In this study, we determined the anthocyanin content in different tissues (peel and flesh) to analyze anthocyanin biosynthesis in the red-colored sweet cherry cultivar ‘Hong Deng’ during two ripening stages: initial red (IR, 33 days after full bloom, DAFB) and dark red (DR, 48 DAFB). Meanwhile, using RNA-seq (RNA sequencing) and WGCNA (Weighted Gene Co-Expression Network Analysis), we identified 13 differentially expressed genes (DEGs) that may be the key candidate genes that are involved in sweet cherry fruit coloration, including two anthocyanin synthesis genes (PacANS, Pac4CL2) and 11 TFs that belong to nine different families (bHLH, MYB, DIV, WRKY, ERF, GT, PosF, GTE, GATA). All of these DEGs were expressed significantly earlier and at higher concentrations in peel as compared with flesh, and they were positively and closely associated with anthocyanin accumulation during red color development in sweet cherry. Additionally, we found that PacbHLH13 and PacbHLH74 have both not been reported in sweet cherry, but that they can regulate the PacANS promoter. These results not only suggest that bHLHs are important regulators of anthocyanin biosynthesis in sweet cherry, but they also provide insights into the molecular mechanisms of anthocyanin biosynthesis.

2. Materials and Methods

2.1. Plant Material

The red-colored sweet cherry (Prunus avium L. cv. Hong Deng) used to study color traits in this work was collected in 2019. The cherries were cultivated under field conditions at Yantai Agricultural Science and Technology Institute, Shandong, China. Uniformly sized fruit samples without visible defects were harvested at different developmental stages (33 and 48 DAFB). The skin and flesh, as the samples, were separated in all of the experiments. The entire skin (approximately 1 mm) was peeled; meanwhile, the entirety of the flesh was cut and collected. Each sample point comprised 30 fruits in three replicates, while each replicate contained 10 fruits. Small pieces of flesh and skin were frozen in liquid nitrogen and then stored at −80 °C for further analysis.

2.2. Anthocyanin Determination

Total anthocyanins, which were calculated as cyanidin-3-galactoside, were measured using a differential pH method with two buffer systems, one with 0.4 M potassium chloride buffer (pH 1.0), and the other with 0.4 M dibasic sodium phosphate buffer (pH 4.5). The frozen samples were ground in liquid nitrogen and a total of 0.5 g was transferred to a 10 mL vial containing 2.5 mL 0.01% hydrochloric acid–methanol solution. After 24 h of extraction at 4 °C in the dark, the mixtures were centrifuged at 12000 rpm for 20 min. The absorbance of the solutions was measured with a UV-723N spectrophotometer (Youke, Shanghai, China) at 510 and 700 nm in buffers at pH 1.0 and 4.5. The total anthocyanin content was calculated using A = [(A510 − A700) pH 1.0 − (A5102013 − A700) pH 4.5] with a cyanidin-3-galactoside molar extinction coefficient of 30,200 (L/mol∙cm) and molecular weight of 445.2 (Da). The results are expressed as mg cyanidin-3-galactoside equivalents per 100 g fresh weight (FW). In total, three biological replicates from each of the stages and parts were analyzed.

2.3. RNA Extraction and RNA-Seq

The total RNA was extracted from various frozen samples according to the manufacturer’s instructions while using the RNAprep Pure Plant Plus Kit (TIANGEN, Beijing, China). Each reaction was performed in biological triplicate. RNA-seq and bioinformatics analyses were conducted by Personal Biotechnology Cp. Ltd. (Shanghai, China). The sequencing libraries were generated using the TruSeq RNA Sample Preparation Kit (Illumina, San Diego, CA, USA), and the libraries were sequenced with the Illumina Hiseq X platform. The reference genome and gene annotation files were downloaded from a genome website (https://www.rosaceae.org/species/prunus_avium/genome_v1.0.a1, accessed date: 14 July 2017). The reference genome index was built using Bowtie2 (2.2.6) and the filtered reads were mapped to the reference genome using Tophat2 (2.0.14); the default mismatch was no more than 2. We used the HTSeq (0.9.1) statistics to compare the Read Count values of each gene as the original expression of the gene, and we then used FPKM (fragments per kilobase of exon model per million mapped reads) to standardize the expression. Subsequently, DESeq (1.30.0) was used to analyze the genes that displayed different transcription levels in screened conditions, as follows: the expression difference multiple |log2FoldChange| > 1, with a significant p-value < 0.05. At the same time, we used the R language Pheatmap (1.0.8) software package to perform a bi-directional clustering analysis of all the differentially expressed genes in the samples. We obtained a heatmap according to the transcription level of the same genes in different samples and the expression patterns of different genes in the same samples, using the Euclidean method to calculate the distance and Complete Linkage method of the cluster. RNA-seq was performed with three biological replicates. The raw data from RNA-seq were submitted to BioProject under the following ID number: PRJNA681747.

2.4. WGCNA Analysis

Co-expression networks were created using the WGCNA (v1.29) package in R [32]. The anthocyanin content in the cherry peel or flesh during two development stages and all RNA-seq genes, except genes that were not expressed (FPKM = 0), were used for WGCNA. In total, 16,674 genes were set as inputs for the signed WGCNA network construction. The automatic network construction function ‘blockwise’ was used to build the modules. In the standard WGCNA network, the soft power was set to 16, the minModuleSize was 30, and the mergeCutHeight value was 0.25. The initial clusters were merged with eigengenes. WGCNA is accomplished using soft thresholding to preserve the continuous nature of the data set and eliminate the need to set an arbitrary correlation score cutoff. Candidate hub genes in ‘’brown’’, “blue”, and “magenta” were picked by thresholding at a value of 0.85.

2.5. Gene Isolation, cDNA Synthesis, and Real-Time PCR

Based on the RNA-seq and WGCNA results, differentially expressed genes (DEGs), including two target genes and 11 TFs associated with anthocyanin biosynthesis, were identified, and their information is listed in Supplementary Table S1. The cDNAs were synthesized using the HiScript III-RT SuperMix for the qPCR kit (Vazyme, Nanjing, China), according to the manufacturer’s instructions. Real-time PCR analyses were carried out with a ChamQ Universal SYBR qPCR Master Mix kit (Vazyme, Nanjing, China) using a Bio-Rad CFX Connect Real-Time System to investigate the transcriptional patterns of various genes in the anthocyanin synthesis process at different fruit development stages and in different parts. The primers for TFs and structural genes were designed using primer3 (https://bioinfo.ut.ee/primer3-0.4.0/) and are shown in Supplementary Table S2. The specificity of various primers was double-checked by melting curve and PCR product resequencing. The sweet cherry actin gene (Genbank no. FJ560908) was used as the housekeeping gene. The reaction mixture had a total volume of 20 μL and it contained 10 μL SYBR Premix, 0.5 μL of forward primer (10 μM), 0.5 μL of reverse primer (10 μM), 1 μL of the cDNA template (20 ng), and 8.0 μL of ddH2O. The cycling conditions were, as follows: we initiated the PCR program with a preliminary step of 30 s at 95 °C, followed by 40 cycles at 95 °C for 10 s, and then 60 °C for 30 s. The data were analyzed with the 2−∆Ct method to calculate the genes’ relative transcription levels. Three biological replicates with three independent cDNA syntheses and real-time PCR were analyzed for each sampling point.

2.6. Promoter Cloning and Dual-Luciferase Assays

The dual-luciferase assays were performed in Nicotiana benthamiana to investigate the potential relationships between the transcription factors and PacANS promoter, according to Zhang et al. [33]. The promoter sequence of PacANS was amplified using the sweet cherry genome database (https://www.rosaceae.org/species/prunus_avium/genome_v1.0.a1, accessed date: 14 July 2017) for reference. Genomic DNA (gDNA) from ‘Hong Deng’ served as a template. Supplementary Table S3 lists the amplified promoter sequence. The full lengths of eleven transcription factors were integrated into the pGreen II 0029 62-SK vector (SK), while the promoter of PacANS was inserted into the pGreen II 0800-LUC vector (LUC). Information on the two vectors can be found in Hellens et al. [34]. Supplementary Table S4 lists the primers for the vector construction for the dual-luciferase assays. The empty SK vector was injected as the control. Three days after the infiltrations, the LUC and REN fluorescence intensities were analyzed with dual-luciferase assay reagents (Promega, Madison, WI, USA) and the GloMax96 luminometer (Promega, Madison, WI, USA), according to the manufacturer’s instructions. Four replicates were performed for each TF–promoter interaction.

2.7. Statistical Analysis

The statistical significance of two populations was calculated with Student’s t-test (* p < 0.05, ** p < 0.01, and *** p < 0.001). One-way ANOVA was carried out, which was followed by Tukey’s test, to compare the significance among four populations. The different letters above the error bars indicate the significance level. The heatmap was drawn with TBtools software. The figures were drawn using Origin 8.0 (Microcal Software Inc., Northampton, MA, USA).

3. Results

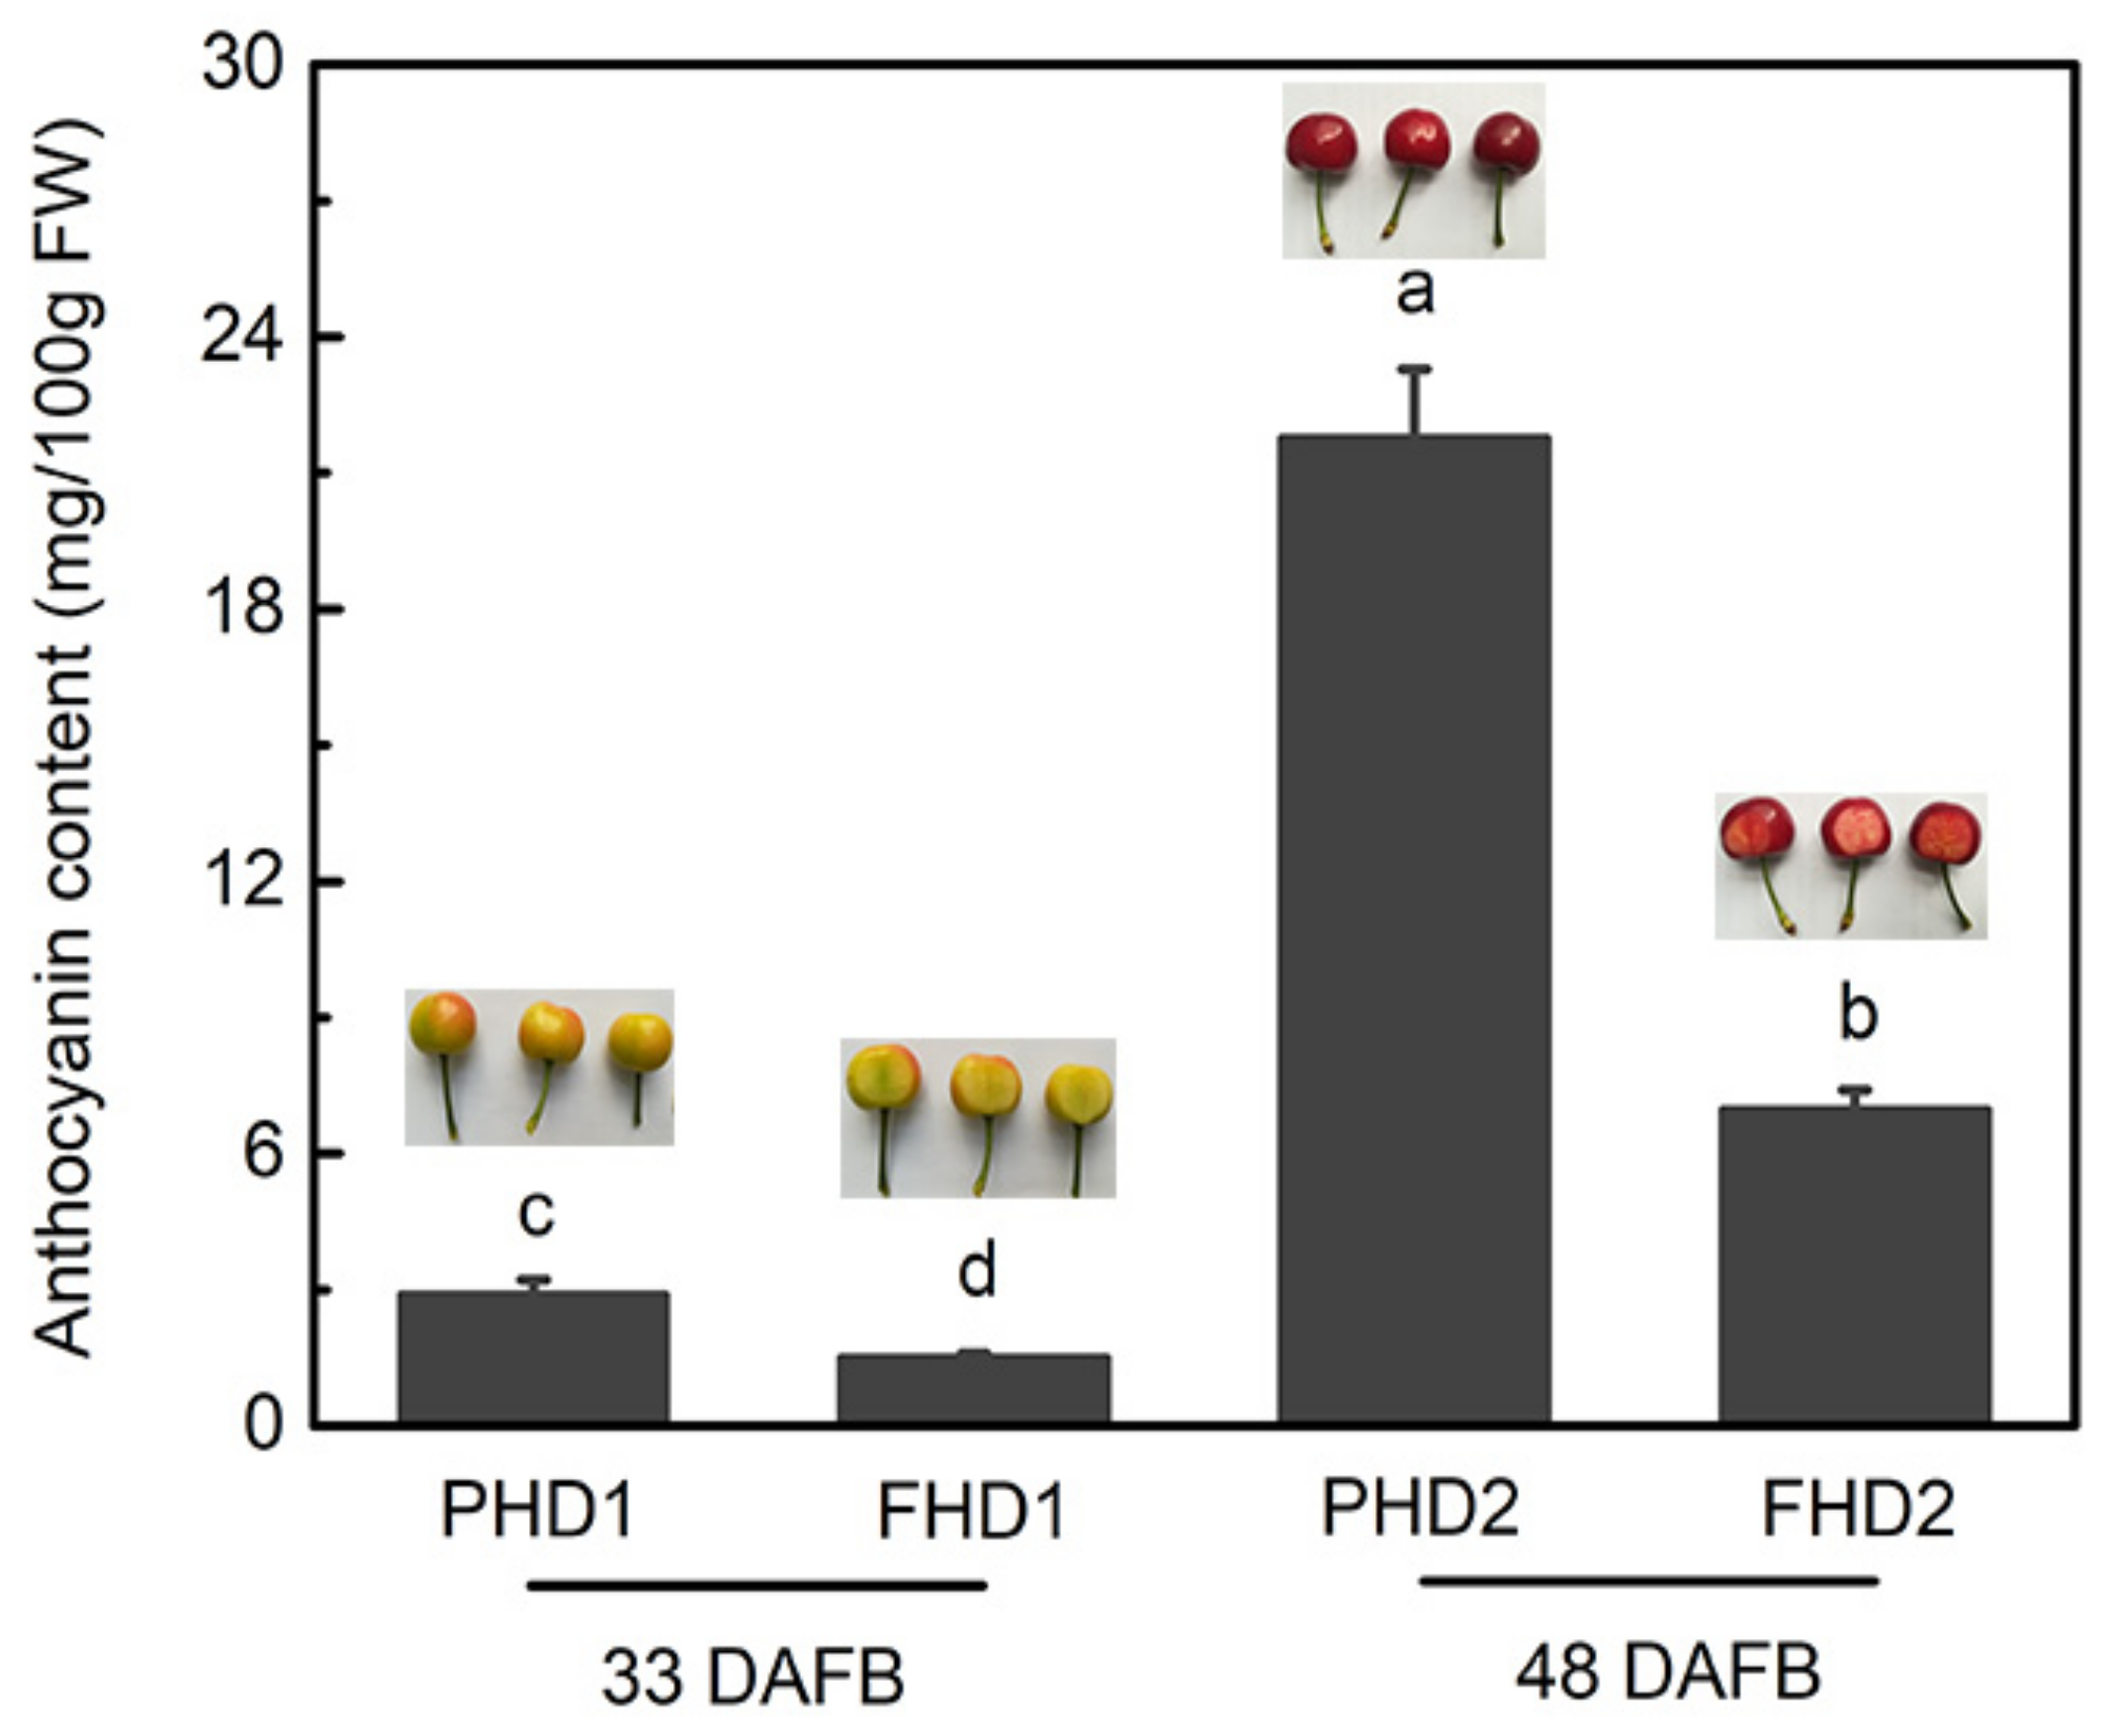
3.1. Anthocyanin Accumulation during Sweet Cherry Fruit Development Stages and in Different Parts

Based on the fruit skin color of ‘Hong Deng’, we defined two visual developmental stages: initial red (IR) and dark red (DR) at 33 and 48 DAFB, respectively. We observed that fruit in the two periods exhibited distinct physiological and morphological changes; meanwhile, the color of the fruit flesh was obviously lighter than the peel at both stages. The anthocyanin content was separately detected in the flesh and peel in both periods. It was 2.88 mg/100 g (FW) and 1.51 mg/100 g (FW) in the 33 DAFB peel and flesh, respectively, while the anthocyanin content was increased to 21.75 mg/100 g (FW) and 6.97 mg/100 g (FW) in the 48 DAFB peel and flesh. The anthocyanin content increased sharply as the skin color changed from 33 DAFB to 48 DAFB, and the anthocyanin content was higher in the peel than in the flesh at each stage (Figure 1).

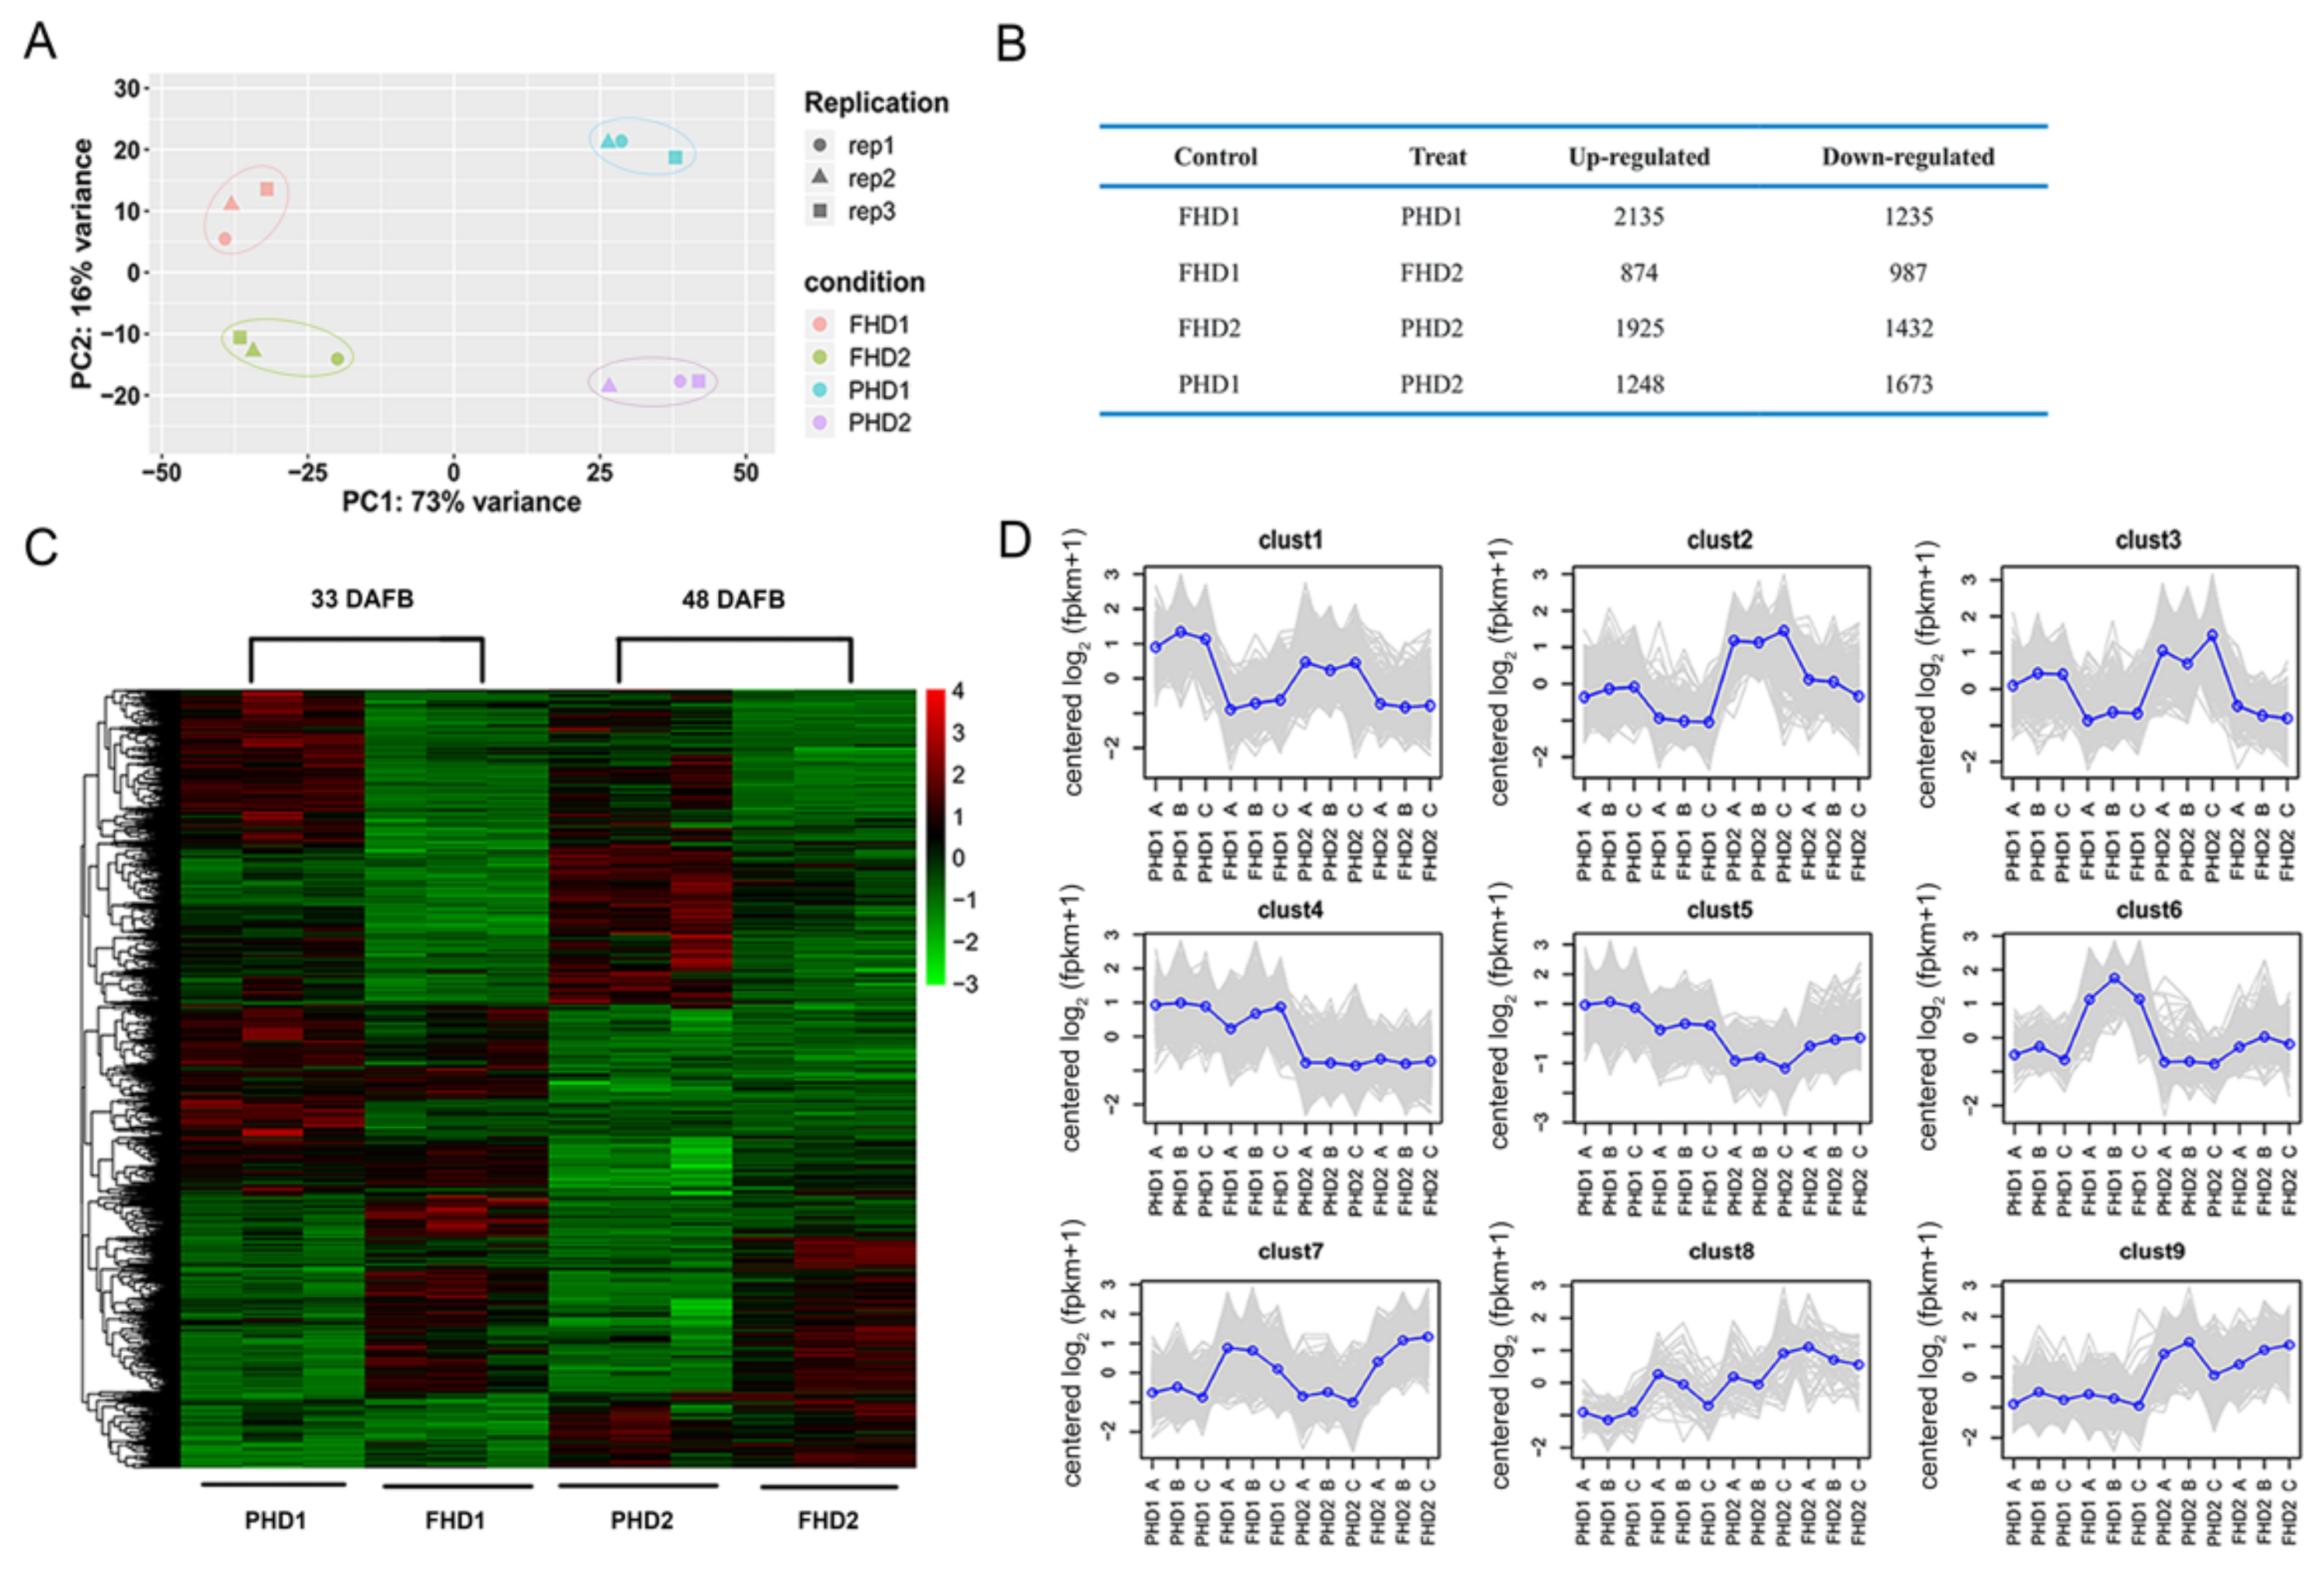
3.2. RNA-Seq Data Revealed Differentially Expressed Genes (DEGss) and Analysis of Expression Trends

Principal component analysis (PCA) and Pearson’s correlation analysis showed that there were highly correlated transcriptome characteristics (r2 = 0.94−0.99) between three biological replicates at each stage and in each part (Figure 2A; Figure S1). PC1 contributed 73% and it was the dominant part. Two groups of flesh samples (FHD1/FHD2) were negatively correlated and their results deviated greatly from the two groups of peel samples (PHD1/PHD2) along the PC1 axis, as presented in Figure 2A. Furthermore, flesh and peel samples in stage 33 DAFB were separated from 48 DAFB along the PC2 axis.
The RNA-seq analysis of fruit peel and flesh samples in different development stages provided an overview of the differentially expressed genes. Among the different samples, there were 3370 DEGs in total between the flesh and peel in the 33 DAFB fruit, and 3357 DEGs in fruit at the 48 DAFB stage. Regarding DEGs in peels between 33 DAFB and 48 DAFB, there were 1248 up-regulated genes and 1673 down-regulated genes. Moreover, for the DEGs in flesh samples between the two stages, there were 874 up-regulated genes and 987 down-regulated genes (Figure 2B). All 6386 DEGs are shown in the heatmap depicted in Figure 2C. To investigate how the DEGs change at different development stages and in different parts of sweet cherry fruit, the 6386 DEGs were grouped into nine clusters based on their transcription levels (Figure 2D). The transcripts from Clusters 2 and 3 showed similar expression tendencies in different samples, which were generally consistent with the anthocyanin content. The transcription levels of DEGs from Cluster 1 were also higher in the peel than in flesh, while the transcription levels of DEGs were lower in both peel and flesh in 48 DAFB than in 33 DAFB fruit. On the contrary, the transcription levels of DEGs from Clusters 6 and 7 were lower in the peel than in flesh (Figure 2D).

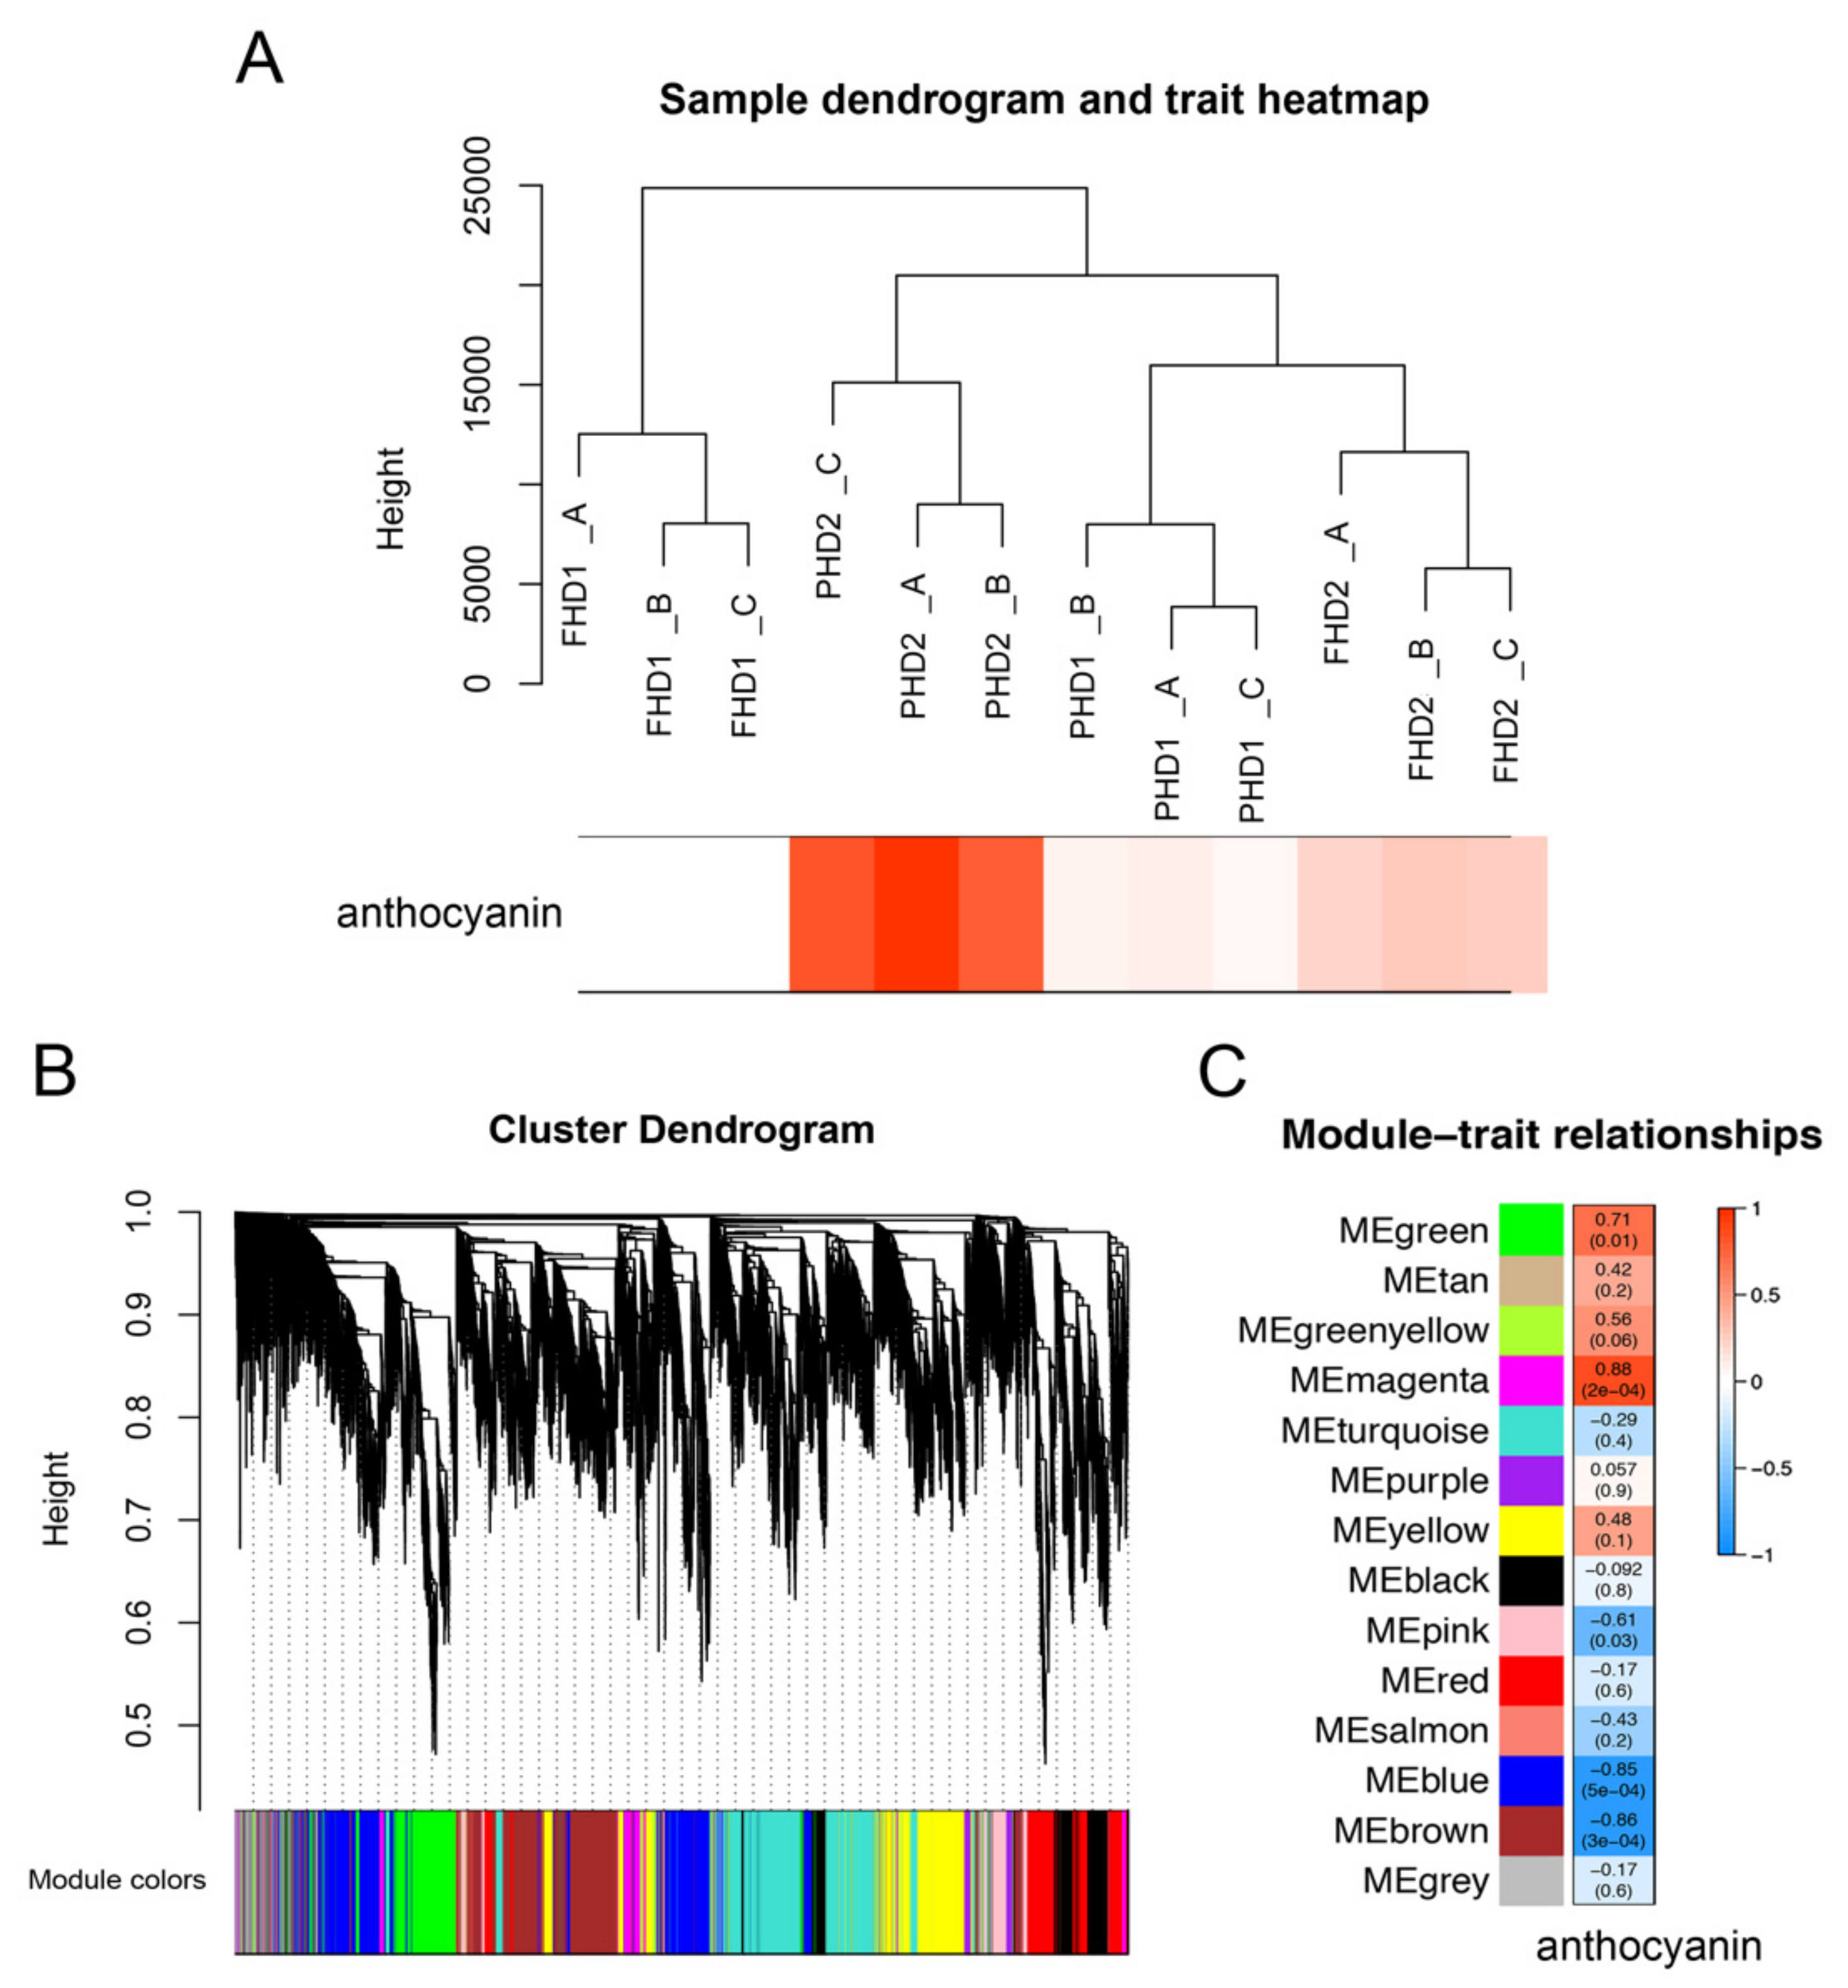
3.3. WGCNA Network Analysis Revealed Anthocyanin-Related DEGs

To investigate the biosynthesis-related anthocyanin transcripts, we performed a WGCNA of all RNA-seq genes, except unexpressed genes, which showed high repeatability in each sample point (Figure 3A). The genes were comprised of 14 co-expression modules (Figure 3B,C), of which three (magenta, blue, and brown) showed a significant association with anthocyanin changes in different samples (Figure 3C). The anthocyanin content was highly positively correlated with gene expression in the ‘magenta’ module and negatively correlated with the ‘blue’ and ‘brown’ modules, with a coefficient of 0.88 (p = 2 × 10⁻⁴), −0.85 (p = 5 × 10⁻⁴), and −0.86 (p = 3 × 10⁻⁴), respectively. Based on the correlation (r > 0.85) between genes among the three modules and the anthocyanin content, we identified a total of 1021 genes (409 brown, 169 magenta, and 443 blue) that may be related to anthocyanin biosynthesis metabolism.

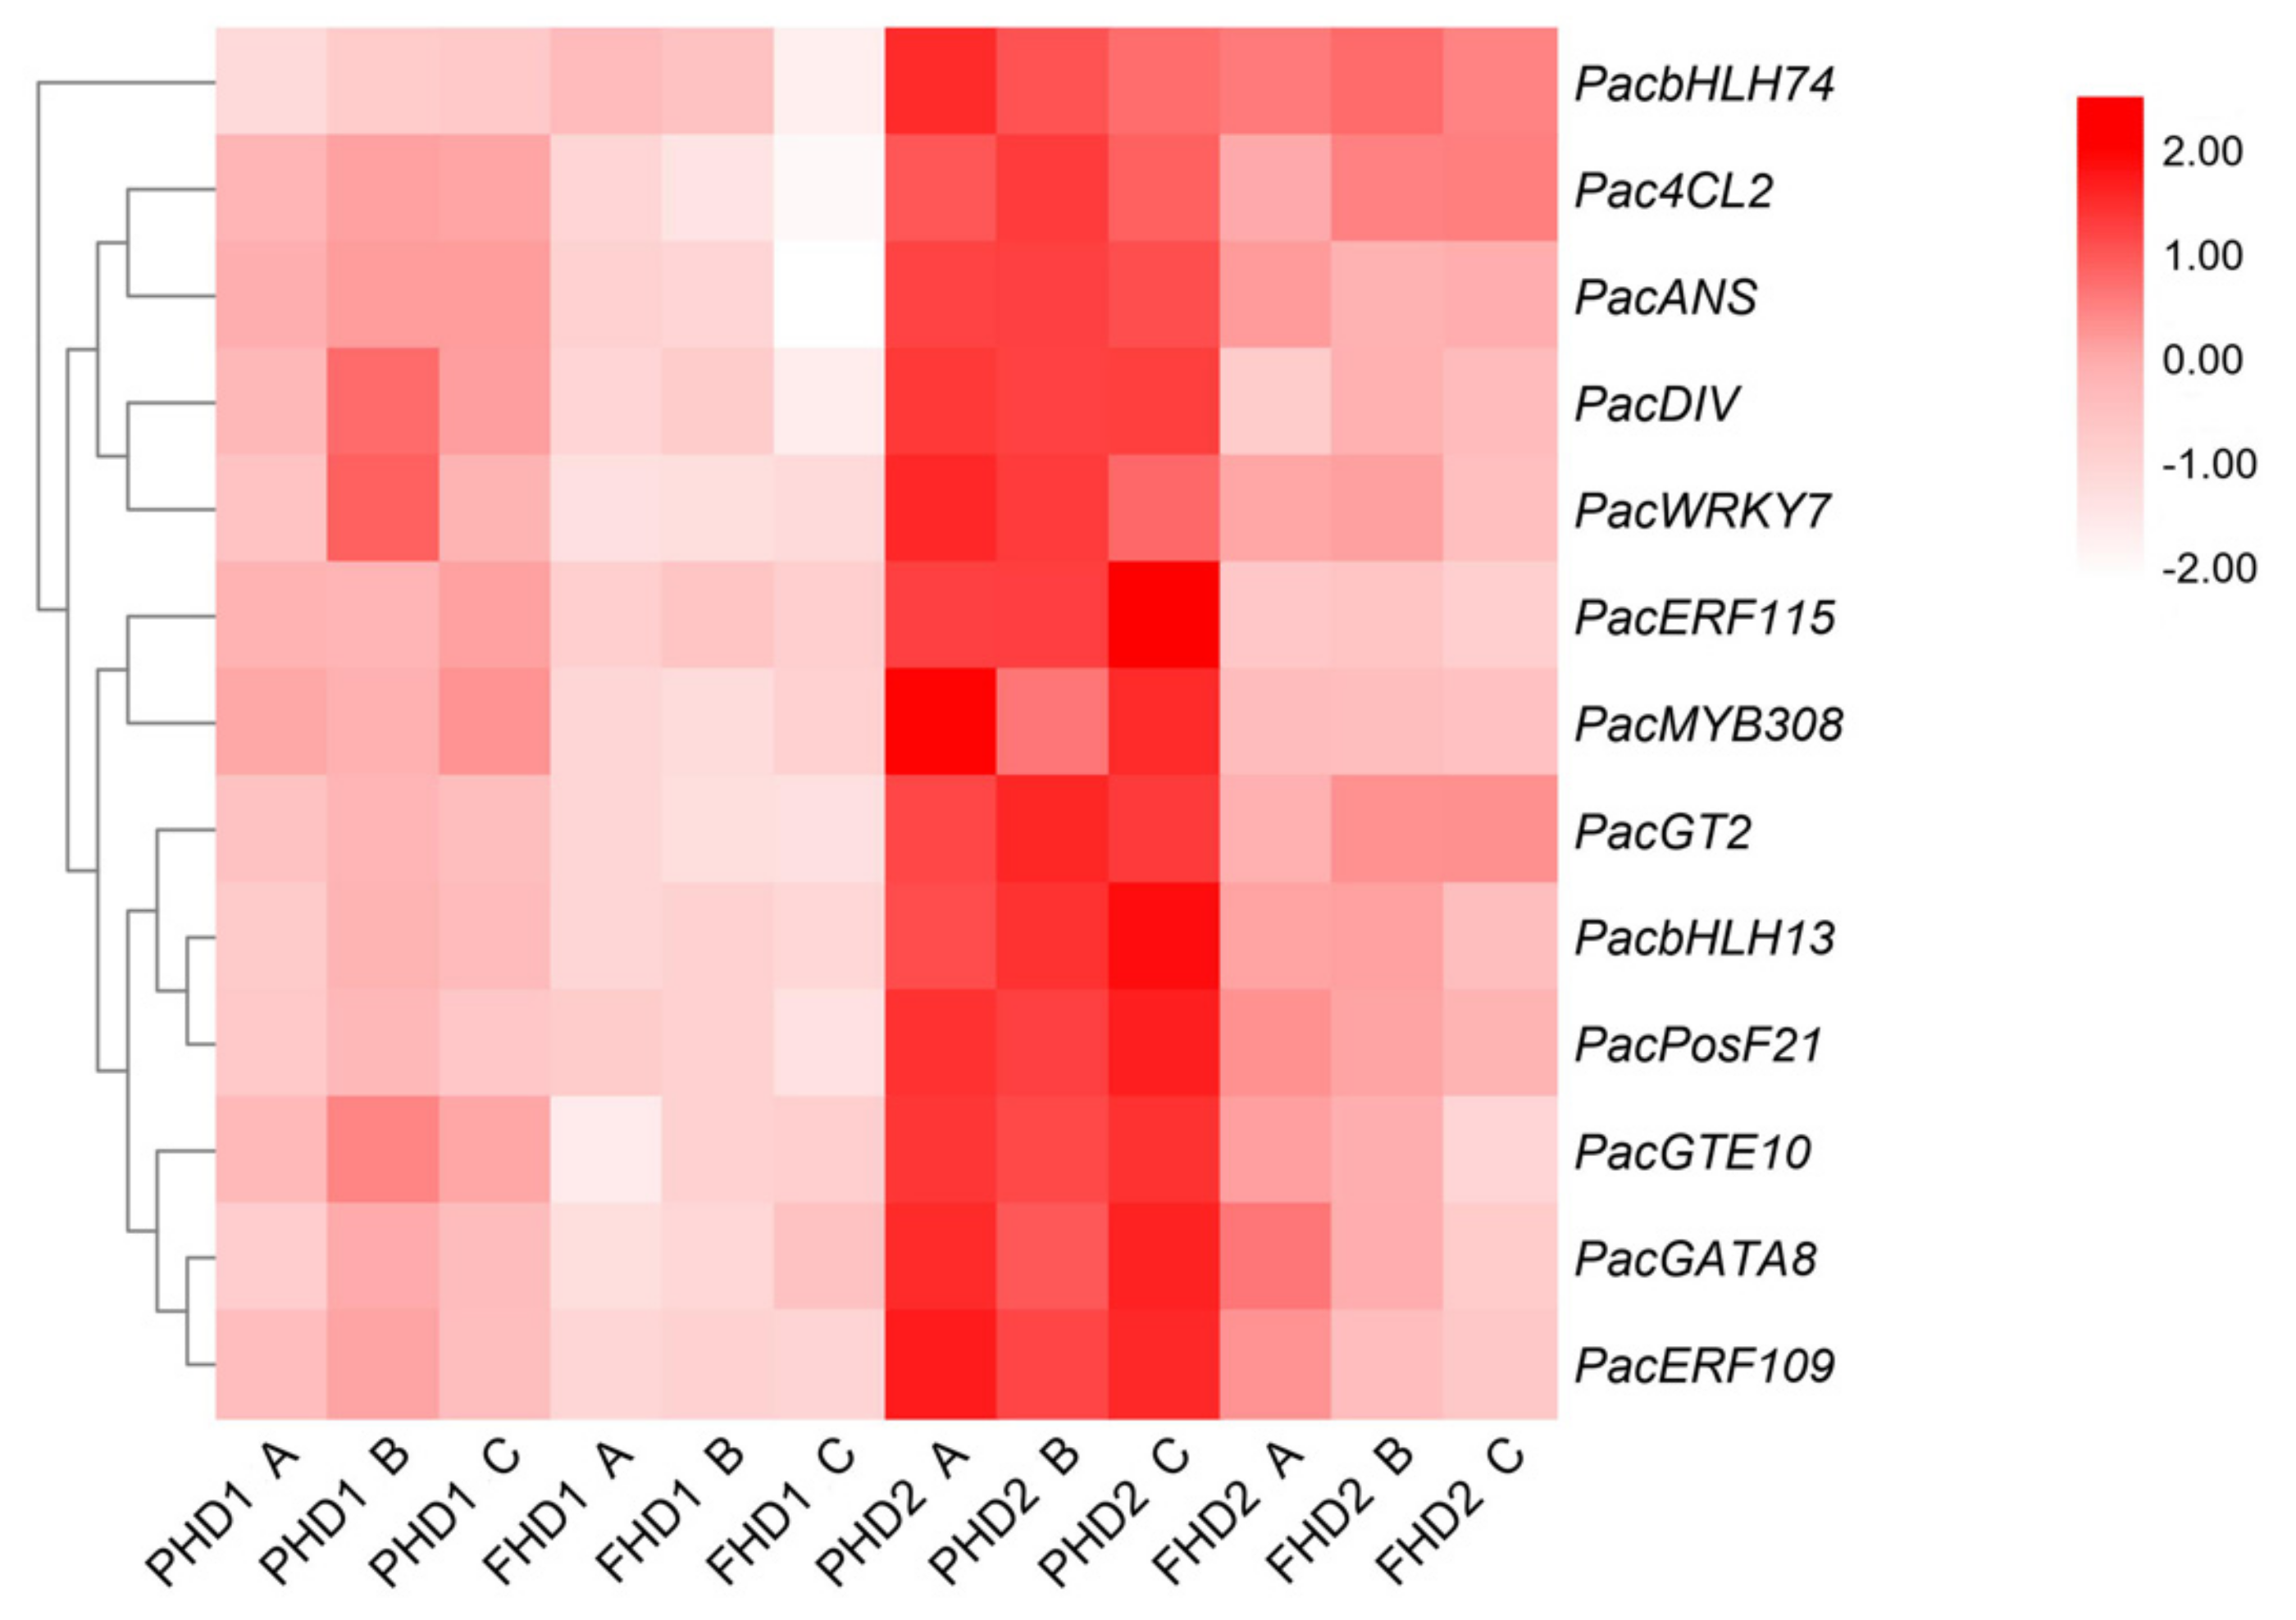
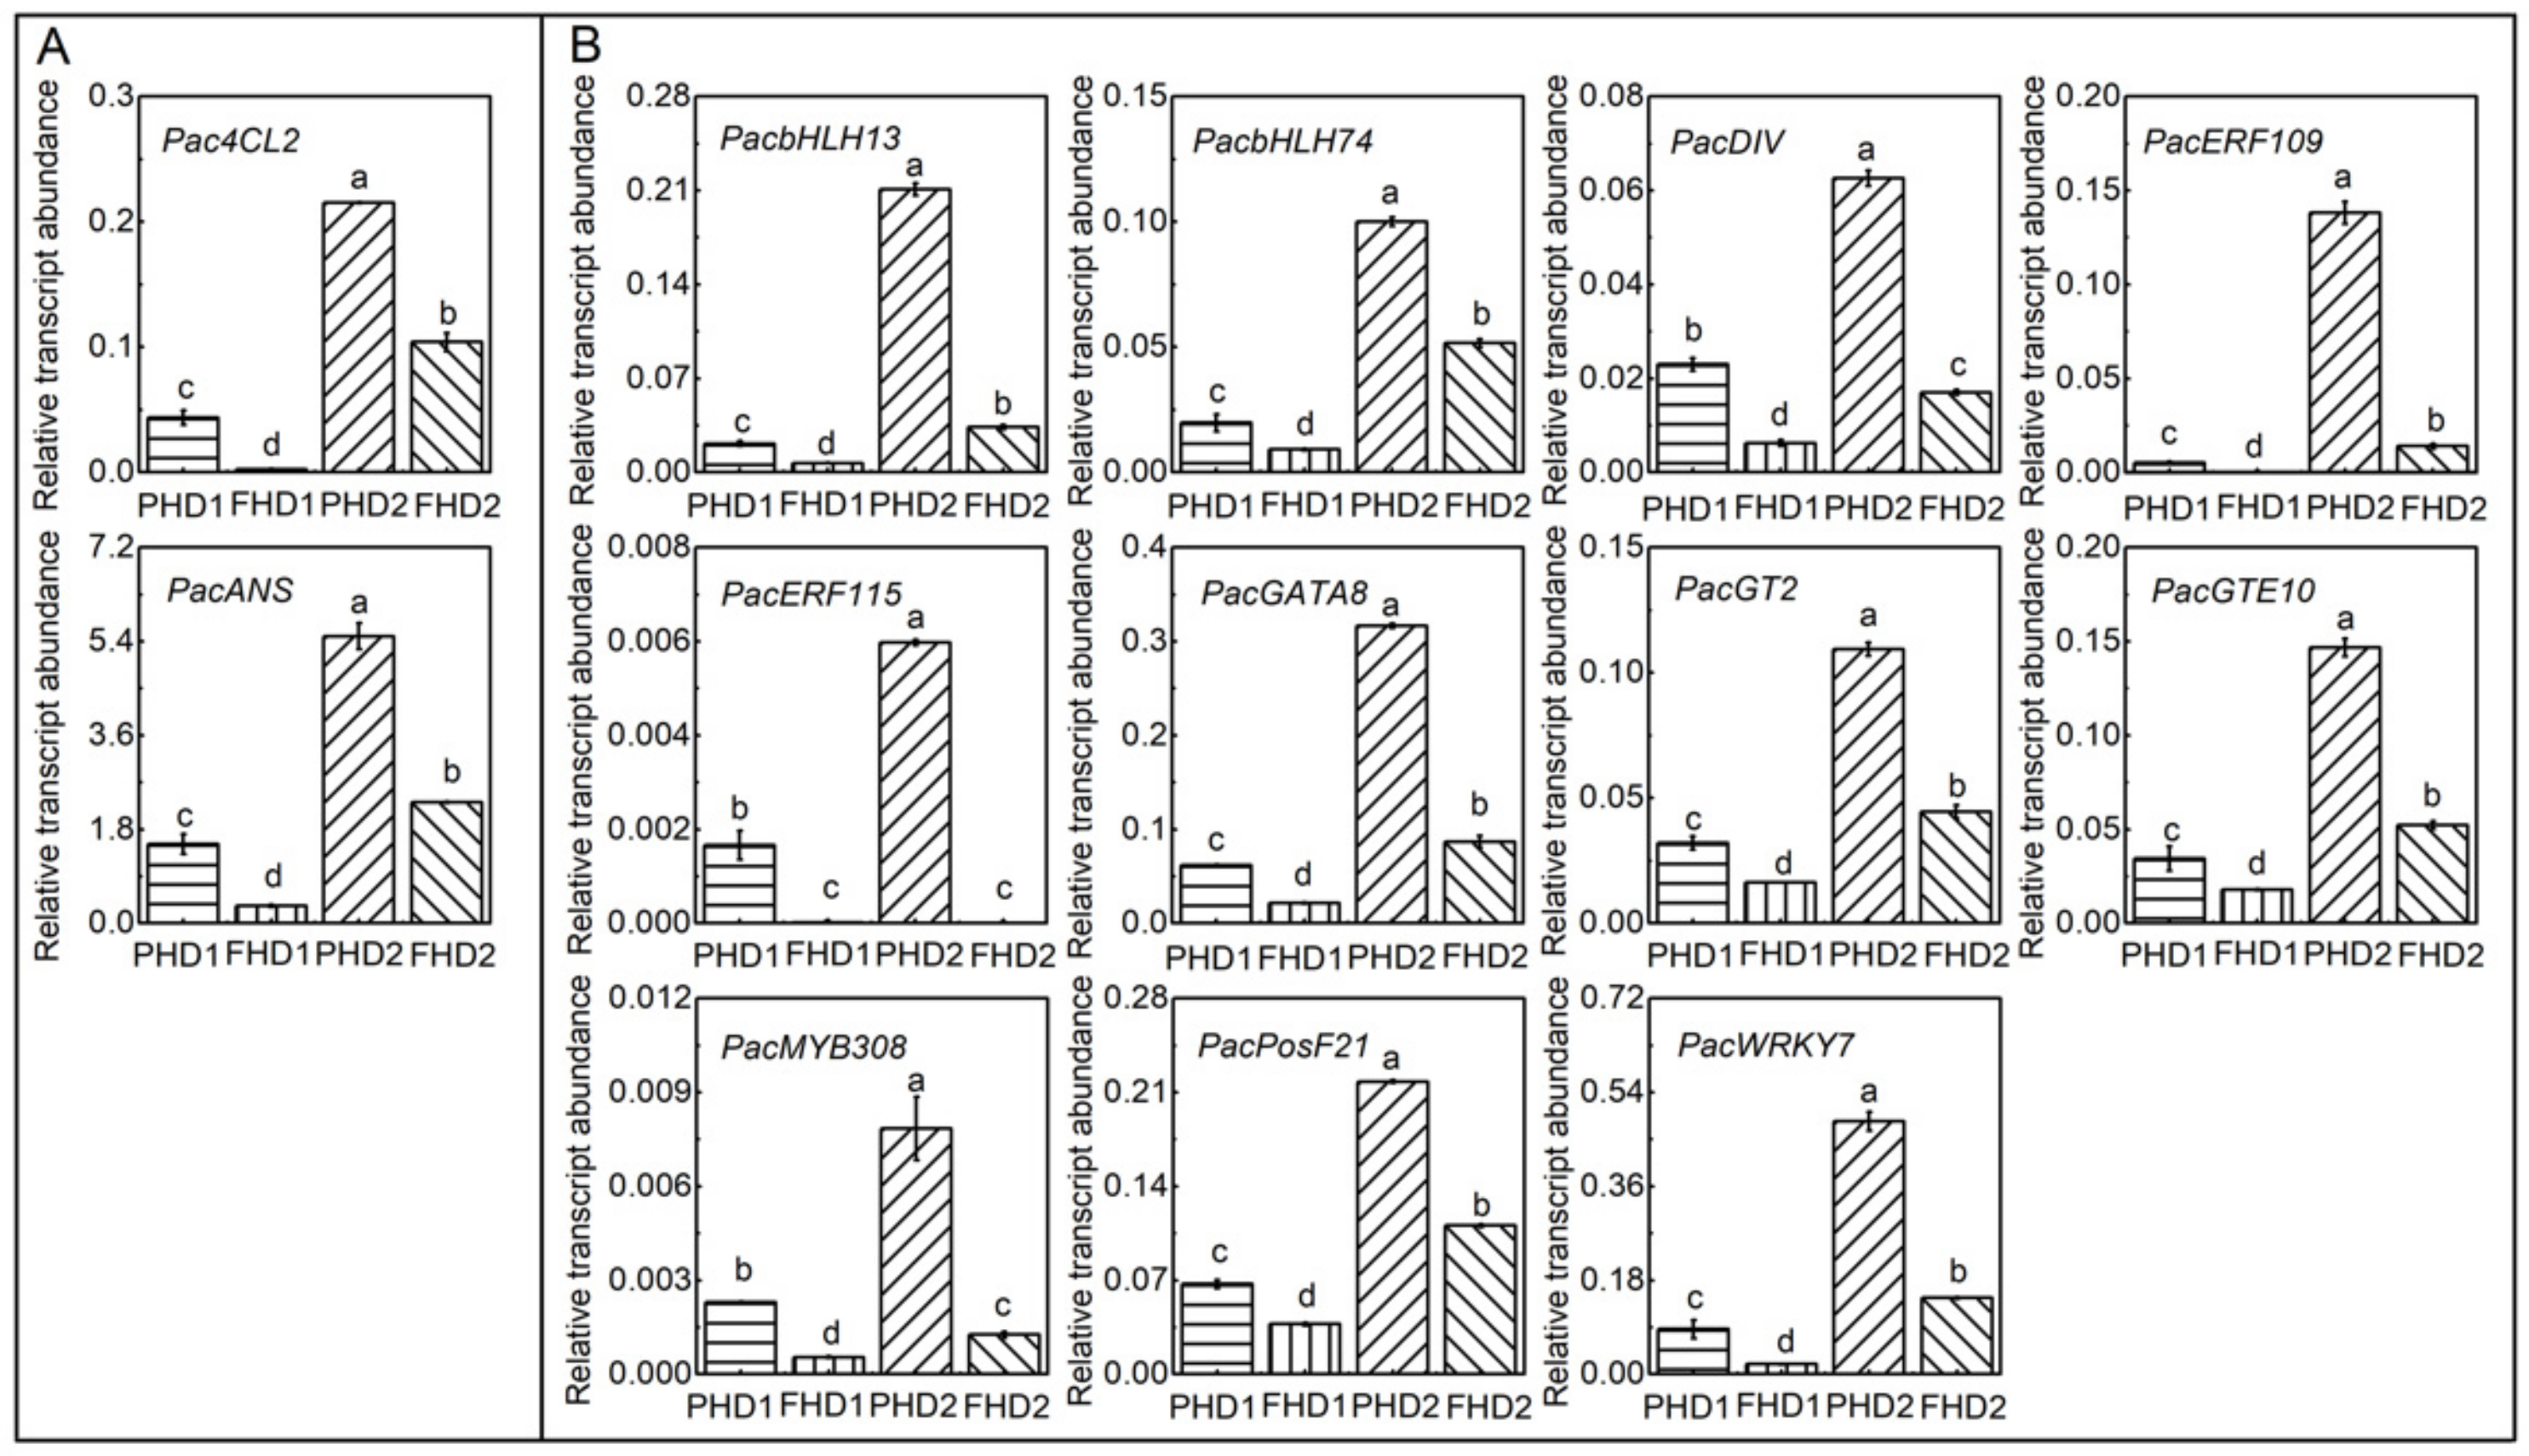
3.4. Identification and Expression of Anthocyanin Biosynthetic Genes and Tfs during Fruit Development Stages and in Different Parts

To characterize the structural genes and TFs that are associated with the formation of anthocyanin, 1021 genes were isolated based on WGCNA, which narrowed the scope of the DEGs, including two structural genes (Pac4CL2, PacANS) and 11 TFs (PacbHLH13/74, PacDIV, PacERF109/115, PacGATA8, PacGT2, PacGTE10, PacMYB308, PacPosF21, and PacWRKY7). A heatmap of these gene transcripts’ abundance was created using TBtools software, which exhibited a similarly expressed model and strongly corresponded with the color of the samples. In other words, these genes showed higher transcription levels in the 48 DAFB stage than in the 33 DAFB stage, as well as higher transcription levels in the peel than in flesh (Figure 4). With the exception of the Pac4CL2 gene (it was divided in Cluster 9), all of the other genes were involved in Cluster 2 and Cluster 3 according to Figure 2D. Among them, PacANS, PacbHLH13/74, PacERF109/115, PacGATA8, PacGT2, PacGTE10, PacPosF21, and PacWRKY7 were found in Cluster 2, while PacDIV, PacMYB308, and PacWRKY7 were found in Cluster 3. Therefore, the results were in agreement, which implied the reliability of the method used for selecting candidate DEGs.
Further experiments were performed to confirm the transcript abundance changes in these genes in sweet cherry fruit peel and flesh by real-time PCR. Primer verification confirmed all of the structural genes and TFs, and they were then analyzed using real-time PCR. Figure 5 shows the expression of two anthocyanin biosynthetic genes (Pac4CL2, PacANS) and of 11 TFs at each developmental stage and part. Among them, the transcription level of PacANS was the highest. In accordance with the pattern of anthocyanin accumulation, the transcription levels of these genes were significantly higher in peel than in flesh at each stage. In addition, the gene expression increased rapidly during the late developmental stage (48 DAFB, DR) as compared with the early stage (33 DAFB, IR) in both the peel and flesh, except for PacERF115, which only increased in peel. In general, the transcription levels of all these structural genes and regulatory genes are closely correlated with anthocyanin biosynthesis during fruit development, and they could be potential candidates involved in programming sweet cherry anthocyanin biosynthesis.

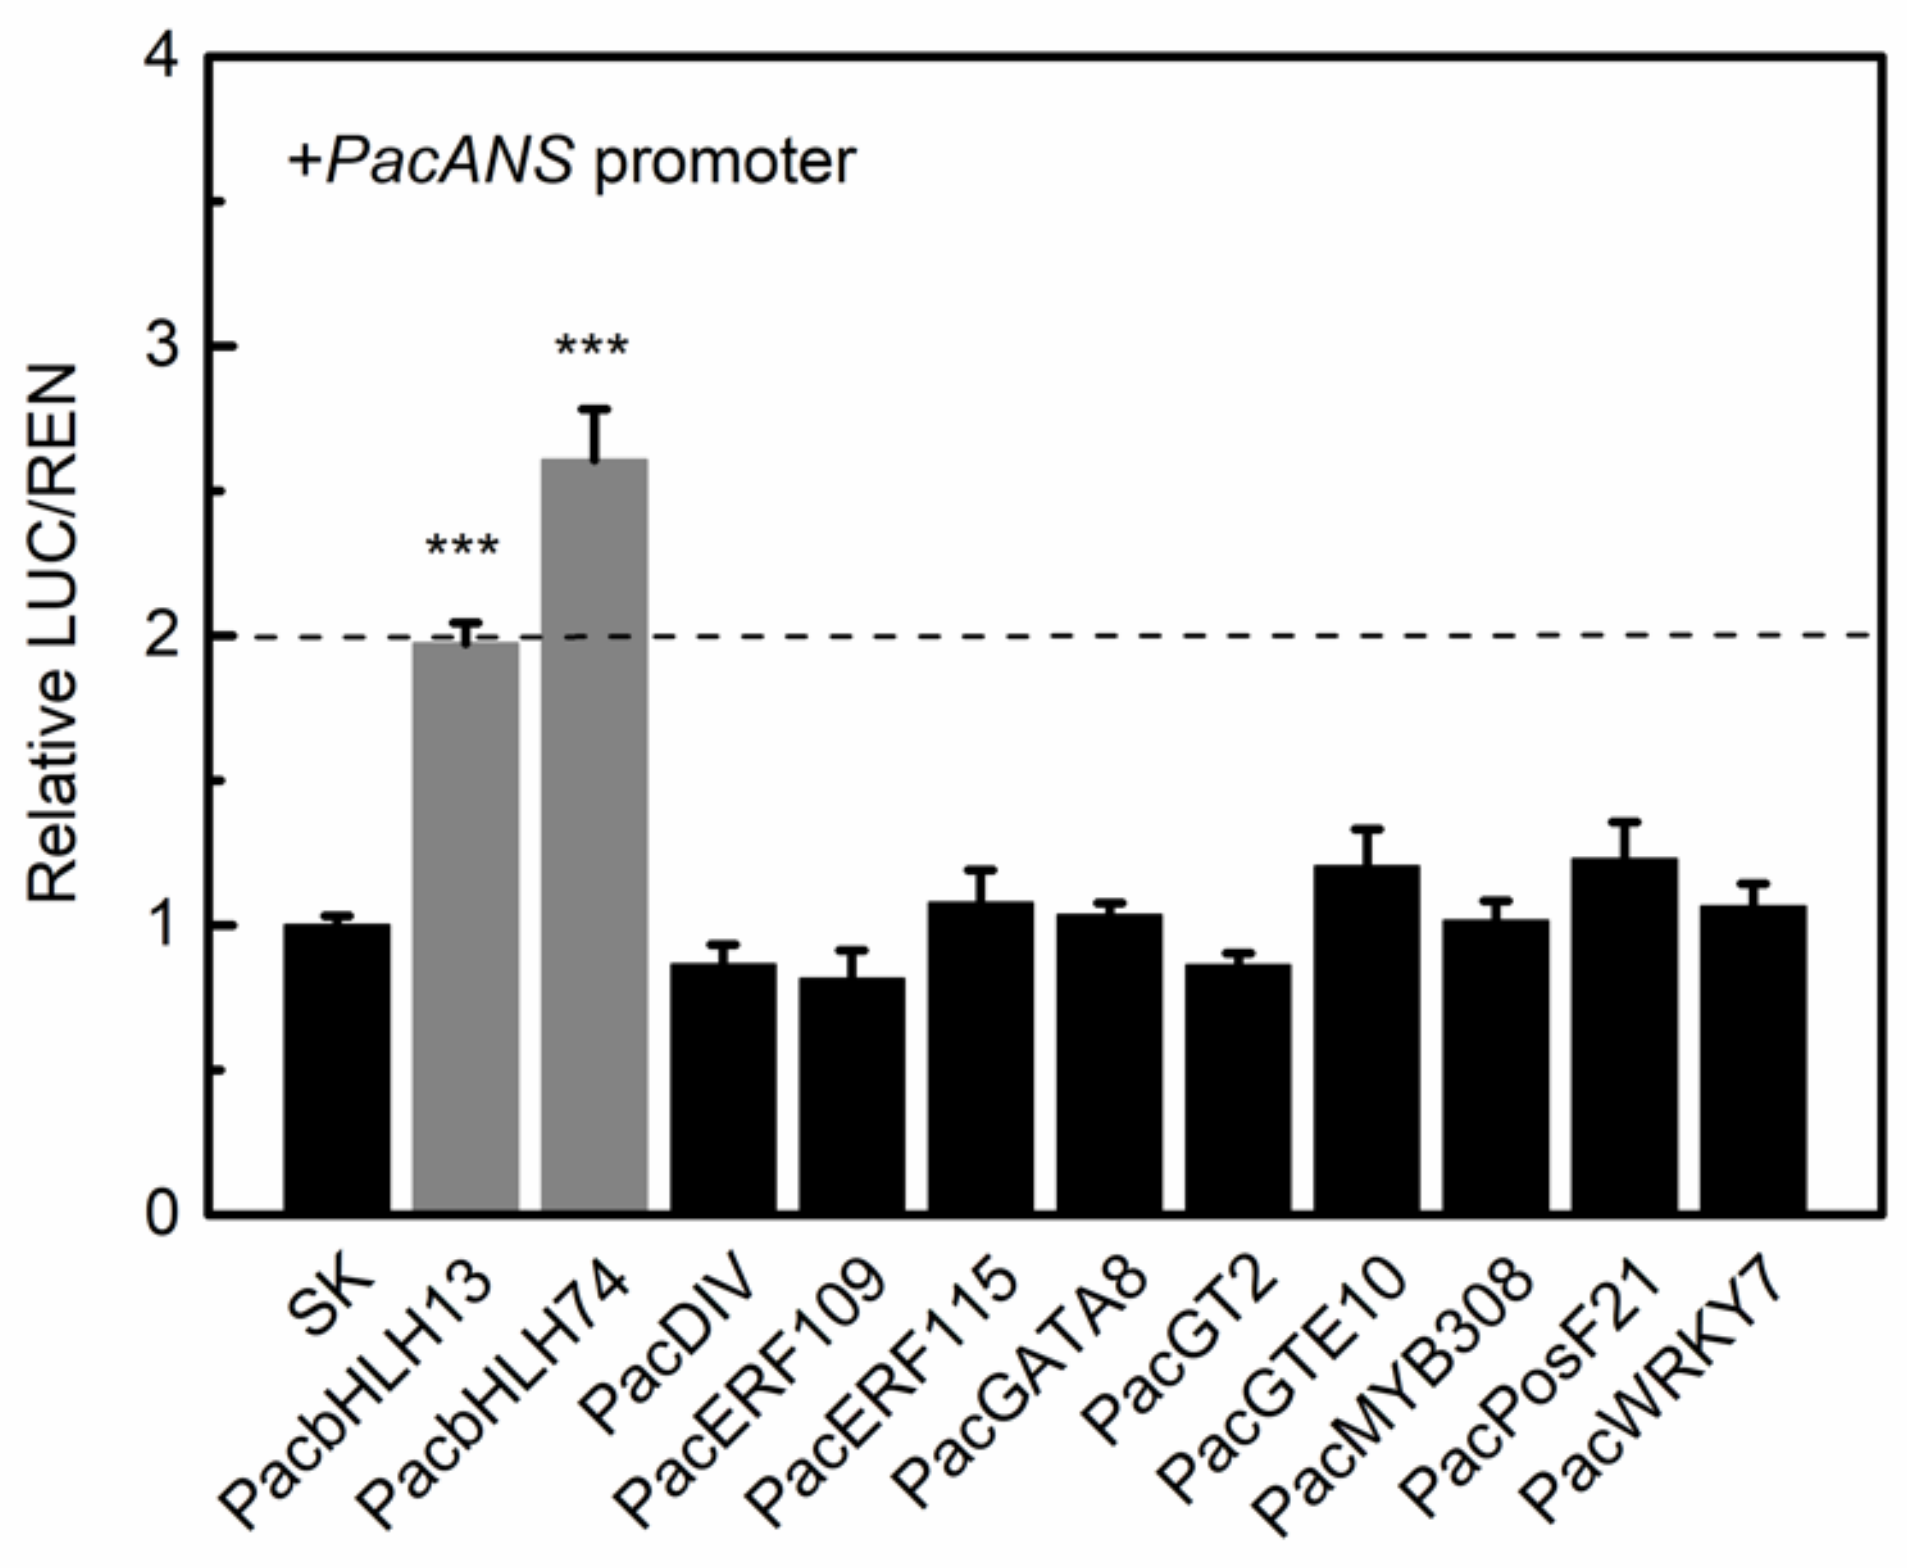
3.5. Regulation of bHLHs on PacANS

A dual-luciferase assay was performed with tobacco leaves to further analyze the correlation between the 11 transcription factors and the anthocyanin biosynthesis target gene PacANS. In the assay, we failed to observe the sequence of the promoter of Pac4CL2. An obvious induction was observed for the activation of the PacANS promoter by PacbHLH13 and PacbHLH74, with 1.97-fold and 2.61-fold inductions, respectively, as shown in Figure 6 (Figure 6). Furthermore, several bHLH core binding site G-boxes [C/G]ACGT[A/G] and/or E-boxes (CANNTG) were found based on our analysis of the cis-elements region in the PacANS promoter. These results demonstrated that PacbHLH13 and PacbHLH74 could be potential candidates for the regulation of the expression of PacANS in sweet cherry.

4. Discussion

An understanding of anthocyanin formation is critical for fruit quality and marketability, because fruit color preferences can directly inform consumers’ choices. Cherries contain bioactive anthocyanins that are reported to possess anticancer, antidiabetic, antioxidant, anti-inflammatory, and anti-obese properties [5,6,35]. A dynamic and close relation between anthocyanin content and fruit color variation has been found [2]. In sweet cherry, the anthocyanin content increases rapidly during fruit coloration. There are two periods of rapid development, with anthocyanin mainly accumulating after the yellow stage [27]. The anthocyanin pigmentation in dark red ‘Hong Deng’ cherries was slightly dependent on light, but closely related to the developmental stage [36]. Our study focused on the anthocyanin formation mechanism, so we began our study in the initial red (IR) stage of ‘Hong Deng’ sweet cherry, finding that the anthocyanin level significantly increased from 33 DAFB (IR) to 48 DAFB (DR) (Figure 1), which was consistent with the previous research results [27]. Furthermore, peel coloration occurred earlier, and it was darker than that of the flesh at both the 33 DAFB and 48 DAFB developmental stages, while the anthocyanin level was higher in the peel than in the flesh (Figure 1). A similar phenomenon has also been found in many fruit crops. In purple kiwifruit, the intense pigmentation on the skin and flesh depended on the accumulation of cyanidin-based and delphinidin-based anthocyanin [37]. In blueberry peel tissue, the anthocyanin content was found to be higher than in the flesh tissue [38]. Procyanidins are the main compounds in pear flesh and skins, and the polyphenol content in the skin is six times higher than that in the flesh [39]. In red-fleshed apple, the level of anthocyanin content in skin is generally higher than that in pulp [40]. Based on the present results, we also indicated that the discrepant pigmentation in the development stages and in both the peel and flesh of sweet cherry is due to the varying degrees of anthocyanin accumulation.
In sweet cherry, previous studies demonstrated that anthocyanin biosynthesis seems to be mostly regulated by the transcription levels, and PacCHS, PacUFGT, and PacANS were reported to be key candidates for anthocyanin biosynthesis [16,28]. In other species, a recent publication has shown that LDOX may have a critical role in anthocyanin biosynthesis in A. arguta [9]. Moreover, the overexpression of the StANS gene contributed to the accumulation of anthocyanin in potatoes [41], while ANS was required for anthocyanin formation in onions [42]. Equally, the expression of ANS increased the flavonoid accumulation, but decreased the content of anthocyanin in S. miltiorrhiza flowers [43]. Therefore, ANS, which is the main anthocyanin synthesis gene in the late biosynthesis pathway, is critical for plant anthocyanin biosynthesis. Previous studies confirmed that ANS can be regulated by many TFs, especially the MYB/bHLH/MBW complex (potato, [41]; sweet cherry, [27]; litchi, [20]; kiwifruit, [21]; and, apple, [13]). Additionally, the ANS gene can be positively regulated by WRKY-family transcription factors, such as PyWRKY26/PyWRKY31 in pears [23] and MdWRKY11 in apples [44]. The Arabidopsis transcription factor AtNAC032 has a negative effect on the transcriptional expression of ANS/LDOX and DFR [45]. In this study, we found an ANS and an 4CL gene, PacANS and Pac4CL2, which stood out in the RNA-seq and WGCNA (Figure 2 and Figure 3). Their transcription levels were strongly stimulated during fruit development, but they were expressed differently in the peel and flesh tissue (Figure 4 and Figure 5). Therefore, PacANS and Pac4CL2 might be the key candidate genes that are involved in the formation of anthocyanin in sweet cherry. Because WGCNA is based on correlations between quantitative variables, we should be aware of the limitations of it as a screening method and as a data exploratory technique [32]. In our RNA-seq results, many identified structural genes in sweet cherry, such as PacCHS (accession number, JF748833), PacCHI (JF740091), PacF3H (JF740092), PacDFR (JF740093), and PacUFGT (JF740090), as well as regulatory genes, for example, PavMYB10.1 (KP455680), were included in the list of DEGs, but not involved in our focus according to WGCNA and screening conditions. Therefore, many other genes may also participate in anthocyanin metabolism in sweet cherry besides all of the reported genes and these in our present results. In addition, 4CL is located in a key area upstream of the phenylalanine metabolism pathway, which may be involved in the synthesis and metabolism of other chemical substances, such as lignin, rutin, and proanthocyanins [46,47]. Thus, the highly correlated target genes and TFs may participate in the biosynthesis of other compounds.
In plants, bHLHs have been widely reported to be involved in many biological processes, such as lignin biosynthesis [48], organ development [49], and abiotic stress tolerance [50]. Among them, bHLHs are known to be one of the key transcription factors regulating anthocyanin biosynthesis [17,18]. In our study, we observed that the PacbHLH13 and PacbHLH74 transcription levels were up-regulated in the developmental stages and expressed more highly in peel than flesh (Figure 5). Further analyses proved that they could activate the PacANS promoter, which induces anthocyanin biosynthesis (Figure 6). However, phylogenetic tree analysis aligned the sequence of PacbHLH13 and PacbHLH74 with Arabidopsis thaliana bHLH sequences and reported anthocyanin synthesis-related bHLHs in other species, revealing that they are not in the same cluster, as the bHLHs participated in anthocyanin synthesis in other species (Figure S2). Of the two, PacbHLH13 was more closely located to the cluster. A recent publication in red pear has shown that PpbHLH64, from another subgroup, can also affect anthocyanin biosynthesis. PpbHLH64 can not only directly bind to the promoter of UFGT as a transcriptional activator, but it can also interact with PpMYB10 to form an MBW complex. [51]. Thus, the present results provided molecular evidence to demonstrate that PacbHLH13/PacbHLH74 are potentially positive regulators of anthocyanin biosynthesis in ‘Hong Deng’ sweet cherry.
Many other transcription factors have also been found and they act as key regulators of anthocyanin accumulation by regulating the structural genes or comprising the complicated regulatory network. An apple-based study revealed that MdERF38 may be a crucial factor influencing anthocyanin formation by regulating the expression of MdDFR and MdUF3GT [26]. In addition, MdHB1 can impact anthocyanin pigmentation by repressing the activation of MdDFR and MdUFGT [52], while MdNAC42 can interact with MdMYB10 to control the anthocyanin accumulation network in red-fleshed apples [53]. In red-skinned pears, PyWRKY26/PyWRKY31 can significantly enhance the transactivation activity of the PyDFR, PyANS, and PyUFGT promoters. Moreover, PyWRKY26 can activate the transcription of PyMYB114 directly or by interacting with PybHLH3 [23]. In this study, besides PacbHLH13/74, we also identified nine other TFs whose expression patterns were consistent with anthocyanin content in ‘Hong Deng’ (Figure 4), including one DIV, one GATA, one GT, one GTE, one PosF, one MYB, one WRKY, and two ERFs (Figure 4). Among them, the only one MYB, PacMYB308, is a typical R2R3-MYB. It is similar to previously known R2R3-MYBs that are involved in secondary metabolism regulation, including flavonoid biosynthesis [54]. All of these TFs have the possibility to participate in anthocyanin biosynthesis and metabolism by regulating other structural genes or forming a complex regulatory network, all of which contribute to improving the quality of the appearance of sweet cherry.

5. Conclusions

In summary, this work revealed that anthocyanin biosynthesis in sweet cherry seems to be mostly regulated by the transcription levels of synthetic anthocyanin genes and TFs. Our investigation, based on RNA-seq and WGCNA, unveiled two key structural genes (PacANS and Pac4CL2) and 11 TFs for anthocyanin synthesis. The expression of all these genes was verified by RT-qPCR. Furthermore, testing the role of TFs in transcriptional regulation characterized PacbHLH13/74 as transcriptional activators of the PacANS promoter. Overall, these findings provide novel insights into the accumulation of anthocyanin in sweet cherry fruit and the roles of specific structural genes and TFs in anthocyanin metabolism.

Supplementary Materials

The following are available online at https://www.mdpi.com/article/10.3390/horticulturae7060123/s1, Figure S1: Pearson correlation analysis between three biological replicates, Figure S2: Phylogenetic tree analysis of PacbHLH13/74 with Arabidopsis thaliana bHLH sequences and anthocyanin synthesis related bHLHs in other species, Table S1: Anthocyanin biosynthesis structural genes and TFs, Table S2: Primers for real-time PCR, Table S3: Sequences (5′ to 3′) for promoter isolation, Table S4: Primers for vector construction for dual-luciferase assays.

Author Contributions

A.Z. and H.Y. designed the study. H.Y., X.L., C.T. and A.Z. performed the experiments. H.G. and H.Y. analyzed the data; A.Z. and H.Y. wrote the manuscript. All authors have read and agreed to the published version of the manuscript.

Funding

This research was supported by the National Natural Science Foundation of China (31901737), the Special Fund for Innovation Teams of Fruit Trees in Agricultural Technology System of Shandong Province, China (SDAIT-06-02), and Key Research and Development of Shandong Province, China (2019GNC106085). The funders had no role in the material creation, designing the study, analysis data and in writing the manuscript.

Institutional Review Board Statement

Not applicable.

Informed Consent Statement

Not applicable.

Data Availability Statement

The raw data of RNA-seq have been submitted. The BioProject ID is PRJNA681747.

Acknowledgments

We thank Qiuyun Zhang for support in data analysis. We also wish to thank Jianzhao Li (Ludong university, China) for experimental support.

Conflicts of Interest

The authors declare that they have no competing interest.

References

  1. Glover, B.J.; Martin, C. Anthocyanins. Curr. Biol. 2012, 22, 147–150. [Google Scholar] [CrossRef] [Green Version]
  2. Jaakola, L. New insights into the regulation of anthocyanin biosynthesis in fruits. Trends Plant Sci. 2013, 18, 477–483. [Google Scholar] [CrossRef] [Green Version]
  3. Allan, A.C.; Hellens, R.P.; Laing, W.A. MYB transcription factors that colour our fruit. Trends Plant Sci. 2008, 13, 99–102. [Google Scholar] [CrossRef]
  4. Zafra-Stone, S.; Yasmin, T.; Bagchi, M.; Chatterjee, A.; Vinson, J.A.; Bagchi, D. Berry anthocyanins as novel antioxidants in human health and disease prevention. Mol. Nutr. Food Res. 2007, 51, 675–683. [Google Scholar] [CrossRef]
  5. Hollman, P.; Katan, M. Absorption, metabolism and health effects of dietary flavonoids in man. Biomed. Pharmacother. 1997, 51, 305–310. [Google Scholar] [CrossRef]
  6. Elliott Middleton, J.; Kandaswami, C.; Theoharides, T.C. The effects of plant flavonoids on mammalian cells: Implications for inflammation, heart disease, and cancer. Pharmacol. Rev. 2000, 52, 673–751. [Google Scholar]
  7. Winkel-Shirley, B. Flavonoid biosynthesis. A colorful model for genetics, biochemistry, cell biology, and biotechnology. Plant Physiol. 2001, 126, 485–493. [Google Scholar] [CrossRef] [Green Version]
  8. Goldsbrough, A.; Belzile, F.; Yoder, J.I. Complementation of the tomato anthocyanin without (aw) mutant using the dihydroflavonol 4-reductase gene. Plant Physiol. 1994, 105, 491–496. [Google Scholar] [CrossRef] [PubMed] [Green Version]
  9. Li, Y.K.; Fang, J.B.; Qi, X.J.; Lin, M.M.; Zhong, Y.P.; Sun, L.M. A key structural gene, AaLDOX, is involved in anthocyanin biosynthesis in all red-fleshed kiwifruit (Actinidia arguta) based on transcriptome analysis. Gene 2018, 648, 31–41. [Google Scholar] [CrossRef] [PubMed]
  10. Ban, Y.; Kondo, S.; Ubi, B.E.; Honda, C.; Bessho, H.; Moriguchi, T. UDP-sugar biosynthetic pathway: Contribution to cyanidin 3-galactoside biosynthesis in apple skin. Planta 2009, 230, 871–881. [Google Scholar] [CrossRef] [PubMed]
  11. Yang, Y.N.; Yao, G.F.; Zheng, D.M.; Zhang, S.L.; Wang, C.; Zhang, M.Y.; Wu, J. Expression differences of anthocyanin biosynthesis genes reveal regulation patterns for red pear coloration. Plant Cell Rep. 2014, 34, 189–198. [Google Scholar] [CrossRef] [PubMed]
  12. Espley, R.V.; Hellens, R.P.; Putterill, J.; Stevenson, D.E.; Kutty-Amma, S.; Allan, A.C. Red colouration in apple fruit is due to the activity of the MYB transcription factor, MdMYB10. Plant J. 2007, 49, 414–427. [Google Scholar] [CrossRef] [Green Version]
  13. Xu, H.F.; Zou, Q.; Yang, G.X.; Jiang, S.H.; Fang, H.C.; Wang, Y.C.; Zhang, J.; Zhang, Z.Y.; Wang, N.; Chen, X.S. MdMYB6 regulates anthocyanin formation in apple both through direct inhibition of the biosynthesis pathway and through substrate removal. Hortic. Res. 2020, 7, 72–88. [Google Scholar] [CrossRef] [PubMed]
  14. Kobayashi, S.; Goto-Yamamoto, N.; Hirochika, H. Retrotransposon-Induced Mutations in Grape Skin Color. Science 2004, 304, 982. [Google Scholar] [CrossRef] [PubMed]
  15. Tirumalai, V.; Swetha, C.; Nair, A.; Pandit, A.; Shivaprasad, P.V. miR828 and miR858 regulate VvMYB114 to promote anthocyanin and flavonol accumulation in grapes. J. Exp. Bot. 2019, 70, 4775–4791. [Google Scholar] [CrossRef] [Green Version]
  16. Jin, W.M.; Wang, H.; Li, M.F.; Wang, J.; Yang, Y.; Zhang, X.M.; Yan, G.H.; Zhang, H.; Liu, J.S.; Zhang, K.C. The R2R3 MYB transcription factor PavMYB10.1 involves in anthocyanin biosynthesis and determines fruit skin colour in sweet cherry (Prunus avium L.). Plant Biotechnol. J. 2016, 14, 2120–2133. [Google Scholar] [CrossRef] [Green Version]
  17. Li, Y.; Xu, P.B.; Chen, G.Q.; Wu, J.; Liu, Z.C.; Lian, H.L. FvbHLH9, functions as a positive regulator of anthocyanin biosynthesis, by forming HY5-bHLH9 transcription complex in strawberry fruits. Plant Cell Physiol. 2020, 61, 826–837. [Google Scholar] [CrossRef]
  18. Xie, X.B.; Li, S.; Zhang, R.F.; Zhao, J.; Chen, Y.C.; Zhao, Q.; Yao, Y.X.; You, C.X.; Zhang, X.S.; Hao, Y.J. The bHLH transcription factor MdbHLH3 promotes anthocyanin accumulation and fruit colouration in response to low temperature in apples. Plant Cell Environ. 2012, 35, 1884–1897. [Google Scholar] [CrossRef]
  19. An, J.P.; Wang, X.F.; Zhang, X.W.; Xu, H.F.; Bi, S.Q.; You, C.X.; Hao, Y.J. An apple MYB transcription factor regulates cold tolerance and anthocyanin accumulation and undergoes MIEL1-mediated degradation. Plant Biotechnol. J. 2019, 18, 337–353. [Google Scholar] [CrossRef] [PubMed] [Green Version]
  20. Lai, B.; Du, L.N.; Liu, R.; Hu, B.; Su, W.B.; Qin, Y.H.; Zhao, J.T.; Wang, H.C.; Hu, G.B. Two LcbHLH Transcription factors interacting with LcMYB1 in regulating late structural genes of anthocyanin biosynthesis in Nicotiana and Litchi chinensis during anthocyanin accumulation. Front. Plant Sci. 2016, 7, 166. [Google Scholar] [CrossRef] [Green Version]
  21. Wang, L.H.; Tang, W.; Hu, Y.W.; Zhang, Y.B.; Sun, J.Q.; Guo, X.H.; Lu, H.; Yang, Y.; Fang, C.B.; Niu, X.L.; et al. A MYB/bHLH complex regulates tissue-specific anthocyanin biosynthesis in the inner pericarp of red-centered kiwifruit Actinidia chinensis cv. Hongyang. Plant J. 2019, 99, 359–378. [Google Scholar] [PubMed]
  22. Vallarino, J.G.; Merchante, C.; Sánchez-Sevilla, J.F.; Balaguer, M.A.; Pott, D.M.; Ariza, M.T.; Casañal, A.; Posé, D.; Vioque, A.; Amaya, I.; et al. Characterizing the involvement of FaMADS9 in the regulation of strawberry fruit receptacle development. Plant Biotechnol. J. 2019, 18, 1–15. [Google Scholar] [CrossRef] [PubMed] [Green Version]
  23. Li, C.; Wu, J.; Hu, K.D.; Wei, S.W.; Sun, H.Y.; Hu, L.Y.; Han, Z.; Yao, G.F.; Zhang, H. PyWRKY26 and PybHLH3 cotargeted the PyMYB114 promoter to regulate anthocyanin biosynthesis and transport in red-skinned pears. Hortic. Res. 2020, 7, 37–48. [Google Scholar] [CrossRef] [PubMed] [Green Version]
  24. Zhou, H.; Lin-Wang, K.; Wang, H.L.; Gu, C.; Dare, A.P.; Espley, R.V.; He, H.P.; Allan, A.C.; Han, Y.P. Molecular genetics of blood-fleshed peach reveals activation of anthocyanin biosynthesis by NAC transcription factors. Plant J. 2015, 82, 105–121. [Google Scholar] [CrossRef] [PubMed]
  25. Jaakola, L.; Poole, M.; Jones, M.O.; Kämäräinen-Karppinen, T.; Koskimäki, J.J.; Hohtola, A.; Häggman, H.; Fraser, P.D.; Manning, K.; King, G.J.; et al. A SQUAMOSA MADS box gene involved in the regulation of anthocyanin accumulation in bilberry fruits. Plant Physiol. 2010, 153, 1619–1629. [Google Scholar] [CrossRef] [PubMed] [Green Version]
  26. An, J.P.; Zhang, X.W.; Bi, S.Q.; You, C.X.; Wang, X.F.; Hao, Y.J. The ERF transcription factor MdERF38 promotes drought stress-induced anthocyanin biosynthesis in apple. Plant J. 2020, 101, 573–589. [Google Scholar] [CrossRef] [PubMed]
  27. Shen, X.J.; Zhao, K.; Liu, L.L.; Zhang, K.C.; Yuan, H.Z.; Liao, X.; Wang, Q.; Guo, X.W.; Li, F.; Li, T.H. A role for PacMYBA in ABA-regulated anthocyanin biosynthesis in red-colored sweet cherry cv. Hong Deng (Prunus avium L.). Plant Cell Physiol. 2014, 55, 862–880. [Google Scholar] [CrossRef]
  28. Liu, Y.; Shen, X.J.; Zhao, K.; Ben, Y.; Guo, X.W.; Zhang, X.M.; Li, T.H. Expression analysis of anthocyanin biosynthetic genes in different colored sweet cherries (Prunus avium L.) during fruit development. J. Plant Growth Regul. 2013, 32, 901–907. [Google Scholar] [CrossRef]
  29. Lin-Wang, K.; Bolitho, K.; Grafton, K.; Kortstee, A.; Karunairetnam, S.; McGhie, T.K.; Espley, R.V.; Hellens, R.P.; Allan, A.C. An R2R3 MYB transcription factor associated with regulation of the anthocyanin biosynthetic pathway in Rosaceae. BMC Plant Biol. 2010, 10, 50–66. [Google Scholar] [CrossRef] [Green Version]
  30. Starkevič, P.; Paukštytė, J.; Kazanavičiūtė, V.; Denkovskienė, E.; Stanys, V.; Bendokas, V.; Šikšnianas, T.; Ražanskienė, A.; Ražanskas, R. Expression and anthocyanin biosynthesis-modulating potential of sweet cherry (Prunus avium L.) MYB10 and bHLH genes. PLoS ONE 2015, 10, e0126991. [Google Scholar] [CrossRef]
  31. Sooriyapathirana, S.S.; Khan, A.; Sebolt, A.M.; Wang, D.; Bushakra, J.M.; Lin-Wang, K.; Allan, A.C.; Gardiner, S.E.; Chagné, D.; Iezzoni, A.F. QTL analysis and candidate gene mapping for skin and flesh color in sweet cherry fruit (Prunus avium L.). Tree Genet. Genomes 2010, 6, 821–832. [Google Scholar] [CrossRef]
  32. Langfelder, P.; Horvath, S. WGCNA: An R package for weighted correlation network analysis. BMC Bioinform. 2008, 9, 559. [Google Scholar] [CrossRef] [PubMed] [Green Version]
  33. Zhang, A.D.; Wang, W.Q.; Tong, Y.; Li, M.J.; Grierson, D.; Ferguson, I.B.; Chen, K.S.; Yin, X.R. Transcriptome analysis identifies a zinc finger protein regulating starch degradation in kiwifruit. Plant Physiol. 2018, 178, 850–863. [Google Scholar] [CrossRef] [PubMed] [Green Version]
  34. Hellens, R.P.; Allan, A.C.; Friel, E.N.; Bolitho, K.; Grafton, K.; Templeton, M.D.; Karunairetnam, S.; Gleave, A.P.; Laing, W.A. Transient expression vectors for functional genomics, quantification of promoter activity and RNA silencing in plants. Plant Methods 2005, 1, 13. [Google Scholar] [CrossRef] [PubMed] [Green Version]
  35. Liu, Q.B.; Huang, X.X.; Bai, M.; Chang, X.B.; Yan, X.J.; Zhu, T.; Zhao, W.; Peng, Y.; Song, S.J. Antioxidant and anti-inflammatory active dihydrobenzofuran neolignans from the seeds of Prunus tomentosa. J. Agr. Food Chem. 2014, 62, 7796–7803. [Google Scholar] [CrossRef]
  36. Guo, X.; Wang, Y.T.; Zhai, Z.F.; Huang, T.J.; Zhao, D.; Peng, X.; Feng, C.; Xiao, Y.H.; Li, T.H. Transcriptomic analysis of light-dependent anthocyanin accumulation in bicolored cherry fruits. Plant Physiol. Bioch. 2018, 130, 663–677. [Google Scholar] [CrossRef]
  37. Peng, Y.Y.; Lin-Wang, K.; Cooney, J.M.; Wang, T.C.; Espley, R.V.; Allan, A.C. Differential regulation of the anthocyanin profile in purple kiwifruit (Actinidia species). Hortic. Res. 2019, 6, 3–18. [Google Scholar] [CrossRef] [Green Version]
  38. Wang, S.Y.; Camp, M.J.; Ehlenfeldt, M.K. Antioxidant capacity and α-glucosidase inhibitory activity in peel and flesh of blueberry (Vaccinium spp.) cultivars. Food Chem. 2012, 132, 1759–1768. [Google Scholar] [CrossRef]
  39. Brahem, M.; Renard, C.M.G.C.; Eder, S.; Loonis, M.; Ouni, R.; Mars, M.; Le Bourvellec, C. Characterization and quantification of fruit phenolic compounds of European and Tunisian pear cultivars. Food Res. Int. 2017, 95, 125–133. [Google Scholar] [CrossRef]
  40. Zhang, X.; Xu, J.H.; Xu, Z.B.; Sun, X.H.; Zhu, J.; Zhang, Y.G. Analysis of antioxidant activity and flavonoids metabolites in peel and flesh of red-fleshed apple varieties. Molecules 2020, 25, 1968. [Google Scholar] [CrossRef] [Green Version]
  41. Zhang, H.L.; Zhao, X.J.; Zhang, J.P.; Yang, B.; Yu, Y.H.; Liu, T.F.; Nie, B.H.; Song, B.T. Functional analysis of an anthocyanin synthase gene StANS in potato. Sci. Hortic. 2020, 272, 109569. [Google Scholar] [CrossRef]
  42. Kim, S.; Binzel, M.L.; Yoo, K.S.; Park, S.; Pike, L.M. Pink (P), a new locus responsible for a pink trait in onions (Allium cepa) resulting from natural mutations of anthocyanidin synthase. Mol. Genet. Genom. 2004, 272, 18–27. [Google Scholar] [CrossRef]
  43. Jiang, T.; Zhang, M.D.; Wen, C.X.; Xie, X.L.; Tian, W.; Wen, S.Q.; Lu, R.K.; Liu, L.D. Integrated metabolomic and transcriptomic analysis of the anthocyanin regulatory networks in Salvia miltiorrhiza Bge. flowers. BMC Plant Biol. 2020, 20, 349–361. [Google Scholar] [CrossRef] [PubMed]
  44. Wang, N.; Liu, W.J.; Zhang, T.L.; Jiang, S.H.; Xu, H.F.; Wang, Y.C.; Zhang, Z.Y.; Wang, C.Z.; Chen, X. Transcriptomic analysis of red-fleshed apples reveals the novel role of MdWRKY11 in flavonoid and anthocyanin biosynthesis. J. Agr. Food Chem. 2018, 66, 7076–7086. [Google Scholar] [CrossRef] [PubMed]
  45. Mahmood, K.; Xu, Z.H.; El-Kereamy, A.; Casaretto, J.A.; Rothstein, S.J. The Arabidopsis transcription factor ANAC032 represses anthocyanin biosynthesis in response to high sucrose and oxidative and abiotic stresses. Front. Plant Sci. 2016, 7, 1548. [Google Scholar] [CrossRef] [PubMed]
  46. Zhang, J.; Yin, X.S.; Li, H.; Xu, M.; Zhang, M.X.; Li, S.J.; Liu, X.F.; Shi, Y.N.; Grierson, D.; Chen, K.S. ETHYLENE RESPONSE FACTOR39-MYB8 complex regulates low-temperature-induced lignification of loquat fruit. J. Exp. Bot. 2020, 71, 3172–3184. [Google Scholar] [CrossRef] [PubMed]
  47. Kianersi, F.; Abdollahi, M.R.; Mirzaie-asl, A.; Dastan, D.; Rasheed, F. Identification and tissue-specific expression of rutin biosynthetic pathway genes in Capparis spinosa elicited with salicylic acid and methyl jasmonate. Sci. Rep. 2020, 10, 8884–8898. [Google Scholar] [CrossRef]
  48. Gao, Z.Y.; Sun, W.J.; Wang, J.; Zhao, C.Y.; Zuo, K.J. GhbHLH18 negatively regulates fiber strength and length by enhancing lignin biosynthesis in cotton fibers. Plant Sci. 2019, 286, 7–16. [Google Scholar] [CrossRef]
  49. Feller, A.; Machemer, K.; Braun, E.L.; Grotewold, E. Evolutionary and comparative analysis of MYB and bHLH plant transcription factors. Plant J. 2011, 66, 94–116. [Google Scholar] [CrossRef]
  50. Petridis, A.; Döll, S.; Nichelmann, L.; Bilger, W.; Mock, H.P. Arabidopsis thaliana G2-LIKE FLAVONOID REGULATOR and BRASSINOSTEROID ENHANCED EXPRESSION1 are low-temperature regulators of flavonoid accumulation. New Phytol. 2016, 211, 912–925. [Google Scholar] [CrossRef] [Green Version]
  51. Tao, R.Y.; Yu, W.J.; Gao, Y.H.; Ni, J.B.; Yin, L.; Zhang, X.; Li, H.X.; Wang, D.S.; Bai, S.L.; Teng, Y.W. Light-induced basic/helix-loop-helix enhances anthocyanin biosynthesis and undergoes constitutively photomorphogenic 1-mediated degradation in pear. Plant Physiol. 2020, 184, 1684–1701. [Google Scholar] [CrossRef]
  52. Jiang, Y.H.; Liu, C.H.; Yan, D.; Wen, X.H.; Liu, Y.L.; Wang, H.J.; Dai, J.Y.; Zhang, Y.J.; Liu, Y.F.; Zhou, B.; et al. MdHB1 down-regulation activates anthocyanin biosynthesis in the white-fleshed apple cultivar ‘Granny Smith’. J. Exp. Bot. 2017, 68, 1055–1069. [Google Scholar] [CrossRef] [Green Version]
  53. Zhang, S.Y.; Chen, Y.X.; Zhao, L.L.; Li, C.Q.; Yu, J.Y.; Li, T.T.; Yang, W.Y.; Zhang, S.N.; Su, H.Y.; Wang, L. A novel NAC transcription factor, MdNAC42, regulates anthocyanin accumulation in red-fleshed apple by interacting with MdMYB10. Tree Physiol. 2020, 40, 413–423. [Google Scholar] [CrossRef]
  54. Stracke, R.; Ishihara, H.; Huep, G.; Barsch, A.; Mehrtens, F.; Niehaus, K.; Weisshaar, B. Differential regulation of closely related R2R3-MYB transcription factors controls flavonol accumulation in different parts of the Arabidopsis thaliana seedling. Plant J. 2007, 50, 660–677. [Google Scholar] [CrossRef] [Green Version]
Figure 1. Coloration and anthocyanin content during fruit development and in different parts of sweet cherry cultivar ‘Hong Deng’. Samples were analyzed at 33 days after full bloom (DAFB) and at 48 DAFB. PHD: peel of ‘Hong Deng’ sweet cherry, FHD: flesh of ‘Hong Deng’ sweet cherry. The error bars represent SEs from three replicates. The different letters above each column indicate significance at p < 0.05 according to Tukey’s test.
Horticulturae 07 00123 g001
Figure 2. The RNA−seq expression profiles during ‘Hong Deng’ fruit development (33 DAFB and 44 DAFB) and in different parts (peel and flesh). (A) Principal component analysis of the RNA−seq data. (B) Numbers of differentially expressed genes (DEGs) in four groups. (C) Heatmap of transcriptome analysis of DEGs in ‘Hong Deng’. Red color indicates increased gene transcript levels; green color indicates decreased gene transcript levels. (D) Cluster trend analysis of significantly DEGs.
Horticulturae 07 00123 g002
Figure 3. Co−expression network analysis of ‘Hong Deng’ transcriptomes with anthocyanin content. (A) Dendrogram plot of samples and heatmap with anthocyanin content. (B) Hierarchical cluster tree with color annotation showing 14 co−expression modules for co−expressed genes. (C) Module−color correlations and corresponding p-values. The left panel shows 14 modules, and the right color scale shows the modules’ correlations from −1 to 1.
Horticulturae 07 00123 g003
Figure 4. Expression of structural genes and transcription factors (TFs) with putative functions in sweet cherry anthocyanin biosynthesis from RNA−seq. FPKM (fragments per kilobase of exon model per million mapped reads) values were used to draw the heatmap. Transcript abundance is indicated by color−the redder the square, the higher the expression.
Horticulturae 07 00123 g004
Figure 5. Expression of putative anthocyanin biosynthetic genes during ‘Hong Deng’ development and in different parts, as evaluated by real-time PCR. (A) Gene expression of two structure genes. (B) Gene expression of 11 transcription factors. Error bars represent SEs from three replicates. The different letters above each column indicate significance at p < 0.05 according to Tukey’s test.
Horticulturae 07 00123 g005
Figure 6. Regulatory effects of TFs on the PacANS promoter, as determined by dual-luciferase assay. The ratio of LUC/REN in the empty vector plus promoter was set as 1. SK refers to the empty pGreen II 0029 62-SK vector. Error bars represent SEs from three replicates. ‘***’ indicate significance levels at p < 0.001.
Horticulturae 07 00123 g006
Publisher’s Note: MDPI stays neutral with regard to jurisdictional claims in published maps and institutional affiliations.

