2. Material and Methods
The experiment was carried out in the municipality of Castanhal, located in northeastern state of Pará, Brazil, from 2015 to 2016, in area of approximately 0.5 hectares, situated at the experimental farm belonging to the Federal Rural University of the Amazon (UFRA) (1°19′24″ S Latitude, 47°57′38″ W Longitude, 41 m Altitude). The climate of the experimental area is defined as Am according to Köppen’s climatic classification, a tropical climate, showing a moderate dry season with average annual rainfall from 2000 to 2500 mm. The driest season occurs between June and November, while the rainiest season is from December to May.
A randomized block design was used, with six replications and four treatments, evaluating different levels of water availability in the soil, starting from the reproductive phase of cowpea. The experimental units consisted of plots with 22 × 24 m, separated by a 1 m border area, with a spacing of 0.5 m between planting lines and 0.1 m between plants, composing a density of 200,000 plants per hectare.
To identify the physical and chemical attributes of the soil in the experimental area, two collections were carried out at a depth of 0–20 cm, which corresponded to a large part of the effective depth explored by the cowpea root system [
4]. The analyses were performed at the Soil Laboratory of the Brazilian Agricultural Research Corporation–Eastern Amazon (Belém, Pará, Brazil), and the results are expressed in
Table 1.
Sowing was carried out manually on 23 September 2015 and on 17 September 2016. The cultivar used was BR3-Tracateua, which is recommended for the region [
1]. Fertilizations were performed according to the soil chemical analysis, applying 350 kg ha
−1 of chemical fertilizer with NPK formulation 10-20-20 for the 2015 experiment, and 195 kg ha
−1 of chemical fertilizer with NPK formulation 6-18-15 for the 2016 experiment. Fertilization and other management practices were carried out following technical recommendations for the crop in the region [
3].
Four treatments were tested: T1—the replacement of 100% of the water (irrigation + rainfall) lost by the crop evapotranspiration (ETc); T2—replacement of 50% of the water lost by ETc; T3—replacement of 25% of the water lost by ETc; and T4—without replacement of the water lost by ETc. For the T4 treatment of each block, mobile covers of 100-micron transparent polypropylene were built, with 1.5 m height, aiming at preventing the entry of water through rainfall, starting from the reproductive stages and installed only in the rainfall period, during the day. The plastic cover was not installed during the night to avoid possible heating by the retention of long-wave radiation at night. Coincidentally, no rain events occurred during the night.
A drip irrigation system was used. To determine the water depth, the reference evapotranspiration (ET
0) was calculated using the Penman–Monteith equation [
9] using data obtained from the meteorological station of the National Institute of Meteorology (INMET), installed 2 km from the experimental area. The ET
0 was multiplied by the crop coefficient (Kc) of each cowpea phase available in the literature [
2] to obtain the maximum crop evapotranspiration.
During the vegetative phase, all treatments were kept close to the field capacity—that is, with replacement of 100% of the ETc. The differentiation of water depths in T2 and T3 treatments, as well as the interruption of irrigation in T4, occurred 36 days after sowing (DAS) for 2015 and 2016, when the crop reached the reproductive phase. Irrigation was interrupted 58 DAS in 2015 and 61 DAS in 2016, when the grain ripening phase (R9) was reached.
It is important to mention that, during the experimental period, the irrigation was interrupted when precipitation exceeded the daily ETc, aiming not to raise the soil moisture above the field capacity, controlling the entry of water into the soil and restarting the irrigation when soil moisture reached the value before the rain event. It was monitored using Time Domain Reflectometer sensors installed in each treatment.
In the center of the experimental area, an automatic meteorological station was installed for meteorological data collection, including air temperature, relative air moisture, volumetric water content in the soil and rainfall. All sensors were connected to a CR10× datalogger (Campbell Scientific, Inc., Logan, UT, USA), configured for reading every ten seconds, recording total and average values every ten minutes. To quantify the deficiencies caused by treatments subjected to water deficit, the sequential water balance was carried out according to Carvalho et al.; for more details, see in Nunes et al. [
10]. Accumulated soil water deficiency was obtained as a cumulative difference between daily ETc and daily actual evapotranspiration.
The phenological stages of cowpea were monitored daily. In order to achieve this, the Geptz and Fernández scale was used. For each treatment, in all blocks, 1 m-long lines containing 10 plants were selected, which were monitored from plant emergency. The change regarding the phenological phase was characterized when 50% + 1 of the plants from the line showed the characteristics described by Farias et al. [
1].
Productivity was measured 65 DAS in 2015 and 68 DAS in 2016, when 90% of the plants reached the R9 phenological stage. In both years, the productivity was determined considering two planting lines previously separated in each treatment, from where three samples of 1 m2 were collected, represented by 2 m-long lines. After collection, the grains were dried for 72 h, weighed, and the production was estimated for each treatment.
Determinations of net photosynthetic rate (A), stomatal conductance (gs), leaf transpiration (Eleaf), substomatal CO2 concentration (Ci), and leaf temperature (Tleaf) were performed between 8 and 11 h am using a portable, open-system infrared gas analyzer (model LI-6400 XT, LI-COR Biosci. Inc., Lincoln, Nebraska, USA), set up to work with a constant photosynthetic photon flux density of 1500 μmol photons m−2 s−1, with a CO2 flow of 400 μmol mol−1. Measurements were carried out at 7, 14, 21, and 28 days after treatment onset (DAT), corresponding, respectively, to the phenological stages R5, R7, R8 and R9.
Air temperature (Tair) and relative humidity (RH) followed environmental conditions. The average Tair during leaf gas exchange measurement intervals in 2015 (2016) were 27.5 ± 0.03 °C (29.8 ± 0.27 °C); 27.6 ± 0.04 °C (29.8 ± 0.36 °C); 29.4 ± 0.03 °C (30.4 ± 0.26 °C) and 29.2 ± 0.07 °C (30.9 ± 0.34 °C) at 7, 14, 21 and 28 DAT, respectively. The average RH under same conditions were 67.1 ± 2.47% (69.4 ± 1.03%); 62.9 ± 1.82% (70.6 ± 1.91%); 63.4 ± 1.84% (66.9 ± 1.17%) and 66.0 ± 1.61% (63.4 ± 1.85%) at 7, 14, 21 and 28 DAT, in 2015 (2016), respectively.
Two healthy and fully expanded leaflets from the medium portion of the third or fourth leaf from the apex were sampled for leaf gas exchange measurements. After that, the same leaflets were excised and immediately placed in a Scholander-type pressure chamber (model 3115, Soilmoisture equipement Copr., Santa Barbara, California, USA) for leaf water potential (Ψw) determination. Ecophysiological data collections followed the same randomized block design, with six replications and four treatments, evaluating different levels of water availability in the soil, starting from the reproductive phase of cowpea, including two samples per treatment in the six blocks, composed of 48 plants per collection.
Results were submitted to regression analysis, and the significance of the generated equations was verified according to the F test [
4], considering them valid as long as they were greater than 95% of probability. Productivity and ecophysiological variables data were subjected to analysis of variance and the means were compared by Tukey’s test at 5% probability, using ORIGIN PRO 8.0v software (OriginLab Corp., Northampton, MA, USA) [
11].
3. Results
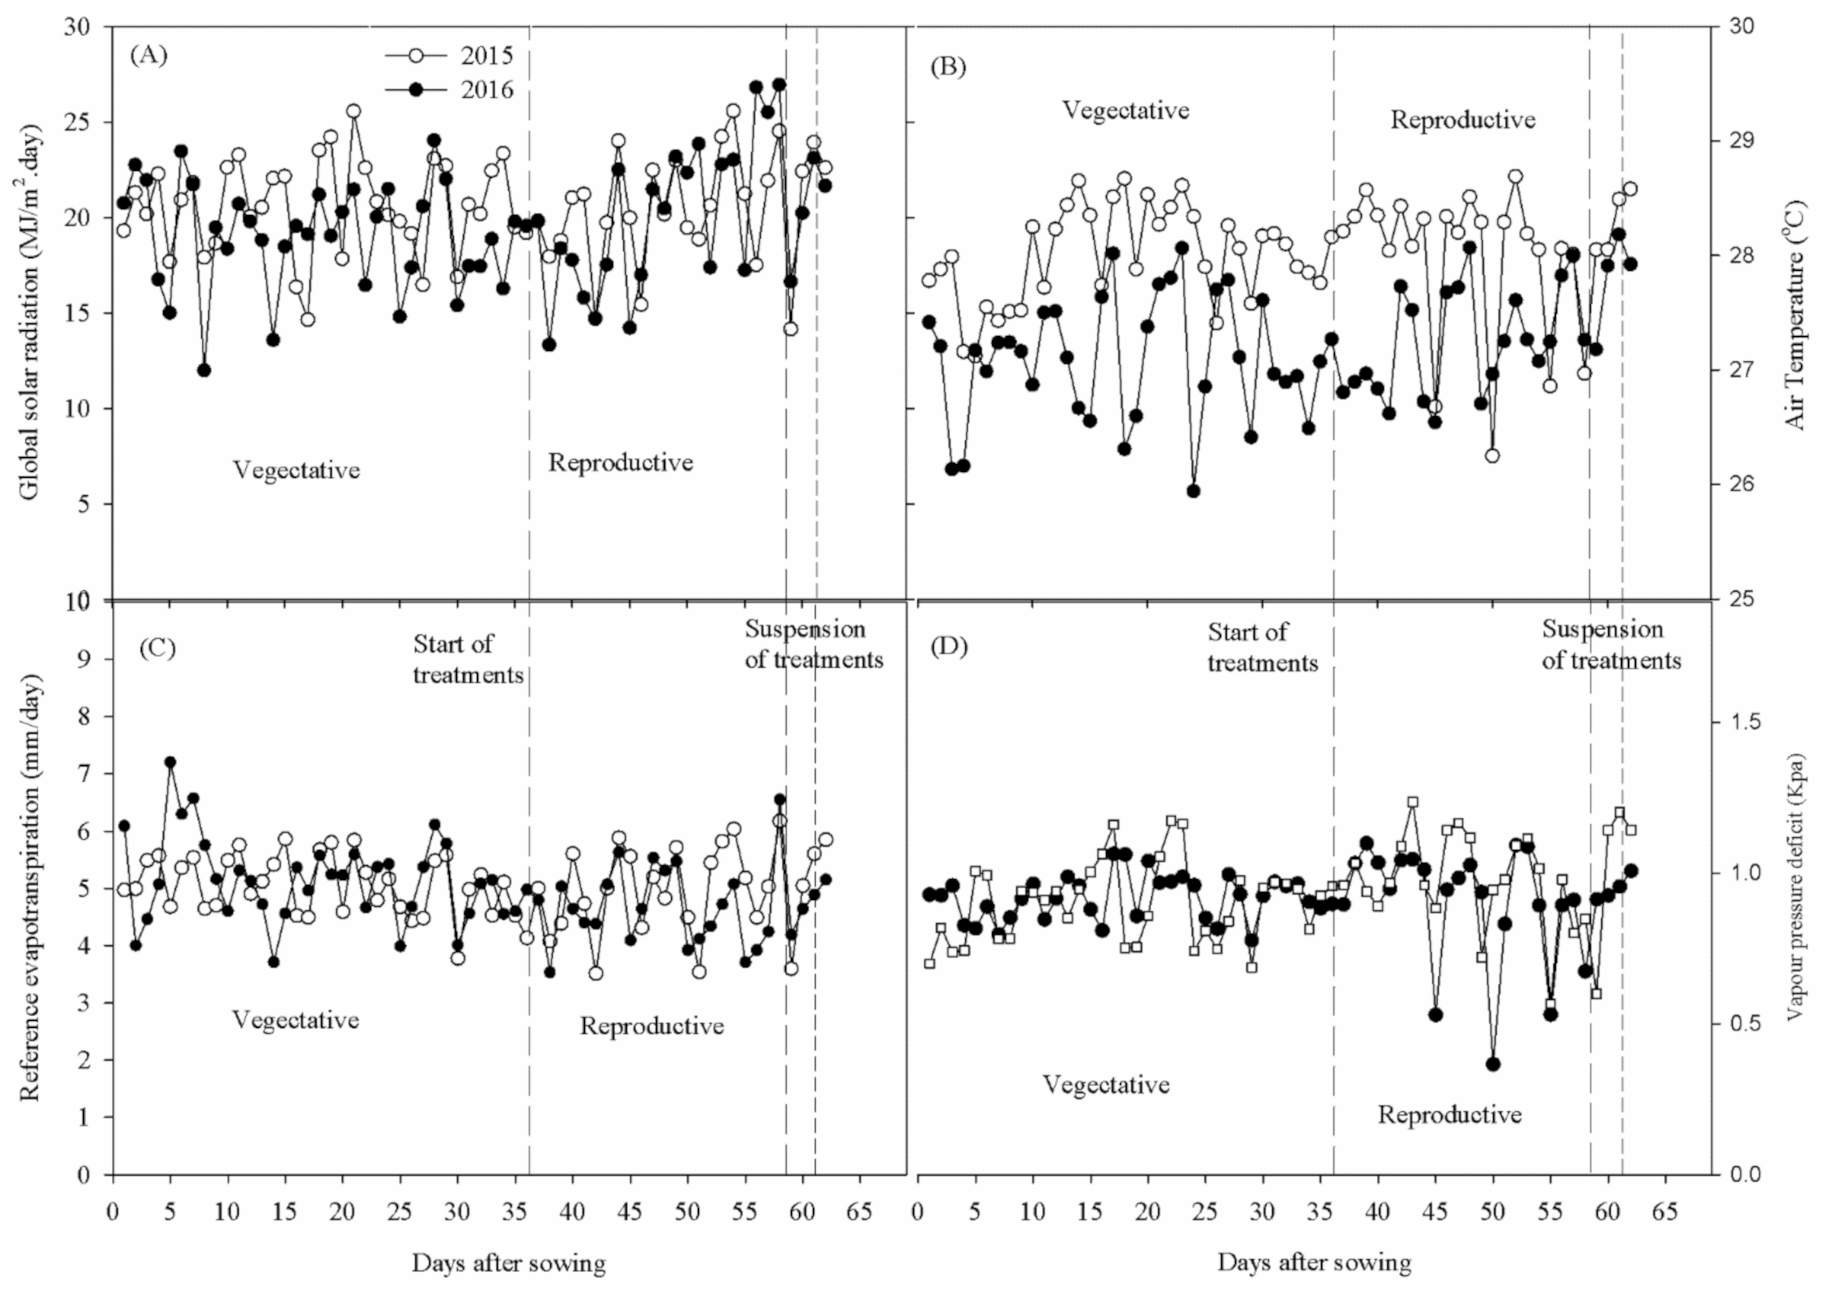
The experiment of 2015 was carried out under effect of an El Niño phenomenon [
12]. However, the daily averages of meteorological data observed between September and November 2015 and 2016 showed similar patterns in air temperature (T
air), reference evapotranspiration (ET
0), global solar radiation (Sin), and vapor pressure deficit (VPD) variables (
Figure 1). The average Tair values were 28.0 and 27.2 °C for 2015 and 2016, respectively. The average ET
0 values were 5.0 mm day
−1 in 2015 and 4.9 mm day
−1 in 2016. The Sin showed average values equal to 20.6 and 19.5 MJ m
−2 day
−1 for 2015 and 2016, respectively, while the VPD valus were equal to 0.96 kPa for 2015 and 0.93 kPa for 2016.
The total water blade applied for all treatments in 2016 was higher than those applied in 2015, which can be explained by the rainfall of 141.2 mm during the cowpea vegetative phase in 2016, while there was no rainfall in the same period in 2015, directly influencing the total number of irrigations (
Table 2). However, when comparing only the reproductive phase (differentiation of treatments), the water blade was higher in 2015 than in 2016, since the precipitation values in this interval were 30.5 and 12.2 mm, respectively.
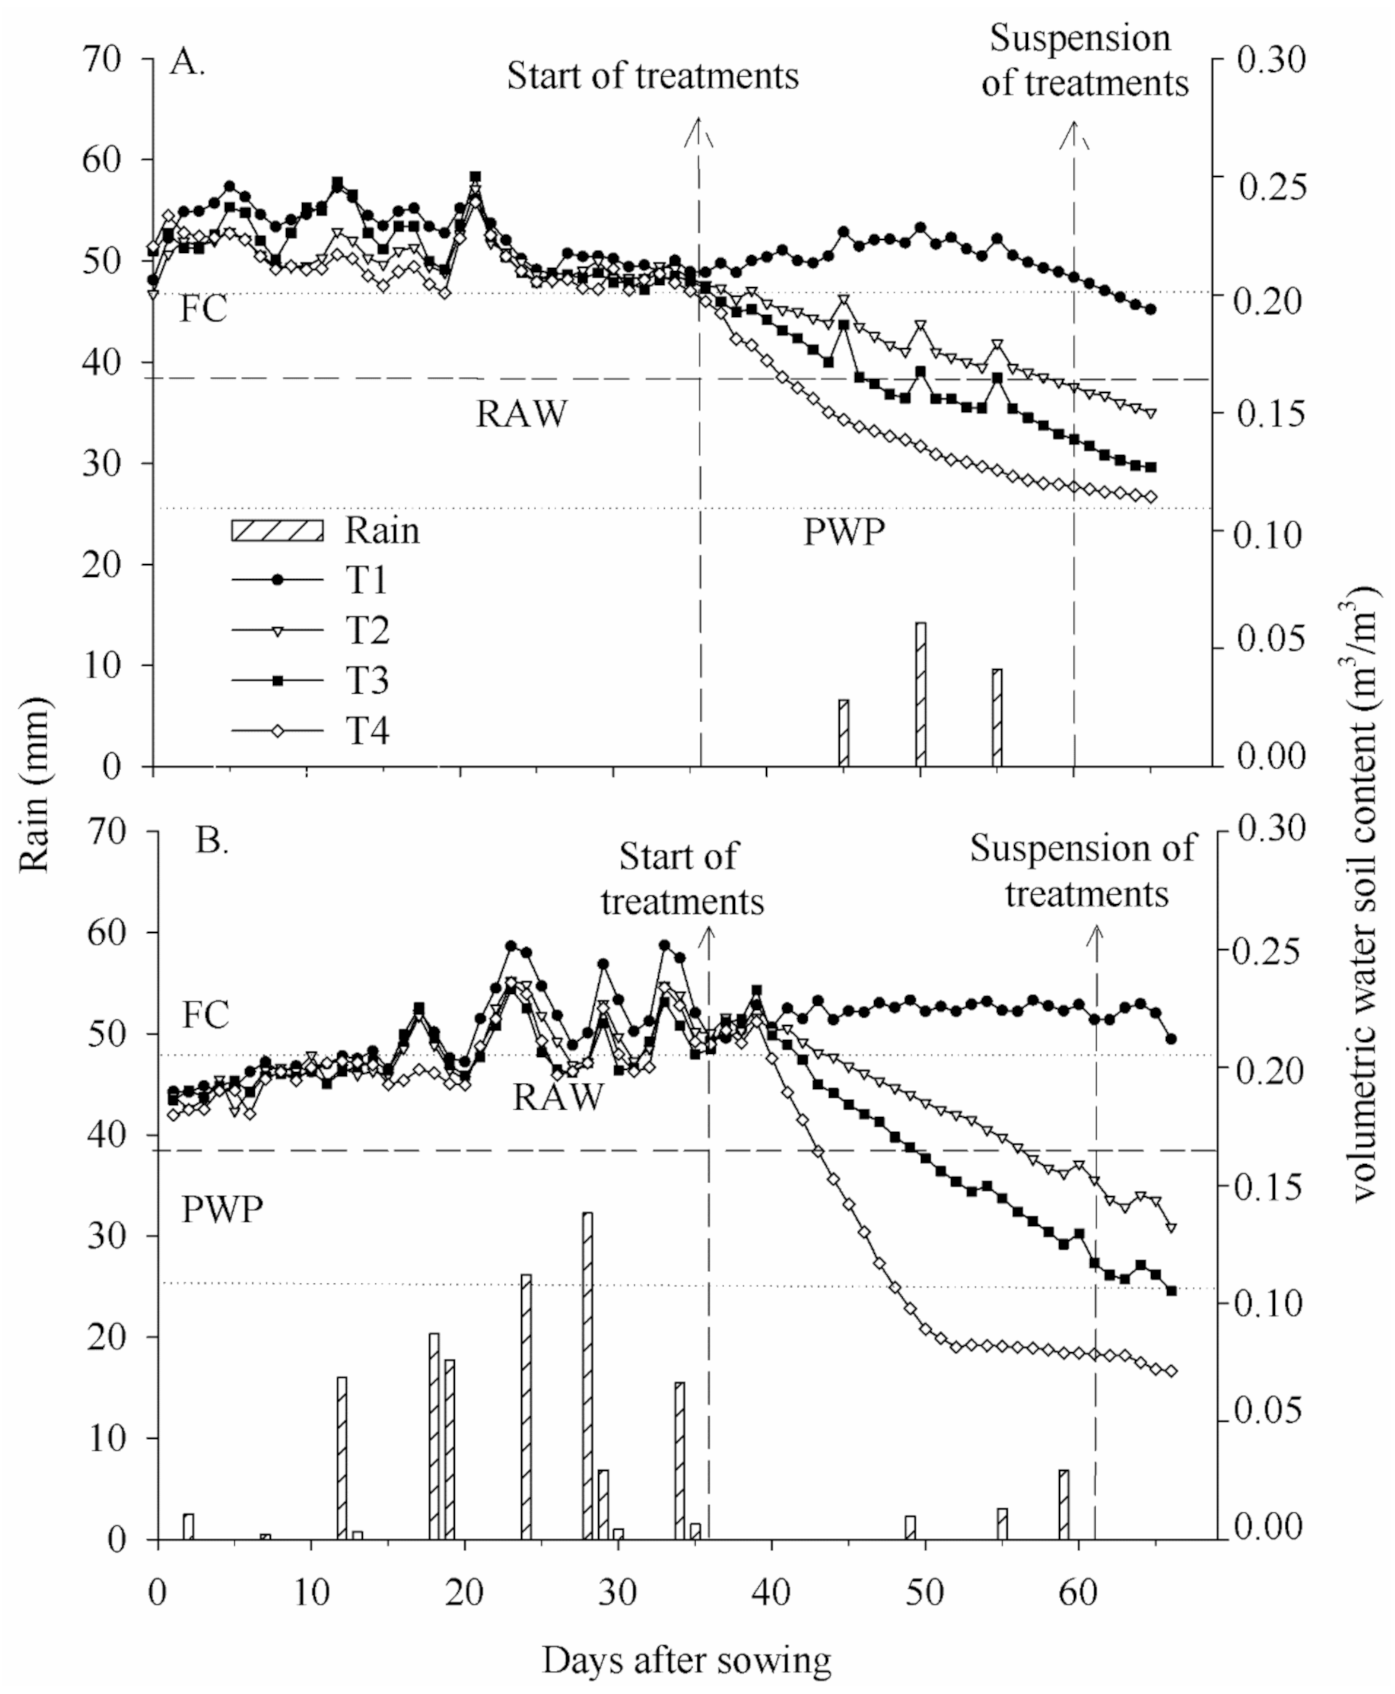
Data of soil moisture and precipitation for 2015 and 2016 are shown in
Figure 2. For both years, soil moisture was controlled during the vegetative period, in order that all treatments had the same water availability. Despite the treatments receiving the same blade, there are small differences in the volumetric water content between them, which may be associated with the differences generated by the installation locations of the sensors.
From the reproductive phase, the volumetric soil water content varied between treatments, exhibiting an expected pattern. In 2015, T1 showed the highest volumetric soil water content, equal to 0.21 m3 m−3, followed by T2 with 0.18 m3 m−3, T3 with 0.16 m3 m−3, and T4 with 0.14 m3 m−3, while in 2016 the results were 0.22, 0.18, 0.16, and 0.12 m3 m−3, for T1, T2, T3 and T4, respectively.
When cowpea reached the R9 stage, irrigation was interrupted to reduce the contained grain moisture, accelerating the grain maturation process. At this time, the values of available soil water content were 108%, 54%, 33% and 3%, and 122%, 47%, 8% and 0% for T1, T2, T3, and T4 treatments in 2015 and 2016, respectively.
Using mobile covers, it was possible to control the entry of water into the soil in T4, which provided a greater change in volumetric soil water content for all treatments. In 2016, T4 reached 0.117 m
3 m
−3 of volumetric soil water content at 47 DAS, close to the permanent wilting point (PWP), corresponding to 0% available soil water content. Ferreira et al. [
13] report that each species differs regarding the response to soil moisture and that PWP in isolation is not a suitable criterion for establishing water availability to the plant.
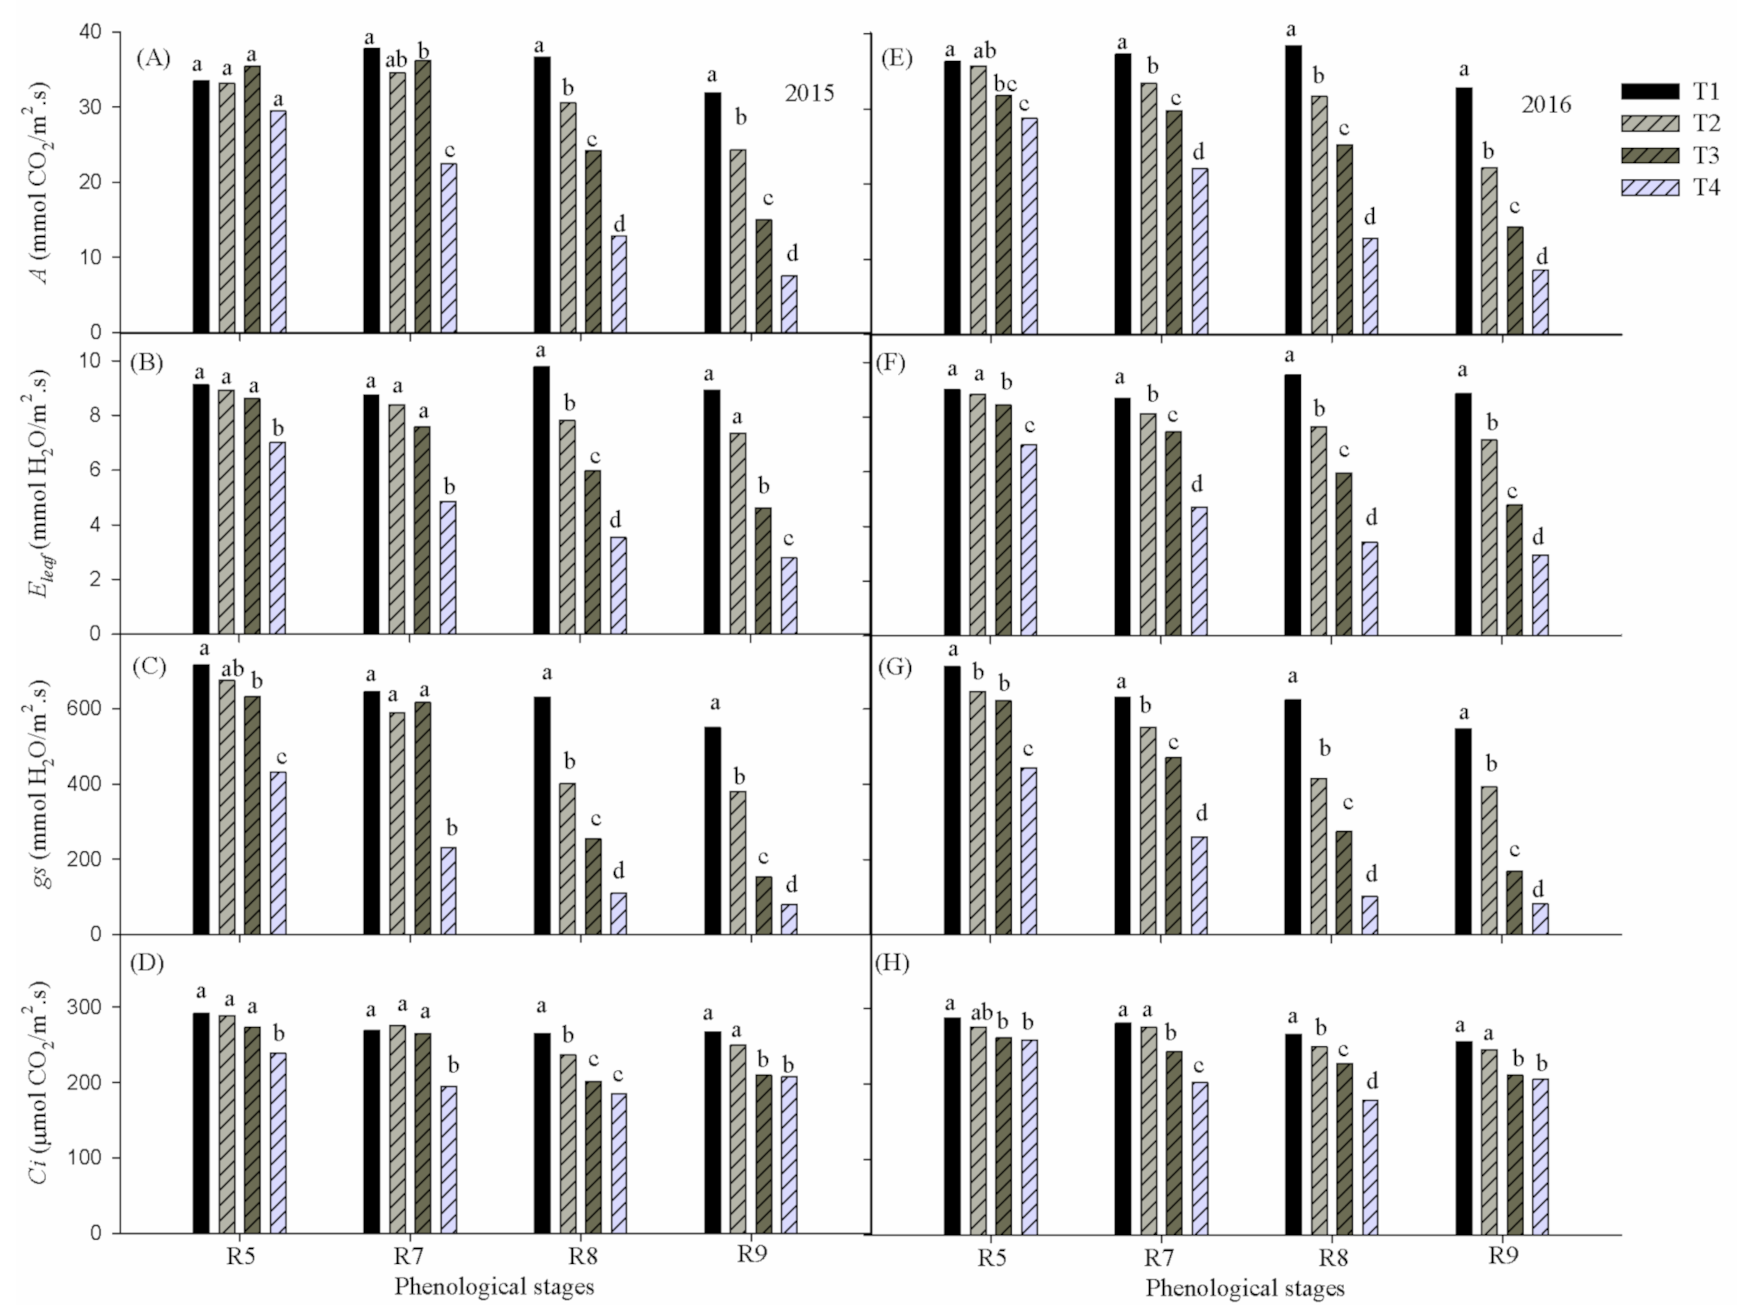
Figure 3 shows the report of ANOVA (Tukey’s test at 5% probability) applied for averages of Net photosynthetic rate (
A), Leaf transpiration (
Eleaf) Stomatal conductance (
gs) and Substomatal CO
2 concentration (
Ci) of cowpea in response to water deficiency under different reproductive phases during 2015 and 2016. It was noted that
A,
Eleaf,
gs and
Ci were higher (
p ≤ 0.05) in the absence of water deficiency regardless of the reproductive phase as well as the year evaluated. Considering that the T1 treatment represents a hypothetically ideal condition in terms of water availability, it is clear that throughout the reproductive phase the ecophysiological variables remained at close levels despite the phenological evolution, corroborating the hypothesis that the differences found over time were more related to the water deficiency factor than due to the natural aging of the plant.
The effects of accumulated water deficiency for the variables as a function of the imposed treatments were more significant (
p ≤ 0.05) after the reproductive phase R5, becoming more accentuated in phases R8 and R9, when all variables differed statistically between treatments (
p ≤0.05), corroborating that the water stress is more severe during the reproductive stage [
5]. However, in the 2016 experiment, variables
A,
Eleaf and
gs started to differ significantly (
p ≤ 0.05) in phase R7. Between phases R5 to R8, all ecophysiological variables showed, in treatments T2 and T3, respectively, values associated with leaf water potential levels (Ψ
w) greater and lesser than −0.8 MPa (data not shown).
The highest rate of A in response to water availability (p ≤ 0.05) occurred in treatment T1 corresponding to 37.8 μmol CO2 m−2 s−1 in phase R7 and 38.4 μmol CO2 m−2 s−1 in phase R8, in 2015 and 2016, respectively. At the end of the experiment (phase R9), the rates of A, Eleaf, gs and Ci were reduced (p ≤ 0.05) to 7.5 (8.5) μmol CO2 m−2 s−1; 2.8 (2.9) mmol H2O m−2 s−1; 78.9 (82.8) mmol H2O m−2 s−1, 207.5 (206.9) mmol H2O m−2 s−1 in the year 2015 (2016).
As there was no significant difference in the effect of water deficiency between the 2015 and 2016 experiments in the ecophysiological variables analyzed [
14], data were grouped for regression analysis.
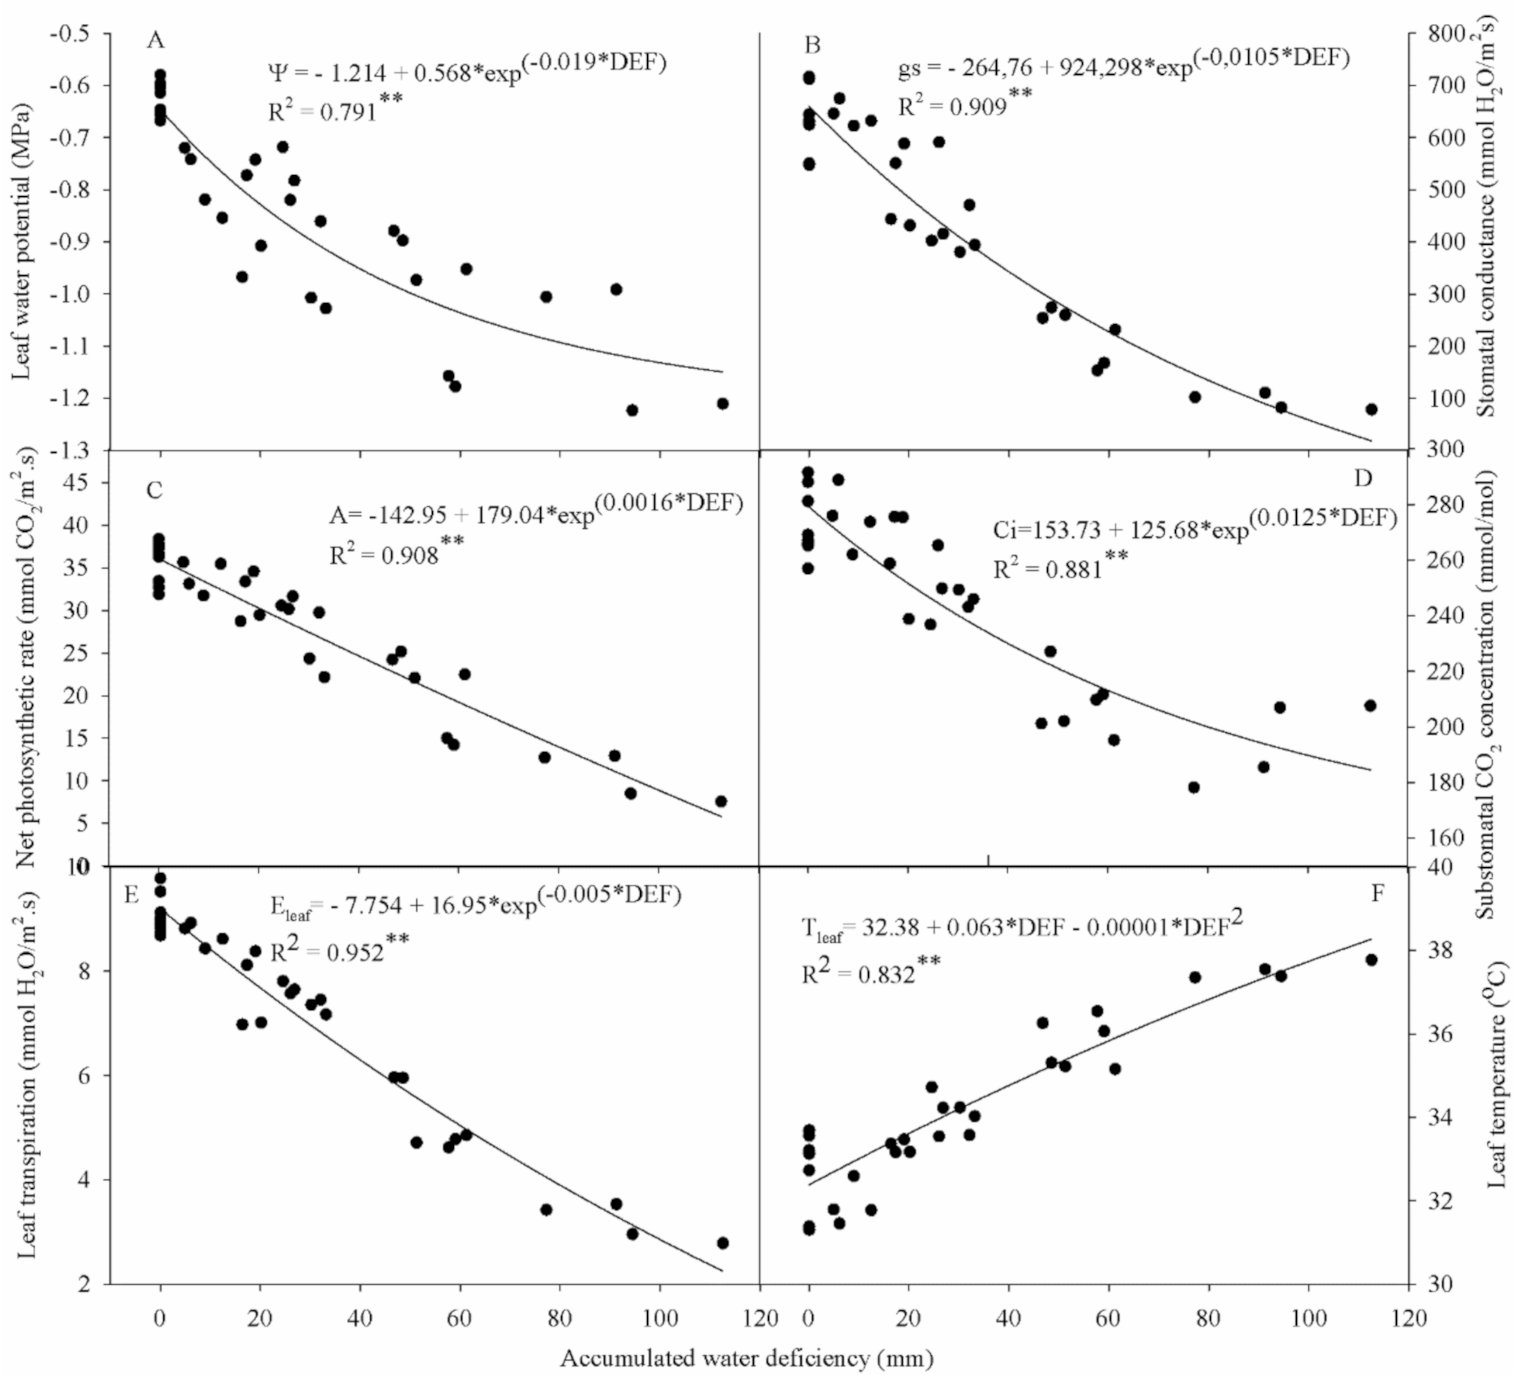
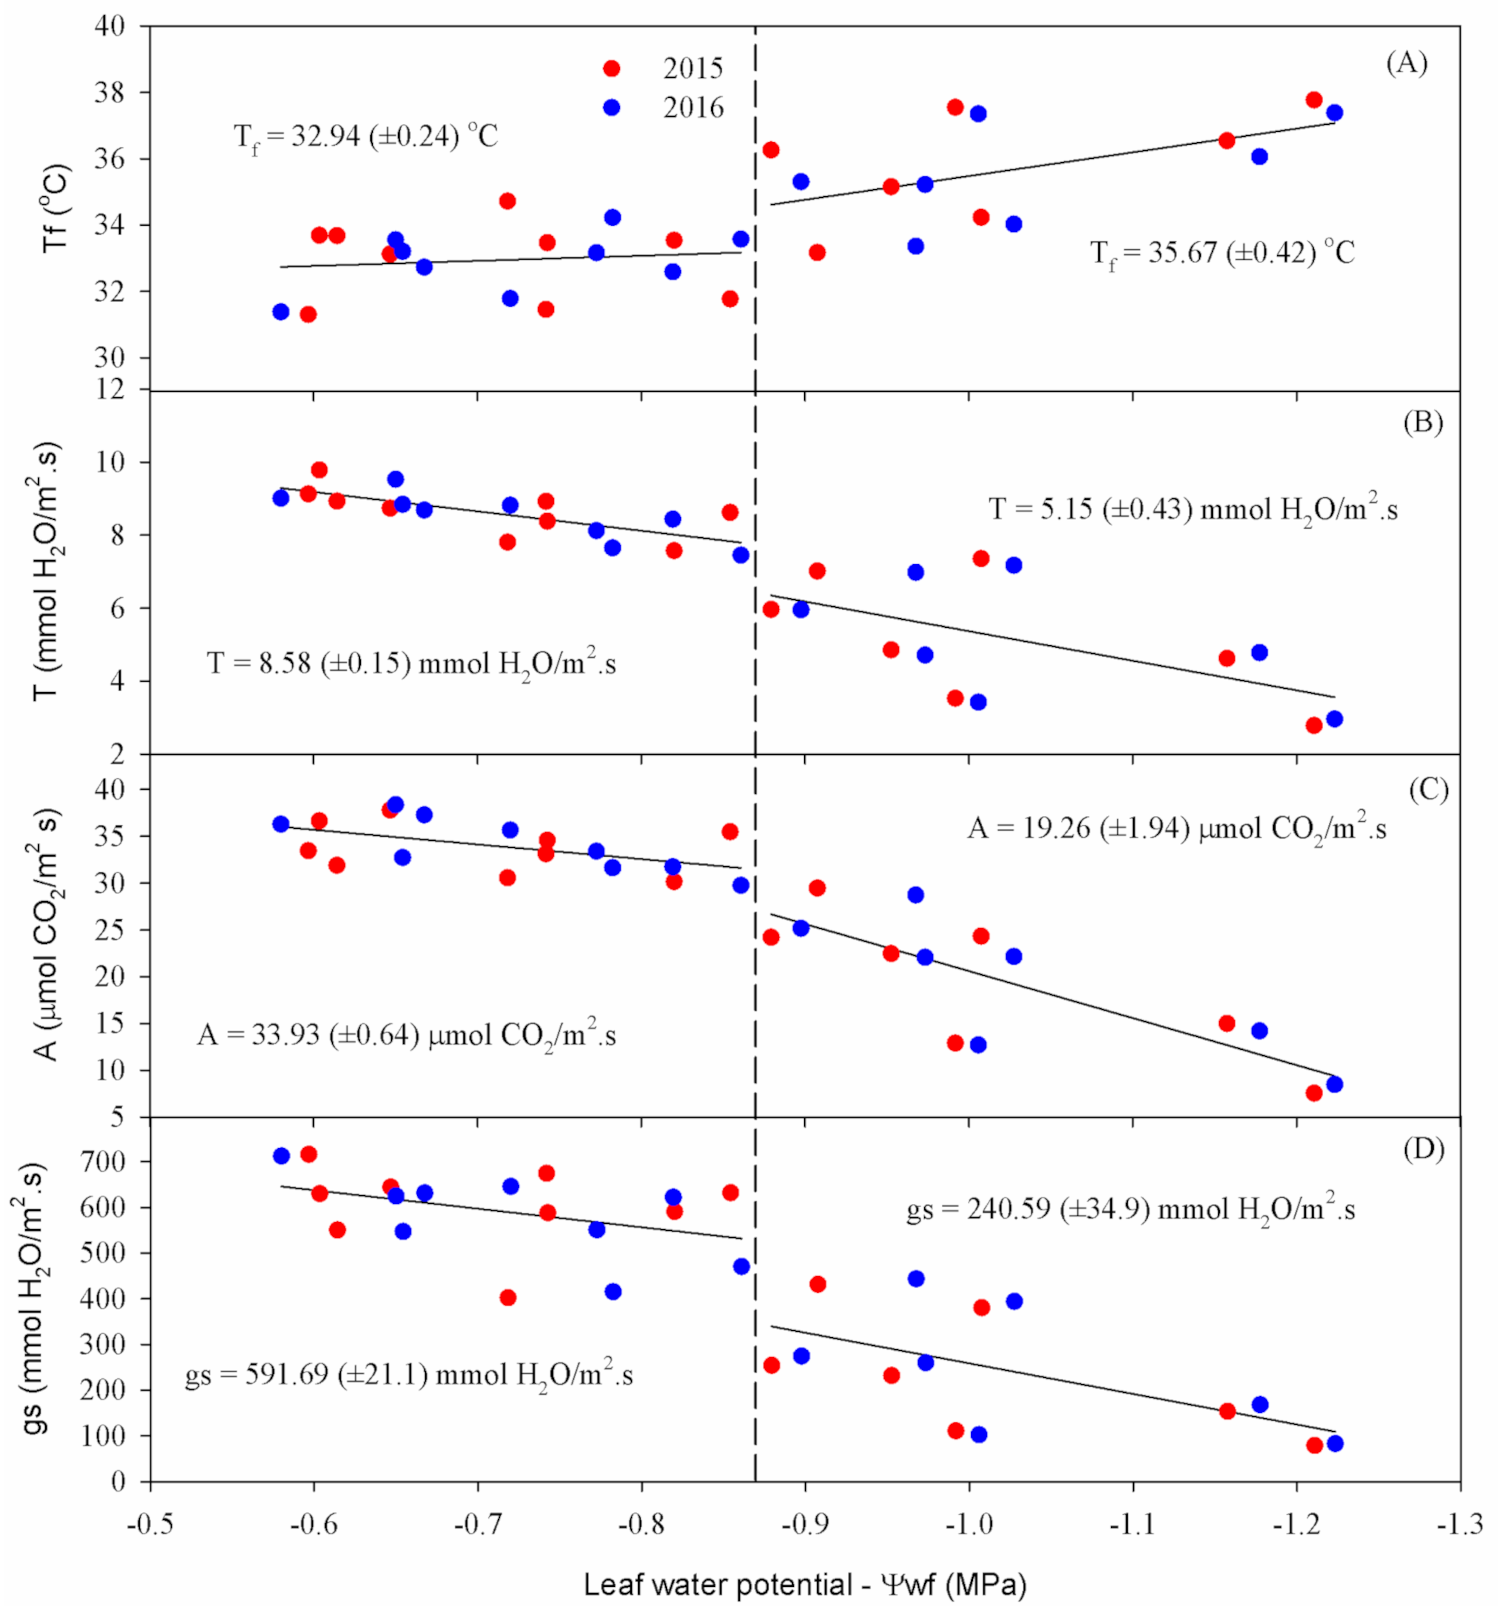
Figure 4 shows leaf water potential (Ψ
w), Stomatal conductance (
gs), Net photosynthetic rate (
A), Substomatal CO
2 concentration (
Ci), leaf transpiration (
Eleaf) and leaf temperature (
Tleaf) of cowpea over the reproductive phase under different water deficiency values. All variables’ responses were fit to an exponential model (except leaf temperature) that could explain the effects of water deficiency on cowpea ecophysiology variables with high precision, especially
Eleaf,
A and
gs (R
2 > 0.9).
Ψ
w measurement results indicate that the highest values were found in T1 for both years, with averages close to −0.6 MPa (
Figure 4A). The T4 treatment, which suffered the greatest influence from water deficiency among the treatments with interruption of irrigation, showed more negative values, reaching averages equal to −1.21 MPa in 2015 and −1.22 MPa in 2016 at the end of the experiment. The other treatments followed a natural trend for water availability in the soil, with averages of −1.01 and −1.03 MPa for T2 and −1.16 and −1.18 MPa for T3, in 2015 and 2016, respectively.
As expected, the Ψ
w was directly related to the soil moisture, decreasing according to increasing soil water deficiency (
Figure 4A). The results are similar to those obtained by Dias and Bruggemann [
15] that found leaf water potential to vary between −0.82 and −1.18 MPa, with a water deficit imposed in the reproductive phase, but differ from those obtained by Micheletto et al. [
16], who observed Ψ
w values of −2.30 and −2.57 MPa, respectively, for common bean submitted to a water deficit. It is important to mention that the leaf water potential can vary according to the crop phenological stage, cultivar, water availability in the soil, vapor pressure deficit, and the time and place of recording [
7].
For
gs, as expected, lower average values were found in T4, showing 78.95 mmol H
2O m
−2 s
−1 in 2015 and 82.79 mmol H
2O m
−2 s
−1 in 2016, at the end of the cowpea crop cycle (
Figure 4B). The T2 treatment presented 380.57 and 394.24 mmol H
2O m
−2 s
−1, and T3 presented 153.74 and 168.31 mmol H
2O m
−2 s
−1, in 2015 and 2016, respectively, at the last measurement date. These results indicate a direct relationship between
gs and available water content—that is, the lower the water content in the plant, the lower the stomatal opening.
The T1 treatment, which was maintained close to the field capacity during the entire experimental period, showed a higher degree of stomatal opening than the other treatments, reaching average values of up to 716.17 mmol H2O m−2 s−1 in 2015 and 712.20 mmol H2O m−2 s−1 in 2016. Regarding the final average values of gs, there were reductions of 31% for T2, 72% for T3, and 86% for T4 in 2015, and 28% for T2, 69% for T3 and 85% for T4 in 2016.
In both years, there was a decline in the
A of cowpea plants according to the advance of water deficiency (
Figure 4C). T1 showed the highest rates during the experimental period, reaching averages of 31.91 and 32.75 μmol CO
2 m
−2 s
−1 in the last observation, while T4 reached only 7.57 and 8.49 μmol CO
2 m
−2 s
−1 at the end of the cycle in 2015 and 2016, respectively.
The
A showed significant reductions throughout the experiment, following a exponential pattern (
Figure 4C). Reductions of 24%, 53% and 76% for the T2, T3 and T4 treatments were observed at the end of the reproductive phase in 2015. In 2016, reductions of approximately 32%, 57% and 74% were found for T2, T3 and T4, compared to the T1 treatment, respectively.
In the two years of experimental conduction, for all evaluations, the values of
Ci responded exponentially to the soil water supply, with higher values of
Ci according to the greater water availability (
Figure 4D). Thus, T4 always presented the lowest values, closely followed by T3, in relation to other treatments, showing 207.52 and 206.92 μmol CO
2 m
−2 s
−1 for T4, and 209.72 and 211.6 μmol CO
2 m
−2 s
−1 for T3, in 2015 and 2016, respectively, at the end of the reproductive phase. T1 and T2 also showed similar trends in 2015 and 2016, but with higher values, corresponding to 267.08 and 256.95 μmol CO
2 m
−2 s
−1, and 249.32 and 245.98 μmol CO
2 m
−2 s
−1, respectively.
The T1 treatment showed the highest average Eleaf, varying from 8.74 to 9.78 mmol H2O m−2 s−1 in 2015 and from 8.68 to 9.53 mmol H2O m−2 s−1 in 2016. The other treatments behaved as expected, with 7.36 and 7.17 mmol H2O m−2 s−1 for T2, 4.63 and 4.78 mmol H2O m−2 s−1 for T3, and 2.78 and 2.96 mmol H2O m−2 s−1 for T4, in 2015 and 2016, respectively. With decreased water supply to the plant, Eleaf responded negatively, with reductions of 18%, 48% and 69% for T2, T3 and T4 in 2015, respectively, and 19% for T2, 46% for T3, and 67% for T4 in 2016, when compared to T1, in the last measurement.
With the stomatal closure to avoid water loss through transpiration, there was an increase in
Tleaf (
Figure 4B), which reduced the photosynthetic capacity due to the decrease in CO
2 inflow by reducing
gs. In the present study, the increase in
Tleaf between treatments reached a difference of up to 4 °C, with the highest
Tleaf found for T4, equal to 37.77 °C in 2015 and 37.38 °C in 2016, while there was little variation (≈2 °C) in T1 throughout the experimental period for the two years studied. The other treatments followed a natural trend for soil water availability, with final average values of 34.23 and 34.02 ºC for T2 and 36.54 and 36.06 °C for T3, in 2015 and 2016, respectively.
When the Ψ
w reached −0.88 MPa (related to treatment T3), the analyzed variables significantly decreased (
Figure 3), except leaf temperature, which increased (
Figure 5A–D), corresponding to 60% for
gs, 34% for
A, and 39% for
Eleaf, in addition to an increase of 3 °C in
Tleaf. In both experimental years, the response of echopysiological variables was similar, with a reduction (increase) in such variables
A,
gs,
Eleaf (
Tleaf) according to the increase in water deficiency. Similar water deficiency effects were found by Rivas et al. [
17], studying the tolerance of cowpea to water deficit, where by reducing the irrigation depth, there were reductions of 75% in Ψ
w, 83% in
gs and an increase of 3.57% in
Tleaf, also corroborating the results obtained by Medrano et al. [
18], Dias and Bruggemann [
15], Singh and Reddy [
19] and Hayatu and Mukhtar [
5]. Such results suggest this Ψ
w value as the threshold for water stress of cowpea in response to the water deficiency imposed.
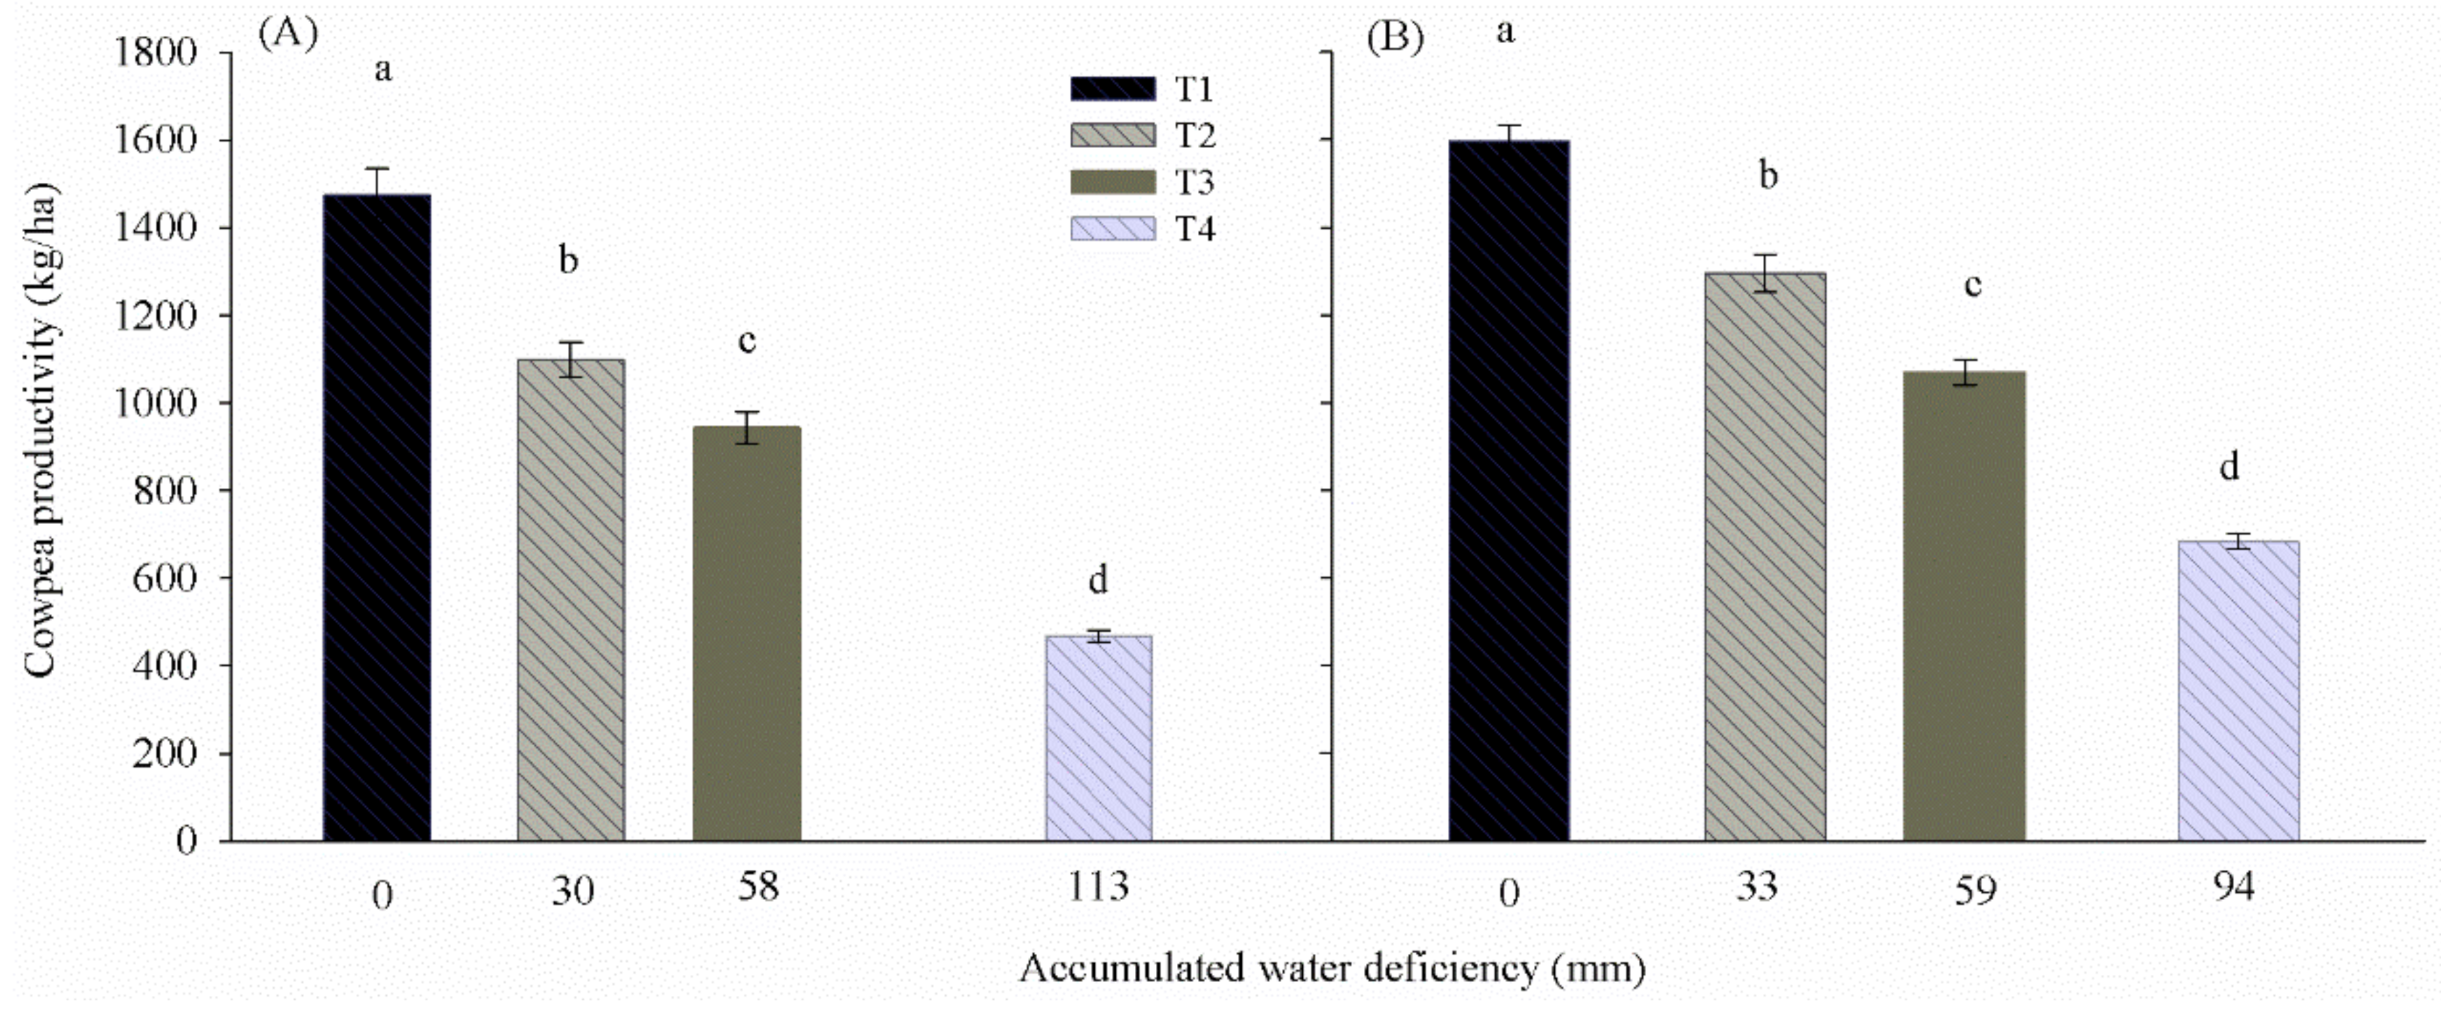
In both years, the cowpea grain productivity proved that the differentiated soil water availability directly influenced production, as the greater the deficiencies caused by the treatments, the lower the final values of grain weight (
Figure 6). The average values of productivity were 1474 (T1), 1098 (T2), 943 (T3), and 638 kg ha
−1 (T4) in 2015, and 1597 (T1), 1295 (T2), 1069 (T3), and 684 kg ha
−1 (T4) in 2016. Ainsworth and Rogers [
20] report that plants submitted to water deficiency show less stomatal opening and a reduction in the interval that stomata remain open. In 2015, the decrease in productivity of the treatments was 25% for T2, 36% for T3 and 57% for T4. In 2016, these were 19%, 33% and 57%, for T2, T3 and T4, respectively.
4. Discussion
The total water blade applied in T1 (100% of ETc replacement) was sufficient to supply the water demand of cowpea during both years (317.75 and 354.82 mm in 2015 and 2016, respectively), since according to Farias et al. [
1] the total crop water consumption is approximately 267.73 ± 10.21 mm for the cultivar under the local conditions. Studying the response of different genotypes of cowpea for drought tolerance, Bastos et al. [
21] found reduced plant production with 50% of available water, causing considerable changes in production components according to water availability.
In a study on cowpea plants submitted to water deficiency, reductions in Ψ
w,
gs, and
Eleaf were also observed, with increased diffusive resistance to water vapor by stomatal closure, reducing transpiration and CO
2 supply for photosynthesis [
22]. Taiz and Zeiger [
23] report that inhibitions of growth and photosynthesis occur in plants suffering from water deficiency during drought periods, indicating that the sensitivity of certain physiological processes to water deficiency is a consequence of the plant strategy to deal with the water availability variation.
The reduction observed in
gs is explained by Ainsworth and Rogers [
20], who report that plants keep their stomata closed to avoid water losses under conditions of water stress, with a certain turgor (higher water potential) maintained in some species, which is an important characteristic of drought tolerance as observed in studies with C
3 plants and on cowpea by Medrano et al. [
18] and Singh and Reddy [
19].
According to Taiz and Zeiger [
23],
gs is recognized as the variable that suffers the greatest influence, as it is controlled by the stomatal opening and closure, mainly according to environmental conditions, such as vapor pressure deficit, relative air moisture, and global solar irradiation. It is possible to observe that several factors can influence the stomata, but the effect of stress caused by water deficit on this parameter is evident, which can be used as an indicator of water deficiency [
18].
The exponential decrease in the
A occurred possibly as a result of the decline in
gs, as the stomatal opening is the main responsible for the entry and exit of gases in the plant and affects the process of photosynthetic gain by controlling the CO
2 inflow [
20]. The reduction in photosynthetic activity by reducing the CO
2 assimilation is an indicator of the water deficiency effect [
24].
According to Ainsworth and Rogers [
20], the greater the lack of water in the plant, the lower the stomatal opening degree and, consequently, the greater the resistance to the entry of atmospheric CO
2; therefore, the intrafoliar concentrations of CO
2 tend to decrease substantially. Souza et al. [
22], evaluating the water relations and gas exchange of cowpea submitted to different irrigation managements, found that the reduction in irrigation leads to linear reductions in the plant photosynthetic rate.
The response pattern of the
Ci as a function of accumulated soil water deficiency demonstrates that the
Ci reduction occurs with decreased availability of water to the plant. According to Matthews et al. [
24], the increase in
Ci values is usually followed by increases in
gs. Under such conditions, there is an increase in the activity of ribulose-1.5-bisphosphate carboxylase-oxygenase (rubisco), increasing CO
2 consumption [
25]. The increase in the
Ci under low water availability, as seen in
Figure 4D, may be related to a decrease in the enzymatic activity involved in the CO
2 fixation process. Zhao et al. [
26] suggest that an increase in the
Ci associated with a decrease in
gs, in conditions of water deficiency, may indicate a decrease in carboxylation efficiency. Therefore, when there is an increase in the
Ci, with a decrease in
gs, the decrease in
A indicates that this limitation is not only due to the increase in stomatal resistance, but also to the effect of water stress on photosynthesis.
As observed in previous variables in the present study, with increased soil water deficiency, the transpiration levels decreased, a mechanism used by the plant to prevent dehydration through transpiration [
23]. The
Eleaf control by stomata is a mechanism used by many species to restrict water loss and overcome drought periods [
7]. According to Medrano et al. [
18], the maintenance of
Tleaf equal or slightly lower than the environment indicates the cooling capacity of plants, through the maintenance of the
gs, aiming at keeping the plant protected from very high thermal ranges. According to Lin et al. [
27],
Eleaf has important effects in tropical plants, such as cooling the leaf, since in order to evaporate the water from the leaf, the water removes its thermal energy, reducing the
Tleaf from 2 to 3 °C compared to the air temperature. Singh and Reddy [
19] found significant reductions in
Tleaf in cowpea plants submitted to water deficiency during the vegetative and reproductive phases.
The increase in
Tleaf showed a direct relationship with the water availability in the soil, with higher
Tleaf values according to the greater water deficiency. The increase in
Tleaf as a function of water stress can be explained by the reduction in loss of latent heat through transpiration, which usually reduces under these conditions [
27]. Data from previous studies show that
Tleaf is usually higher than the air temperature under dry conditions, resulting in an increase in the leaf/environmental temperature ratio [
19].
The lower productivity was due to the reduced soil water supply. Bastos et al. [
21] observed a reduction of 60% in the productivity levels (grain yields) studying cowpea genotypes under water deficiency. Similar results were found by Hayatu and Mukhtar [
5] and Nunes et al. [
10] that found reductions of 21.38%, 36.12% and 49.50% in treatments under water restriction. Souza et al. [
4] found significant reductions in the productivity of this cultivar when it was submitted to rainfed conditions, corresponding to a reduction of 41% under water deficiency of 26 mm, and 72% under a deficiency equal to 76 mm.
According to Hetherington and Woodward [
28], since
gs has the function of regulating gas exchange, it also has great affinity for the photosynthetic process, participating directly in plant growth and development. In this sense, the plant suffers a reduction in gs and
Eleaf and, as a consequence, there is an increase in
Tleaf and a reduction in final productivity [
23]. Under such conditions, the reduction in leaf area of plants as well limits productivity due to the decreased light interception and CO
2 absorption [
29].


 ,
, 


