
Higher Temperatures Decrease Fruit Size in Strawberry Growing in the Subtropics

Department of Agriculture and Fisheries, P.O. Box 5053, SCMC, Nambour, QLD 4560, Australia
Horticulturae 2021, 7(2), 34; https://doi.org/10.3390/horticulturae7020034
Submission received: 8 December 2020
/
Revised: 2 February 2021
/
Accepted: 12 February 2021
/
Published: 23 February 2021
(This article belongs to the Section Fruit Production Systems)
Abstract
:Five strawberry (Fragaria × ananassa Duch.) cultivars were grown in Queensland, Australia to determine whether higher temperatures affect production. Transplants were planted on 29 April and data collected on growth, marketable yield, fruit weight and the incidence of small fruit less than 12 g until 28 October. Additional data were collected on fruit soluble solids content (SSC) and titratable acidity (TA) from 16 September to 28 October. Minimum temperatures were 2 °C to 4 °C higher than the long-term averages from 1965 to 1990. Changes in marketable yield followed a dose-logistic pattern (p < 0.001, R2s = 0.99). There was a strong negative relationship between fruit weight (marketable) and the average daily mean temperature in the four or seven weeks before harvest from 29 July to 28 October (p < 0.001, R2s = 0.90). There were no significant relationships between SSC and TA, and temperatures in the eight days before harvest from 16 September to 28 October (p > 0.05). The plants continued to produce a marketable crop towards the end of the season, but the fruit were small and more expensive to harvest. Higher temperatures in the future are likely to affect the economics of strawberry production in subtropical locations.
1. Introduction
Global climate change is expected to increase both the temperature and the concentration of CO2 (carbon dioxide) in the atmosphere. These changes will increase CO2 assimilation in the leaves of many crops; however, this increase will be off-set by excessive leaf production and decreases in flower and fruit development [1,2,3]. Overall, higher temperatures will have a greater effect on productivity than higher concentrations of CO2. The impact of temperature on plant development can be due to higher average temperatures or short-term increases in temperatures above the optimum range [4,5].
Some crop models predict higher yields in the short-term with climate change and lower yields in the long-term, while other models predict lower yields across both periods or even under current conditions [6,7,8,9,10,11,12,13,14]. There can be difficulties in predicting yields under climate change because the changes in CO2 and temperature, etc. vary across different regions. There are also uncertainties in how individual crops respond to growing conditions. Keeping global warming to within 1.5 °C is less problematic than global warming to within 2.0 °C [15].
Qian et al. [16] predicted that the yields of canola (Brassica napus L.) would decrease by 24 to 42% across three regions in Canada from 2041 to 2070. Kinose et al. [17] predicted that the yields of rice (Oryza sativa L.) in Indonesia would decrease under 14 climate scenarios, mainly because of higher temperatures. The mean reduction in yield was 12.1% for all of the country from 2039 to 2042 compared with current production. Cammarano et al. [18] predicted that the yields of barley (Hordeum vulgare L.) would decrease by 27% in a dry location in the Mediterranean basin by 2050 and increase by 4 or 8% in two wetter locations.
Varma and Bebber [19] modelled the productivity of banana (Musa spp.) across 27 countries under climate change. They reported that annual yields had increased by an average of 1.37 t/ha since 1961, but this was expected to fall to 0.59 t/ha by 2050. A review of agriculture production in California indicated that climate change will reduce the yields of many fruit and vegetables [20]. Production in some areas will be more susceptible to changes in the climate than in other areas.
There is some information on the impact of climate change on strawberry (Fragaria × ananassa Duch. and related species). Several reviews suggest that increases in the concentration of CO2 and temperature will alter the production season and the pattern of plant development in different growing areas [21,22,23,24,25,26,27]. Two analyses in California suggested that yields would decline by 10% by 2050 and by 43% by 2070 to 2099 [28,29]. High temperatures and low rainfall in November were associated with low yields in this area from 1980 to 2003 [30]. Grez et al. [31] indicated that global warming will decrease the productivity of F. chiloensis in its native habit in Chile. The natural distribution of tetraploid species of Fragaria will shrink under climate change in Yunnan Province, China [32]. In contrast, the habitat for diploid species will expand.
Gamboa-Mendoza et al. [33] showed that plants of F. mexicana grown at 5.1 °C above ambient in Mexico had 41% fewer flowers than plants at ambient temperatures (mean daily temperature of 19.6 °C) and 38% fewer fruit. In some studies, elevated temperatures overrode the benefits of elevated concentrations of CO2 on growth and productivity. For instance, Sun et al. [34] demonstrated that yields at elevated CO2 (720 ppm versus 360 ppm) and temperatures (25 °C/20 °C) were 12% lower than those at elevated CO2 and standard temperatures (20 °C/15 °C).
Higher temperatures under climate change will reduce the accumulation of sugars in the fruit and reduce fruit size. MacKenzie et al. [35] indicated that there was a strong negative relationship between soluble solids content (SSC) and mean temperature in the eight days before harvest in Florida (R2 = 0.73). Menzel [36] demonstrated that average fruit fresh weight decreased by more than 50% as the temperature increased from 16 °C to 20 °C in Queensland.
Fernandes Filho et al. [37] used variations in seasonal temperatures to characterize the response of potato (Solanum tuberosum L.) to higher temperatures in Brazil. The plants were grown across three seasons from January to May 2017, May to September 2017, and November 2017 to February 2018, representing moderate heat stress, no heat stress, and severe heat stress. Mean tuber yield was reduced by 2.4% under moderate stress compared with no stress and by 70.2% under severe stress.
This paper reports on the effect of temperature on the performance of five strawberry cultivars growing in the field in subtropical Queensland, Australia. Information was collected on plant growth, marketable yield, fruit size, fruit soluble solids content (SSC) and fruit titratable acidity (TA). Changes in the growth of the plants over the season were used to evaluate the sensitivity of the plants to higher temperatures.
2. Materials and Methods
2.1. Experimental Design and Growing Conditions
Containerized transplants of ‘Festival’, ‘Brilliance’, ‘Red Rhapsody’ ‘Scarlet Rose’ and ‘Sundrench’ were planted on 29 April 2020 at Nambour in south-east Queensland, Australia (latitude 26.6° S, longitude 152.9° E, and elevation 29 m). The first two cultivars were developed in Florida [38,39], while the other three cultivars were developed in Queensland [40]. The transplants were grown in 72 cell-trays with 41 cm3 cells at Armidale in northern New South Wales (latitude 30.3° S, longitude 151.4° E, and elevation 980 m) and were supplied with three to four leaves/plant. Average (±SE or standard error) dry weight of the transplants was 1.1 ± 0.1 g/plant. Nambour has a warm subtropical climate, with relatively wet summers, autumns, and winters, and relatively dry springs. The soil at the experimental site was a sandy, clay loam, with moderate fertility and water-holding capacity. The cultivars were planted out in a randomized block design, with six replications.
The new plants were planted through plastic, in double-row beds 70 cm wide and 130 cm apart from the centres. The plants were grown at an inter-row spacing of 30 cm and at an intra-row spacing of 30 cm. This layout provided 77 rows with 666 plants/row for each ha, giving a density of 51,282 plants/ha. The plants were irrigated through drip-tape placed under the plastic when the soil water potential in the root-zone decreased below −10 kPa [41,42]. Nitrogen and other nutrients were applied by fertigation [42]. The plants received a total of 117 kg/ha of N, 24 kg/ha of P, 165 kg/ha of K, 7 kg/ha of Ca, 13 kg/ha of Mg, 1.8 kg/ha of B, 0.14 kg/ha of Cu, 0.28 kg/ha of Fe, 0.14 kg/ha of Mn, and 0.05 kg/ha of Zn. The main disease affecting the crop was grey mould incited by Botrytis cinerea. The plants received weekly applications of multi-site fungicides such as captan and thiram, and applications of site-specific fungicides such as iprodione, fenhexamid, cyprodinil + fludioxonil, and penthiopyrad during wet weather [43].
2.2. Data Collection
Data were collected on the number of leaves/plant, leaf area/plant and plant dry weight (leaves, crowns, and roots) on 26 August and 28 October. Fruit were harvested every week for an assessment of marketable yield (fresh weight) and average fruit fresh weight from 8 July to 28 October. Mature fruit were classified as those that were at least three-quartered coloured. Average seasonal fruit fresh weight was the long-term average value of fruit fresh weight in a cultivar pooled across all harvests (marketable fruit). A record was kept of the number of fruit that were small (less than 12 g fresh weight). Fruit that were affected by rain and/or grey mould or misshapen, or that had other defects (mainly other disease, surface bronzing, or bird damage) were considered non-marketable. Fruit that were small and misshapen were rated as misshapen.
The concentrations of non-structural carbohydrates (starch, sucrose, fructose, glucose and maltose) in the leaves, and in the crowns and roots were determined in the plants harvested on 26 August and 28 October [44]. The analysis for starch was conducted using a Megazyme total starch assay kit using the alpha amylase/amyloglucosidase method (www.megazyme.com, accessed on 15 March 2019). The analysis for soluble sugar profile was conducted using HPLC (high performance liquid chromatography). The sugars were extracted and analysed by HPLC using the relevant reference standards. The data on non-structural carbohydrates are presented on a dry weight basis (DW).
Data were collected on fruit total soluble solids content (SSC) and titratable acidity (TA) as citric acid measured at 20 °C weekly from 16 September to 28 October [45]. These authors indicated that SSC was strongly correlated with the concentrations of sugars (fructose, glucose and sucrose) in strawberry. The sugars accounted for about 90% of the soluble solids in the fruit. Three to six fruit from each plot were placed in small snap lock resealable bags (18 cm × 17 cm, Glad, Sydney, Australia), and frozen at −18 °C until used for chemical analysis. The data on fruit chemistry are presented on a fresh weight basis (FW).
Daily maximum and minimum temperatures, rainfall, and solar radiation data were collected at the site from May to October from the Bureau of Meteorology (www.bom.gov.au, accessed on 15 March 2019). The temperature data were compared with the long-term data for Nambour from 1965 to 1990.
2.3. Data Analysis
There were two sections in each experimental block, one for recording plant growth and concentrations of non-structural carbohydrates, and an adjacent one for recording yield, fruit size, SSC, and TA. There were 22 plants/plot for the yield, fruit size, SSC, and TA data and 2 plants/plot for the growth data.
Data on plant growth, concentrations of non-structural carbohydrates, marketable yield, and mean average seasonal fruit fresh weight, percentage of small fruit, SSC, and TA were analysed by one-way analysis of variance (ANOVA, five cultivars × six blocks) using GenStat (Version 18; VSN International, Hemel Hempstead, UK). The data on plant growth and non-structural carbohydrates for each harvest were analysed separately. Treatment means were separated by calculating least significant differences (LSDs) from the ANOVAs.
The seasonal changes in marketable yield were determined by regression analysis and fitted using the Marquardt-Levenberg algorithm from the graphics’ software program SigmaPlot (Version 15; Systat, Chicago, IL, USA). This algorithm was developed several decades ago and is widely used in regression analysis and modelling [46,47,48]. The relationships between average fruit fresh weight and the average daily mean temperature in the five to seven weeks before harvest, four weeks before harvest and seven weeks before harvest were analysed by regression. These periods covered flower development, fruit development, and flower and fruit development [49,50,51]. The relationships between SSC and TA, and the average daily mean temperature in the eight days before harvest were also analysed by regression [35].
3. Results
3.1. Weather
Average daily maximum temperatures ranged from 21.3 °C to 26.6 °C and average daily minimum temperatures ranged from 10.1 °C to 15.7 °C (Table 1). The average daily mean temperature in the eight days before fruit harvest increased from 15 °C to 21 °C from 8 July to 28 October (Linear model, p < 0.001, R2 = 0.78, n = 14). Maximum temperatures were close to the long-term averages from 1965 to 1990, while minimum temperatures were 2 °C to 4 °C higher. Mean monthly daily solar radiation ranged from 12.4 to 20.6 MJ/m2 and total monthly rainfall ranged from 17 to 113 mm (Table 1). Values of solar radiation were close to long-term averages, whereas it was wetter in July and October than the long-term average, and drier in May, June, and August.
3.2. Plant Growth
On both harvests, there were only small differences in the number of leaves/plant, crown dry weight/plant and root dry weight/plant across the five cultivars (Table 2). In contrast, leaf area/plant was higher in ‘Festival’ and leaf dry weight/plant was higher in ‘Festival’ and ‘Red Rhapsody’ than in the other cultivars. Plant growth was higher in October than in August, especially the growth of the leaves (Table 2).
The main non-structural carbohydrates measured in the leaves were glucose (mean concentration of 3.6 ± 0.1% DW or dry weight), fructose (2.6 ± 0.1%), and starch (1.0 ± 0.02%), with lower concentrations of sucrose and maltose (<0.1%). The mean concentration of all the sugars measured was 6.2 ± 0.2%, and the mean concentration of the non-structural carbohydrates measured was 7.2 ± 0.2%. The main carbohydrates measured in the crowns and roots were glucose (1.4 ± 0.05%), fructose (1.6 ± 0.07%), and starch (1.2 ± 0.02%). The mean concentration of all the sugars was 3.2 ± 0.1%, and the mean concentration of the non-structural carbohydrates was 4.4 ± 0.1%. The soluble sugars accounted for more than 70% of the carbohydrates analysed in the leaves, crowns, and roots.
There were only small differences in the concentrations of non-structural carbohydrates across the five cultivars (Table 3). The total concentration of non-structural carbohydrates in the leaves in October was lower in ‘Brilliance’ and ‘Red Rhapsody’ and higher in ‘Festival’ and ‘Sundrench’. The mean concentrations of non-structural carbohydrates across the cultivars were lower on 28 October than on 26 August (Table 3).
3.3. Yield and Fruit Quality
Total marketable yield was lower in ‘Brilliance’ than in the other cultivars (Table 4). Mean seasonal average fruit fresh weight was lower in ‘Festival’ and ‘Brilliance’ and higher in ‘Red Rhapsody’, ‘Scarlet Rose’, and ‘Sundrench’. The reverse was true for the mean incidence of small fruit (higher in ‘Festival’ and ‘Brilliance’) (Table 4). Mean soluble solids content (SSC) was lower in ‘Sundrench’, intermediate in ‘Brilliance’ and ‘Red Rhapsody’ and higher in ‘Festival’ and ‘Scarlet Rose’ (Table 4). Mean titratable acidity (TA) was lower in ‘Brilliance’ and ‘Sundrench’, intermediate in ‘Festival’ and ‘Red Rhapsody’, and higher in ‘Scarlet Rose’. Average seasonal SSC increased from 7.0 to 9.0% as average seasonal TA increased from 0.55 to 0.85% (linear model, p < 0.001, R2 = 0.60, n = five cultivars × six blocks or 30 samples).
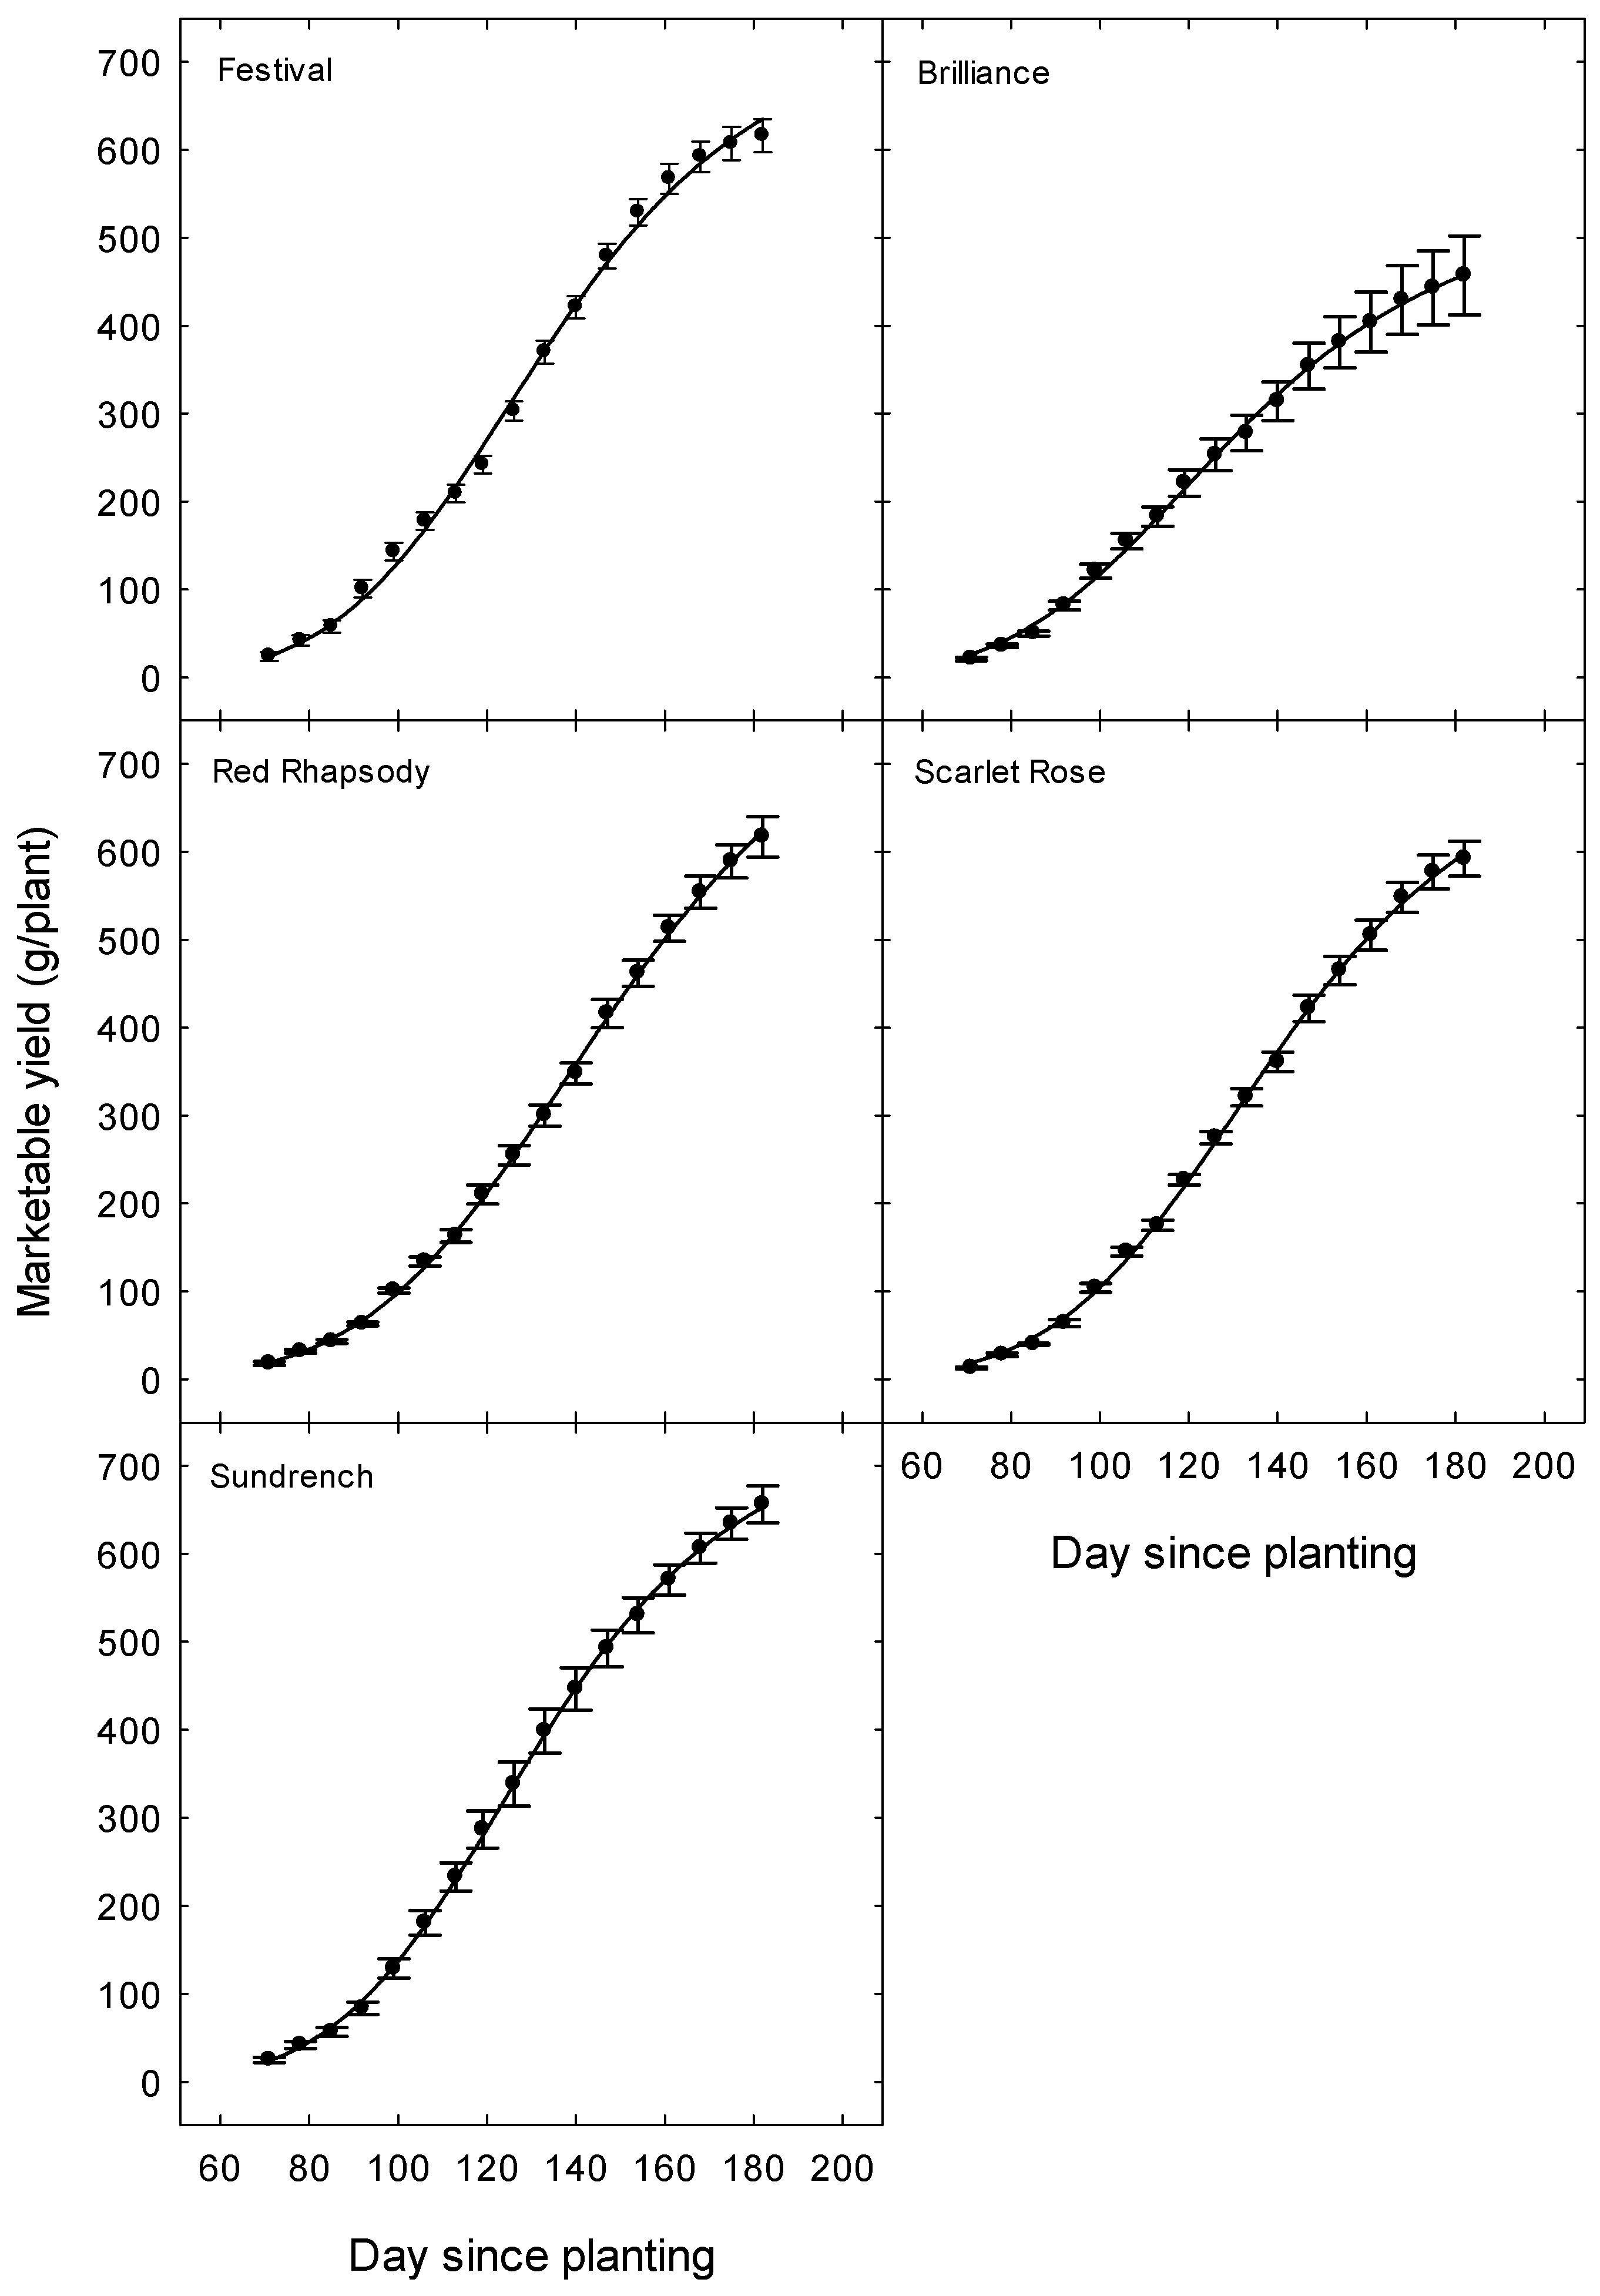
Changes in accumulated marketable yield over the season followed a sigmoid (dose-logistic) pattern (p < 0.001, R2s = 0.99, Figure 1, Table 5) and were generally similar across the five cultivars. Sm is the maximum yield, k is a rate constant (yield/day), and m describes the time to reach the maximum increase in yield. All the cultivars were producing a marketable crop at the last harvest on 28 October, although at a lower rate than earlier in the month. The maximum yield in the regressions reflected the absolute yields of the cultivars (‘Brilliance’ lower and the other cultivars higher).
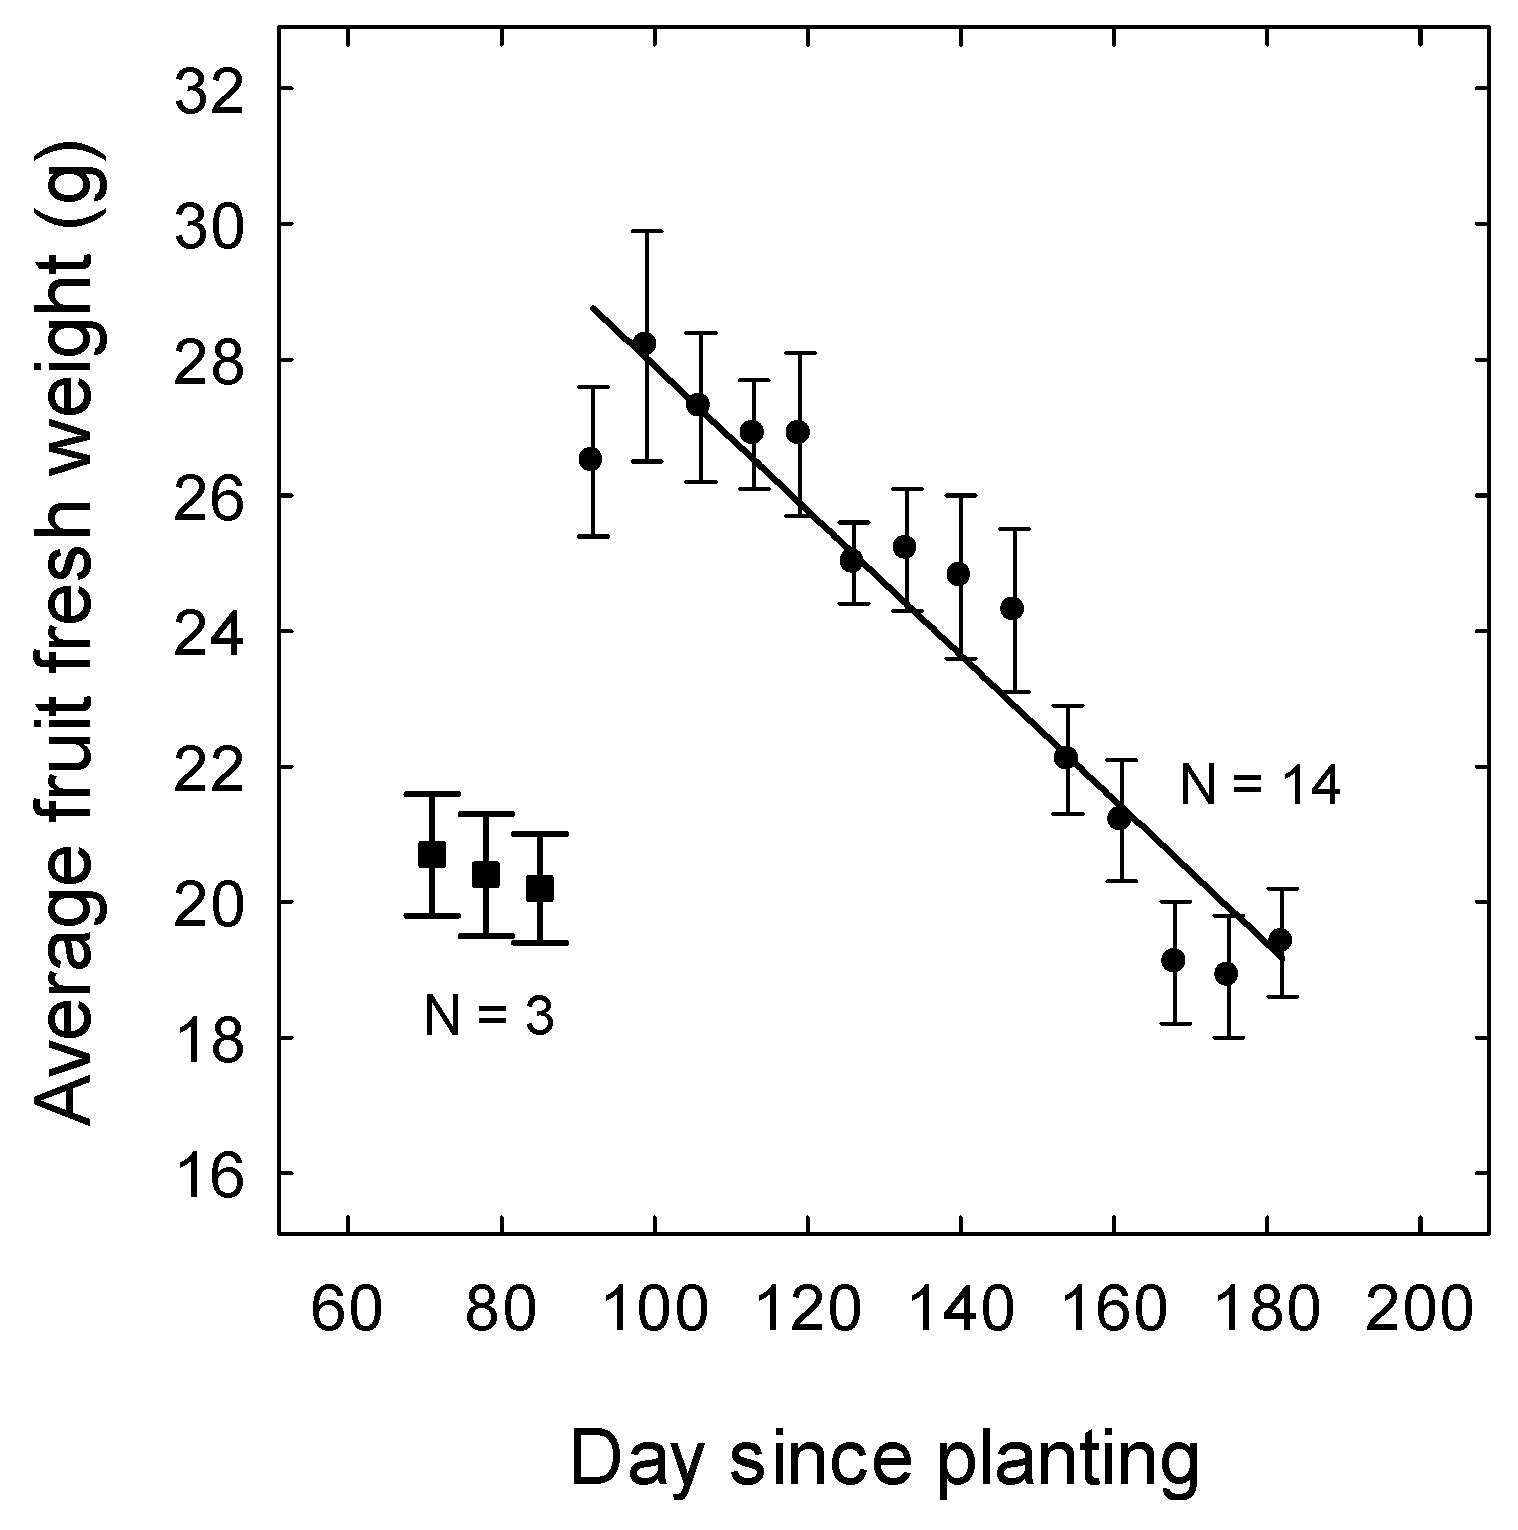
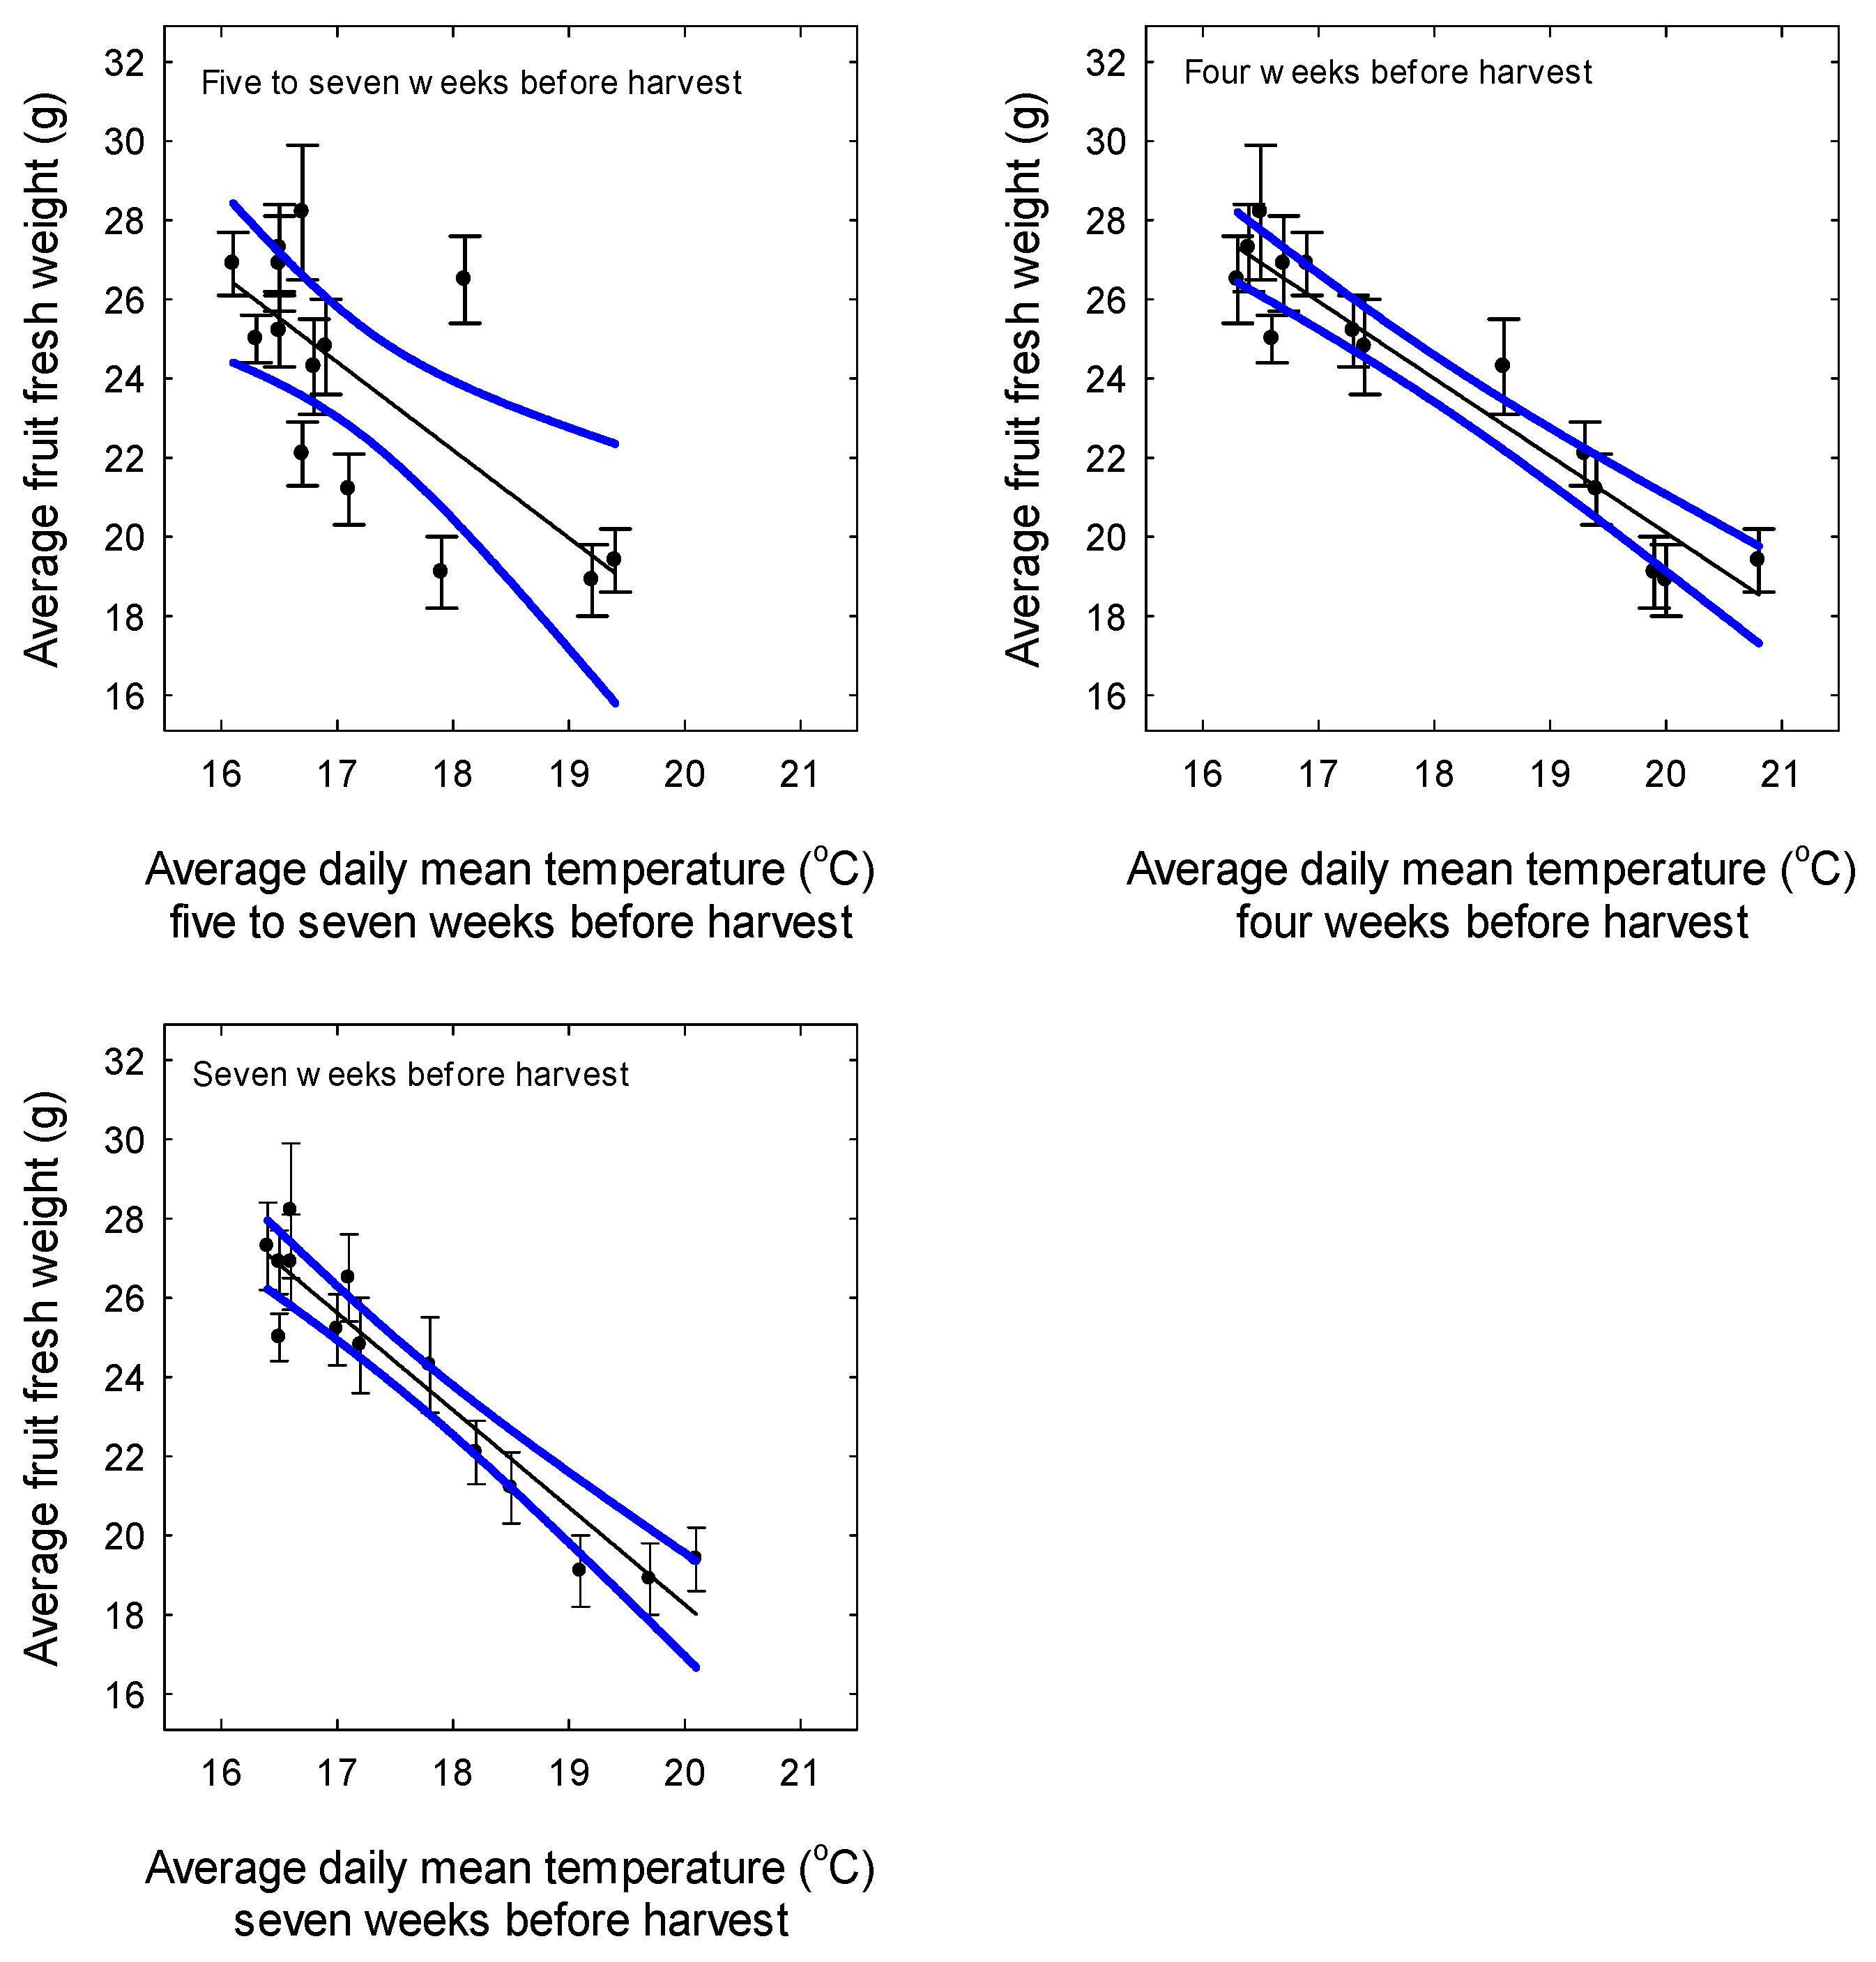
Average fruit fresh weight varied over the growing season (Figure 2). There was a strong negative relationship between fruit size and the day of sampling for the last fourteen harvest. Fruit were relatively small during the first three harvests when the plants were small and these data were not included in the regression. There were moderate to strong negative relationships between average fruit weight (marketable) and the average daily mean temperature before harvest from 29 July to 28 October (Figure 3). Fruit size was more closely related to temperatures during fruit development (four weeks before harvest) or during flower and fruit development (seven weeks before harvest) than during flower development alone (five to seven weeks before harvest).
There were no significant relationships between SSC and TA, and average mean temperature from 16 September to 28 October (p > 0.05, n = 7). The average daily mean temperature eight days before harvest over this period ranged from 18.2 °C to 22.2 °C. Average SSC was lower on 28 October (6.7 ± 0.3%) than from 16 September to 21 October (7.4 ± 0.3% to 8.5 ± 0.4%).
4. Discussion
There were large changes in plant growth, marketable yield, and fruit size in the strawberry as the temperatures increased in Queensland. Higher temperatures generally had a negative effect on the performance of the plants. The plants continued to produce a marketable crop towards the end of the season. However, the fruit were small and more expensive to harvest. These results suggest that the economics of production in this area may already be affected by rises in temperature.
Plant growth was higher in October than in August, especially leaf production, leaf area expansion, and leaf dry weight. These results suggest that temperatures towards the end of the experiment were still optimal for leaf growth. There is little information on the effect of temperature on the growth of strawberry in the subtropics. Some authors provide data on the growth of plants under controlled-temperature conditions.
Wang and Camp [52] grew ‘Earliglow’ and ‘Kent’ in growth chambers set at different temperatures. Leaf dry weight/plant was higher at 25 °C/15 °C or 25 °C/22 °C and lower at 18 °C/12 °C or 30 °C/22 °C. Crown dry weight/plant was higher at 18 °C/12 °C, 25 °C/15 °C, or 25 °C/22 °C. Root dry weight was higher at 18 °C/12 °C. Kadir et al. [53] showed that leaf growth in ‘Chandler’ and ‘Sweet Charlie’ was higher at 30 °C/25 °C and lower at 20 °C/15 °C or 40 °C/35 °C. Root growth was best at the lowest temperature regime. Menzel [54] investigated the effect of temperature on the growth of ‘Festival’ in controlled-temperature glasshouses. Leaf dry weight/plant was a maximum at 25 °C and lower at 15 °C, 20 °C, or 30 °C. In contrast, crown and root dry weight/plant were a maximum at 20 °C.
There were variations in the concentrations of non-structural carbohydrates across the three plant parts and across the two harvests. The concentrations of non-structural carbohydrates were lower in the crowns and roots than in the leaves, and lower on 28 October than on 26 August. The concentration of non-structural carbohydrates in the plants reflects the balance between photosynthesis, respiration, and growth. If photosynthesis exceeds respiration and growth, then carbohydrates accumulate in the plant. If photosynthesis is lower than respiration and growth, then carbohydrates dissipate in the plant. In many crops, including strawberries, the concentration of non-structural carbohydrates is higher at low temperatures than at high temperatures, provided CO2 assimilation continues [55]. The lower concentrations of non-structural carbohydrates in the plants in October reflect higher temperatures and stronger growth at the end of the season.
The plants continued to produce a marketable crop towards the end of the season, although at a lower rate. Overall, the five cultivars had similar patterns of cropping, but with differences in total marketable yield. Average marketable yield across the cultivars was 588 g/plant. There are few studies reporting on the productivity of strawberry cultivars in the subtropics. Average marketable yields across four cultivars in a previous study in Queensland ranged from 657 to 1064 g/plant in the first season and from 416 to 605 g/plant in the second season [41]. Marketable yields across three cultivars and three seasons in Florida ranged from 412 to 1014 g/plant, with a mean (±SE) of 797 ± 66 g/plant [38]. Yields peaked in February and declined in March in Florida.
Kruger et al. [56] indicated that yields across several sites in Europe were more affected by season and growing conditions than latitude. Average daily mean temperature decreased by 2 °C from north to south. In contrast, there were strong negative relationships between SSC and average maximum and minimum temperatures in the week before harvest (p < 0.001, r = −0.70 to −0.82)
In the current experiment, average fruit weight (marketable) decreased from late July to late October. There was a strong negative relationship between average fruit weight and the average daily mean temperature during fruit development (four weeks before harvest) or during flower and fruit development (seven weeks before harvest). Menzel [36] indicated that average fruit fresh weight decreased as the average mean daily temperature increased from 16 °C to 20 °C in Queensland.
Le Mière et al. [57] studied the effect of temperature on strawberry in glasshouses in the United Kingdom. The plants were grown at constant temperatures ranging from 12 °C to 28 °C. Yield decreased from 200 g/plant to 50 g/plant as the temperature increased, while average fruit fresh weight decreased from 14 g to 5 g. The number of fruit per plant decreased from 15/plant to 8/plant. Lower yields at high temperatures were due to fewer and smaller fruit. High temperatures affected dry matter production in individual fruit, independently of the effect of temperature on total fruit production.
Strawberry fruit are produced from inflorescences called cymes, with a hierarchy of fruit decreasing in size with inferior positions of the flowers [36]. A primary flower is initiated at the end of the cyme, with secondary, tertiary, and possibly quaternary and quinary flowers initiated from the axes below the preceding blooms. No information was collected on the development of the cymes in the current experiment. Further research is required to separate the effect of temperature on the development of the cymes and on the development of individual fruit.
Commercial fruit production continued to the end of the season in Queensland. However, average fruit weight decreased. Plants with small fruit cost more to harvest than plants with large fruit. Harvesting accounts for up to 60% of variable costs for growing strawberries in Japan, California, Florida, and Queensland [58,59]. Studies in the United Kingdom demonstrated that ‘Malling Centenary’ has larger fruit than many earlier cultivars and lower harvesting costs [60,61]. Harvesting rates in the new cultivar were 30 to 40 kg/hour under table-top production compared with 25 to 30 kg/hour in the earlier cultivars. A study in Italy showed that for each one gram decrease in average fruit fresh weight, the cost of harvesting was increased by €500/ha [62]. Herrington et al. [63] indicated the cost of harvesting in Australia increased by $AU600/ha for each one gram decrease in fruit weight from 30 g to 17 g.
The soluble solids content (SSC) and titratable acidity (TA) of the fruit varied across the different cultivars. In contrast, there was no significant relationships between SSC and TA, and the temperature from 16 September to 28 October. Fruit SSC was lower in the last harvest on 28 October than in the earlier harvests. Average SSC across the cultivars ranged from 6.8 to 8.9%, while average TA ranged from 0.57 to 0.82%. In an earlier study in Queensland, SSC ranged from 6.8 to 8.1% in the first season and from 7.0 to 8.8% in the second season [41]. In the same study, TA ranged from 0.61 to 0.65% and from 0.61 to 0.71%.
MacKenzie et al. [35] investigated the effect of temperature on fruit growth and carbohydrate accumulation in strawberry in Florida. Individual flowers on plants in the field were transferred to glasshouses set at 15 °C or 22 °C. The weight and SSC of individual fruit were recorded at harvest over two seasons. Temperature did not affect fruit fresh weight, probably because temperatures were only manipulated for a few days after the flowers opened. In contrast, SSC was lower at the higher temperature (5.2%) than at the lower temperature (6.5%). In a related work, the authors found a strong negative relationship between SSC and temperature in the eight days before harvest in the field. Soluble solids content decreased from a 9.5% at 11 °C to 6.0% at 21 °C. The data in the current experiment were too variable to determine the relationship between SSC and temperature.
Higher temperatures affect many aspects of plant development in strawberry. In most cultivars, there is a broad temperature optimum for growth [49] and flowering [64,65,66] and a narrow optimum for average fruit weight [32]. Sønsteby and Heide [66] indicated that floral induction in six cultivars in Norway exhibited a broad optimum from 15 °C to 21 °C and was reduced or suppressed at 9 °C or 27 °C. In a later study, Heide and Sønsteby [67] suggested that inadequate winter chill was the main limiting factor for berry crops under climate change in northern Europe. A 2 °C increase in temperature was expected to lead to smaller leaves and inflorescences in spring. In warmer areas such as Queensland and Florida, fruit size and fruit SSC are likely to be the main limiting factors under global warming.
5. Conclusions
Temperature was correlated with the growth and development of the strawberry plants in Queensland. Average daily maximum/minimum temperatures were 23.2 °C/13.5 °C in May, 22.2 °C/13.0 °C in June, 21.3 °C/11.2 °C in July, 23.3 °C/10.1 °C in August, 24.6 °C/13.7 °C in September, and 26.6 °C/15.7 °C in October. Minimum temperatures were 2 °C to 4 °C higher than the long-term averages from 1965 to 1990. The plants continued to produce a marketable crop towards the end of the season. However, the fruit were small and more expensive to harvest. There was a strong negative relationship between average fruit weight and the average daily mean temperature during fruit development (four weeks before harvest) or during flower and fruit development (seven weeks before harvest). These results suggest that the economics of strawberry production in this area is already affected by rises in temperature. Global warming will reduce the profitability of strawberry in the subtropics in the absence of heat-tolerant cultivars or other mitigating strategies.
Funding
The Queensland Government funded the research through the Department of Agriculture and Fisheries. The research received funds from the Florida Strawberry Growers’ Association (FSGA) to support the project “Strawberry production in Queensland and Florida under a warming climate”.
Acknowledgments
Many thanks to the farm staff at Nambour for help with growing the strawberry plants. Thanks also to Rod Edmonds (DAF), and Sarah Williams and Kenneth Parker (FSGA).
Conflicts of Interest
The author declares no conflict of interest.
References
- Lee, S.G.; Kim, S.K.; Lee, H.J.; Lee, H.S.; Lee, J.H. Impact of moderate and extreme climate change scenarios on growth, morphological features, photosynthesis, and fruit production of hot pepper. Ecol. Evol. 2017, 8, 197–206. [Google Scholar] [CrossRef] [PubMed] [Green Version]
- Pereira, F.F.S.; Sánchez-Román, R.M.; González, A.M.G.O. Simulation model of the growth of sweet orange (Citrus sinensis L. Osbeck) cv. Natal in response to climate change. Clim. Chang. 2017, 143, 101–113. [Google Scholar] [CrossRef] [Green Version]
- Srinivasan, V.; Kumar, P.; Long, S.P. Decreasing, not increasing, leaf area will raise crop yields under global atmospheric change. Glob. Chang. Biol. 2017, 23, 1626–1635. [Google Scholar] [CrossRef] [Green Version]
- Campoy, J.A.; Darbyshire, R.; Dirlewanger, E.; Quero-García, J. Yield potential definition of the chilling requirement reveals likely underestimation of the risk of climate change on winter chill accumulation. Int. J. Biomet. 2019, 63, 183–192. [Google Scholar] [CrossRef]
- Chavan, S.G.; Duursma, R.A.; Tausz, M.; Ghannoum, O. Elevated CO2 alleviates the negative impact of heat stress on wheat physiology but not on grain yield. J. Exp. Bot. 2019, 70, 6447–6459. [Google Scholar] [CrossRef]
- Mistry, M.N.; Wing, I.S.; de Cian, E. Simulated vs. empirical weather responsiveness of crop yields: US evidence and implications for the agricultural impacts of climate change. Environ. Res. Lett. 2017, 12, 075007. [Google Scholar] [CrossRef]
- Zhang, Y.; Zhao, Y.; Wang, C.; Chen, S. Using statistical model to simulate the impact of climate change on maize yield with climate and crop uncertainties. Theor. Appl. Climatol. 2017, 130, 1065–1071. [Google Scholar] [CrossRef]
- Benlloch-González, M.; Sánchez-Lucas, R.; Bejaoui, M.A.; Benlloch, M.; Fernández-Escobar, R. Global warming effects on yield and fruit maturation of olive trees growing under field conditions. Sci. Hortic. 2019, 249, 162–167. [Google Scholar] [CrossRef]
- Petersen, L.K. Impact of climate change on twenty-first century crop yields in the US. Climate 2019, 7, 40. [Google Scholar] [CrossRef] [Green Version]
- Ray, D.K.; West, P.C.; Clark, M.; Gerber, J.S.; Prishchepov, A.V.; Chatterjee, S. Climate change has likely already affected global food production. PLoS ONE 2019, 14, e0217148. [Google Scholar] [CrossRef]
- Vogel, E.; Donat, M.G.; Alexander, L.V.; Meinshausen, M.; Ray, D.K.; Karoly, D.; Meinshausen, N.; Frieler, K. The effects of climate extremes on global agricultural yields. Environ. Res. Lett. 2019, 14, 054010. [Google Scholar] [CrossRef]
- Hammer, G.L.; McLean, G.; van Oosterom, E.; Chapman, S.; Zheng, B.; Wu, A.; Doherty, A.; Jordan, D. Designing crops for adaptation to the drought and high temperature risks anticipated in future climates. Crop Sci. 2020, 60, 605–621. [Google Scholar] [CrossRef]
- Lollato, R.P.; Bavia, G.P.; Perin, V.; Knapp, M.; Santos, E.A.; Patrignani, A.; DeWolf, E.D. Climate-risk assessment for winter wheat using long-term weather data. Agron. J. 2020, 112, 2132–2151. [Google Scholar] [CrossRef]
- Ma, L.; Fang, Q.X.; Sima, M.W.; Burkey, K.O.; Harmel, R.D. Simulated climate change effects on soybean production using two crop modules in RZWQM2. Agron. J. 2021, 113, 112. [Google Scholar] [CrossRef]
- Leng, G. Keeping global warming within 1.5 °C reduces future risks of yield loss in the United States: A probabilistic modeling approach. Sci. Total Environ. 2018, 644, 52–59. [Google Scholar] [CrossRef]
- Qian, B.; Jing, Q.; Bélanger, G.; Shang, J.; Huffman, T.; Liu, J.; Hoogenboom, G. Simulated canola yield responses to climate change and adaptation in Canada. Agron. J. 2018, 110, 133–146. [Google Scholar] [CrossRef] [Green Version]
- Kinose, Y.; Masutomi, Y.; Shiotsu, F.; Hayashi, K.; Ogawada, D.; Gomez-Garcia, M.; Matsumura, A.; Takahashi, K.; Fukushi, K. Impact assessment of climate change on the major rice cultivar Ciherang in Indonesia. J. Agric. Meterol. 2020, 76, 19–28. [Google Scholar] [CrossRef]
- Cammarano, D.; Ceccarelli, S.; Grando, S.; Romagosa, I.; Benbelkacem, A.; Akar, T.; Al-Yassin, A.; Pecchioni, N.; Francia, E. The impact of climate change on barley yield in the Mediterranean basin. Eur. J. Agron. 2019, 106, 1–11. [Google Scholar] [CrossRef]
- Varma, V.; Bebber, D.P. Climate change impacts on banana yields around the world. Nat. Clim. Chang. 2019, 9, 752–757. [Google Scholar] [CrossRef] [Green Version]
- Pathak, T.B.; Maskey, M.L.; Dahlberg, J.A.; Kearns, F.; Bali, K.M.; Zaccaria, D. Climate change trends and impacts on California agriculture: A detailed review. Agronomy 2018, 8, 25. [Google Scholar] [CrossRef] [Green Version]
- Døving, A. Climate change and strawberry season in Norway. Acta Hortic. 2008, 842, 753–756. [Google Scholar] [CrossRef]
- Esitken, A.; Ercisli, S.; Yildiz, H.; Orhan, E. Does climate change have an effect on strawberry yield in colder growing areas? Acta Hortic. 2009, 838, 59–61. [Google Scholar] [CrossRef]
- Bethere, L.; Sīle, T.; Seņņikovs, J.; Bethers, U. Impact of climate change on the timing of strawberry phenological processes in the Baltic States. Est. J. Earth Sci. 2016, 65, 48–58. [Google Scholar] [CrossRef]
- Neri, D.; Baruzzi, G.; Massetani, F.; Faedi, W. Strawberry production in forced and protected culture in Europe as a response to climate change. Can. J. Plant Sci. 2012, 92, 1021–1036. [Google Scholar] [CrossRef]
- Husani, A.M.; Xu, Y.W. Challenges of Climate Change to Strawberry Cultivation: Uncertainty and Beyond. In Strawberry: Growth, Development and Diseases; Husani, A.M., Neri, D., Eds.; CABI: Wallingford, UK, 2016; pp. 262–287. [Google Scholar]
- Morton, L.W.; Peres, N.; Fraisse, C.; Gleason, M. Climate, weather and strawberries. Sociol. Tech. Rep. 2017, 1047, 16. [Google Scholar]
- Kerr, A.; Dialesandro, J.; Steenwerth, K.; Lopez-Brody, N.; Elias, E. Vulnerability of California specialty crops to projected mid-century temperature changes. Clim. Chang. 2018, 148, 419–436. [Google Scholar] [CrossRef]
- Lobell, D.; Field, C. California perennial crops in a changing climate. Clim. Chang. 2011, 109, 317–333. [Google Scholar] [CrossRef]
- Deschenes, O.; Kolstad, C. Economic impacts of climate change on California agriculture. Clim. Chang. 2011, 109, 365–386. [Google Scholar] [CrossRef] [Green Version]
- Lobell, D.; Cahill, K.N.; Field, C.B. Historical effects of temperature and precipitation on California crop yields. Clim. Chang. 2007, 81, 187–203. [Google Scholar] [CrossRef]
- Grez, J.; Contreras, E.; Sánchez, S.; Alcalde, J.A.; Gambardella, M. Floral induction and dormancy behaviour in ‘Chilean white strawberry’ (Fragaria chiloensis (L.) Mill. subsp. chiloensis f. chiloensis). Sci. Hortic. 2020, 274, 109648. [Google Scholar] [CrossRef]
- Yang, J.; Su, D.; Wei, S.; Chen, S.; Lou, Z.; Shen, X.; Zhang, Z.; Jamil, A.; Tong, J.; Cui, X. Current and future potential distribution of wild strawberry species in the biodiversity hotspot of Yunnan Province, China. Agronomy 2020, 10, 959. [Google Scholar] [CrossRef]
- Gamboa-Mendoza, A.P.; Delgadillo-Martínez, J.; Almaraz-Suárez, J.J.; Robledo-Paz, A.; Alarcón, A. Response of Fragaria mexicana and rhizosphere microbial communities to temperature increase. Rev. Biol. Trop. 2019, 67, 94–106. [Google Scholar]
- Sun, P.; Mantri, N.; Lou, H.; Hu, Y.; Sun, D.; Zhu, Y.; Dong, T.; Lu, H. Effects of elevated CO2 and temperature on yield and fruit quality of strawberry (Fragaria × ananassa Duch.) at two levels of nitrogen application. PLoS ONE 2012, 7, e41000. [Google Scholar] [CrossRef]
- Mackenzie, S.J.; Chandler, C.K.; Hasing, T.; Whitaker, V.M. The role of temperature in the late-season decline in soluble solids content of strawberry fruit in a subtropical production system. HortScience 2011, 46, 1562–1566. [Google Scholar] [CrossRef]
- Menzel, C.M. Temperature has a greater effect on fruit growth than defoliation or fruit thinning in strawberries in the subtropics. Agriculture 2019, 9, 127. [Google Scholar] [CrossRef] [Green Version]
- Fernandes Filho, C.C.; Andrade, M.H.M.L.; Souza Marçal, T.; Fernandes, M.O.; Bastos, A.J.R.; Guedes, M.L.; Ribeiro, S.R.R.d.P.; Pinto, C.A.B.P.; Nunes, J.A.R. Selection of potato (Solanum tuberosum L.) clones for heat tolerance and resistance to viruses X and Y for processing purposes. Crop Sci. 2021, 61, 552–565. [Google Scholar] [CrossRef]
- Chandler, C.K.; Legard, D.E.; Dunigan, D.D.; Crocker, T.E.; Sims, C.A. ‘Strawberry Festival’ strawberry. HortScience 2000, 35, 1366–1367. [Google Scholar] [CrossRef] [Green Version]
- Whitaker, V.M.; Peres, N.A.; Osorio, L.F.; Fan, Z.; Nunes, M.C.N.; Plotto, A.; Sims, C.A. ‘Florida Brilliance’ strawberry. HortScience 2019, 54, 2073–2077. [Google Scholar] [CrossRef] [Green Version]
- Herrington, M.; Neal, J.; Woolcock, L.; Paynter, M.; Gomez, A. ‘Red Rhapsody’ strawberry. HortScience 2019, 54, 1641–1643. [Google Scholar] [CrossRef] [Green Version]
- Menzel, C.M.; Smith, L.A.; Moisander, J.A. The productivity of strawberry plants growing under plastic high tunnels in a wet subtropical environment. HortTechnology 2014, 24, 334–342. [Google Scholar] [CrossRef] [Green Version]
- Menzel, C.M. Changes in the concentration of leaf nitrogen over the season affect the diagnosis of deficiency or sufficiency in strawberries in the subtropics. Agriculture 2018, 8, 126. [Google Scholar] [CrossRef] [Green Version]
- Menzel, C.M.; Gomez, A.; Smith, L.A. Control of grey mould and stem-end rot in strawberry plants growing in a subtropical environment. Australas. Plant Pathol. 2016, 45, 489–498. [Google Scholar] [CrossRef]
- Macías-Rodríguez, L.; Quero, E.; López, M.G. Carbohydrate differences in strawberry crowns and fruit (Fragaria × ananassa) during plant development. J. Agric. Food Chem. 2002, 50, 3317–3321. [Google Scholar] [CrossRef] [PubMed]
- Kallio, H.; Hakala, M.; Pelkkikangas, A.; Lapveteläinen, A. Sugars and acids of strawberry varieties. Eur. Food Res. Technol. 2000, 212, 81–85. [Google Scholar] [CrossRef]
- Levenberg, K. A method for the solution of certain non-linear problems in least squares. Quart. Appl. Math. 1944, 2, 164–168. [Google Scholar] [CrossRef] [Green Version]
- Marquardt, D. An algorithm for least-squares estimation of nonlinear parameters. SIAM J. Appl. Math. 1963, 11, 431–441. [Google Scholar] [CrossRef]
- Tomczyk, K. Levenberg-Marquardt algorithm for optimization of mathematical models according to MINIMAX objective function of measurement systems. Metrol. Meas. Syst. 2009, 16, 599–606. [Google Scholar]
- Miura, H.; Imada, S.; Yabuuchi, S. Double sigmoid growth curve of strawberry fruit. J. Jpn. Soc. Hortic. Sci. 1990, 59, 527–531. [Google Scholar] [CrossRef] [Green Version]
- Chandler, C.K.; MacKenzie, S.J.; Herrington, M. Fruit development period in strawberry differs among cultivars, and is negatively correlated with average post bloom air temperature. Proc. Fla. State Hortic. Soc. 2004, 117, 83–85. [Google Scholar]
- Ariza, M.T.; Soria, C.; Martinez-Ferri, E. Developmental stages of cultivated strawberry flowers in relation to chilling sensitivity. AoB Plants 2015, 7, plv012. [Google Scholar] [CrossRef] [PubMed] [Green Version]
- Wang, S.Y.; Camp, M.J. Temperatures after bloom affect plant growth and fruit quality of strawberry. Sci. Hortic. 2000, 85, 183–199. [Google Scholar] [CrossRef]
- Kadir, S.; Sidhu, G.; Al-Khatib, K. Strawberry (Fragaria × ananassa Duch.) growth and productivity as affected by temperature. HortScience 2006, 41, 1423–1430. [Google Scholar] [CrossRef] [Green Version]
- Menzel, C.M. Strawberry R&D Update; Department of Primary Industries: Sydney, Australia, 2007; pp. 11–13. [Google Scholar]
- Acuna-Maldonado, L.; Pritts, M. Seasonal patterns of carbohydrate and nitrogen accumulation and depletion in strawberry are affected by fruiting but not day neutrality. J. Am. Pomol. Soc. 2013, 67, 95–103. [Google Scholar]
- Kruger, E.; Josuttis, M.; Nestby, R.; Toldam-Andersen, T.B.; Carlen, C.; Mezzetti, B. Influence of growing conditions at different latitudes of Europe on strawberry growth performance, yield and quality. J. Berry Res. 2012, 2, 143–157. [Google Scholar] [CrossRef] [Green Version]
- Le Mière, P.; Hadley, P.; Darby, J.; Battey, N.H. The effect of thermal environment, planting date and crown size on growth, development and yield of Fragaria × ananassa Duch. cv. Elsanta. J. Hortic. Sci. Biotechnol. 1998, 73, 786–795. [Google Scholar] [CrossRef]
- Anjom, F.K.; Vougioukas, S.G.; Slaughter, D.C. Development of a linear mixed model to predict the picking time in strawberry harvesting processes. Biosyst. Eng. 2018, 166, 76–89. [Google Scholar] [CrossRef]
- Xiong, Y.; Ge, Y.; Grimstad, L.; From, P.J. An autonomous strawberry-harvesting robot: Design, development, integration, and field evaluation. J. Field Robot. 2020, 37, 202–224. [Google Scholar] [CrossRef] [Green Version]
- Whitehouse, A.B.; Simpson, D.W.; Johnson, A.W.; McLeary, K.J.; Passey, A.J.; Troop, S.W. ‘Malling Centenary’, a short-day strawberry cultivar from NIAB-EMR. Acta Hortic. 2017, 1156, 185–188. [Google Scholar] [CrossRef]
- Delphy. Production Guidelines—Malling Centenary; Delphy: Wageningen, The Netherlands, 2018; pp. 1–10. [Google Scholar]
- Faedi, W.; Baruzzi, G. Strawberry Breeding. In Strawberry: Growth, Development and Diseases; Husaini, A.M., Neri, D., Eds.; CABI: Wallingford, UK, 2016; pp. 26–40. [Google Scholar]
- Herrington, M.E.; Wegener, M.; Hardner, C.; Woolcock, L.L.; Dieters, M.J. Influence of plant traits on production costs and profitability of strawberry in southeast Queensland. Agric. Syst. 2012, 106, 23–32. [Google Scholar] [CrossRef]
- Heide, O.M.; Stavang, J.A.; Sønsteby, A. Physiology and genetics of flowering in cultivated and wild strawberries—A review. J. Hortic. Sci. Biotechnol. 2013, 88, 1–18. [Google Scholar] [CrossRef]
- Nakano, Y.; Higuchi, Y.; Yishida, Y.; Hisamatsu, T. Environmental responses of the FT/TFL1 gene family and their involvement in flower induction in Fragaria × ananassa. J. Plant Physiol. 2015, 177, 60–66. [Google Scholar] [CrossRef] [PubMed]
- Sønsteby, A.; Heide, O.M. Flowering performance and yield of established and recent strawberry cultivars (Fragaria × ananassa) as affected by raising temperature and photoperiod. J. Hortic. Sci. Biotechnol. 2017, 92, 367–375. [Google Scholar] [CrossRef]
- Heide, O.M.; Sønsteby, A. Climate-photothermographs, a tool for ecophysiological assessment of effects of climate warming in crop plants: Examples with three berry crops. J. Berry Res. 2020, 10, 411–418. [Google Scholar] [CrossRef]
Figure 1.
Seasonal changes in accumulated marketable yield in five strawberry cultivars in Queensland. Data are the means (±SE or standard error) of six replicates per cultivar. Day 1 was the date of planting on 29 April and Day 182 was the last harvest on 28 October (n = 17). Details of the regressions are shown in Table 5.

Figure 2.
Seasonal changes in average fruit fresh weight (marketable fruit weighing at least 12 g) (AFWT) in strawberries in Queensland. Data are the means (±SE or standard error) of five cultivars with six replicates for each cultivar. Day 1 was the date of planting on 29 April and Day 182 was the last harvest on 28 October (n = 17). For the last 14 harvests, AFWT (g) = Intercept—0.107 × Day (p < 0.001, R2 = 0.89). Average fruit fresh weight was low for the first three harvests (not included in regression).

Figure 3.
Relationship between average fruit fresh weight (marketable fruit weighing at least 12 g) (AFWT) and average daily mean temperature (Temperature) during different periods before harvest from 29 July to 28 October in strawberries in Queensland. These periods covered flower development (five to seven weeks before harvest), fruit development (four weeks before harvest), and flower and fruit development (seven weeks before harvest). Data are the means (±SE or standard error) of five cultivars with six replicates for each cultivar. AFWT (g) = Intercept—2.22 × TemperatureWeeks5-7 (p < 0.001, R2 = 0.48, n = 14). AFWT (g) = Intercept—1.95 × TemperatureWeeks4 (p < 0.001, R2 = 0.90, n = 14). AFWT (g) = Intercept—2.45 × TemperatureWeeks7 (p < 0.001, R2 = 0.90, n = 14). Blue lines indicate 95% confidence intervals.


Table 1.
Average monthly daily temperatures and daily solar radiation, and total monthly rainfall in the study with the strawberries in Queensland. Long-term average temperatures (1965 to 1990), solar radiation (2004 to 2019), and rainfall (2007 to 2019) also presented.
Table 1.
Average monthly daily temperatures and daily solar radiation, and total monthly rainfall in the study with the strawberries in Queensland. Long-term average temperatures (1965 to 1990), solar radiation (2004 to 2019), and rainfall (2007 to 2019) also presented.
| Period | May | June | July | August | September | October |
|---|---|---|---|---|---|---|
| 2020 | ||||||
| Mean daily max. temperature (°C) | 23.2 | 22.2 | 21.3 | 23.3 | 24.6 | 26.6 |
| Mean daily min. temperature (°C) | 13.5 | 13.0 | 11.2 | 10.1 | 13.7 | 15.7 |
| Mean daily solar radiation (MJ/m2) | 13.3 | 12.4 | 13.5 | 16.3 | 17.4 | 20.6 |
| Total monthly rainfall (mm) | 51 | 59 | 113 | 17 | 76 | 112 |
| Long-term average | ||||||
| Mean daily max. temperature (°C) | 23.5 | 21.3 | 20.8 | 22.3 | 24.6 | 26.5 |
| Mean daily min. temperature (°C) | 11.7 | 8.5 | 7.0 | 7.4 | 9.8 | 13.2 |
| Mean daily solar radiation (MJ/m2) | 13.7 | 11.7 | 13.1 | 16.1 | 18.9 | 20.9 |
| Total monthly rainfall (mm) | 108 | 115 | 50 | 58 | 90 | 80 |
Table 2.
Variations in the number of leaves/plant, leaf area/plant and plant dry weight (leaves, crowns, and roots) in five strawberry cultivars in Queensland. Data are the means of six replicates per cultivar and were collected on 26 August or on 28 October. Means in a column for each harvest followed by a common letter are not significantly different by the Fisher’s least significant test at 5% level of significance. Means ± (SE or standard error) across all the cultivars for each harvest also presented.
| Cultivar & Time of Sampling | No. of Leaves/Plant | Leaf Area (cm2/plant) | Leaf Dry Weight (g/plant) | Crown Dry Weight (g/plant) | Root Dry Weight (g/plant) |
|---|---|---|---|---|---|
| 26 August | |||||
| Festival | 15.3 b | 1450 c | 12.4 c | 2.5 bc | 1.2 bc |
| Brilliance | 13.8 ab | 843 a | 7.3 a | 1.9 a | 0.7 a |
| Red Rhapsody | 13.4 ab | 1138 b | 11.1 c | 2.6 c | 1.5 c |
| Scarlet Rose | 11.4 a | 990 a | 9.3 b | 2.0 ab | 0.9 ab |
| Sundrench | 14.9 b | 1008 ab | 9.0 ab | 1.8 a | 1.0 ab |
| Mean ± SE | 13.8 ± 0.6 | 1086 ± 92 | 9.8 ± 0.8 | 2.2 ± 0.1 | 1.1 ± 0.1 |
| 28 October | |||||
| Festival | 25.1 b | 1249 c | 17.2 c | 4.8 b | 1.7 b |
| Brilliance | 24.9 b | 1280 a | 10.4 a | 3.4 a | 1.1 a |
| Red Rhapsody | 22.5 ab | 1710 b | 16.8 c | 4.4 b | 2.1 c |
| Scarlet Rose | 19.5 a | 1642 b | 14.8 b | 3.5 a | 1.2 a |
| Sundrench | 21.2 a | 1142 a | 9.8 a | 2.9 a | 1.5 b |
| Mean ± SE | 22.6 ± 1.0 | 1585 ± 159 | 13.8 ± 1.4 | 3.8 ± 0.3 | 1.5 ± 0.2 |
Table 3.
Variations in the concentration of non-structural carbohydrates in the leaves, crowns, and roots in five strawberry cultivars in Queensland. The plants were harvested on 26 August or on 28 October. Data are the means of six replicates per cultivar. Means in a column followed by a common letter are not significantly different by the Fisher’s least significant test at 5% level of significance. Means ± (SE or standard error) across all the cultivars for each harvest also presented. DW = dry weight.
| Cultivar | Concentration of Non-Structural Carbohydrates (% DW) | |||
|---|---|---|---|---|
| Leaves on 26 August | Crowns and Roots on 26 August | Leaves on 28 October | Crowns and Roots on 28 October | |
| Festival | 8.9 a | 4.8 a | 7.1 b | 3.8 a |
| Brilliance | 7.7 a | 4.9 a | 5.6 a | 3.5 a |
| Red Rhapsody | 8.2 a | 5.3 a | 5.9 a | 3.6 a |
| Scarlet Rose | 7.7 a | 4.5 a | 6.3 ab | 3.5 a |
| Sundrench | 7.9 a | 5.4 a | 7.1 b | 4.3 a |
| Mean ± SE | 8.1 ± 0.3 | 5.0 ± 0.1 | 6.4 ± 0.2 | 3.7 ± 0.1 |
Table 4.
Variations in total marketable yield, mean seasonal average fruit fresh weight (marketable), percentage of small fruit (<12 g fresh weight), fruit soluble solids content (SSC), and fruit titratable acidity (TA) in five strawberry cultivars in Queensland. Average seasonal fruit fresh weight is the long-term average value of fruit fresh weight in a cultivar pooled across all harvests (marketable fruit). Soluble solids content and titratable acidity were measured over seven harvests from 16 September to 28 July. Data are the means of six replicates per cultivar. Means in a column followed by a common letter are not significantly different by the Fisher’s least significant test at 5% level of significance.
| Cultivar | Marketable Yield (g/plant) | Av. Fruit Fresh Weight (g) | Percentage of Small Fruit | Soluble Solids Content (%) | Titratable Acidity (%) |
|---|---|---|---|---|---|
| Festival | 616 b | 20.3 a | 29.0 c | 8.3 c | 0.64 b |
| Brilliance | 457 a | 22.7 b | 28.2 c | 7.3 b | 0.57 a |
| Red Rhapsody | 617 b | 23.9 c | 16.2 a | 7.3 b | 0.64 b |
| Scarlet Rose | 592 b | 24.4 cd | 21.7 b | 8.9 d | 0.83 c |
| Sundrench | 656 b | 25.5 d | 16.0 a | 6.8 a | 0.57 a |
Table 5.
Details of the relationships between the seasonal changes in accumulated marketable yield and day since planting in the five strawberry cultivars in Queensland shown in Figure 1. Yield (g/plant) = Sm/(1 + exp. (−k × (Day-m))). Sm is the maximum yield, k is a rate constant (yield/day), and m describes the time to reach the maximum increase in yield (days). SE = standard error. p < 0.001 in all cases.
| Cultivar | Sm ± SE | k ± SE | m ± SE | R2 Value |
|---|---|---|---|---|
| Festival | 670 ± 12 | 0.050 ± 0.002 | 129 ± 1 | 0.99 |
| Brilliance | 481 ± 11 | 0.047 ± 0.002 | 125 ± 1 | 0.99 |
| Red Rhapsody | 698 ± 13 | 0.046 ± 0.001 | 139 ± 1 | 0.99 |
| Scarlet Rose | 643 ± 14 | 0.049 ± 0.002 | 133 ± 1 | 0.99 |
| Sundrench | 679 ± 12 | 0.052 ± 0.002 | 127 ± 1 | 0.99 |
Publisher’s Note: MDPI stays neutral with regard to jurisdictional claims in published maps and institutional affiliations. |
© 2021 by the author. Licensee MDPI, Basel, Switzerland. This article is an open access article distributed under the terms and conditions of the Creative Commons Attribution (CC BY) license (http://creativecommons.org/licenses/by/4.0/).
Share and Cite
MDPI and ACS Style
Menzel, C. Higher Temperatures Decrease Fruit Size in Strawberry Growing in the Subtropics. Horticulturae 2021, 7, 34. https://doi.org/10.3390/horticulturae7020034
AMA Style
Menzel C. Higher Temperatures Decrease Fruit Size in Strawberry Growing in the Subtropics. Horticulturae. 2021; 7(2):34. https://doi.org/10.3390/horticulturae7020034
Chicago/Turabian StyleMenzel, Christopher. 2021. "Higher Temperatures Decrease Fruit Size in Strawberry Growing in the Subtropics" Horticulturae 7, no. 2: 34. https://doi.org/10.3390/horticulturae7020034
Note that from the first issue of 2016, this journal uses article numbers instead of page numbers. See further details here.