Article

Monitoring the Green Vegetation Period of Two Narcissus Taxa by Non-Destructive Analysis of Selected Physiological and Morphological Properties

by
Katalin Jezdinská Slezák
1,2,*,
Aleš Jezdinský
1,
Miroslav Vachůn
3,
Oldřiška Sotolářová
1,
Robert Pokluda
1 and
Jiří Uher
1
1
Department of Vegetable Sciences and Floriculture, Faculty of Horticulture, Mendel University in Brno, Valtická 337, 691 44 Lednice, Czech Republic
2
Department of Vegetable and Mushroom Growing, Hungarian University of Agriculture and Life Sciences, Villányi 29–33, 1118 Budapest, Hungary
3
Mendeleum—Institute of Genetics, Faculty of Horticulture, Mendel University in Brno, Valtická 337, 691 44 Lednice, Czech Republic
*
Author to whom correspondence should be addressed.
Horticulturae 2021, 7(12), 585; https://doi.org/10.3390/horticulturae7120585
Submission received: 20 November 2021 / Revised: 13 December 2021 / Accepted: 15 December 2021 / Published: 17 December 2021

Abstract

:
In a pot experiment, an early-flowering Narcissus pseudonarcissus cv. ‘Dutch Master’ (DM) and late-flowering N. poeticus cultural form (PO) were examined. The photosynthetic rate (A), transpiration rate (E), stomatal conductance (gs), photosynthetic water use efficiency (WUE), relative chlorophyll content (CCI) and chlorophyll fluorescence (F) were measured regularly. Leaf length, scape length and weight of the plant organs were also measured. The DM cultivar had higher gs and lower E values than the PO on most measuring dates (season average: gs: DM: 165.34, PO: 123.63; E: DM: 1.39, PO: 1.78 mmol H2O m−2s−1). The A curve was similar for the two taxa, except for the first measuring dates. The basic F values (F0, Fm, Fv) for DM were lower and CCI values were higher than for PO (season average of CCI: DM: 94.82, PO: 60.34). The Fm/F0, Fv/F0 and CCI curves were well described by a second order equation. The seasonal change of F and CCI values was the greatest for both taxa near the leaf tip. Bulb growth occurred in the two taxa in approximately the same calendar period, regardless of flowering time. A significant part of the leaf growth in DM occurred after flowering, while the leaves of PO reached their mature size by flowering.

1. Introduction

Narcissus species are among the most important ornamental bulbous plants. It is widely used as an outdoor perennial, for cut flower production in open fields, and as a cut or pot flower in greenhouse production [1]. It is also playing an increasing role in medicine [2,3].
The Narcissus cultivars grown on the largest area belong to the cyclamineus, large-cupped, trumpet and tazetta divisions [4,5]. The trumpet division’s main characteristic is its large corona (“trumpet”), which has the same length or is longer than the perianth segments. One of its major cultivars is ‘Dutch Master’. N. poeticus belongs to a separate division (Div. 9). Its main characteristics are: pure white perianth segments, a short or disc-shaped corona, usually with a green and/or yellow center and red rim, sometimes of a single color [4]. Nowadays, this Narcissus species is not used very much, mainly because of the latest spring flowering species from the genus Narcissus [6]. However, the snow-white petals and the elegant appearance of the flowers, as well as the intense fragrance, make it interesting to develop a growing technology and extend the picking period as a cut flower.
Most members of the genus Narcissus flower in spring; their active growth occurs in the spring, along with their flowering. They go dormant in summer when it is warm and the soil is dry, and then grow again in the autumn [7]. The growth rate of the above-ground parts and the speed of flowering (start, prolongation, durability) depend on temperature. Leaves remain active after flowering and their early removal reduces bulb yield. For most cultivars, six weeks after flowering is considered appropriate for picking [8].
In the case of forcing, after planting, the bulbs are kept at a low temperature during the rooting stage (13–18 weeks). Forcing starts after the above-ground parts have emerged. Flowering of widely used cultivars is expected 2–3 weeks after the start of propagation. In cut-flower cultivation, the plants are moved outdoors after flowering and allowed to retreat [8].
Narcissus plants need to produce a reserve base during green vegetation, which they use to live on during this time and during the summer retreat, and then develop their flowers and leaves the following year. This usually involves 1–3, and less often 4–5 leaves per bulb. The short aboveground life period with spring flowering is usually associated with a high photosynthetic rate of the plants [9].
The photosynthetic activity of daffodil taxa has been investigated in several experiments. Veatch-Blohm et al. in an active experimental year measured the photosynthetic rate (A), transpiration rate (E) and stomatal conductance (gs) of three Narcissus cultivars (including ‘Dutch Master’) in salt tolerance experiments. In the control (non-salt-treated) plants, the A, E and gs changed over time in the period between days 10 and 41 of forcing (measured 1–2 times per year in several experiments), but the direction of change was not clear [10,11,12]. There can be significant differences in A, E, gs between daffodil N. pseudonarcissus cultivars grown under the same conditions [13]. YanTao et al. [14] reported that daffodil photosynthesis has two daily peaks, with midday depression. Their measurements show that the stomata are not responsible for the depression. Parallel examination of the photosynthetic rate and water consumption (stomatal conductance or transpiration) can demonstrate the water consumption efficiency value (WUE) [15,16].
The measurement of chlorophyll fluorescence is nowadays becoming more and more widespread in experimental fields [17,18], thanks to the fact that it is fast, non-destructive and can be used in vivo [17]. The fluorescence induction parameters vary with plant and leaf age, and that the values are different for leaves in different positions [19]. The most often used parameter to characterize the efficiency of the PSII system is the quantum yield (Fv/Fm) [18,20,21]. When examining leaves of different ages at the same time on the same plant, F0, Fm and Fm/Fv values, the latter seems to be the most stable property [22].
For chlorophyll content, the non-destructive method allows for the measurement of the relative chlorophyll content index (CCI). It is a relatively widely used, mainly to assess the nitrogen supply of plants [23,24]. It has also been used to test the salt tolerance of daffodil cultivars [12] and to monitor chlorophyll content in potted daffodils for the hormonal regulation of leaf and shoot length growth [25].
Excessive leaf and stem length growth is a major problem in bulb propagation, especially in pot production [8,26]. For this reason, a lot of research has been directed towards keeping plants compact in size [8,26,27,28,29,30].
For bulbous species, an increase in bulb weight is possible during the green growing season, i.e., in spring for the best-known daffodil species. Rees investigated the rate of weight gain in several taxa (N. pseudonarcissus ‘Fortune’ and ‘Golden Harvest’, and N. poeticus ‘Actaea’) in both round and double-nosed bulbs. The curve of bulb dry weight and whole-plant dry weight growth run in parallel. The dry weight of bulbs initially decreases and then starts to grow rapidly, up to 0.53 g plant−1 day−1 in May [31]. In previous field research conducted at Mendel University in Brno, the growth of N. poeticus asymmetric bulb-set propagules was investigated in the post-flowering period [32]. Significant increases in both parameters were observed two and four weeks after flowering, but the rate of increase was dependent on bulb size and environmental factors. In the same experiment, further root growth was observed after flowering, and in some bulb-size fractions, leaf dry weight also increased, but generally to a small extent.
The main aim of our research was to monitor, by non-destructive methods, selected plant physiology processes of narcissus during the green vegetation period in order to understand the differences in photosynthesis, water consumption indicators, chlorophyll fluorescence and chlorophyll abundance between the different phenological phases. Changes in the physiological processes of two Narcissus taxa with different flowering times, the early-flowering N. pseudonarcissus ‘Dutch Master’ and the late spring flowering N. poeticus, were followed, and the evolution of plant weight and above-ground part (leaf, stem) size at major phenological stages was monitored. Another aim was to find data to improve the forcing technology, especially for N. poeticus, a species not yet used in greenhouses. The results of the experiment provide a basis for the development of field cultivation techniques, for gaining a better understanding of the requirements of the different phenological phases of the crop and point to some of the physiological reasons behind the known effects of several steps of cultivation (early leaf removal, early lifting).

2. Materials and Methods

2.1. Plant Material

In the experiment, the growing properties of 2 daffodil taxa were examined. A cultural form of Narcissus poeticus L. was originally collected from the local population in Hungary (Pákozd, 47°12.938′ N, 18°32.794′ E). Beginning in 2013, the bulbs were grown in Lednice (Czech Republic, the experimental area of Mendel University in Brno, Faculty of Horticulture). Since that time, the bulbs used for the present experiment have been lifted and replanted annually over the last 3 years. For the experiment, the bulbs were lifted in the second half of June 2020, and after 4 weeks drying, then the cleaned and classified bulbs were stored in a dark chamber at 17 °C for 6 weeks. From the middle of September, the bulbs were stored in a colder storage room (12–15 °C) to the middle of October (5 weeks). In the experiment, single-nosed bulbs that had an approximately circular cross section were used as the propagation material. The main characteristics of the size of the bulbs were as follows: maximum diameter: 30.65 ± 2.92 mm, fresh weight: 16.44 ± 3.02 g, dry weight: 7.05 ± 1.25 g.
N. pseudonarcissus L. cv. ’Dutch Master’ bulbs were purchased from a Dutch wholesaler 5 weeks before planting. After delivery, the bulbs were stored in the same place as the bulbs of the other taxon. Single-nosed bulbs were planted. The main characteristics of the size of the bulbs were as follows: maximum diameter: 39.45 ± 3.07 mm, fresh weight: 31.68 ± 4.21 g, dry weight: 12.00 ± 1.59 g.

2.2. Plant Growing Conditions

From the N. poeticus 180, from the N. pseudonarcissus ‘Dutch Master’ 130 bulbs were planted in 15 October 2020 into 0.07 × 0.07 × 0.08 m3 black plastic pots filled with a peat-based substrate (70% fibrous peat, 30% ground peat, 40 kg m−3 zeolite, 1.5 kg m−3 PG mix 14–16–18). After being planted into the pre-wetted substrate, the pots were filled with water to bulk-capacity, returned to the rooting chamber and conditioned to 9 °C and 80% RH in dark conditions. At the 60–100 mm leaf stage, the pots were transferred to the forcing location. The dates of transfer were 2 January (‘Dutch Master’) and 5 February (N. poeticus) (“0” day of the forcing).
During the forcing period, the majority of the ‘Dutch Master’ plants (except the plants used for physiology measurements) were grown in a greenhouse where the heating target values were as follows: daily temperature around 17 °C, night temperature 15 °C. Until mid-April, the N. poeticus plants were grown in a growing chamber (environmental conditions: daily temperature: 17 °C, night temperature: 15 °C; RH 78%; light: 125 uE, white; day length adjusted to the current natural day length). Subsequently, the plants were returned to the greenhouse, where the minimum target values were the same as before: the maximum temperature was ambient (following the outside temperature, on sunny days fully opened side and roof ventilation).
The plants whose physiological processes were measured (both taxa) were grown in the growing chamber throughout the measurement period.
In the flowering stage, 0.3 L per plant of top-dressing fertilizer was applied, shared into 2 parts, with 3-day differences. For the preparation of the nutrient solution, using tap water, a 0.2% solution of fertilizer was used (0.28 g N, 0.16 g P2O5, 0.5 g K2O, 0.04 g MgO per liter).
The last irrigation occurred when the plants showed signs of drying back (yellowish-dry leaf tips in 30–50 mm of length). The lifting was established a week after the last irrigation.

2.3. Measurement and Analysis

According to the aim of the research, selected plant physiological processes and properties were examined in a non-destructive way, supplemented by studies on leaf length and stem length growth, plant weight and chlorophyll content.
During data processing, flowerless plants were excluded from the experiment. Finally, to evaluate the different plant properties, 110 ‘Dutch Master’ plants and 150 N. poeticus plants were selected for the next measurement:
  • Non-destructive plant-physiology examinations: 15 plants per taxon
  • Biomass (weight of plant parts): ‘Dutch Master’: 60 plants, N. poeticus 90 plants per taxon (4 and 6 sampling dates, respectively).
  • Leaf and stem length: 50 plants per taxon

2.3.1. Measurement of Plant Physiology Parameters

A consistent series of measurements were taken, each time on the same leaf (the longest leaf of the main bulb), in the same place.
Photosynthetic rate (A, assimilation/respiration, μmol CO2 m−2 s−1), transpiration rate (E, mmol H2O m−2 s1), stomatal conductance (gs, mmol H2O m−2 s−1) and photosynthetic water use efficiency (WUE, mmol CO2 mol−1 H2O) were measured using a CIRAS-3 Portable Photosynthesis System (PP Systems, Amesbury MA, USA), with the following main settings of the chamber (environment): temperature: 17 °C (cuvette temperature control; measured based on energy balance), LED light, 500 μmol m−2 s−1, light composition: 38% red, 37% green, 25% blue, Analyzer Flo 50%, Fixed CO2 and H2O. The first measurement was taken 16–17 days after the start of the forcing when the leaves reached the minimum size suitable for taking damage-free measurements. Thereafter, measurements were taken on average every 7 days. The measurements were taken 65 and then 100 mm from the tip of the leaves (the distance of the center of chamber). The leaves were adapted to the chamber conditions in 5–8 min, from which time 20 pieces of data were recorded every 10 s.
The chlorophyll fluorescence parameters were measured using a FluorPen FP100 (PSI spol.sro., Drasov, Czech Republic), on the same days as the photosynthesis measurements were taken, after photosynthesis was measured, using the OJIP protocol with a dark adaptation period of at least 20 min.
The parameters examined were as follows:
F0 F50 μs, fluorescence intensity at 50 μs
Fm maximal fluorescence intensity
FV = Fm − F0 maximal variable fluorescence
Fm/F0ratio between the extremes
Fv/F0ratio between variable and minimal fluorescence
Fv/Fmmaximum quantum yield of PSII in a dark-adapted state
When the leaves reached the appropriate size, measurements were taken at more points on the same leaf in several places (A = 30, B = 65, C = 100, D = 135, and E = 170 mm from the leaf tip). According to the shape of the leaves, at 5 places, this was possible from the 5th measurement date for the ‘Dutch Master’ cultivar and from the 2nd measurement date for the N. poeticus. The evolution of maximum quantum yield (Fv/Fm) was also examined in detail at these points in the leaves.

2.3.2. Measurement of Chlorophyll Content

For taking measurements of relative chlorophyll content (CCI, chlorophyll content index), single point measurements were carried out by employing a CCM-200plus Chlorophyll Content Meter (Opti-Sciences, Inc., Hudson NH, USA). The instrument measures the optical absorbance in two different wavelengths (653 nm and 931 nm), by using a medical grade LED (peak at 653 nm) and an infrared LED (peak at 931 nm). The relative chlorophyll content (CCI) is calculated as their quotient of %Transmittance at 931 nm/%Transmittance at 653 nm. The measuring locations on the leaves were the same, as with the case of chlorophyll fluorescence measurements.

2.3.3. Measuring of the Leaf and Scape Length

The length was measured from the substrate surface to the tip of the longest leaf (leaf length), and to the top of the scape (without a flower bud or flower). Measurement accuracy: 1 mm, frequency: every 2–4 days from the appearance of the scape to the end of the flowering period, and every 6–10 days before and after it.

2.3.4. Measuring of the Weight of Plant Organs

In the case of N. poeticus, 6 sampling dates (the start of forcing, 2 and 4 weeks after the start of forcing, flowering, 4 weeks after flowering and at lifting) were used, while in the case of ‘Dutch Master’, 4 dates (the start of forcing, flowering, 4 weeks after flowering, lifting) were used. 15 representative plants were selected for each sampling from both taxa. After cleaning the underground parts (roots and bulb) from the pot substrate, the plants were separated into the following main parts: roots, bulb, leaves (from the neck of the bulbs), scape with buds (‘Dutch Master’, the start of forcing) and scape (flowering and later), flower (only during flowering time). After measuring the fresh weights of plant parts, 5 same plants parts were collected into a sample. The representative part of a shredded and mixed sample and the dry matter content were determined (based on measuring the initial weight, and the weight after drying at 105 °C to constant weight). Based on the fresh weight and dry matter content, the dry weight of the plant parts was calculated.

2.4. Data Processing, Statistical Methods

Microsoft 365 Excel and Microsoft 365 Access were used for primary data processing and making basic calculations. STATISTICA V12 (2013) (TIBCO Software Inc./Statistica Software Inc., Palo Alto, CA, USA) was used for performing all statistical analysis. First of all, normality was evaluated via the Shapiro–Wilk Test, and homoscedasticity was evaluated through Bartlett’s test. A Three-Way analysis of variance (ANOVA) and generalized linear model (GLM) were performed to evaluate the main effects and combined effects. The means between factor levels were compared using three-way ANOVA with Tukey’s HSD post-hoc comparisons. To evaluate the results, a level of p < 0.05 was used to conclude significant differences.

3. Results and Discussion

There was a 35-day difference in the rooting time of the two taxa after planting on 15 October (‘Dutch Master’: 78 days, N. poeticus: 113 days, respectively). The main flowering date was then on the 18th day for ‘Dutch Master’ and on the 46th day for N. poeticus (96 and 159 days after planting, respectively).

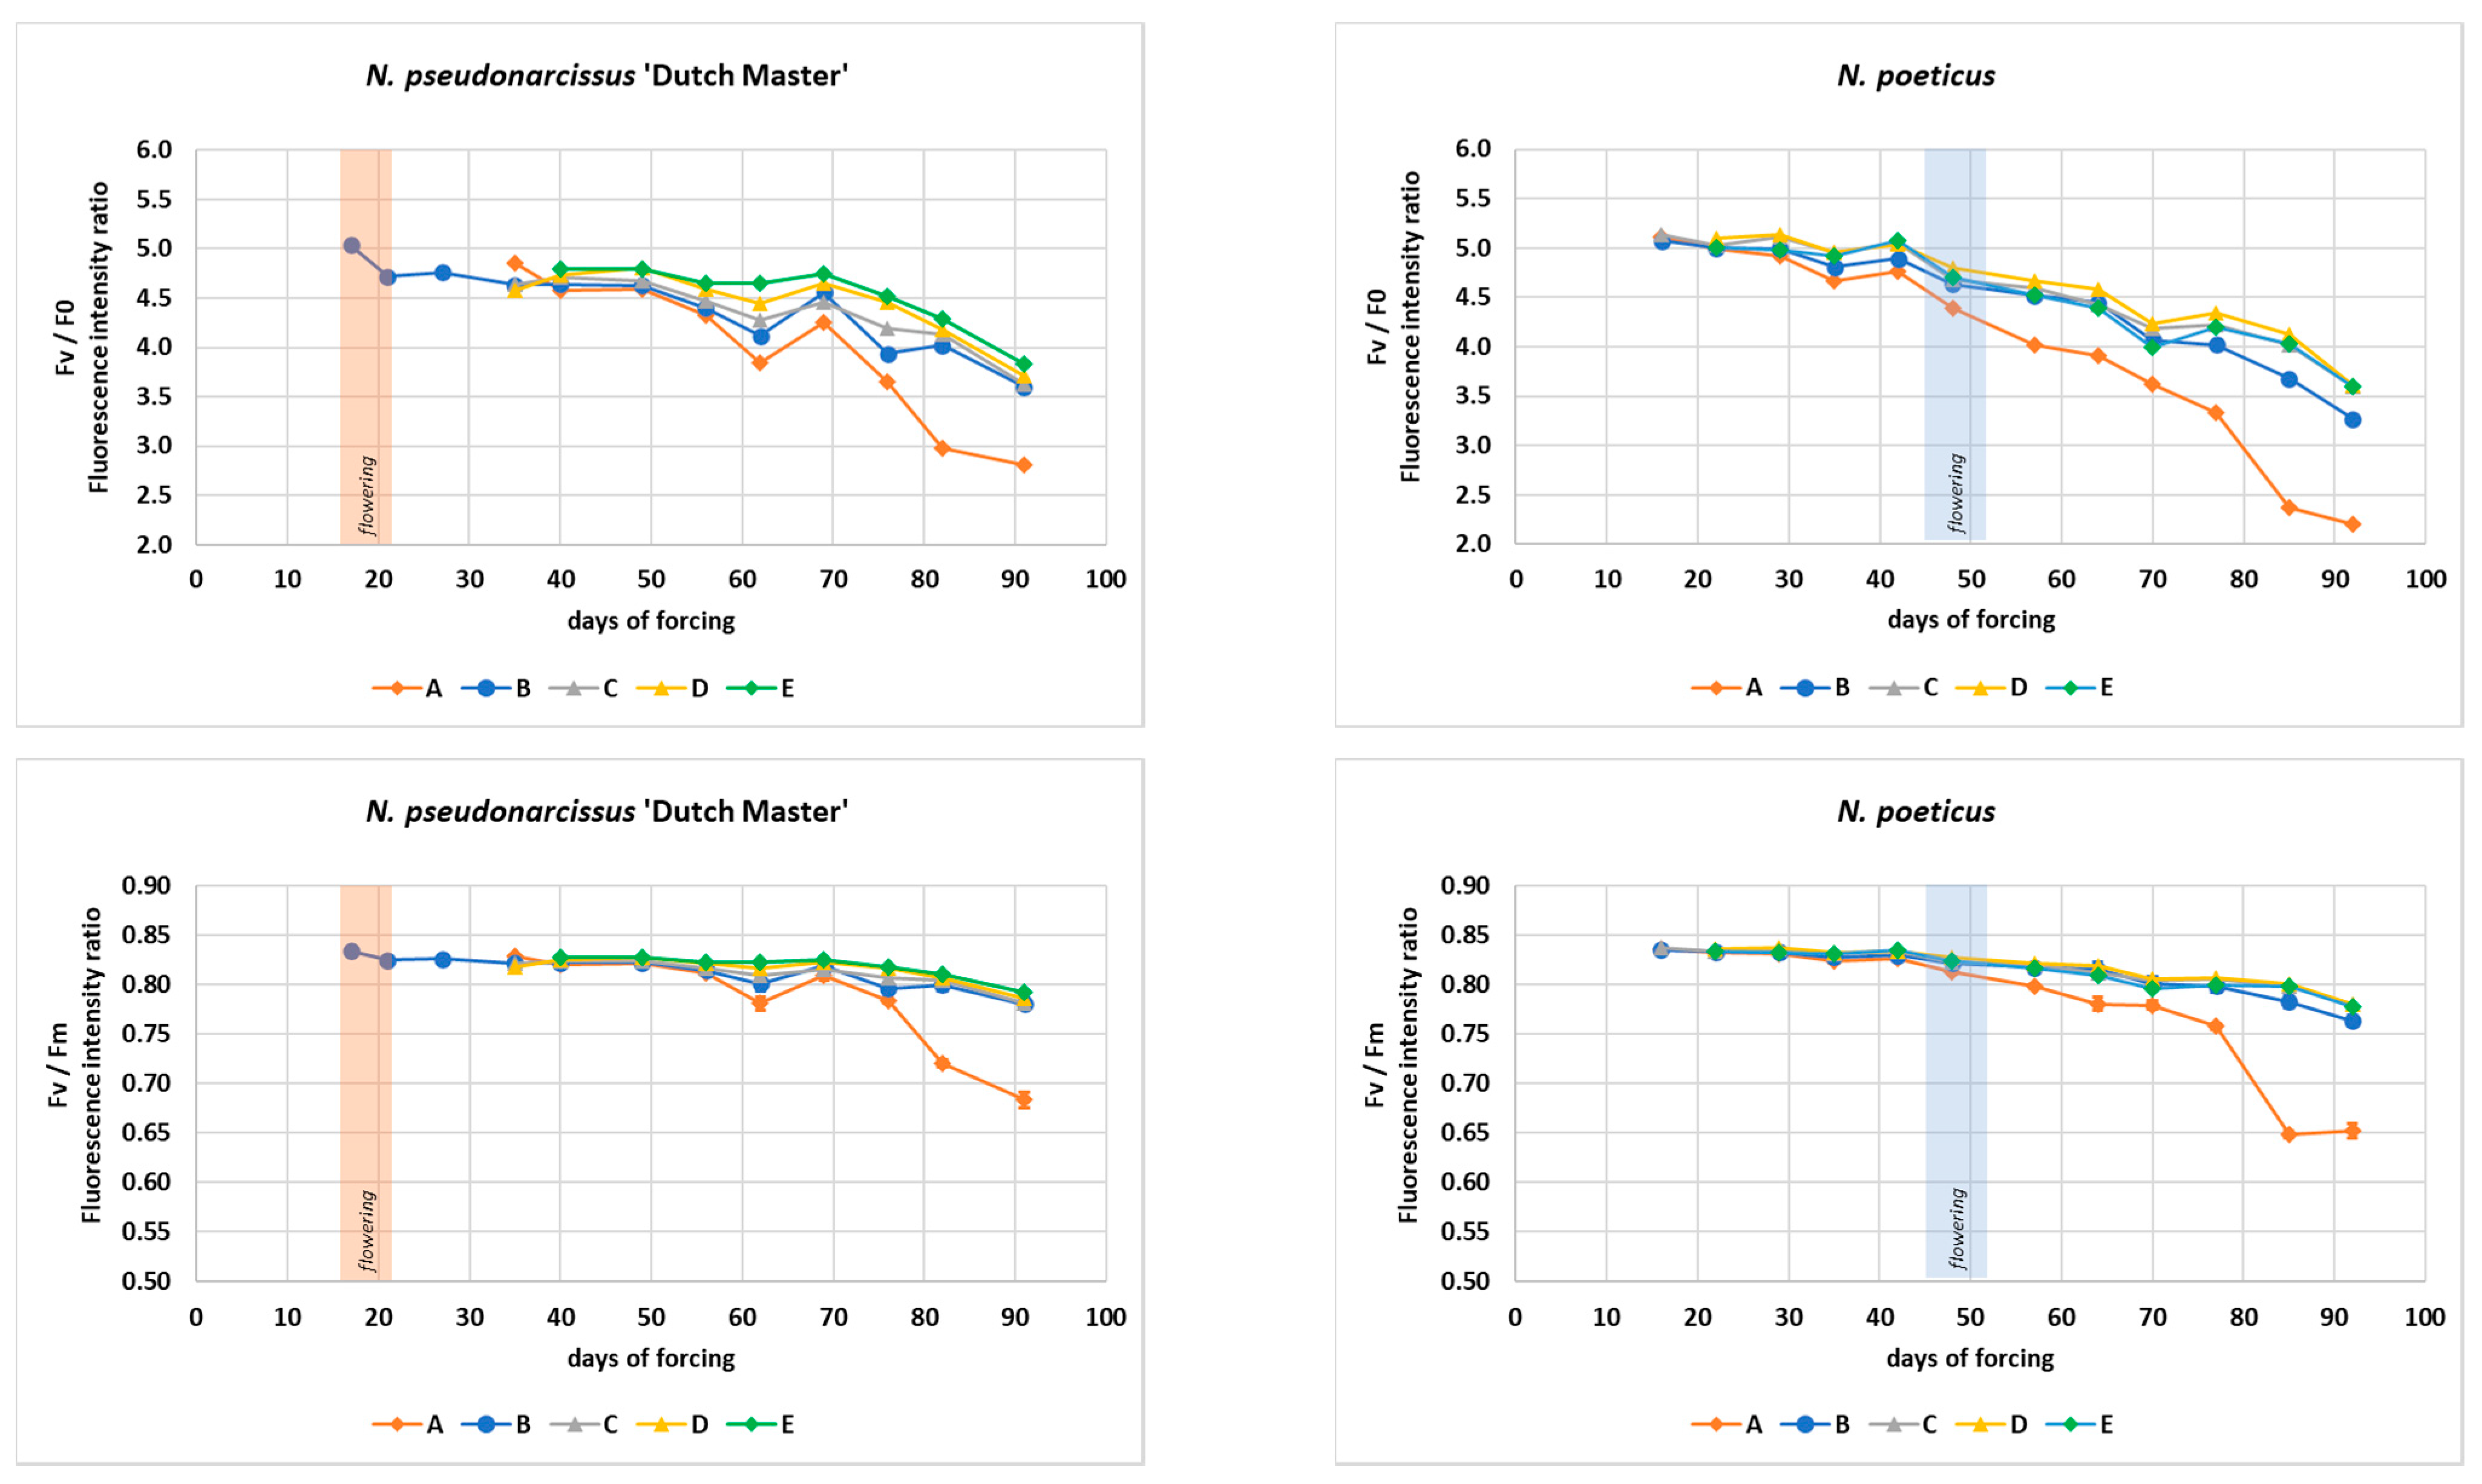
3.1. Plant Physiology Processes

The photosynthetic rate, transpiration rate, stomatal conductance, and water use efficiency were measured 12 times for both taxa. The results are presented in Figure 1, plotting the results on the time (x) axis based on the number of days since the start of forcing.
On the first day of measurement, which was 16–17 days after the start of forcing, the ‘Dutch Master’ cultivar was characterized by a low photosynthetic rate of 3.40 μmol CO2 m−2 s−1, which then almost doubled over the next 4 days. Individuals of the cultivar flowered on these days. The values then increased further and then a bell curve was described during the growing season. The initial value of N. poeticus (9.05 μmol CO2 m−2 s−1) was significantly higher than that of the ‘Dutch Master’ cultivar, but thereafter the curve fitting the mean values increased to a lesser extent.
The higher initial values may have been due to the fact that the leaf shape of the two taxa differed initially: the leaves of ‘Dutch Master’ plants are not plain and are close to the inner leaf, only later spreading out, which is in contrast to the N. poeticus, whose leaf blades are more “opened” from the beginning.
For both taxa studied, photosynthesis reached its maximum around 40 days after the start of forcing, with very similar values (‘Dutch Master’: 12.31; N. poeticus: 12.04 μmol CO2 m−2 s−1). In the case of ‘Dutch Master’, relatively high values were measured even on day 56 (11.37 μmol CO2 m−2 s−1), while the photosynthetic activity of N. poeticus plants decreased relatively rapidly from day 42. Flowering was also in this declining phase. From days 69–70 of the forcing season, the values of the two taxa were similar (they decreased at a similar rate).
Veatch-Blohm et al. examined 3 narcissus cultivars (including the ’Dutch Master’), on day 24 and day 27 of forcing and reported 2.51 and 5.78 μmol CO2 m−2 s−1 average values of the cultivars, respectively. In another year, on day 33, the value was 6.76 μmol CO2 m−2 s−1 (control plants in a salt tolerance experiment) [11]. In their published experiment, the ‘Dutch Master’ plants after an 88- and 98-day-long rooting period, flowered on days 23–24 from the start of forcing (compared to 78 + 18 days in the experiment detailed in this paper). Based on the results of the experiment published in this paper, the values of 8–9 μmol CO2 m−2 s−1 on days 24–27 and 11.86 μmol CO2 m−2 s−1 on day 35 are higher than the values published for the cultivar. This may be due to the fact that they published average data of more cultivars, and that the conditions of forcing (temperature, light) may have been different. In addition, in the above-mentioned publication, no air-conditioned measuring head or artificial lighting were used during the measurements. In addition, in their experiment, Veatch-Blohm et al. took their measurements during the midday hours, which can fall during the depression phase of the daily photosynthesis curve of daffodils mentioned by YanTao et al. [14]. We also observed the lower values during the midday hours. However, given the fact that we measured the values of 15 plants per species on each measurement day, measured the plants in a randomized order on the measurement days, and took a measurement break between 11 and 13 h (based on previous experience), we eliminated the variation due to the diurnal rhythm. Apart from these methodological differences, the results of Veatch-Blohm et al. [11] are similar to ours in that they also found a relatively high increase in values over a short period of time.
For N. poeticus, both transpiration and stomatal conductance were the highest on day 42 (E: 2.51 mmol H2O m−2 s−1, gs: 230.17 mmol H2O m−2 s−1). Subsequently, a decline and a slight increase after it occurred at flowering. A second, lower peak was found in the curve in transpiration on day 70, and in the stomatal conductance values a week earlier (day 64) (E: 2.51 mmol H2O m−2 s−1; gs: 172.42 mmol H2O m−2 s1). Thereafter, the values of both parameters decreased until the end of the growing period. For the ‘Dutch Master’ cultivar, the highest transpiration and stomatal conductance values were measured on day 56 (E: 3.20 mmol H2O m−2 s−1, gs: 417.97 mmol H2O m−2 s−1) and then a relatively steep drop was observed. At flowering, the values were relatively low in the upward part of the curve.
In experiments with hyacinth, Addai tested the photosynthesis rate and stomatal conductance of the plants every two weeks from weeks 4–18 after planting, using different nutrient doses [33]. In his experiments, the effect of fertilizers could be monitored by changes in both physiological parameters, but all treatments showed a relatively rapid decline after an initial rapid growth, with maximum values at week 12 (the main flower opening was at week 24). For daffodils, in the control plants of the previously mentioned salt tolerance experiment, Veatch-Blohm et al. found a rapid increase in the transpiration rate similar to the photosynthetic rate at the beginning of forcing, but no increase in stomatal conductance [11].
According to the previously published data, the correlation between stomatal conductance, water consumption and photosynthetic rate can be described by an exponential [34] or linear [35] regression. In the research reported in this paper (two species data together), an exponential relationship between photosynthetic rate and stomatal conductance was observed (y = 15.368e0.245x, R2 = 0.7626). The correlation between photosynthetic rate and transpiration rate was best described by a second-order function (y = −0.0016x2 + 0.2308x − 0.137, R2 = 0.6603). Examining the correlation by taxon, for both pairs of parameters (A-gs, A-E) ‘Dutch Mater’ showed more closely correlation than N. poeticus.
Photosynthetic water use efficiency (WUE) values were higher mainly at the beginning of the forcing period (when the leaves were just “opened”) and at the end for both taxa. N. poeticus showed an outstanding value on the first day of measurement (16.73 mmol CO2 mol−1 H2O). In the case of this taxon, the value was also relatively high at flowering (12.17 mmol CO2 mol−1 H2O). Comparing the two taxa, the values of the ‘Dutch Master’ cultivar were significantly lower than those of the N. poeticus for most of the forcing period.
No data on WUE for daffodil species can be found in the literature but given that the values measured for the two taxa were consistently different throughout the year, it can be concluded that their photosynthetic water use efficiency differs under conditions similar to those of the experiment (the forcing of potted plants, with similar water supply regime). However, to evaluate the data, it should be noted that several publications [36,37,38] have reported that the leaf-level water use efficiency calculated as the ratio of photosynthetic rate and transpiration rates and the ratio of photosynthetic rate to stomatal conductance is not the same as the actual WUE of the whole plant, and in many cases, there is no close correlation between them. This was the conclusion also reached by Vidal et al. when they conducted experiments with two species of the Amaryllidaceae (Rhodophiala bifida, Habranthus tubispathus) [39].
The chlorophyll fluorescence parameters, measured at the same location as the photosynthesis and water consumption parameters, are shown in Figure 2.
Throughout the study period, F0 (minimum fluorescence) values were higher for N. poeticus species than for ‘Dutch Master’ cultivar. N. poeticus had an ascending curve from day 35, showing the highest value (12,206) on day 85. In the case of ‘Dutch Master’, a smaller increase was observed compared to N. poeticus, and only in the last three measurements (from day 76) was the value higher than in the previous part of the forcing period. The curve of maximal fluorescence (Fm) values was even more uniform. For N. poeticus, there was only a significant change in the curve on the last two measurement days, with a peak (day 85.59943) followed by a decrease (day 92.47017). In the case of the ‘Dutch Masters cultivar, the linear regression, which can be fitted to the average values of the measurement days (R2 = 0.6352), shows a slight decreasing trend for the whole period (with a slope of 0.18%).
However, in the descending curve, on days 69–76, a slight increase was observed, with a small peak on day 76. For the two taxa, the values of N. poeticus were also higher in this parameter. The maximal variable fluorescence (Fv) values followed the trend described for Fm.
The Fm/F0 ratio and the Fv/F0 ratio for both taxa showed a decreasing trend during the growing season. In the case of N. poeticus, an increasing decrease in the values was observed from day 42 of the own growing season, while in the case of ‘Dutch Master’ it was recordable from day 49. The values of the quotients were significantly higher for N. poeticus than the ‘Dutch Master’ values on most of the measurement days. However, from days 76–77 the two curves had the same course. The trend of the curves for both taxa can be well described by a quadratic equation:
Fm/F0:
N. poeticus: y = −0.0002x2 + 0.0037x + 6.1345, R2 = 0.9696
N. pseudonarcissus ‘Dutch Master’: y = −0.0001x2 − 0.0008x + 5.9995, R2 = 0.9134.
Fv/F0:
N. poeticus: y = −0.0002x2 + 0.0037x + 5.1345, R2 = 0.9696
N. pseudonarcissus ‘Dutch Master’: y = −0.0001x2 − 0.0008x + 4.9995, R2 = 0.9134
As with the previous two quotients, the maximum quantum yield (Fv/Fm) decreased over time, and in the first half of the growing period, values of N. poeticus were significantly higher than values of the other taxa.
In Lycoris (Amaryllidaceae) species, Liu et al. presented that there can be significant differences in F0 values between species within the same genus for plants of the same age grown under the same conditions. For the four species they studied, they observed a diurnal rhythm in both F0 and Fv/Fm values, with the greatest difference between taxa occurring in the midday hours, by taking measurements every two hours, six times a day [40]. Few studies have measured the chlorophyll fluorescence of daffodil species. In a salt tolerance experiment, comparing the chlorophyll fluorescence values of 4 N. pseudonarcissus species, QuanChao et al. it was determined that Fm, Fv/F0 and Fv/Fm values had decreased, but in F0 increased under stress [41]. For other plant species, they investigated the variation of chlorophyll fluorescence parameters during plant development and the effect of leaf age on the sensitivity of fluorescence parameters. Mauromicale et al. measured that F0, Fm, and Fv increased until complete canopy development and thereafter declined until crop maturity [42]. In maize, Xu et al. observed that the Fv/Fm ratio under drought stress decreases more and more with time in older leaves, less in mature but still relatively young leaves, and practically no change in the leaves [43]. The lower values of light-adapted fluorescence in ageing leaves have also been observed, and that leaves of different ages have a daily fluorescence maximum at different times (young leaves in the morning, older leaves at noon) [44].
Fluorescence changes in different parts of the leaves are shown in Figure 3 and Figure 4. In the case of the N. poeticus, the curves of the basic parameters (F0, Fm, Fv) on the five sampling parts are parallel for most of the growing season.
The lowest values were found in the part of the leaf tip (A), and the values increased from the tip to the base. It was notable, however, that F0 values at point A, closest to the tip, increased more from the middle of the measurement period (flowering) than in other parts of the leaf. However, on the last date of the measurement, the value dropped significantly. The increase in Fm and Fv values mentioned at point A was not observed, and the values at this measurement point decreased more than at other parts of the leaf during the last two measurements.
For the ‘Dutch Master’ cultivar, the curves of the different measurement sites did not differ as much as for N. poeticus, but the trend for Fv was similar to that described for the other taxon. In addition, an increase in the F0 value at measurement point A was observed from day 69 onwards, followed by a decrease on the last day of measurement.
The Fm/F0, Fv/F0 and Fv/Fm ratios produced very similar curves. For both taxa, the biggest change was measured at the leaf tip (A), but values decreased over time at all sites. In the case of the ‘Dutch Master’ cultivar, only the curve of the apical part (A) clearly deviated significantly from the others, while in the case of N. poeticus, a decrease was also detected at the last measurement time point 65 mm from the tip (B).
The changes are shown through the Fv/F0 ratio (the ratio between variable and minimal fluorescence) with the particular result of statistical calculations (Supplementary Materials, Table S1). The decrease in mean values over time for both taxa can be well described by a quadratic function.

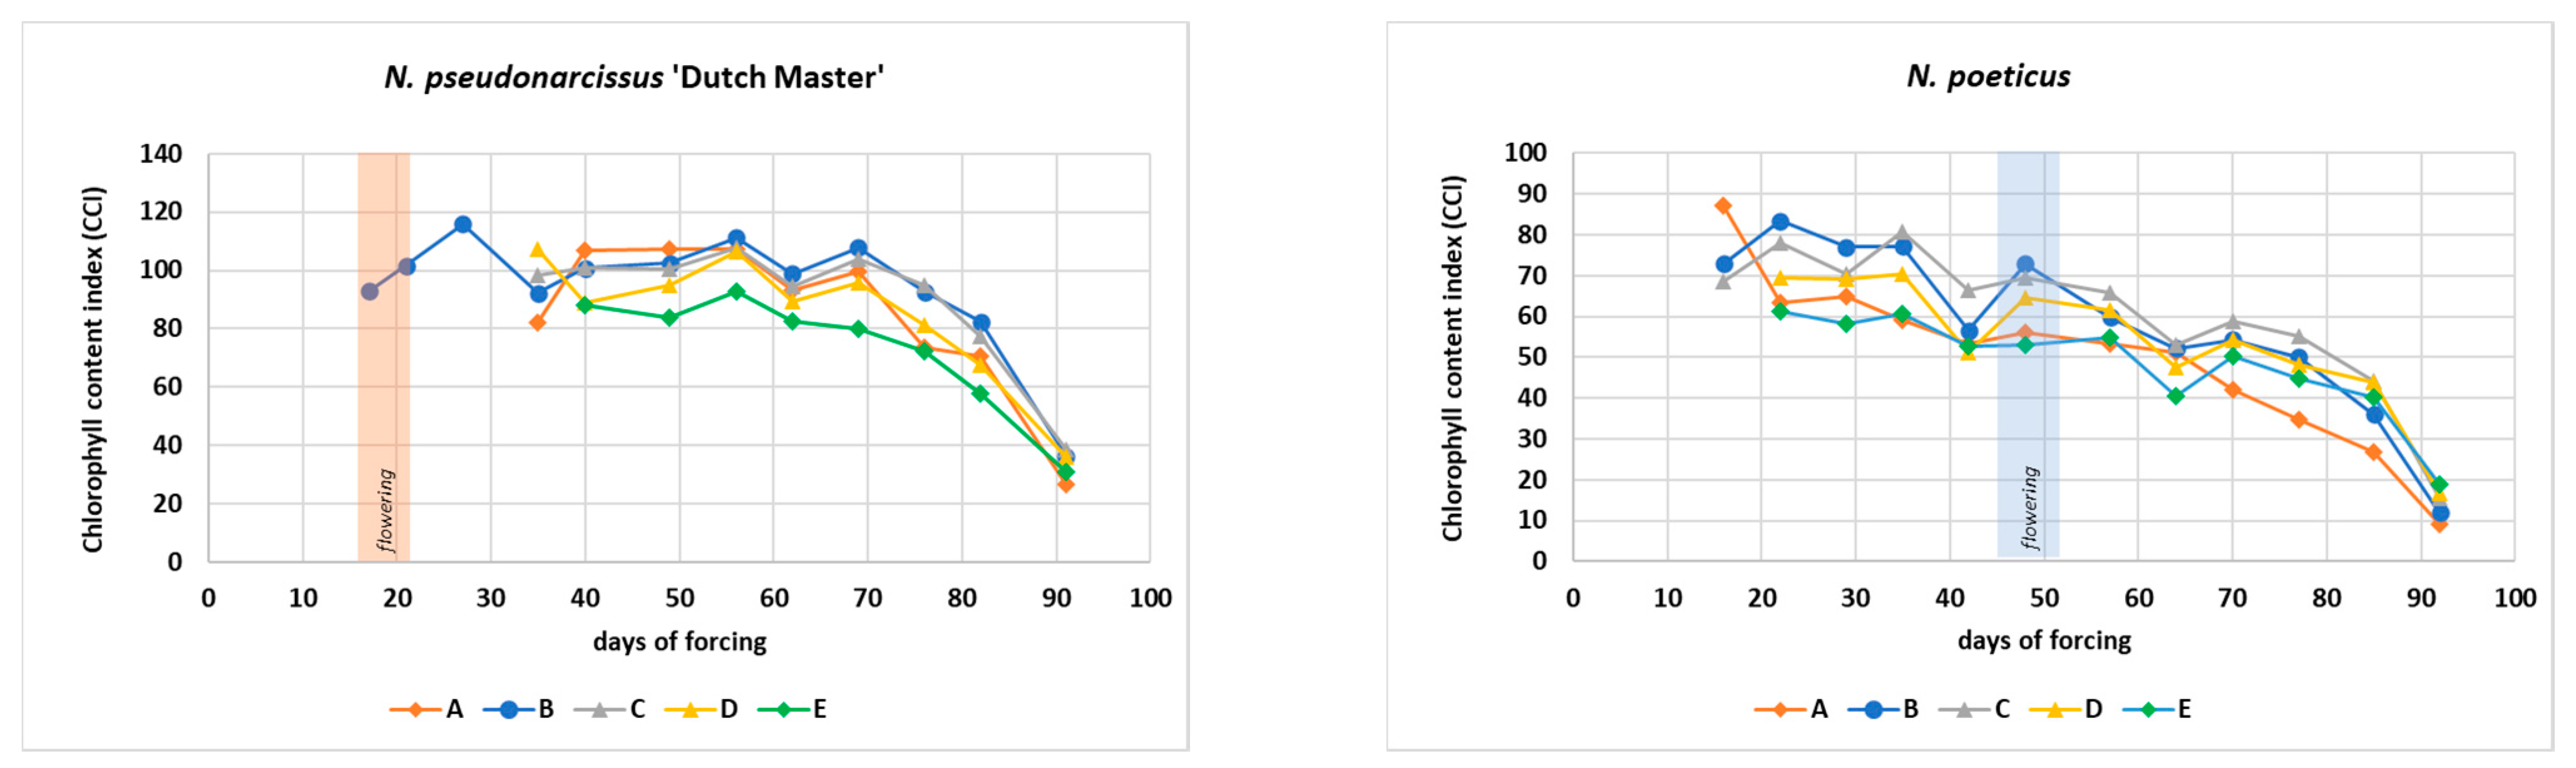
3.2. Chlorophyll Content

Measurements of relative chlorophyll content demonstrated that the two taxa have significantly different values at the leaf position, where photosynthesis and water-household parameters were measured (Figure 5). The values of the ‘Dutch Master’ cultivar were significantly higher than those of N. poeticus throughout the growing season. The shape of the curve representing the growing season differed slightly between the two taxa. In the case of the ‘Dutch Master’ cultivar, a clear decrease was found from day 69 after the start of forcing, i.e., relatively constant values were obtained for about 5 weeks after the flowering period of the cultivar. For N. poeticus, except for a small deviation, a decrease was observed earlier, from day 50 (flowering period). The curves of both taxa can be described by a by a quadratic function with the following formula and fitting accuracy:
y = −0.0263x2 + 2.2712x + 62.448, R2 = 0.8178
y = −0.0159x2 + 1.0809x + 55.849, R2 = 0.869
Veatch-Blohm et al. observed that the relative chlorophyll content of the three daffodil cultivars they studied differed significantly. The 67.77 ± 3.50 CCI units of ‘Dutch Master’ were found to have a medium chlorophyll content compared to the other two cultivars (‘Ice Follies’: 77.24 ± 2.00 CCI units; ‘Tete-a-Tete’: 34.74 ± 2.30 CCI units, respectively) [11]. In addition to the cultivar, their studies showed that bulb size also has a significant effect on relative chlorophyll content (the larger initial bulb weight, the higher CCI value) [12]. The higher values we measured for ‘Dutch master’ could be due to the different conditions of the two experiments (e.g., lighting, temperature).
Figure 6 shows the evolution of the values measured in different parts of the leaves. The results of the statistical calculations are summarized in the Supplementary Materials, Table S2. The location furthest from the tip (E) gave relatively low values for both taxa, but on most of the measurement dates the measurement sit nearest the leaf tip (A) for N. poeticus showed a similar trend.
Considering the green growing season as a whole, the highest values for ‘Dutch Master’ cultivar were found in leaf parts B and C (65–100 mm from the leaf tip), and these were the leaf parts where the values started to decrease the latest. The earliest was the point nearest the leaf tip (A), where the values started to decrease (after day 56). In the case of N. poeticus, similar values to B and C were obtained at the point 135 mm from the leaf tip at several measurement times. During the flowering period, a decreasing trend was found for this taxon in most of the sampling sites. It was also observed that from day 70 onwards, the values at the measurement site closest to the leaf tip (A) were significantly lower than at the other sites.

3.3. Fresh and Dry Weight of Plant Organs

3.3.1. Fresh Weight of the Leaves and Scape

At the beginning of forcing, the average leaf (foliage) weight of ‘Dutch Master’ cultivar plants was 2.18 g, while that of N. poeticus plants was 2.93 g. From the sampling dates, ‘Dutch Master’ cultivar reached a maximum in fresh leaf weight four weeks after flowering. The other taxon reached its maximum four weeks after start of forcing (before flowering) and the value was almost the same during the flowering period. Four weeks after flowering, the average value was only 73% of the previously mentioned maximum (16.83 g four weeks after the start of forcing, 12.32 g four weeks after flowering) (Figure 7).
Considering the maxima of the two taxa, ‘Dutch Master’ plants had significantly higher leaf weight, while when comparing them at flowering time, the leaf weight of later flowering N. poeticus was larger.
In terms of scape weight, ‘Dutch Master’ plants had a value similar to flowering four weeks after flowering. In the case of N. poeticus, 4 weeks after flowering, the scape weight was significantly lower than at flowering (it decreased from 7.42 g to 2.31, which means a decrease of almost 70%). The scape weight of ‘Dutch Master’ plants at flowering was significantly higher than that of N. poeticus.

3.3.2. Dry Mass of the Plant Parts

On every sampling date, the total root weight of the ‘Dutch Master’ plants was significantly higher than that of N. poeticus (Table 1). The ‘Dutch Master’ plants had the higher value at the start of forcing, and continuously decreased after that. In the case of N. poeticus, the root weight increased from the start of forcing to the flowering phase, while 4 weeks after flowering, the values were significantly lower.
The bulb weight of the ‘Dutch Master’ plants was significantly higher than the N. poeticus bulbs, which was also recorded at planting time (the N. poeticus bulbs are smaller than the N. pseudonarcissus bulbs). It was characteristic of both taxa that the bulb weight was the highest at the beginning of forcing and at lifting, with very similar values by cultivar at the two time points (‘Dutch Master’: 8.81 g and 8.57 g; N. poeticus: 4.62 g and 4.55 g). For ‘Dutch Master’, the values were almost the same for the two intermediate samples, 64–66% of the initial and final values.
By comparing the average dry weight of the bulbs at planting (‘Dutch Master’: 12.00; N. poeticus: 7.05 g, respectively) and the values obtained in the forcing period, it can be said that the highest values measured were below average at planting, 65.5% for N. poeticus and 73.45% for ‘Dutch Master’. In terms of plant total dry weight, both taxa reached their maximum at the time of lifting (‘Dutch Master’: 10.38 g, N. poeticus: 6.26 g), which is also lower than the weight measured at planting (86.5 and 88.8% of the total weight for ‘Dutch Master’ and N. poeticus taxa, respectively). Considering that all plants were individually measured during the experiment (both their initial and sampling time weights are known exactly), it can be said that the decreasing trend was observed for all plants. This is similar to the results of Jouzi and Shekafandeh in a pot experiment, who reported a 35% decrease for the ‘Dutch Master’ cultivar [45].
At the beginning of forcing, the dry leaf weight of ‘Dutch Master’ and N. poeticus plants was 0.28 g and 0.39 g, respectively. For ‘Dutch Master’, the highest value was measured 4 weeks after flowering (1.684 g per plant). Based on the data of the sampling days, the weight of N. poeticus leaves reached the maximum for flowering (1.56 g), but its value was almost the same (1.52 g) two weeks before. By 4 weeks after flowering, leaf weight was already lower than at flowering, but not significantly. At lifting, the two taxa were characterized by similar values: ‘Dutch Master’: 1.00 g, N. poeticus: 0.96 g per plant.
The scape weight of ‘Dutch Master’ plants showed a maximum 4 weeks after flowering (0.81 g per plant), significantly higher than at flowering (0.73 g per plant). For the other taxon, four weeks after flowering, the scape weights were significantly lower than when flowering. Similar to the leaves, at lifting, the scape weight of both taxa were characterized by similar values (0.34–0.35 g per plant).
The flower dry weights (in full opening) of the two cultivars differed significantly (‘Dutch Master’: 0.338 g, N. poeticus: 0.147 g). Flower the heads (without a scape) were removed immediately after flowering so that any fruit development would not affect onion growth.
In the case of N. poeticus, where more sampling was performed, the change in weight of both roots, onions, and leaves can be described by a quadratic equation, with a maximum (roots, leaves) or a minimum (bulb) around flowering time (Figure 8). We also experienced the post-flowering bulb growth described by Rees [31], but the growth rate of 0.23–0.53 g plant−1 day−1 measured by him in field conditions was not approached by our values in shoots (the highest value was 0.10 g plant−1 day−1 in dry weight in the last stage before lifting of ‘Dutch Master’ plants, which was 0.06 g per day in fresh weight, counting on changes in dry matter content).

3.4. Leaf and Scape Length

The leaf growth curve for the two taxa was approximately the same (Figure 9). In the case of ‘Dutch Master’ (flowering at the beginning of the growing season), at the time of flowering, the scapes were longer than the leaves. After flowering, the leaves still grew to 185% of their length at that time (from 0.33 to 0.61 m). Flowering of N. poeticus was later during the growing season, when the leaves had already reached their adult size. From the two taxa, the final leaf length was larger for ‘Dutch Master’, but the difference between the two taxa was only 0.02 m (‘Dutch Master’: 0.61 m, N. poeticus: 0.59 m).
It took about 20 days from the appearance of the scapes for both taxa to the opening of flowers. At flowering, the average scape length was around 0.4 m in both cases, which meets the requirements of the cut-flower market. After flowering, scapes continued to grow, up to 0.51 m in the N. poeticus and 0.57 m in the ‘Dutch Master’.
Miller [27] found that flowers that bloom earlier in the stand have shorter stem lengths than those that bloom later. In his experiments with the DM-like cultivar ‘Primeur’, the control (untreated) plants had a stem length of 44.0–46.5 cm and a leaf length of 39.5–41.3 cm at the end of flowering. These values are approximately the same as those measured by us.
Regarding the possible effect of white light used in our growing chamber on flower and leaf length, it is worth mentioning the results of Wozny et al., who found that stem length, leaf length and scape weight could be altered by light color, with different degrees of variation between cultivars. In their experiments, white light resulted in medium stem length compared to other lights, but there was one cultivar (‘Johann Strauss’) that had significantly longer leaves and scape lengths than most other light colors [30].
It is not the purpose of this paper to detail field growing results, but it should be noted that bulbs from the experimental material were planted in the field in the same year (marked by late and slow warming) and at flowering: the stem length of N. poeticus plants was 23.53 ± 3.38 cm and leaf length 24.91 ± 1.21 cm. It can therefore be said that w also observed the significant increase in flower and leaf length described by others in forcing [1,5,28].

4. Conclusions

The main flowering date was on the 18th day for ‘Dutch Master’ and on the 46th day for N. poeticus. Although the flowering dates of the two taxa differed considerably from the time of sprouting, the curves of the physiological and growth parameters studied for the growing season were very similar for the two taxa. This also implies that plants in the same state of morphological development (e.g., at flowering) had physiological processes at different stages of their seasonal cycle. This is striking, for example, when examining the photosynthetic rate and the stomatal conductance curve, as well as the relative chlorophyll content, which shows that the annual cycle parameters describing the bell-roll of the ‘Dutch Master’ cultivar showed an upward trend during and after flowering. In contrast, for N. poeticus, flowering was already in the declining phase of these parameters and leaf growth was also complete by this time.
Bulb weight increased after flowering in N. poeticus, while in the case of the ‘Dutch Master’, the values were practically stagnant
This also implies, from the agrotechnical point of view, that the practice of removing plants from the greenhouse after flowering has less impact on the production of the following years than doing the same for early flowering ‘Dutch master’ cultivar. In the open field, if leaves are also removed during or after, although not beneficial for N. poeticus, the plants are already in a better condition to prepare for the following year.
The final bulb mass at harvest did not reach the initial mass for any of the species, which shows the need for at least one year of resting for reuse.
From a measurement methodological point of view to study the beginning of plant retreat, it is useful to take measurements at several points on the leaves for the parameters that are measured quickly (chlorophyll fluorescence, relative chlorophyll content) or to choose the one location for the repeated measurements. Differences in sampling can lead to the significant differences of results.

Supplementary Materials

The following are available online at https://www.mdpi.com/article/10.3390/horticulturae7120585/s1: Table S1. Changes in the ration of variable and minimal fluorescence (Fv/F0) during the growing season in different parts of the leaves (with mean ± standard error); Table S2. Change of relative chlorophyll content (CCI) during the growing season in different parts of the leaves (with mean ± standard error).

Author Contributions

Conceptualization, K.J.S. and A.J.; data curation, K.J.S., A.J. and O.S.; formal analysis, K.J.S. and M.V.; funding acquisition, K.J.S., A.J. and J.U.; investigation, K.J.S., A.J. and O.S.; methodology, K.J.S., A.J. and R.P.; project administration, K.J.S. and J.U.; resources, K.J.S., A.J. and R.P.; supervision, R.P. and J.U.; validation, R.P.; visualization, K.J.S., A.J. and M.V.; writing—original draft, K.J.S.; writing—review and editing, K.J.S. and R.P. All authors have read and agreed to the published version of the manuscript.

Funding

Experiments were done on infrastructure supported by project OP VVV CZ.02.1.01/0.0/0.0/16_017/0002334. Research infrastructure for young scientists, financed from structural funds of EU and Ministry of education of the Czech Republic. This paper was supported by project of Internal Grant Agency of Faculty of Horticulture, Mendel University in Brno IGA—ZF/2021–SI2006.

Institutional Review Board Statement

Not applicable.

Informed Consent Statement

Not applicable.

Data Availability Statement

The data presented in this study are available on request from the corresponding author.

Conflicts of Interest

The authors declare no conflict of interest.

References

  1. Dole, J.M.; Wilkins, H.F. Floriculture. Principles and Species, 2nd ed.; Pearson/Prentice Hall: Upper Saddle River, NJ, USA, 2005; pp. 688–696. ISBN 0-13-046250-0. [Google Scholar]
  2. Tarakemeh, A.; Azizi, M.; Rowshan, V.; Salehi, H.; Spina, R.; Dupire, F.; Arouie, H.; Laurain-Mattar, D. Screening of Amaryllidaceae alkaloids in bulbs and tissue cultures of Narcissus papyraceus and four varieties of N. tazetta. J. Pharm. Biomed. Anal. 2019, 172, 230–237. [Google Scholar] [CrossRef] [PubMed]
  3. Breiterová, K.; Koutová, D.; Maříková, J.; Havelek, R.; Kuneš, J.; Majorošová, M.; Opletal, L.; Hošťálková, A.; Jenčo, J.; Řezáčová, M.; et al. Amaryllidaceae alkaloids of different structural types from Narcissus L. cv. Professor Einstein and their cytotoxic activity. Plants 2020, 9, 137. [Google Scholar] [CrossRef] [PubMed] [Green Version]
  4. Okudo, H.; Sochacki, D. Botanical and horticultural aspects of major ornamental geophytes. In Ornamental Geophytes; Kamenetsky, R., Okubo, H., Eds.; CRC Press: Boca Raton, FL, USA, 2013; pp. 77–122. ISBN 978-1-4398-4924-8. [Google Scholar]
  5. Hanks, G.R. Commercial production of Narcissus bulbs. In Narcissus and Daffodil. The Genus Narcissus; Hanks, G.R., Ed.; Taylor & Francis: London, UK, 2002; pp. 54–130. ISBN 0-415-27344-7. [Google Scholar]
  6. Gul, F.; Shahri, W.; Tahir, I. Morphological and some biochemical aspects of flower development and senescence in Narcissus poeticus cv. Pheasant’s Eye. Int. J. Adv. Res. Sci. Eng. Technol. 2018, 7, 1745–1752. [Google Scholar]
  7. Le Nard, M.; De Hertogh, A.A. Bulb growth and development of flowering. In The Physiology of Flower Bulbs; De Hertogh, A.A., Le Nard, M., Eds.; Elsevier: Amsterdam, The Netherlands, 1993; pp. 29–43. ISBN 0-444-87498-4. [Google Scholar]
  8. Hanks, G.R. Narcissus. In The Physiology of Flower Bulbs; De Hertogh, A.A., Le Nard, M., Eds.; Elsevier: Amsterdam, The Netherlands, 1993; pp. 462–558. ISBN 0-444-87498-4. [Google Scholar]
  9. Kudo, G.; Ida, T.I.; Tani, T. Linkages between phenology, pollination, photosynthesis, and reproduction in deciduous forest understory plants. Ecology 2008, 2, 321–331. [Google Scholar] [CrossRef] [PubMed]
  10. Veatch-Blohm, M.E.; Chen, D.; Hassett, M. Narcissus Cultivar differences in response to saline irrigation when application began either pre- or postemergence. HortScience 2013, 3, 8. [Google Scholar] [CrossRef] [Green Version]
  11. Veatch-Blohm, M.E.; Sawch, D.; Elia, N.; Pinciotti, D. Salinity tolerance of three commonly planted Narcissus cultivars. HortScience 2014, 9, 7. [Google Scholar] [CrossRef] [Green Version]
  12. Veatch-Blohm, M.E.; Roche, B.M.; Sweeney, T. The effect of bulb weight on salinity tolerance of three common Narcissus cultivars. Sci. Hortic. 2019, 248, 62–69. [Google Scholar] [CrossRef]
  13. Peng, C.; Xiaohong, M.; Qiang, S.; Junjie, G.; Yimin, S. Photosynthetic characteristics of two new cultivars of Narcissus. J. Shanghai Jiaotong Univ. Agric. Sci. 2013, 1, 28–33. [Google Scholar]
  14. Yantao, W.; Xiaohong, M.; Yimin, S. Biological characters and photosynthesis characteristics of Holland Narcissus. J. Shanghai Jiaotong Univ. Agric. Sci. 2009, 6, 619–623. [Google Scholar]
  15. Bacon, M.A. Water use efficiency in plant biology. In Water Use Efficiency in Plant Biology; Bacon, M.A., Ed.; Blackwell Publishing: Oxford, UK, 2004; pp. 1–26. ISBN 1-4051-1434-7. [Google Scholar]
  16. Jones, H. What is water use efficiency? In Water Use Efficiency in Plant Biology; Bacon, M.A., Ed.; Blackwell Publishing: Oxford, UK, 2004; pp. 27–41. ISBN 1-4051-1434-7. [Google Scholar]
  17. Baker, N.R. Chlorophyll fluorescence: A probe of photosynthesis in vivo. Annu. Rev. Plant Biol. 2008, 59, 89–113. [Google Scholar] [CrossRef] [PubMed] [Green Version]
  18. Lazár, D. Parameters of photosynthetic energy partitioning. J. Plant Physiol. 2015, 175, 131–147. [Google Scholar] [CrossRef] [PubMed]
  19. Sestak, Z.; Shiffel, P. Leaf-age related differences in chlorophyll fluorescence (Review). Photosynthetica 1998, 3–4, 347–369. [Google Scholar]
  20. Prietro, P.; Penuleas, J.; Lluisa, J.; Adensio, A.; Estiarte, M. Effects of long-term experimental night-time warming and drought on photosynthesis, Fv/Fm and stomatal conductance in the dominant species of a Mediterranean shrubland. Acta Physiol. Plant. 2009, 31, 729–739. [Google Scholar] [CrossRef]
  21. Sharma, D.K.; Andersen, S.B.; Ottosen, C.; Rosenquist, E. Wheat cultivars selected for high Fv/Fm under heat stress maintain high photosynthesis, total chlorophyll, stomatal conductance, transpiration and dry matter. Physiol. Plant. 2015, 153, 284–298. [Google Scholar] [CrossRef] [PubMed]
  22. Doğru, A.; Çakirlar, H. Effects of leaf age on chlorophyll fluorescence and antioxidant enzymes activity in winter rapeseed leaves under cold acclimation conditions. Braz. J. Bot. 2020, 43, 11–20. [Google Scholar] [CrossRef]
  23. Haadi-e-vincheh, M.; Naderi, D.; Golparvar, A. Growth and physiological characteristics of Narcissus pseudonarcissus at different nitrogen levels. Int. J. Farming Allied Sci. 2013, 2, 1325–1329. [Google Scholar]
  24. Padilla, F.M.; de Souza, R.; Peña-Fleitas, M.T.; Gallardo, M.; Giménez, C.; Thompson, R.B. Different responses of various chlorophyll meters to increasing nitrogen supply in sweet pepper. Front. Plant Sci. 2018, 9, 1752. [Google Scholar] [CrossRef] [PubMed] [Green Version]
  25. Demír, S.; Çelikel, F.G. The effects of ethephon foliar spray on plant height of Narcissus cv. ‘Ice Follies’. Anadolu J. Agr. Sci. 2018, 33, 184–190. [Google Scholar]
  26. Miller, W.B. Production chain, forcing physiology, and flower production systems. In Ornamental Geophytes; Kamenetsky, R., Okubo, H., Eds.; CRC Press: Boca Raton, FL, USA, 2013; pp. 287–332. ISBN 978-1-4398-4924-8. [Google Scholar]
  27. Miller, W.B.; Olberg, M.W. Novel ethephon application methods for Narcissus. HortScience 2016, 10, 1245–1250. [Google Scholar] [CrossRef] [Green Version]
  28. Çelikel, F.G.; Demir, S. Effects of ethephon spray on plant quality and growth parameters of potted Narcissus tazetta. Acta Hortic. 2019, 1263, 439–448. [Google Scholar] [CrossRef]
  29. Cohen, D.; Sandler Ziv, D.; Fintea, C.; Ion, A.; Forer, I.; Rabinowitch, H.D.; Kamenetsky, R. New varieties of paperwhite Narcissus: Florogenesis and forcing requirements. Isr. J. Plant Sci. 2009, 4, 335–345. [Google Scholar] [CrossRef]
  30. Woźny, A.; Jerzy, M. Effect of light wavelength on growth and flowering of narcissi forced under short-day and low quantum irradiance conditions. J. Hortic. Sci. Biotechnol. 2007, 6, 924–928. [Google Scholar] [CrossRef]
  31. Rees, A.R. The Growth of Bulbs: Applied Aspects of the Physiology of Ornamental Bulbous Crop Plant, 1st ed.; Academic Press Inc.: London, UK, 1972; pp. 45–113. [Google Scholar]
  32. Slezák, K.A.; Mazur, J.; Jezdinský, A.; Kapczyńska, A. Bulb size interacts with lifting term in determining the quality of Narcissus poeticus L. propagation material. Agronomy 2020, 10, 975. [Google Scholar] [CrossRef]
  33. Addai, I.K. Influence of cultivar or nutrients application on growth, flower production and bulb yield of the common hyacinth. Am. J. Sci. Ind. Res. 2011, 2, 229–245. [Google Scholar] [CrossRef]
  34. Singh, S.K.; Reddy, K.R. Regulation of photosynthesis, fluorescence, stomatal conductance and water-use efficiency of cowpea (Vigna unguiculata [L.] Walp.) under drought. J. Photochem. Photobiol. B Biol. 2011, 1, 40–50. [Google Scholar] [CrossRef] [PubMed]
  35. Daymond, A.J.; Tricker, P.J.; Hadley, P. Genotypic variation in photosynthesis in cacao is correlated with stomatal conductance and leaf nitrogen. Biol. Plant. 2011, 1, 99–104. [Google Scholar] [CrossRef]
  36. Linderson, M.L.; Mikkelsen, T.N.; Ibrom, A.; Lindroth, A.; Ro-Poulsen, H.; Pilegaard, K. Up-scaling of water use efficiency from leaf to canopy as based on leaf gas exchange relationships and the modeled in-canopy light distribution. Agric. For. Meteorol. 2012, 152, 201–211. [Google Scholar] [CrossRef]
  37. Tomás, M.; Medrano, H.; Pou, A.; Escalona, J.M.; Martorell, S.; Ribas-Carbó, M.; Flexas, J. Water-use efficiency in grapevine cultivars grown under controlled conditions: Effects of water stress at the leaf and whole-plant level. Aust. J. Grape Wine Res. 2012, 2, 164–172. [Google Scholar] [CrossRef]
  38. Medrano, H.; Tomás, M.; Martorell, S.; Flexas, J.; Hernández, E.; Rosselló, J.; Pou, A.; Escalona, J.M.; Bota, J. From leaf to whole-plant water use efficiency (WUE) in complex canopies: Limitations of leaf WUE as a selection target. Crop. J. 2015, 3, 220–228. [Google Scholar] [CrossRef] [Green Version]
  39. Vidal, P.; Marinangeli, P.; Medrano, H.; Gulías, J. Water-use efficiency and growth capacity of two Amaryllidaceae species under three different water regimes. Acta Hortic. 2013, 1000, 223–227. [Google Scholar] [CrossRef] [Green Version]
  40. Liu, K.; Tang, C.F.; Zhou, S.B.; Wang, Y.P.; Zhang, D.; Wu, G.W.; Chang, L.L. Comparison of the photosynthetic characteristics of four Lycoris species with leaf appearing in autumn under field conditions. Photosynthetica 2012, 50, 570–576. [Google Scholar] [CrossRef] [PubMed]
  41. Quanchao, L.; Yang, L.; Yaoyu, X.; Ling, L.; Shaobing, H.; Xiaojing, C. Responses of physiological property and chlorophyll fluorescence characteristics of narcissus to salt stress. J. Fujian Agric. For. Univ. (Nat. Sci. Ed.) 2019, 2, 161–167. [Google Scholar]
  42. Mauromicale, G.; Ierna, A.; Marchese, M. Chlorophyll fluorescence and chlorophyll content in field-grown potato as affected by nitrogen supply, genotype, and plant age. Photosynthetica 2006, 1, 76–82. [Google Scholar] [CrossRef]
  43. Xu, Z.Z.; Zhou, G.S.; Wang, Y.L.; Han, G.X.; Li, Y.J. Changes in chlorophyll fluorescence in maize plants with imposed rapid dehydration at different leaf ages. J. Plant Growth. Regul. 2008, 27, 83–92. [Google Scholar] [CrossRef]
  44. Campbell, P.K.E.; Huemmrich, K.F.; Middleton, E.M.; Ward, L.A.; Julitta, T.; Daughtry, C.S.T.; Burkart, A.; Russ, A.L.; Kustas, W.P. Diurnal and seasonal variations in chlorophyll fluorescence associated with photosynthesis at leaf and canopy scales. Remote Sens. 2019, 11, 488. [Google Scholar] [CrossRef] [Green Version]
  45. Jouzi, H.; Shekafandeh, A. Effect of pre-planting bulbs treatment with soaking in NPK solution on growth and flowering of Narcissus pseudonarcissus cv. Dutch Master. Adv. Environ. Biol. 2011, 8, 2430–2433. [Google Scholar]
Figure 1. Changes in the photosynthetic rate (A), transpiration rate (E), stomatal conductance (gs) and photosynthetic water use efficiency (WUE) in the growing season.
Horticulturae 07 00585 g001
Figure 2. Changes in the chlorophyll fluorescence parameters during the growing season.
Horticulturae 07 00585 g002
Figure 3. Curves of the chlorophyll fluorescence basic parameters (F0, Fm, Fv) at different parts of the leaves A = 30 mm, B = 65 mm, C = 100 mm, D = 135 mm, E = 170 mm from the tip.
Horticulturae 07 00585 g003
Figure 4. Curves of the chlorophyll fluorescence rations (Fm/F0, Fv/F0, Fv/Fm) at different parts of the leaves A = 30 mm, B = 65 mm, C = 100 mm, D = 135 mm, E = 170 mm from the tip.
Horticulturae 07 00585 g004aHorticulturae 07 00585 g004b
Figure 5. Change of relative chlorophyll content in the growing season.
Horticulturae 07 00585 g005
Figure 6. Curves of the relative chlorophyll content at different parts of the leaves A = 30 mm, B = 65 mm, C = 100 mm, D = 135 mm, E = 170 mm from the tip.
Horticulturae 07 00585 g006
Figure 7. Fresh weight of the leaves and scapes.
Horticulturae 07 00585 g007
Figure 8. Growth curve of different plant parts in the forcing of N. poeticus (equation and fit accuracy: root system: y = −4E−05x2 + 0.0025x + 0.5090, R2 = 0.8825; bulb: y = 0.0008x2 − 0.0750x + 4.6492, R2 = 0.9584; leaves: y = −0.0004x2 + 0.0475x + 0.3703, R2 = 0.9634) Legend: root system: blue, leaves: green, bulb: orange marks and trend lines.
Horticulturae 07 00585 g008
Figure 9. Changes of leaf and scape length during the growing season.
Horticulturae 07 00585 g009
Table 1. Change of dry weight [g] of the main plant parts during the growing season (with mean ± standard error).
SamplingDASF *Root WeightBulb WeightLeaf WeightScape WeightFresh Weight
N. pseudonarcissus ‘Dutch Master’
Start of forcing (SF)30.758 ± 0.028aA8.814 ± 0.412aA0.277 ± 0.021dB0.160 ± 0.007d
Flowering(F)180.620 ± 0.028bA5.607 ± 0.152bA1.259 ± 0.052bB0.727 ± 0.027bA0.338 ± 0.007A
F + 4 weeks500.573 ± 0.049bA5.698 ± 0.215bA1.684 ± 0.058aA0.805 ± 0.027aA
Lifting980.457 ± 0.034cA8.571 ± 0.320aA1.004 ± 0.072cA0.346 ± 0.034cA
N. poeticus
Start of forcing (SF)20.517 ± 0.032aB4.621 ± 0.217aB0.393 ± 0.021dA
SF + 2 weeks160.526 ± 0.047a3.595 ± 0.168b1.058 ± 0.053b
SF + 4 weeks290.545 ± 0.039a2.940 ± 0.149c1.518 ± 0.122a0.038 ± 0.007d
Flowering(F)460.575 ± 0.034aB2.848 ± 0.128cB1.563 ± 0.078aA0.464 ± 0.022aB0.147 ± 0.004B
F + 4 weeks740.454 ± 0.019bB3.580 ± 0.126bB1.454 ± 0.063aB0.272 ± 0.017cB
Lifting970.405 ± 0.026cA4.553 ± 0.222aB0.962 ± 0.077cA0.339 ± 0.041bA
* DASF = days after start of forcing next to the mean and standard deviation, the different letters represent the difference between the sampling phenological phase or the taxon at the p < 0.05 level. different lower-case letters: significant difference between the samplings of taxon; different capital letters: significant difference between the two taxa on the same phenological stage.
Publisher’s Note: MDPI stays neutral with regard to jurisdictional claims in published maps and institutional affiliations.

