Article

QTL Analysis of the Content of Some Bioactive Compounds in Brassica rapa L. Grown under Light Culture Conditions

by
Ksenia V. Egorova
1,*,
Nadezhda G. Sinyavina
1,
Anna M. Artemyeva
1,2,*,
Natalia V. Kocherina
1 and
Yuriy V. Chesnokov
1
1
Agrophysical Research Institute, 195220 St. Petersburg, Russia
2
Federal Research Center N.I. Vavilov All-Russian Institute of Plant Genetic Resources, 190000 St. Petersburg, Russia
*
Authors to whom correspondence should be addressed.
Horticulturae 2021, 7(12), 583; https://doi.org/10.3390/horticulturae7120583
Submission received: 26 November 2021 / Revised: 10 December 2021 / Accepted: 13 December 2021 / Published: 16 December 2021
(This article belongs to the Special Issue Advances in Brassica Crops Genomics and Breeding)

Abstract

:
The article presents the results of biochemical and QTL (Quantitative Trait Loci) analysis of dry matter content, nutrient and biologically active compounds: sugars, ascorbic acid, chlorophylls a and b, anthocyanins and carotenoids in populations of doubled haploid lines of leaf, root crops, and oilseeds of the Brassica rapa L. species grown in optimal light culture conditions, but with different photoperiod durations. The purpose of this study was to evaluate the effect of the photoperiod on the transition to bolting and the accumulation of biologically active substances, as well as how the localization and identification of chromosomal loci determined the content of certain phytochemicals. The influence of the length of daylight hours on the content of components of the biochemical composition was assessed. It was shown that growing under conditions of a 16 h photoperiod increased the content of dry matter, sugars, vitamin C, and anthocyanins. On the contrary, the content of photosynthetic pigments was higher under the conditions of a 12 h photoperiod. Valuable lines that can be sources of biologically active compounds were revealed. Based on the results of the obtained data, 102 QTLs were mapped, which determine the manifestation of the studied biochemical quality traits in the B. rapa doubled haploid lines under conditions of short and long daylight hours. Molecular markers genetically linked to the selected QTLs were determined. It was revealed that the identified loci controlling all the studied biochemical traits were mainly in the fifth, sixth, seventh, and ninth linkage groups, which correlated with the data obtained in the field and greenhouse. Most of the identified loci controlled several studied traits simultaneously. The identified QTLs and identified molecular markers are of interest for further study of the genetic control of the economically valuable traits determined by them and for the implementation of marker-assisted selection in B. rapa. The data obtained can be used in genetic and breeding work, including for the obtaining of new genotypes, lines and cultivars with a valuable biochemical composition, adapted for cultivation under specific photoperiodic conditions.

1. Introduction

The multifaceted family Brassicaceae Burnet. includes a large number of economically valuable agricultural crops that are widespread throughout the world: varieties of B. oleracea L. (white cabbage, broccoli, cauliflower and others), crops of B. rapa L. (turnip, Chinese cabbage and pakchoi, oilseed rape), vegetable and oilseed varieties of Indian mustard (B. juncea Czern.), oilseed and leaf rape and swede (B. napus L.), spicy crops (horseradish Armoracea rusticana G. Gaertn., wasabi Eutrema japonicum Miq.), black mustard (B. nigra L.) and others [1,2,3]. Over the past decades, there has been an increasing consumer demand for foods rich in nutrients and biologically active substances that have a beneficial effect on human health. Plants of the Brassicaceae family are sources of vital natural biologically active substances—enzymes, pigments, vitamins, as well as specific secondary metabolites, which exhibit anticarcinogenic, cardioprotective, antioxidant and anti-inflammatory effects, and stimulate the immune system [4,5,6].
An important representative of the Brassica L. genus, the Brassica rapa L. species, is distinguished by a high botanical and agrobiological diversity, including a source of valuable nutrients and secondary metabolites, which makes it a unique model object for genetic and molecular studies of various economically valuable traits [1,7,8,9]. It should be noted that understanding the mechanisms of genetic control of economically valuable traits is necessary to increase the efficiency and accuracy of traditional breeding [10,11]. At the same time, one of the priority tasks of modern breeding is selection for the required content of biologically active compounds [12].
Most of the significant breeding traits refer to quantitative traits, the manifestation of which is largely influenced by environmental factors. To study quantitative traits in plants, including brassica plants, it is promising to use mapping populations of double haploids (DH)—a set of genetically fixed informative recombinant lines, all loci of which are in a homozygous state [13]. Currently, information on the genetic determinants that are responsible for the manifestation of economically valuable biochemical traits of quality and their inheritance in B. rapa is not sufficiently studied [14]. However, molecular genetic mapping represents a powerful method to use for this aim, being able to determine the relative positions of DNA markers on linkage groups [15]. The method of molecular genetic mapping allows to determine the relative positions of DNA markers on linkage groups. Mapping of chromosomal loci is carried out through the identification for relationships of molecular markers with traits and describes parallel genotypic and phenotypic variability in mapping populations. Methodologically, identification and mapping are carried out using QTL mapping using specially created two-parent segregating populations [16,17].
There are published data on previous studies devoted to the analysis of the main biochemical traits of quality in B. rapa. Artemyeva et al. [5] presented the results of QTL analysis of five biochemical quality traits (total protein, ascorbic acid, β-carotene, chlorophylls a and b) using two mapping populations of Brassica rapa double haploid lines. For each studied trait, QTLs, the effects of the identified QTLs, the proportion of phenotypic variability determined by each QTL, and molecular markers genetically linked to the identified QTLs were established. Jan et al. [18] revealed a significant variation in the total seed protein content among different Brassica rapa ecotypes, which is important for improvement and efficient use of crops. Ullah et al. [19] investigated genetic variation, heritability and correlation between various biochemical traits in Brassica rapa advanced lines and revealed significant differences were observed for glucosinolate, oil content, protein content, oleic acid, linolenic acid, etc.
Despite the apparent importance of crops of this species for humans, only limited information has been obtained to date on the genetic nature and inheritance of economically valuable traits of quality in B. rapa. In one study, QTL mapping of glucosinolate accumulation traits, which has an important protective function in plants and determines the nutritional quality of B. rapa, was carried out [20]. In another publication, the QTL search for phytate and phosphate content in seeds and leaves of B. rapa was performed [21]. QTL analysis of metabolites in seedlings made it possible to find the location of QTLs associated with the content of organic acids, amino acids, sugars, glucosinolates, and aromatic compounds [22]. In addition, studies of the genotype–environment interaction of morphological and physiological characteristics were carried out under conditions of normal moisture and drought [23].
The populations of the B. rapa doubled haploid lines DH 30 and DH 38 used in our investigation were previously studied in the field and greenhouse conditions in order to map the chromosome loci responsible for the manifestation of the main morphological and biochemical traits of quality. In total, 140 QTLs were mapped. Molecular markers genetically linked to identified QTLs have been identified [1,2,4,5]. At the same time, no one study was carried out to map the loci of quantitative traits of B. rapa under controlled conditions of light culture. The study of the mechanisms of manifestation of quantitative traits under controlled conditions allows one to reveal the reaction of the genotype to the action of certain environmental factors by modeling specific parameters (temperature, lighting, humidity, etc.) while maintaining the remaining factors in the optimum zone and assessing their influence on the implementation of the studied traits. Investigations of quantitative traits are especially relevant, the degree of manifestation of which significantly depends on the genotype–environment interaction [24,25]. It is known that the photoperiod is one of the most important environmental factors that significantly affect the course of physiological processes in the plant and its transition to the generative stage of development [26,27].
The present paper aim is at identifying the chromosomal loci and the molecular markers which are linked to the content of dry matter and biologically active compounds in B. rapa. To reach this goal, B. rapa mapping populations were grown at long and short light days in regulated conditions of light culture.

2. Materials and Methods

2.1. Mapping Populations of Brassica rapa L. Doubled Haploid Lines

We used the lines of two mapping populations of Brassica rapa L. doubled haploids from the collection of the Federal Research Center All-Russian Institute of Plant Genetic Resources named after N.I. Vavilov (VIR). The mapping populations of DH lines were created in the Plant Breeding laboratory of the University of Wageningen (Netherlands) on the basis of significantly different genotypically and phenotypically accessions, belonging to different botanical subspecies [1,28].
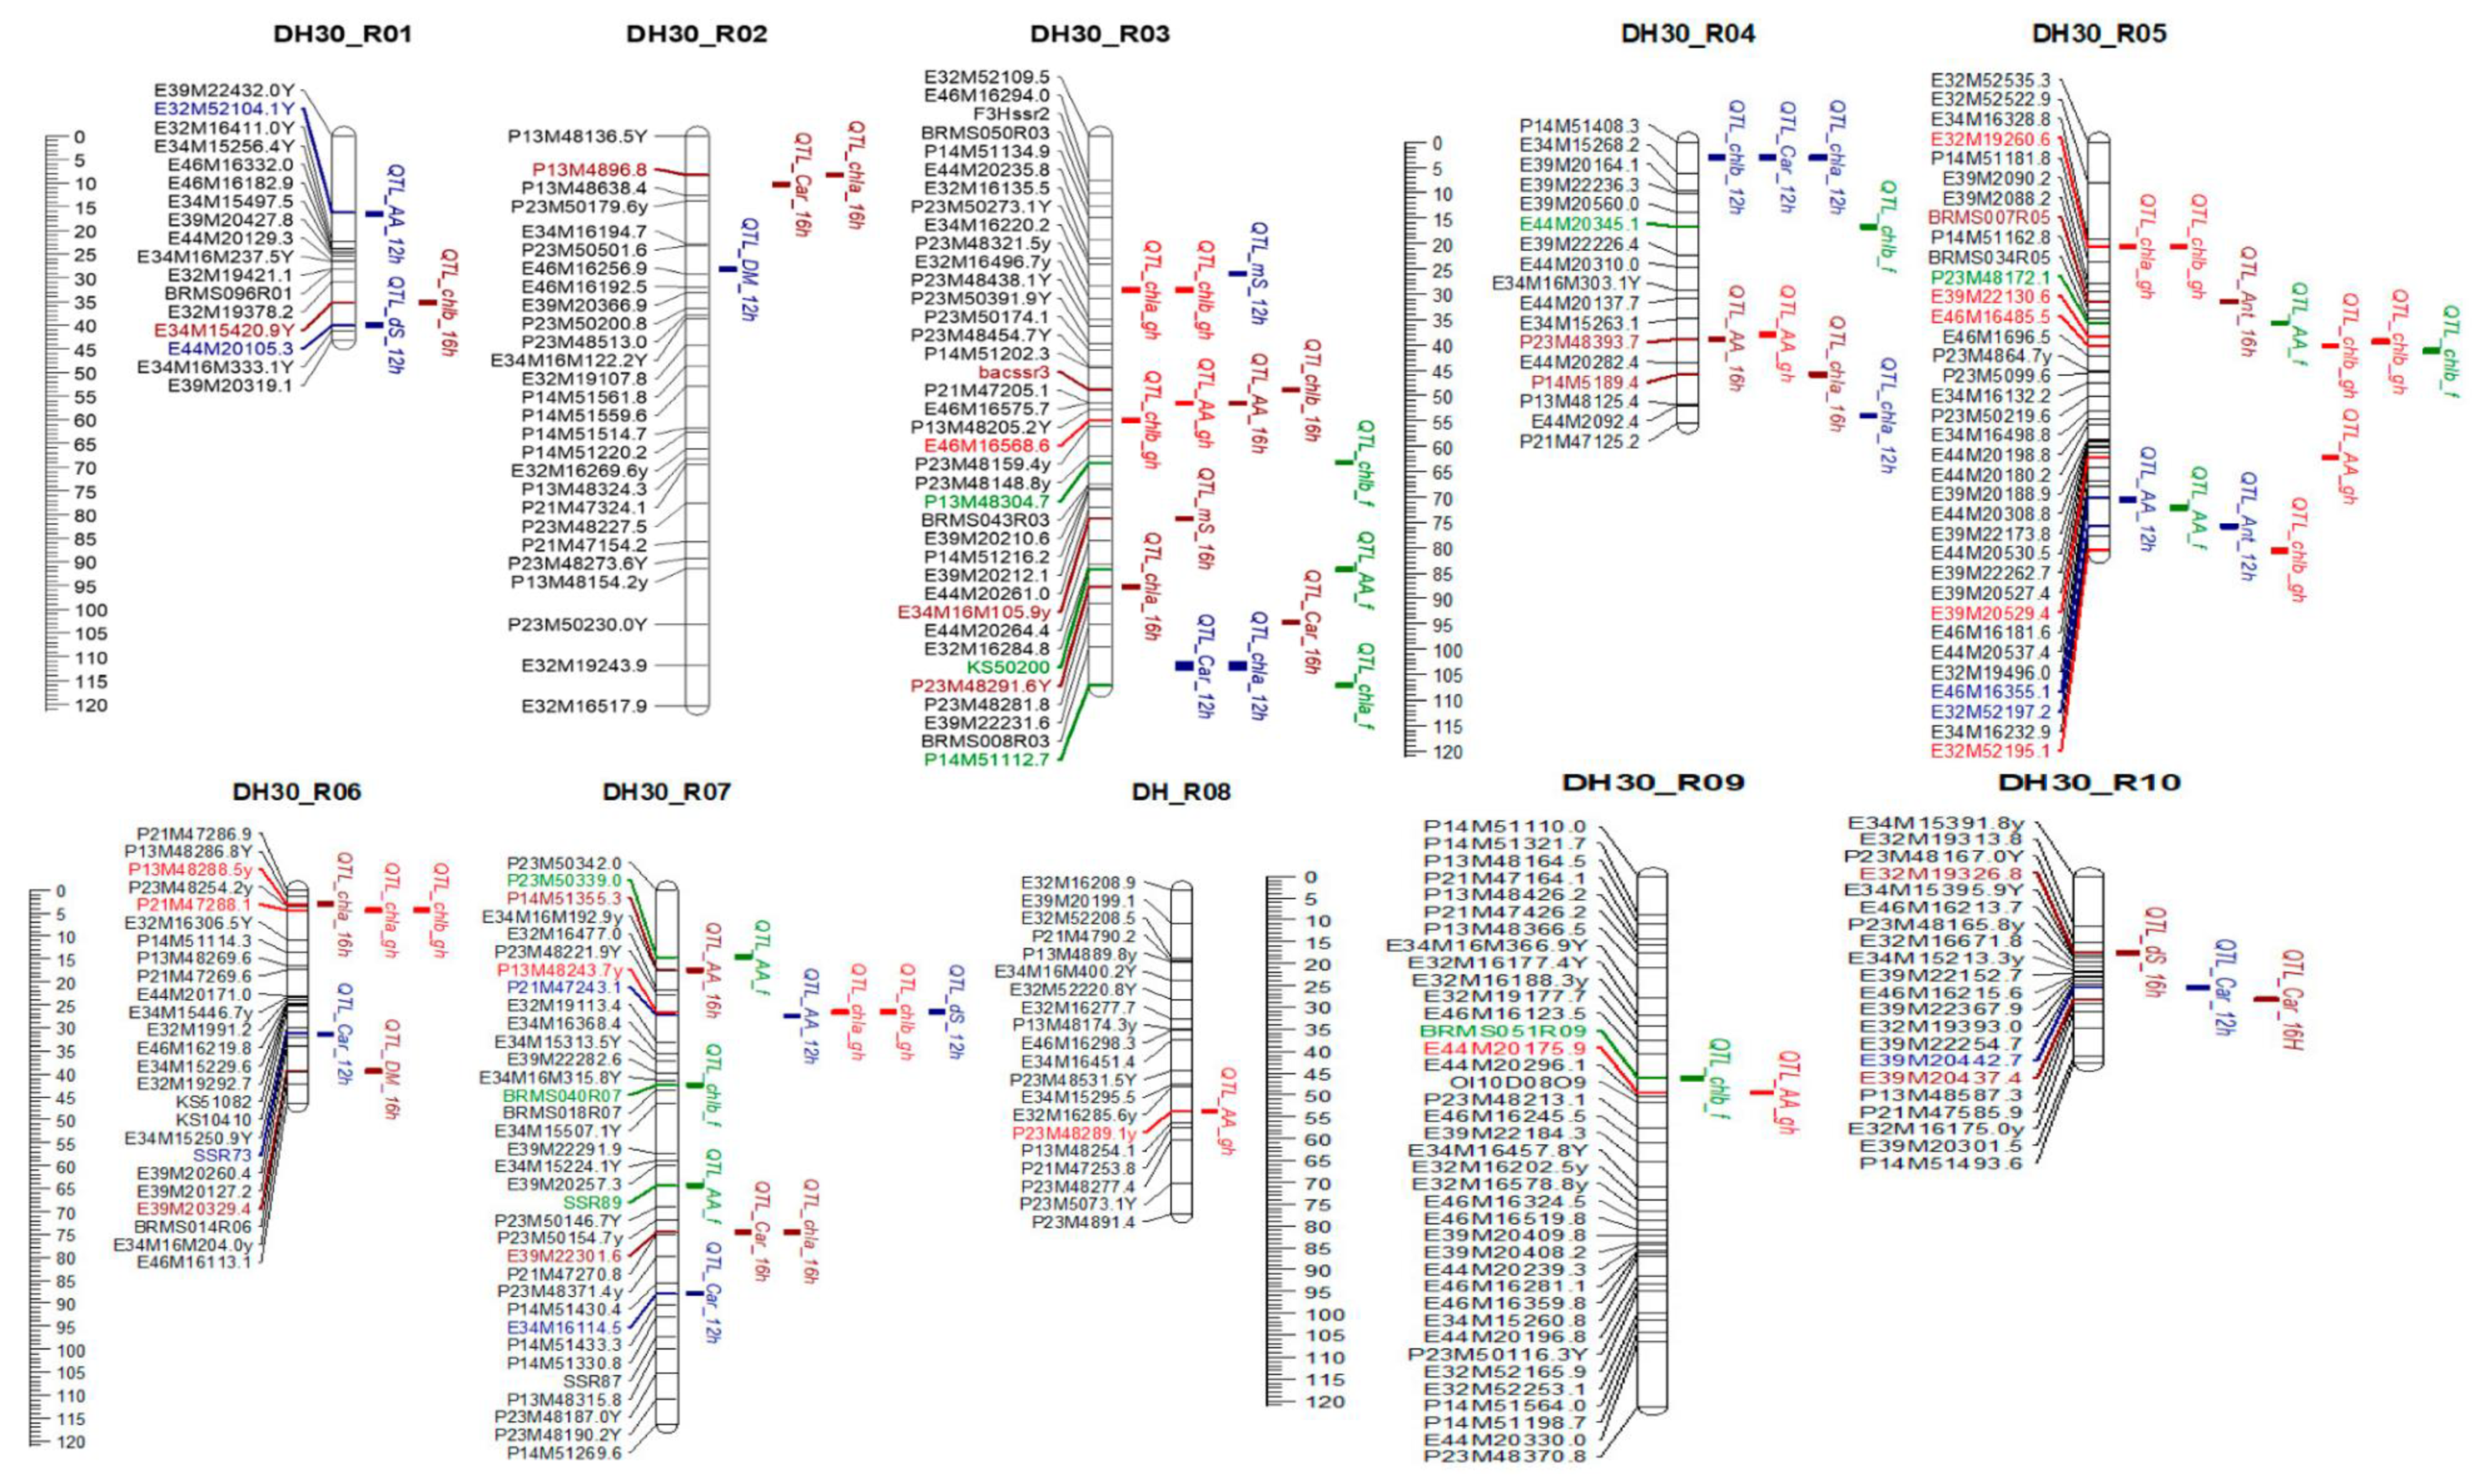
  • Population DH 30—obtained by crossing Japanese root turnip (Kairyou Hakata) and oilseed yellow sarson (YS-143).
  • Population DH 38—is a result of hybridization of pakchoi (Nai Bai Cai) and oilseed yellow sarson (YS-143).
For this study, 68 lines (23 lines DH 30, and 45 lines DH 38), adapted to the conditions of light culture (artificial light and low-volume growing technologies described below), were selected.

2.2. Growing Plants under Controlled Conditions

The relation to the photoperiod is one of the key physiological features of plants. To determine the dependence of the components of the biochemical composition from the photoperiod, the B. rapa mapping populations were grown in the biopolygon of the Agrophysical Research Institute (AFI) under light culture conditions (Figure 1) with modeling of a short and long photoperiod—under 12 h and 16 h illumination, as described earlier [29]. Seeds, previously germinated on filter paper [30], were planted in seedling pots 10 × 9 × 9 cm filled with Agrofit substrate [31] based on high-moor peat (“Pindstrup” LLC, Moscow region, Russia) with the addition of Cambrian clay and chalk; substrate pH 6.0–6.2.
Three replicates and five plants per replicate for each line were used. The plants were grown in the original vegetation light installation. High-pressure sodium lamps (DNaZ-400, “Reflax” LLC, Moscow, Russia) were used as a light source. The plant illumination was 15–20 KLX. The plants were watered daily in the morning: 2 times a week (at the beginning and end of the week) with Knop’s solution, on other days with water. The temperature was maintained at 21 ± 3 °C.

2.3. Biochemical Analyses

Biochemical analyses were carried out in the laboratory of biochemistry of soil–plant systems of the Agrophysical Research Institute. For biochemical analysis, plant material (mature leaves from nine plants) was taken at the stage of the start of bolting. The assessment of the content of the main biochemical substances was carried out according to generally accepted methods.
The dry matter content was determined by the thermostat-weight method by weighing the averaged sample before and after drying in a thermostat at a temperature of 105 °C for 6 h; mono- and disaccharides—according to the Bertrand method [32]; ascorbic acid (vitamin C)—by direct extraction from plants with 1% hydrochloric acid followed by titration with potassium iodate solution (State Standard of Russian Federation 24556-89) [33]. The method for determining the total content of anthocyanins in plant tissue is based on the spectrophotometric determination of the anthocyanin extract in 1% hydrochloric acid solution at a wavelength of 510 nm, in terms of cyanidin-3,5-diglycoside—453 nm [34,35].
Spectrophotometric quantitative determination of chlorophylls a, b and carotenoids was carried out by extraction in acetone and measuring the optical density of the obtained extracts at wavelengths of 662, 644, and 440.5 nm, respectively [36].
The above-described spectrophotometric studies were carried out using a spectrophotometer PE-3000UV (“Promekolab” LLC, St. Petersburg, Russia).
All data are presented in terms of raw material.

2.4. Statistical Processing of the Obtained Results and QTL Analysis

Statistical assessment of the obtained data was carried out by calculating the main descriptive characteristics: minimum, maximum, mean, standard deviation (SD), coefficient of variation (CV). The Tukey HSD (honestly significant difference) post hoc test was used to identify the differences between the means for each characteristic. A p-value <0.05 (error probability 5%) was considered an acceptable limit of statistical significance. Data analysis was performed using the software Microsoft Office Excel 2019 and Statistica v. 13.3 (StatSoft Inc., Tulsa, OK, USA).
QTL analysis, establishing the presence (candidates) of QTLs and their location in linkage groups (mapping interval 5 cM), LOD values (p = 0.05) and the degree of variation of traits (% Expl.), which are explained by the QTL data, for each trait and population, was performed using the MAPQTL 6.0 [37]. The significance of each LOD was established by a permutation test (1000 repetitions) [38]. The correlation coefficient “trait-marker” was calculated for the 95% significance level as a statistically significant linkage of the marker locus with the QTL, which determines the studied trait, based on the empirically obtained variances for each pair of trait-marker [39].
The graphic representation of molecular genetic maps was made on the basis of the obtained data on the mapping of identified QTLs using the MapChart 2.2 software [40].

3. Results and Discussion

The value of brassica crops for their use in functional nutrition is determined by the content of basic nutrients, as well as the presence and amount of biologically active compounds. It is known that species and varietal characteristics, weather conditions, place of cultivation, and phenological phase affect the concentration of phytochemical components [41]. Despite the clearly pronounced importance of B. rapa crops as sources of biologically active substances necessary for healthy human nutrition, to date, only limited information has been obtained on the genetic nature and inheritance of economically valuable traits of quality in this species [42,43].
This work presents the results of biochemical and QTL analysis of the content of some nutrients and biologically active substances using two mapping populations of B. rapa grown in light culture at short (12 h) and long (16 h) daylight hours.

3.1. The Timing of Start of Bolting

Many morphological and biochemical characteristics depend on the age of the plant to the beginning of the visible transition to bolting. A 12 h photoperiod (short daylight hours) is optimal for growing vegetative mass in long-day plants, and 16 daylight hours accelerate the transition to bolting [44]. The parental forms of mapping populations differ with respect to the photoperiod: the oilseed sarson is highly sensitive to the length of daylight hours, the length of the vegetative period in pakchoi depends on the photoperiod to a moderate extent, and the root turnip is relatively neutral [1]. When assessing the effect of day length, a significant splitting was revealed in terms of the relation to photoperiod in B. rapa DH lines (Figure 2, Table 1 and Table 2). For DH 30 lines, the timing of the beginning of bolting varied from 31 to 63 days when grown on a 12 h daylight schedule (mean = 46.30 ± 7.63, CV = 16.48) and from 26 to 54 days (mean = 38.52 ± 8.51, CV = 22.08) when grown in 16 h of daylight. For DH 38 lines, an acceleration of the beginning of bolting with an increase in the length of daylight was also revealed: the variation of the trait when grown at a 12 h photoperiod was 31-55 days (mean = 45.44 ± 6.48, CV = 14.27), and at 16 h from 26 to 49 days (mean = 33.78 ± 5.27, CV = 15.59).
Similar data on the acceleration of the transition to bolting with increasing day length were obtained by Rachman et al. when studying the effect of the photoperiod on a spring B. napus mapping population carrying the genome content of B. oleracea [45]. For each population, late bolting (DH 30-28, DH 30-206, DH 38-13, DH 38-87), early bolting (DH 30-44, DH 38-80, DH 38-97), as well as highly sensitive to the length of daylight hours (DH 30-38, DH 30-164, DH 38-25) genotypes were identified. The data obtained can be used in the breeding of B. rapa crops to create lines, genotypes and cultivars with predicted growing periods, adapted to ecological and geographical conditions, differing in the length of daylight hours.

3.2. Analysis of the Content of Some Phytochemicals

A biochemical analysis of the content of dry matter, carbohydrates, ascorbic acid, plant pigments chlorophylls a and b, carotenoids, and anthocyanins in plants of two populations of B. rapa DH lines (Table 1 and Table 2), grown under controlled light culture conditions, was carried out. The influence of the duration of daylight hours on the content of biochemical substances in B. rapa crops was assessed.
Dry matter is an important indicator characterizing the nutritional value of vegetable crops. The dry matter content affects the biomass yield and the nutritional value of plant products [46]. In our study, the total range of variability of dry matter content in plants was rather high (Table 1 and Table 2). The dry matter content in the lines of the DH 30 population varied from 5.61% to 23.97%, depending on the growing conditions, and in the lines of the DH 38 population, from 4.84% to 19.04%. Under the conditions of a 16 h photoperiod (light culture, field), a slight increase in the average dry matter content (by 7–54%) was revealed in comparison with the 12 h photoperiod (light culture, greenhouse, respectively). The B. rapa lines with a high dry matter content independent of photoperiodic conditions were identified—DH 30-18 (up to 17.61%), DH 30-192 (up to 23.92%), 38-75 (up to 22.53%), which can be used in breeding programs as genotypes with high nutritional value.
Carbohydrates (mono- and disaccharides, starch, fiber, pectin, etc.) are a significant component of dry matter. Up to 80% of dry matter can be represented by mono- and disaccharides, and therefore this indicator is important for a comparative phytobiochemical assessment [47]. The high variability of this biochemical trait, confirmed in our study, is associated with both genetic characteristics and growing conditions (Table 1 and Table 2). The total sugar content in the DH 30 population varied from 0.00 to 3.53 mg/100 g, in the DH 38 population from 0.00 to 3.03 mg/100 g; monosaccharides—0.11–2.33 mg/100 g (DH 30) and 0.06–1.67 mg/100 g (DH 38); disaccharides—0.00–1.69 mg/100 g (DH 30) and 0.00–1.83 mg/100 g (DH 38).
For both studied populations, a significant increase in sugar content was found when grown on a 16 h daylight hours schedule (for total sugars—by 45–149%, monosaccharides—38–47%, disaccharides—52–82%), which is probably due to a longer light phase of photosynthesis. The studied populations in general contain a high amount of sugars, most of which are represented by monosaccharides (monosaccharides in plants, on average, contain twice as much as disaccharides, in some plants carbohydrates are represented only by simple sugars—monosaccharides). Lines with a high carbohydrate content were identified: DH 30-35 (total sugar content—up to 3.53 mg/100 g); DH 30-65 (total sugar content—up to 3.00 mg/100 g); DH 38-159 (total sugar content—up to 2.76 mg/100 g).
Ascorbic acid (vitamin C) is a unique multifunctional compound. Possessing the ability to reversibly oxidize and recover, it takes part in the most important energy processes of the plant cell, photosynthesis and respiration, and is a recognized antioxidant. Its participation in the processes of growth, flowering, and vegetative and reproductive differentiation, in water exchange, regulation of enzymatic activity, and stimulation of metabolic reactions associated with the exchange of nucleic acids and protein synthesis, in the defense reactions of plants, has been shown. The antiviral and antitumor effects of ascorbic acid and its derivatives have been proven [48,49]. The investigated accessions showed a high variability in the content of vitamin C (12.32–209.44 mg/100 g for DH 30, 8.00–138.70 mg/100 g for DH 38); a significantly higher (by 28–243%) content of ascorbic acid was noted when grown on a 16 h photoperiod (Table 1 and Table 2). Similarly, Kim and Lee [50], in their study of the effect of varying light quality and photoperiod on lettuce grown in a closed-type plant production system, also observed maximum vitamin C content under 16 h of light versus 12 and 20 h of light.
It was found that under light culture conditions the content of ascorbic acid in the studied lines was higher than when grown in a greenhouse and in the field (Table 1 and Table 2), which is probably due to more optimal light–temperature conditions and the regime of mineral nutrition.
Lines with a consistently high content of ascorbic acid have been identified: DH 30-65 (up to 209.44 mg/100 g), DH 30-134 (up to 139.04 mg/100 g), DH 38-87 (up to 102.08 mg/100 g). Selected genotypes can be used as a source of this important antioxidant.
Anthocyanins are water-soluble plant pigments, phytochemicals belonging to the flavonoid family, and secondary plant metabolites. Accumulating in both vegetative and generative organs of plants, they cause red, pink, purple and blue coloration. It is also known that anthocyanins perform structural, protective, and signaling functions in plants, determine resistance to abiotic and biotic stresses, and participate in respiration and photosynthesis [51,52]. The study of the mechanisms of accumulation of anthocyanins in plant tissues makes it possible to determine the methods of plant adaptation to unfavorable environmental conditions and to understand the physiological and biochemical mechanisms of their resistance. In addition, due to their high antioxidant activity, anthocyanins have antitumor and cardioprotective functions, which makes it possible to use foods rich in them in functional nutrition [53]. Evaluation of DH 30 and DH 38 lines showed an increase in the content of anthocyanins with an increase in the length of daylight hours (Table 1 and Table 2). In lines from the DH 30 population, the anthocyanin content varied from 0.49 to 6.34 mg/100 g, and in lines from the DH 38 population, from 0.58 to 4.32 mg/100 g.
Under the conditions of the 16 h photoperiod, the content of anthocyanins on average in the DH 30 population was higher by 8%, and in the DH 38 population by 4%, compared to the 12 h photoperiod. An increase in the biosynthesis of anthocyanins under conditions of longer daylight hours may be the result of a protective reaction of plant cells to photooxidative stress.
In general, significant variability in the content of anthocyanins between lines within each population was revealed. In addition, as a result of the study, homozygous lines of doubled haploids were isolated, which differed in low (DH 30-18—0.49 mg/100 g, DH 30-127—0.40 mg/100 g, DH 38-103—0.70 mg/100 g) and high (DH 30-28—2.96 mg/100 g, DH 38-134—4.32 mg/100 g, DH 38-172—3.07 mg/100 g) content of anthocyanins regardless of growing conditions, which can probably be explained by their genotypic characteristics.
Chlorophylls and carotenoids are the main photosynthetic pigments that provide absorption of light quanta and photosensitization in plants. Studies carried out to date have shown the stability of the qualitative composition of pigments in higher plants [54]. Each of these forms of pigments has a specific role and place in the photosynthetic system of plants. Since pigments are integrated into chloroplast membranes and are associated with proteins, their quantitative content and ratio in the leaf can reflect the adaptation features of the photosynthetic apparatus as a whole and provide its functional diagnostics. Quantitative changes in the pigment apparatus of plant leaves can occur in response to changes in environmental conditions. It is known that light is the main factor regulating the pigment content [55]. Changes in ambient temperature and humidity can also cause shifts in the pigment composition of plant leaves [56].
An increase in the content of photosynthetic pigments (chlorophyll a, b and carotenoids) was revealed for both studied populations on a short 12 h daylight compared to a long 16 h day (Table 1 and Table 2). For plants of the DH 30 population, the content of chlorophyll a varied from 35.84 to 147.16 mg/100 g, chlorophyll b from 10.73 to 61.99 mg/100 g, and carotenoids from 12.88 to 50.36 mg/100 g; for the DH 38 population—31.05-150.44 mg/100 g, 7.86–86.77 mg/100 g and 9.73–39.97 mg/100 g, respectively. The increase in the content of photosynthetic pigments under the conditions of a 12 h photoperiod was: for chlorophyll a 25–46% and 14–30% for the lines DH 30 and DH 38, respectively, for chlorophyll b 49–54% and 35–38%, and for carotenoids 25–44% and 24–37%, respectively. A higher content of photosynthetic pigments at a short daylight hour indirectly indicates a higher activity of the photosynthetic system (plants need to most effectively use a limited period of daylight hours for photosynthesis). Similarly, Park et al. [57] showed that maximum chlorophyll fluorescence (index correlating with chlorophyll content) was observed when growing of leaf lettuce at a 12 h photoperiod, compared to a 16 and 18 h photoperiod in a closed-type plant production system.
The results obtained in our study confirm the importance of representatives of the species B. rapa as a source of valuable nutrients and biologically active substances [58,59], which indicates the prospects for further study of the influence of external factors on the biochemical composition of species crops for genetic and breeding investigations, especially under controlled conditions. Therefore, Raiola et al. presented a detailed overview of bioactive compounds in Brassicaceae vegetables, including ascorbic acid, phenolics, carotenoids, etc., and mechanisms of their action [60]. Authors also presented some ideas of biofortification to optimize the content of valuable phytochemicals in Brassicaceae and emphasize the importance of further studying of the factors that control the accumulation of biologically active substances. The high nutritional value of cole crops, as well as the high variability of the content of bioactive compounds, are also discussed in the research published by Tomas et al. [61].
The revealed high degree of variability is in a good correlation with previously published data, which shows a high degree of variation in biochemical characters in the studied B. rapa DH lines when grown in field and greenhouse conditions on the territory of the Pushkin Branch of VIR (St. Petersburg, Russia) [1,2,4,5]. At the same time, the data obtained under the conditions of a short 12 h photoperiod under light culture conditions correlate with the data obtained when growing plants in greenhouse in spring, and with a 16 h long photoperiod—with the results under field conditions in the northwest of Russia (Table 1 and Table 2).This is due to the timing of growing: in the greenhouse, the plants were grown in March–April, when the daylight hours in St. Petersburg are 12–13 h, the field experiment took place in June–July, when the daylight hours are more than 18 h.
Thus, the differences in the content of the studied biochemical compounds, revealed in the field and greenhouse conditions, are largely explained by the influence of the length of daylight hours.
Based on the obtained biochemical data, a QTL analysis of the biochemical traits of both mapping populations was carried out (Figure 3 and Figure 4, Table 3 and Table 4).

3.3. Quantitative Trait Loci Mapping (QTL Analysis)

The result of the QTL analysis was the identification of loci mapped under various growing conditions and controlling the content of dry matter, sugars, ascorbic acid, anthocyanins, chlorophylls a and b, carotenoids in populations of homozygous DH lines of B. rapa grown under light culture conditions with 12 h and 16 h photoperiod (Table 3 and Table 4). It should be noted that there is a large total number of QTLs for the control of the studied biochemical traits (a total of 102 QTLs were identified for both populations—54 for DH 30 and 48 for DH 30) and simultaneous control of several traits by one locus (22 of the identified QTLs).
The result of the QTL analysis was the identification of loci mapped under various growing conditions and controlling the content of dry matter, sugars, ascorbic acid, anthocyanins, chlorophylls a and b, and carotenoids in populations of homozygous DH lines of B. rapa grown under light culture conditions with 12 h and 16 h photoperiod (Table 3 and Table 4). It should be noted that there is a large total number of QTLs for the control of the studied biochemical traits (a total of 102 QTLs were identified for both populations—54 for DH 30 and 48 for DH 30) and simultaneous control of several traits by one locus (22 of the identified QTLs).
In the DH 30 population, loci at the beginning and middle of R01 were identified that control the content of ascorbic acid, chlorophyll b, and disaccharides, and in R02, dry matter, chlorophyll a. The third linkage group (R03) contained loci that control the content of ascorbic acid, chlorophylls a and b, carotenoids, and mono- and disaccharides. The loci mapped at the beginning of R04 determined the content of ascorbic acid, carotenoids, chlorophyll a, chlorophyll b, and the loci in the middle of R04, ascorbic acid, carotenoids, and chlorophyll a. At the beginning and middle of the fifth linkage group (R05), there were loci that control the manifestation of many of the studied biochemical characteristics: the content of ascorbic acid, anthocyanins, carotenoids, and chlorophylls a and b. The loci at the beginning of R06 determined the content of chlorophyll a and chlorophyll b, and in the middle, carotenoids. In the middle of the seventh (R07) and ninth (R09) linkage groups, there were loci that generally determine the content of ascorbic acid, chlorophyll b, and carotenoids, and in the middle of R07, loci were mapped that determine the content of chlorophyll a and disaccharides. The locus mapped to the eighth clutch group (R08) controlled the ascorbic acid content. In addition, the locus at the beginning of R10 controlled the content of carotenoids.
In the DH 38 population, the loci identified on the second linkage group (R02) controlled the content of ascorbic acid, carotenoids and disaccharides, and in the middle of R04, carotenoids. In the fifth linkage group (R05), loci were mapped that determine many biochemical parameters in the studied lines of B. rapa: the content of dry matter, ascorbic acid, carotenoids, chlorophylls a and b, anthocyanins, dry matter, and monosaccharides. In the sixth linkage group (R06), loci were also identified that determine the content of ascorbic acid, carotenoids, and chlorophylls a and b. In the middle of R07, the locus controlling the content of ascorbic acid was mapped. The loci mapped in the eighth linkage group determined the content of ascorbic acid, carotenoids, and chlorophyll a. In the ninth linkage group (R09), loci were identified that control the content of ascorbic acid, anthocyanins, carotenoids, and chlorophyll a and b. Loci at the beginning of R10 controlled the content of carotenoids and chlorophyll a; in the middle of R10, the locus determining the content of chlorophyll b was mapped.
Noteworthy is the relatively low LOD score for some of the identified QTLs. According to the literature, an LOD score below 3 is often referred to as a low confidence level due to the repetitiveness of QTL testing [62]. We have shown that at high LOD values, 1/A is close to the type I error and, conversely, at low LOD values, the error is stably less than 1/A, which indicates that the LOD estimate is quite conservative. In this case, the critical value 3 will correspond to the maximum value of the type I error (at p < 0.001), and if a very high particular (individual) type I error is selected, for example 5%, then a high level of cohesion will be reliably found randomly. At the same time, both major and minor QTLs are often localized in the same positions in different experiments and even in different years of experiments; therefore, an LOD score below 3 can also be taken into account [38]. It is also likely that the low LOD score for some of the identified QTLs is due to statistical reasons (limited sample size), since only lines adapted to light culture conditions were included in the estimate.
The identified loci controlling all the studied biochemical traits were predominantly in the fifth, sixth, seventh, and ninth linkage groups, which is consistent with the results of studies on mapping biochemical traits loci in B. rapa, which were carried out in the field and in a greenhouse [1,2,4,5].

4. Conclusions

Thus, for the first time, we identified QTLs that determine the content of nutrient and biologically active substances of B. rapa when grown under light culture conditions with simulation of a contrast photoperiod, and also identified molecular markers that are genetically linked to them, which in the future allows for molecular genetic screening of accessions from the collection and breeding material of the species B. rapa according to these economically valuable biochemical characters.
The influence of daylight hours on the content of some phytochemical compounds (dry matter content, total content of sugars, mono- and disaccharides, ascorbic acid, chlorophylls a and b, carotenoids, anthocyanins) in 68 lines of two mapping populations of B. rapa was evaluated. The high variability of the biochemical composition in the lines of the studied populations of brassica crops was confirmed. A significant effect of different photoperiod durations on the manifestation of the studied signs was revealed. Lines with a high content of the studied compounds were identified, regardless of the growing conditions. Based on the data obtained, QTL analysis revealed 102 QTLs that control the content of nutrients and biologically active components in the studied populations of B. rapa, which are located mainly in the fifth, sixth, seventh and ninth linkage groups. Some of the identified loci controlled several biochemical traits simultaneously. In general, the results obtained can be of practical importance for increasing the breeding efficiency of B. rapa and can be used to create new genotypes, lines and cultivars of crops with increased biochemical value, high content of biologically active substances and adapted to specific photoperiodic conditions of the growing region, as well as to growing in light culture.

Author Contributions

Conceptualization, Y.V.C., A.M.A. and K.V.E.; methodology, K.V.E., N.G.S. and A.M.A.; software, N.V.K.; validation N.V.K., K.V.E. and Y.V.C.; resources, A.M.A.; writing—original draft preparation, K.V.E., Y.V.C. and A.M.A.; writing—review and editing, K.V.E., Y.V.C., A.M.A. and N.G.S.; visualization, K.V.E., N.V.K., N.G.S. and Y.V.C.; project administration, Y.V.C. and A.M.A. All authors have read and agreed to the published version of the manuscript.

Funding

The study was financially supported by the Ministry of Education and Science of the Russian Federation (Agreement no. 075-15-2020-805 from 2 October 2020).

Data Availability Statement

The data presented in this study are available upon request from the corresponding author.

Acknowledgments

The authors are grateful for the help in carrying out biochemical analyses of the research group of the laboratory of biochemistry of soil–plant systems of the Agrophysical Research Institute.

Conflicts of Interest

The authors declare no conflict of interest. The funders had no role in the design of the study; in the collection, analyses, or interpretation of data; in the writing of the manuscript, or in the decision to publish the results.

References

  1. Artemyeva, A.M.; Solovieva, A.E.; Kocherina, N.V.; Rudneva, E.N.; Volkova, E.N.; Chesnokov, Y.V. DNA Marked Brassica rapa L. Double Haploid Lines and Identified QTLs that Control Economically Valuable Traits for Use in Breeding Cabbage Leaf Crops; Catalogue of the VIR Global Collection, Bull. 810; VIR: St. Petersburg, Russia, 2012; 174p. (In Russian) [Google Scholar]
  2. Artemyeva, A.M.; Solovieva, A.E.; Kocherina, N.V.; Berensen, F.A.; Rudneva, E.N.; Chesnokov, Y.V. Mapping of chromosome loci determined manifestation of morphological and biochemical traits of quality in Brassica rapa L. crops. Russ. J. Plant Physiol. 2016, 63, 259–272. [Google Scholar] [CrossRef]
  3. Favela-González, K.M.; Hernández-Almanza, A.Y.; De la Fuente-Salcido, N.M. The value of bioactive compounds of cruciferous vegetables (Brassica) as antimicrobials and antioxidants: A review. J. Food Biochem. 2020, 44, e13414. [Google Scholar] [CrossRef] [PubMed]
  4. Artemyeva, A.M.; Solovieva, A.Y.; Chesnokov, Y.V. Estimating morphological and biochemical characters of quality in doubled haploid lines Brassica rapa L. Vestn. Russ. Agric. Sci. 2014, 3, 38–41, (In Russian with English abstract). [Google Scholar]
  5. Artemyeva, A.M.; Solovieva, A.E.; Kocherina, N.V.; Chesnokov, Y.V. QTL analysis of biochemical traits of quality in Brassica rapa L. Veg. Crop. Russ. 2014, 1, 10–13, (In Russian with English abstract). [Google Scholar] [CrossRef] [Green Version]
  6. El-Mogy, M.M.; Mahmoud, A.W.M.; El-Sawy, M.B.Y.; Parmar, A. Pre-harvest foliar application of mineral nutrients to retard chlorophyll degradation and preserve bio-active compounds in broccoli. Agronomy 2019, 9, 711. [Google Scholar] [CrossRef] [Green Version]
  7. Artemyeva, A.M.; Rudneva, E.N.; Kocherina, N.V.; Chesnokov, Y.V. QTL analysis of morphological traits of quality in Brassica rapa L. Veg. Crop. Russ. 2015, 2, 14–17, (In Russian with English abstract). [Google Scholar] [CrossRef] [Green Version]
  8. Verma, K.; Tripathi, M.K.; Tiwari, S.; Tripathi, N. Analysis of genetic diversity among Brassica juncea genotypes using morphophysiological and SSR markers. Int. J. Curr. Microbiol. Appl. Sci. 2021, 10, 1108–1117. [Google Scholar] [CrossRef]
  9. Qi, X.; An, H.; Hall, T.E.; Di, C.; Blischak, P.D.; McKibben, M.T.W.; Hao, Y.; Conant, G.C.; Pires, J.C.; Barker, M.S. Genes derived from ancient polyploidy have higher genetic diversity and are associated with domestication in Brassica rapa. New Phytol. 2021, 230, 372–386. [Google Scholar] [CrossRef]
  10. Collard, B.C.Y.; Jahufer, M.Z.Z.; Brouwer, J.B.; Pang, E.C.K. An introduction to markers, quantitative trait loci (QTL) mapping and marker-assisted selection for crop improvement: The basic concepts. Euphytica 2005, 142, 169–196. [Google Scholar] [CrossRef]
  11. Chesnokov, Y.V. Plant Genetic Resources and Modern Methods of DNA-Fingerprinting; VIR: St. Petersburg, Russia, 2007; 80p. (In Russian) [Google Scholar]
  12. Witzel, K.; Kurina, A.B.; Artemyeva, A.M. Opening the treasure chest: The current status of research on Brassica oleracea and B. rapa vegetables from ex situ germplasm collections. Front. Plant Sci. 2021, 12, 643047. [Google Scholar] [CrossRef] [PubMed]
  13. Pink, D.; Bailey, L.; McClement, S.; Hand, P.; Mathas, E.; Buchanan-Wollaston, V.; Astley, D.; King, G.; Teakle, G. Double haploids, markers and QTL analysis in vegetable brassicas. Euphytica 2008, 164, 509–514. [Google Scholar] [CrossRef]
  14. Lou, P.; Woody, S.; Brenham, K.; VanBuren, R.; Colle, M.; Edger, P.P.; Sartor, R.; Zheng, Y.; Levendoski, N.; Lim, J.; et al. Genetic and genomic resources to study natural variation in Brassica rapa. Plant Direct 2020, 4, e00285. [Google Scholar] [CrossRef]
  15. Cockram, J.; Mackay, I. Genetic mapping populations for conducting high-resolution trait mapping in plants. In Plant Genetics and Molecular Biology; Varshney, R., Pandey, M., Chitikineni, A., Eds.; Advances in Biochemical Engineering/Biotechnology; Springer: Cham, Switzerland, 2018; Volume 164, pp. 109–138. [Google Scholar] [CrossRef]
  16. Chesnokov, Y.V. Mapping of Quantitative Trait Loci in Plants; VIR: St. Petersburg, Russia, 2009; 100p. (In Russian) [Google Scholar]
  17. Şahin, Ö.; Kavuncu, O. A Study on relationships between various quantitative characteristics for using availability quantitative trait loci mapping. Selcuk J. Agric. Food Sci. 2019, 33, 42–44. [Google Scholar] [CrossRef]
  18. Jan, S.A.; Shinwari, Z.K.; Rabbani, M.A. Determining genetic divergence among Brassica rapa ecotypes through electrophoretic mobility of total seed proteins. J. Anim. Plant Sci. 2016, 26, 1758–1764. [Google Scholar]
  19. Ullah, N.; Khan, J.; Khan, M.W.; Raza, H.; Alam, M.; Ullah, H.; Hussain, I.; Jan, I.U.; Rahman, Z.; Ali, F. Genetic variability for biochemical traits among advanced lines of Brassica. Pure Appl. Biol 2017, 6, 1–8. [Google Scholar] [CrossRef]
  20. Lou, P.; Zhao, J.; He, H.; Hanhart, C.; Pino del Carpio, D.; Verkerk, R.; Custers, J.; Koornneef, M.; Bonnema, G. Quantitative trait loci for glucosinolates accumulation in Brassica rapa leaves. New Phytol. 2008, 179, 1017–1032. [Google Scholar] [CrossRef]
  21. Zhao, J.; Paulo, M.J.; Jamar, D.; Lou, P.; van Eeuwijk, F.; Bonnema, G.; Vreugdenhil, D.; Koornneef, M. Association mapping of leaf traits, flowering time, and phytate content in Brassica rapa. Genome 2007, 50, 963–973. [Google Scholar] [CrossRef] [PubMed] [Green Version]
  22. Bagheri, H.; El-Soda, M.; Kim, H.K.; Fritsche, S.; Jung, C.; Aarts, M.G. Genetic analysis of health-related secondary metabolites in Brassica rapa recombinant inbred lines population. Int. J. Mol. Sci. 2013, 14, 15561–15577. [Google Scholar] [CrossRef] [Green Version]
  23. El-Soda, M.; Boer, M.P.; Bagheri, H.; Hanhart, C.J.; Koornneef, M.; Aarts, M.G. Genotype–environment interactions affecting preflowering physiological and morphological traits of Brassica rapa grown in two watering regimes. J. Exp. Bot. 2014, 65, 697–708. [Google Scholar] [CrossRef] [Green Version]
  24. Kochetov, A.A.; Makarova, G.A.; Mirskaya, G.V.; Sinyavina, N.G. Agrophysical approach to the creation of new forms of cultivated plants. Agrophysics 2012, 1, 40–44, (In Russian with English abstract). [Google Scholar]
  25. Panova, G.G.; Udalova, O.R.; Kanash, E.V.; Galushko, A.S.; Kochetov, A.A.; Priyatkin, N.S.; Arkhipov, M.V.; Chernousov, I.N. Fundamentals of Physical Modeling “ideal” agroecosystems. Tech. Phys. 2020, 65, 1563–1569. [Google Scholar] [CrossRef]
  26. He, Y.; Chen, T.; Zeng, X. Genetic and epigenetic understanding of the seasonal timing of flowering. Plant Commun. 2020, 1, 100008. [Google Scholar] [CrossRef]
  27. Wang, S.L.; An, H.R.; Tong, C.G.; Jang, S. Flowering and flowering genes: From model plants to orchids. Hortic. Environ. Biotechnol. 2021, 62, 135–148. [Google Scholar] [CrossRef]
  28. Lou, P.; Zhao, J.; Kim, J.S.; Shen, S.; Del Carpio, D.P.; Song, X.; Jin, M.; Vreugdenhil, M.; Wand, X.; Koornneef, M.; et al. Quantitative trait loci for flowering time and morphological traits in multiple populations of Brassica rapa. J. Exp. Bot. 2007, 58, 4005–4016. [Google Scholar] [CrossRef] [PubMed] [Green Version]
  29. Egorova, K.V.; Sinyavina, N.G.; Kochetov, A.A.; Chesnokov, Y.V. Assessment of significant for breeding morphological traits in the double haploid population of Brassica rapa L. in controlled conditions of a regulated agroecosystem. Veg. Crop. Russ. 2020, 4, 28–31, (In Russian with English abstract). [Google Scholar] [CrossRef]
  30. Interstate Standard 12038-84. Agricultural seeds. Methods for Determination of Germination; Standartinform Publishing: Moscow, Russia, 2004. (In Russian) [Google Scholar]
  31. Ermakov, E.I.; Zheltov, Y.I.; Milto, N.E.; Kucherov, V.I. Soil for Growing Plants “Agrophyte”. Russian Federation Patent 2081555, 13 July 1997. (In Russian). [Google Scholar]
  32. State Standard of Russian Federation 8756. Fruit and Vegetable Products. Methods for Determination of Sugars; Standartinform Publishing: Moscow, Russia, 2010. (In Russian) [Google Scholar]
  33. State Standard of Russian Federation 24556-89. Products of Fruits and Vegetables Processing. Methods for Determination of Vitamin C; Standartinform Publishing: Moscow, Russia, 2003. (In Russian) [Google Scholar]
  34. Interstate Standart NF V05-129-1984. Fruit and Vegetable Products. Conventionnal Determination of Authocyanins. Detection and Identification; AFNOR Editions: Paris, France, 1984. [Google Scholar]
  35. Andersen, O.M.; Markham, K.R. Flavonoids: Chemistry, Biochemistry and Applications; CRC Press: Boca Raton, FL, USA, 2006; 1256p. [Google Scholar]
  36. Trineeva, O.V.; Safonova, E.F.; Slivkin, A.I.; Voropaeva, S.V. Method of Spectrophotometric Quantitative Determination in the Leaves of Stinging Nettle in the Joint Presence of Chlorophyll, Carotenoids and Hydroxycinnamic Acids. Russian Federation Patent 2531940, 27 October 2014. (In Russian). [Google Scholar]
  37. Van Ooijen, J.W. MapQTL® 6, Software for the Mapping of Quantitative Trait Loci in Experimental Populations of Diploid Species; Kyazma BV: Wageningen, The Netherlands, 2009; Available online: https://www.kyazma.nl/index.php/mc.MapQTL/ (accessed on 22 November 2021).
  38. Kocherina, N.V.; Artemyeva, A.M.; Chesnokov, Y.V. Using the technology of LOD score in mapping the quantitative trait loci in plants. Russ. Agric. Sci. 2011, 3, 14–17. [Google Scholar] [CrossRef]
  39. Ronald, P.S.; Penner, G.A.; Brown, P.D.; Brule-Babel, A. Identification of RAPD markers for percent hull in oat. Genome 1997, 40, 873–878. [Google Scholar] [CrossRef] [PubMed]
  40. Voorrips, R.E. MapChart: Software for the graphical presentation of linkage maps and QTLs. J. Hered. 2002, 93, 77–78. Available online: https://www.wur.nl/en/show/mapchart.htm (accessed on 22 November 2021). [CrossRef] [PubMed] [Green Version]
  41. Barba, F.J.; Esteve, M.J.; Frígola, A. Bioactive components from leaf vegetable products. Stud. Nat. Prod. Chem. 2014, 41, 321–346. [Google Scholar] [CrossRef]
  42. Artemyeva, A.M.; Sinyavina, N.G.; Panova, G.G.; Chesnokov, Y.V. Biological features of Brassica rapa L. vegetable leafy crops when growing in an intensive light culture. Agric. Biol. 2021, 56, 103–120. [Google Scholar] [CrossRef]
  43. Kapusta-Duch, J.; Kopec, A.; Piatkowska, E.; Borczak, B.; Leszczynska, T. The beneficial effects of Brassica vegetables on human health. Ann. Natl. Inst. Hyg. 2012, 63, 389–395. [Google Scholar]
  44. Xiao, D.; Shen, H.R.; Zhao, J.J.; Wei, Y.P.; Liu, D.R.; Hou, X.L.; Bonnema, G. Genetic dissection of flowering time in Brassica rapa responses to temperature and photoperiod. Plant Sci. 2019, 280, 110–119. [Google Scholar] [CrossRef]
  45. Rahman, H.; Bennett, R.A.; Kebede, B. Molecular mapping of QTL alleles of Brassica oleracea affecting days to flowering and photosensitivity in spring Brassica napus. PLoS ONE 2018, 13, e0189723. [Google Scholar] [CrossRef] [PubMed] [Green Version]
  46. Mandal, K.G.; Sinha, A.C. Nutrient management effects on light interception, photosynthesis, growth, dry-matter production and yield of Indian mustard (Brassica juncea). J. Agron. Crop Sci. 2004, 190, 119–129. [Google Scholar] [CrossRef]
  47. Kurina, A.B.; Kornyukhin, D.L.; Solovyeva, A.E.; Artemyeva, A.M. Genetic diversity of phenotypic and biochemical traits in VIR radish (Raphanus sativus L.) germplasm collection. Plants 2021, 10, 1799. [Google Scholar] [CrossRef] [PubMed]
  48. Chupakhina, G.N. Plant Ascorbic Acid System: Monograph; Immanuel Kant Baltic Federal University: Kaliningrad, Russia, 1997; 120p. (In Russian) [Google Scholar]
  49. Arrigoni, O.M.; De Tullio, C. Ascorbic acid: Much more than just an antioxidant. Biochim. Biophys. Acta Gen. Subj. 2002, 1569, 1–9. [Google Scholar] [CrossRef]
  50. Kim, Y.H.; Lee, J.S. Growth and contents of anthocyanins and ascorbic acid in lettuce as affected by supplemental UV-A LED irradiation with different light quality and photoperiod. Korean J. Hortic. Sci. Technol. 2016, 34, 596–606. [Google Scholar] [CrossRef]
  51. Welch, C.R.; Wu, Q.; Simon, J.E. Recent advances in anthocyanin analysis and characterization. Curr. Anal. Chem. 2008, 4, 75–101, (In Russian with English abstract). [Google Scholar] [CrossRef] [Green Version]
  52. Babak, O.G.; Nekrashevich, N.A.; Nikitinskaya, T.V.; Yatsevich, K.K.; Kilchevsky, A.V. Study of the Myb-factor polymorphism based on comparative genomics of vegetable Solanaceae crops (tomato, pepper, eggplant) to search for DNA markers that differentiate samples by the anthocyans accumulation. Dokl. Natl. Acad. Sci. Belarus 2020, 63, 721–729, (In Russian with English abstract). [Google Scholar] [CrossRef]
  53. Šamec, D.; Urlic, B.; Salopek-Sondi, B. Kale (Brassica oleracea var. acephala) as a superfood: Review of the scientific evidence behind the statement. Crit. Rev. Food Sci. Nutr. 2019, 59, 2411–2422. [Google Scholar] [CrossRef] [PubMed]
  54. Esteban, R.; Barrutia, O.; Artetxe, U.; Fernandez-Marin, B.; Hernandez, A.; Garcia-Plazaola, J.I. Internal and external factors affecting photosynthetic pigment composition in plants: A meta-analytical approach. New Phytol. 2015, 206, 268–280. [Google Scholar] [CrossRef] [PubMed]
  55. Lambers, H.; Chapin, F.S.; Pons, T.L. Plant Physiological Ecology; Springer: New York, NY, USA, 2008; p. 623, (In Russian with English abstract). [Google Scholar] [CrossRef]
  56. Ivanov, L.A.; Ronzhina, D.A.; Yudina, P.K.; Zolotareva, N.V.; Kalashnikova, I.V.; Ivanova, L.A. Seasonal dynamics of the content of chlorophylls and carotenoids in the leaves of steppe and forest plants at the species and community level. Russ. J. Plant Physiol. 2020, 67, 453–462. [Google Scholar] [CrossRef]
  57. Park, J.E.; Park, Y.G.; Jeong, B.R.; Hwang, S.J. Growth and anthocyanin content of lettuce as affected by artificial light source and photoperiod in a closed-type plant production system. Kor. J. Hort. Sci. Technol. 2012, 30, 673–679. [Google Scholar] [CrossRef] [Green Version]
  58. Fernandes, F.; Valentão, P.; Sousa, C.; Pereira, J.A.; Seabra, R.M.; Andrade, P.B. Chemical and antioxidative assessment of dietary turnip (Brassica rapa var. rapa L.). Food Chem. 2007, 105, 1003–1010. [Google Scholar] [CrossRef]
  59. Egorova, K.V.; Dubovitskaya, V.I.; Khomyakov, Y.V.; Chesnokov, Y.V. Study of photoperiod effect on microelements content in cabbage plants of Brassica rapa L. Agrophysica 2021, 2, 37–44, (In Russian with English abstract). [Google Scholar] [CrossRef]
  60. Raiola, A.; Errico, A.; Petruk, G.; Monti, D.M.; Barone, A.; Rigano, M.M. Bioactive compounds in Brassicaceae vegetables with a role in the prevention of chronic diseases. Molecules 2018, 23, 15. [Google Scholar] [CrossRef] [PubMed] [Green Version]
  61. Tomas, M.; Zhang, L.; Zengin, G.; Rocchetti, G.; Capanoglu, E.; Lucini, L. Metabolomic insight into the profile, in vitro bioaccessibility and bioactive properties of polyphenols and glucosinolates from four Brassicaceae microgreens. Food Res. Int. 2021, 140, 110039. [Google Scholar] [CrossRef]
  62. Lander, E.S.; Botstein, D. Mapping mendelian factors underlying quantitative traits using RFLP linkage maps. Genetics 1989, 121, 185–199. [Google Scholar] [CrossRef] [PubMed]
Figure 1. Plants of DH lines Brassica rapa L. grown under light culture conditions: (A) seedlings; (B) flowering.
Horticulturae 07 00583 g001
Figure 2. The timing of the start of bolting of lines of mapping populations DH 30 (A) and DH 38 (B) when grown under different conditions. Note: values with different superscript a–c in the column were significantly different (p < 0.05). * By Artemyeva et al., 2012 [1].
Horticulturae 07 00583 g002
Figure 3. Mapping of QTLs determining expression of biochemical traits of in Brassica rapa L. (DH 30): 12 h—AFI experiment, light culture 12 h; 16 h—AFI experiment, light culture 16 h; gh—VIR experiment, greenhouse; f—VIR experiment, field. Trait designations: AA—ascorbic acid, Car—carotenoids, chla—chlorophyll a, chlb—chlorophyll b, DM—dry matter, mS—monosaccharides, dS—disaccharides.
Horticulturae 07 00583 g003
Figure 4. Mapping of QTLs determining expression of biochemical traits of in Brassica rapa L. (DH 38): 12 h—AFI experiment, light culture 12 h; 16 h—AFI experiment, light culture 16 h; gh—VIR experiment, greenhouse; f—VIR experiment, field. Trait designations: AA—ascorbic acid, Car—carotenoids, chla—chlorophyll a, chlb—chlorophyll b, DM—dry matter, mS—monosaccharides, dS—disaccharides.
Horticulturae 07 00583 g004
Table 1. The timing of the start of bolting and the content of nutrients and biologically active substances in the lines of the mapping population DH 30.
Biopoligon of AFI 12 h PhotoperiodBiopoligon of AFI 16 h PhotoperiodVIR, Greenhouse *VIR, Field *
TraitMean ± SDXmin–XmaxCV, %Mean ± SDXmin–XmaxCV, %Mean ± SDXmin–XmaxCV, %Mean ± SDXmin–XmaxCV, %
Days to start of bolting46.30 ± 7.63 a31.00–63.0016.4838.52 ± 8.51 ab26.00–54.0022.0861.80 ± 7.99 abc50.20–85.0012.9329.42 ± 4.16 abc15.00–37.0014.13
Dry matter (%)11.20 ± 3.187.42–17.9628.3912.41 ± 4.225.61–23.9734.009.72 ± 4.155.84–19.3246.6710.44 ± 1.267.69–12.2812.02
Total sugar content
(mg/100 g)
1.30 ± 0.69 a0.11–2.6354.081.88 ± 0.77 b0.74–3.5340.960.65 ± 0.57 abc0.22–2.3788.631.62 ± 0.65 c0.00–2.4140.12
Monosaccharides (mg/100 g)0.82 ± 0.470.11–2.1257.321.13 ± 0.620.20–2.3354.87n.d.n.d.n.d.n.d.n.d.n.d.
Disaccharides
(mg/100 g)
0.48 ± 0.470.00–1.3897.920.74 ± 0.490.00–1.6966.22n.d.n.d.n.d.n.d.n.d.n.d.
Ascorbic acid
(mg/100 g)
63.98 ± 23.92 a28.16–113.5237.39101.36 ± 52.76 ab33.88–209.4452.0616.90 ± 2.24 abc12.32–20.0013.2356.89 ± 13.30 bc37.05–78.8523.38
Chlorophyll a
(mg/100 g)
85.71 ± 25.17 a55.17–147.1629.3758.66 ± 5.6 ab39.06–83.3520.0480.76 ± 22.65 b35.84–117.8728.0464.51 ± 11.33 a47.46–87.7317.57
Chlorophyll b
(mg/100 g)
25.04 ± 8.57 a10.73–45.9134.2216.29 ± 2.98 ab11.69–23.6418.2841.38 ± 12.80 abc20.02–61.9930.93 27.72 ± 5.50 bc20.16–39.4219.84
Carotenoids
(mg/100 g)
30.32 ± 8.35 a16.59–50.3627.5221.02 ± 4.24 a12.88–28.7720.1723.60 ± 5.96 a14.04–31.4225.2718.91 ± 2.36 a16.42–23.5612.46
Anthocyanins
(mg/100 g)
1.60 ± 0.950.49–3.6259.501.67 ± 1.430.58–6.3485.33n.d.n.d.n.d.n.d.n.d.n.d.
Note: values with different superscript a–c in the column were significantly different (p < 0.05). n.d.—not detected. * By Artemyeva et al., 2012 [1].
Table 2. The timing of the start of bolting and the content of nutrients and biologically active substances in the lines of the mapping population DH 38.
Biopoligon of AFI 12 h PhotoperiodBiopoligon of AFI 16 h PhotoperiodVIR, Greenhouse *VIR, Field *
TraitMean ± SDXmin–XmaxCV, %Mean ± SDXmin–XmaxCV, %Mean ± SDXmin–XmaxCV, %Mean ± SDXmin–XmaxCV, %
Days to start of bolting45.44 ± 6.48 a31.00–55.0014.2733.78 ± 5.27 ab26.00–49.0015.5960.50 ± 5.69 abc47.00–73.009.4030.62 ± 3.92 abc25.00–40.0012.81
Dry matter (%)9.47 ± 2.16 a6.26–15.7722.8410.25 ± 3.00 b7.10–22.5129.247.66 ± 1.88 bc4.84–11.2024.4811.75 ± 2.93 ac6.76–19.0424.96
Total sugar content
(mg/100 g)
0.82 ± 0.56 a0.06–2.7667.681.29 ± 0.57 b0.29–2.1548.400.55 ± 0.47 bc0.18–2.6886.621.32 ± 0.81 ac0.00–3.0363.00
Monosaccharides (mg/100 g)0.59 ± 0.30 a0.06–1.1151.090.87 ± 0.46 a0.10–1.6756.81n.d.n.d.n.d.n.d.n.d.n.d.
Disaccharides
(mg/100 g)
0.23 ± 0.400.00–1.83169.880.42 ± 0.470.00–1.79112.69n.d.n.d.n.d.n.d.n.d.n.d.
Ascorbic acid
(mg/100 g)
43.22 ± 19.92 a15.40–97.0246.0955.40 ± 27.13 b14.08–102.0848.9716.15 ± 3.24 abc8.00–20.0020.0855.37 ± 23.76 c20.90–138.7042.91
Chlorophyll a
(mg/100 g)
73.19 ± 20.95 a37.09–112.0828.6356.39 ± 14.42 ab31.01–105.6525.5783.47 ± 31.75 b41.54–150.4438.0373.42 ± 17.37 b50.99–140.2123.57
Chlorophyll b
(mg/100 g)
22.25 ± 6.38 a10.08–34.9128.7016.09 ± 4.42 b7.86–32.4927.5044.18 ± 18.54 abc23.41–86.7741.9732.63 ± 9.57 abc15.24–54.4929.32
Carotenoids
(mg/100 g)
27.37 ± 7.31 a13.22–39.9726.7219.94 ± 4.84 a13.14–35.7624.2722.33 ± 5.51 a13.28–31.9024.7017.99 ± 3.92 a9.73–26.6121.78
Anthocyanins (mg/100 g)1.58 ± 0.650.58–3.0741.341.71 ± 1.000.49–4.3258.23n.d.n.d.n.d.n.d.n.d.n.d.
Note: values with different superscript a–c in the column were significantly different (p < 0.05). n.d.—not detected. * By Artemyeva et al., 2012 [1].
Table 3. QTL mapping of loci that determine the content of biologically active substances and nutrients in the mapping population DH 30.
TraitGroupPositionLOD% Expl.AFIVIR *
12 h16 hGreenhouse Field
Ascorbic acidR 0116.202.3545.1X
R 0356.441.1828.7 X
R 0356.51.7023.0 X
R 0391.621.3432.0 X
R 0437.891.4620.0 X
R 0438.912.0244.1 X
R 0535.742.2046.9 X
R 0562.181.9826.2 X
R 0570.091.2727.7X
R 0572.090.9624.2 X
R 0714.680.9924.9 X
R 0717.451.6437.6 X
R 0727.341.7335.8X
R 0764.411.7038.7 X
R 0848.182.1345.8 X
R 0949.590.8812.6 X
AnthocyaninsR 0531.541.5733.1 X
R 0575.771.8334.4X
CarotenoidsR 0210.262.9252.6 X
R 0331.632.6833.7 X
R 0373.541.1728.7 X
R 0373.550.395.9 X
R 03102.831.0723.9 X
R 03111.891.4027.6X
R 043.002.2340.1X
R 0416.741.1127.4 X
R 0422.270.8211.8 X
R 0520.700.9624.2 X
R 0520.700.8311.9 X
R 064.371.8624.9 X
R 0631.311.0321.1X
R0774.492.8251.4 X
R 0779.920.9423.6 X
R 0782.921.5232.1X
R 07105.192.1245.7 X
R 0931.861.2129.4 X
R 1025.461.0724.0X
R 1028.241.0724.0 X
Chlorophyll aR 028.262.4446.5 X
R 0332.632.3430.2 X
R 0395.201.7736.4 X
R 03111.891.3927.3X
R 03116.011.2329.9 X
R 043.002.4743.4X
R 0445.871.1024.4 X
R 0453.991.4227.8X
R 0520.700.7410.7 X
R 0540.191.5736.4 X
R 063.081.0924.4 X
R 064.361.6922.8 X
R 0726.600.7811.2 X
R 0774.492.0040.0 X
Chlorophyll bR 0135.223.1755.6 X
R 0332.632.6533.4 X
R 0353.661.6434.2 X
R 0369.151.2931.1 X
R 0360.100.8412.1 X
R 043.002.7747.2X
R 0416.741.1027.2 X
R 0520.700.568.3 X
R 0539.250.7110.3 X
R 0541.191.2530.2 X
R 0580.571.5035.1 X
R 064.362.1027.5 X
R 0726.601.1516.2 X
R 0742.400.6216.3 X
R 0946.161.5536.0 X
Dry matterR 0228.241.9038.5X
R 0639.321.9839.7 X
MonosaccharidesR 0329.121.4229.1X
R 0380.871.6038.8 X
DisaccharidesR 0140.023.0151.8X
R 0348.682.2642.2X
R 0726.602.8149.4X
R 1017.442.7957.5 X
* By Artemyeva et al., 2012 [1].
Table 4. QTL mapping of loci that determine the content of biologically active substances and nutrients in the mapping population DH 38.
TraitGroupPositionLOD% Expl.AFIVIR *
12 h16 hGreenhouse Field
Ascorbic acidR 0242.750.628.6 X
55.561.8132.7 X
R 0524.523.1035.9X
34.642.0736.5 X
43.072.2828.0X
43.500.9311.6 X
R 0625.182.5931.1 X
86.521.5328.5 X
93.291.5319.8 X
R 0750.201.7632.0 X
57.740.557.7 X
R 0812.491.5118.1 X
R 090.002.6932.1X
69.541.1414.0 X
74.031.6621.2 X
AnthocyaninsR 0556.991.5419.9X
R 0934.662.6439.7 X
45.591.2116.0X
CarotenoidsR 0244.681.0413.9X
R 0244.680.7410.1 X
R0447.160.8812.0 X
R0510.660.598.1 X
R0662.481.2917.0 X
96.591.9130.6 X
R 0862.521.4123.6 X
R0913.62.1826.9 X
R 1025.562.2827.9X
Chlorophyll aR 0447.160.8010.9 X
52.690.729.0 X
R 0538.281.0512.9 X
40.741.3923.4 X
43.071.0514.0X
R 0652.780.8410.5 X
57.271.2616.6X
62.481.4418.7 X
83.671.2214.8 X
96.591.9431.1 X
R 0862.510.8010.0 X
62.521.2421.2 X
R 092.001.0113.5 X
6.921.3416.2 X
13.601.9424.3 X
15.581.8321.4 X
28.742.0123.2 X
35.651.3117.2 X
67.281.0017.4 X
R 1017.430.9812.1 X
25.562.4529.7X
Chlorophyll bR 0510.6650.658.9 X
43.071.1014.6X
46.390.8211.1 X
50.834.4644.4 X
R 0676.371.3717.9 X
83.671.214.6 X
96.591.5625.9 X
R 0915.581.5318.2 X
13.602.7732.9 X
R 1025.562.0925.9X
27.952.1326.4 X
59.231.2415.0 X
Dry matterR 0523.502.0325.4X
43.071.4719.1X
55.581.7228.1 X
MonosaccharideR 0522.811.2718.3X
R 0817.372.3945.7 X
DisaccharidesR 0289.361.2317.7X
R 0735.171.7636.3 X
* By Artemyeva et al. 2012 [1].
Publisher’s Note: MDPI stays neutral with regard to jurisdictional claims in published maps and institutional affiliations.

