
Modified Atmospheric CO2 Levels for Maintenance of Fruit Weight and Nutritional Quality upon Long-Term Storage in Blueberry (Vaccinium corymbosum L.) ‘Liberty’


Abstract
:1. Introduction
2. Materials and Methods
2.1. Plant Material and Harvest
2.2. Storage Conditions
2.3. Sample Extraction
2.4. Analytical Methods
2.5. Statistical Analysis
3. Results
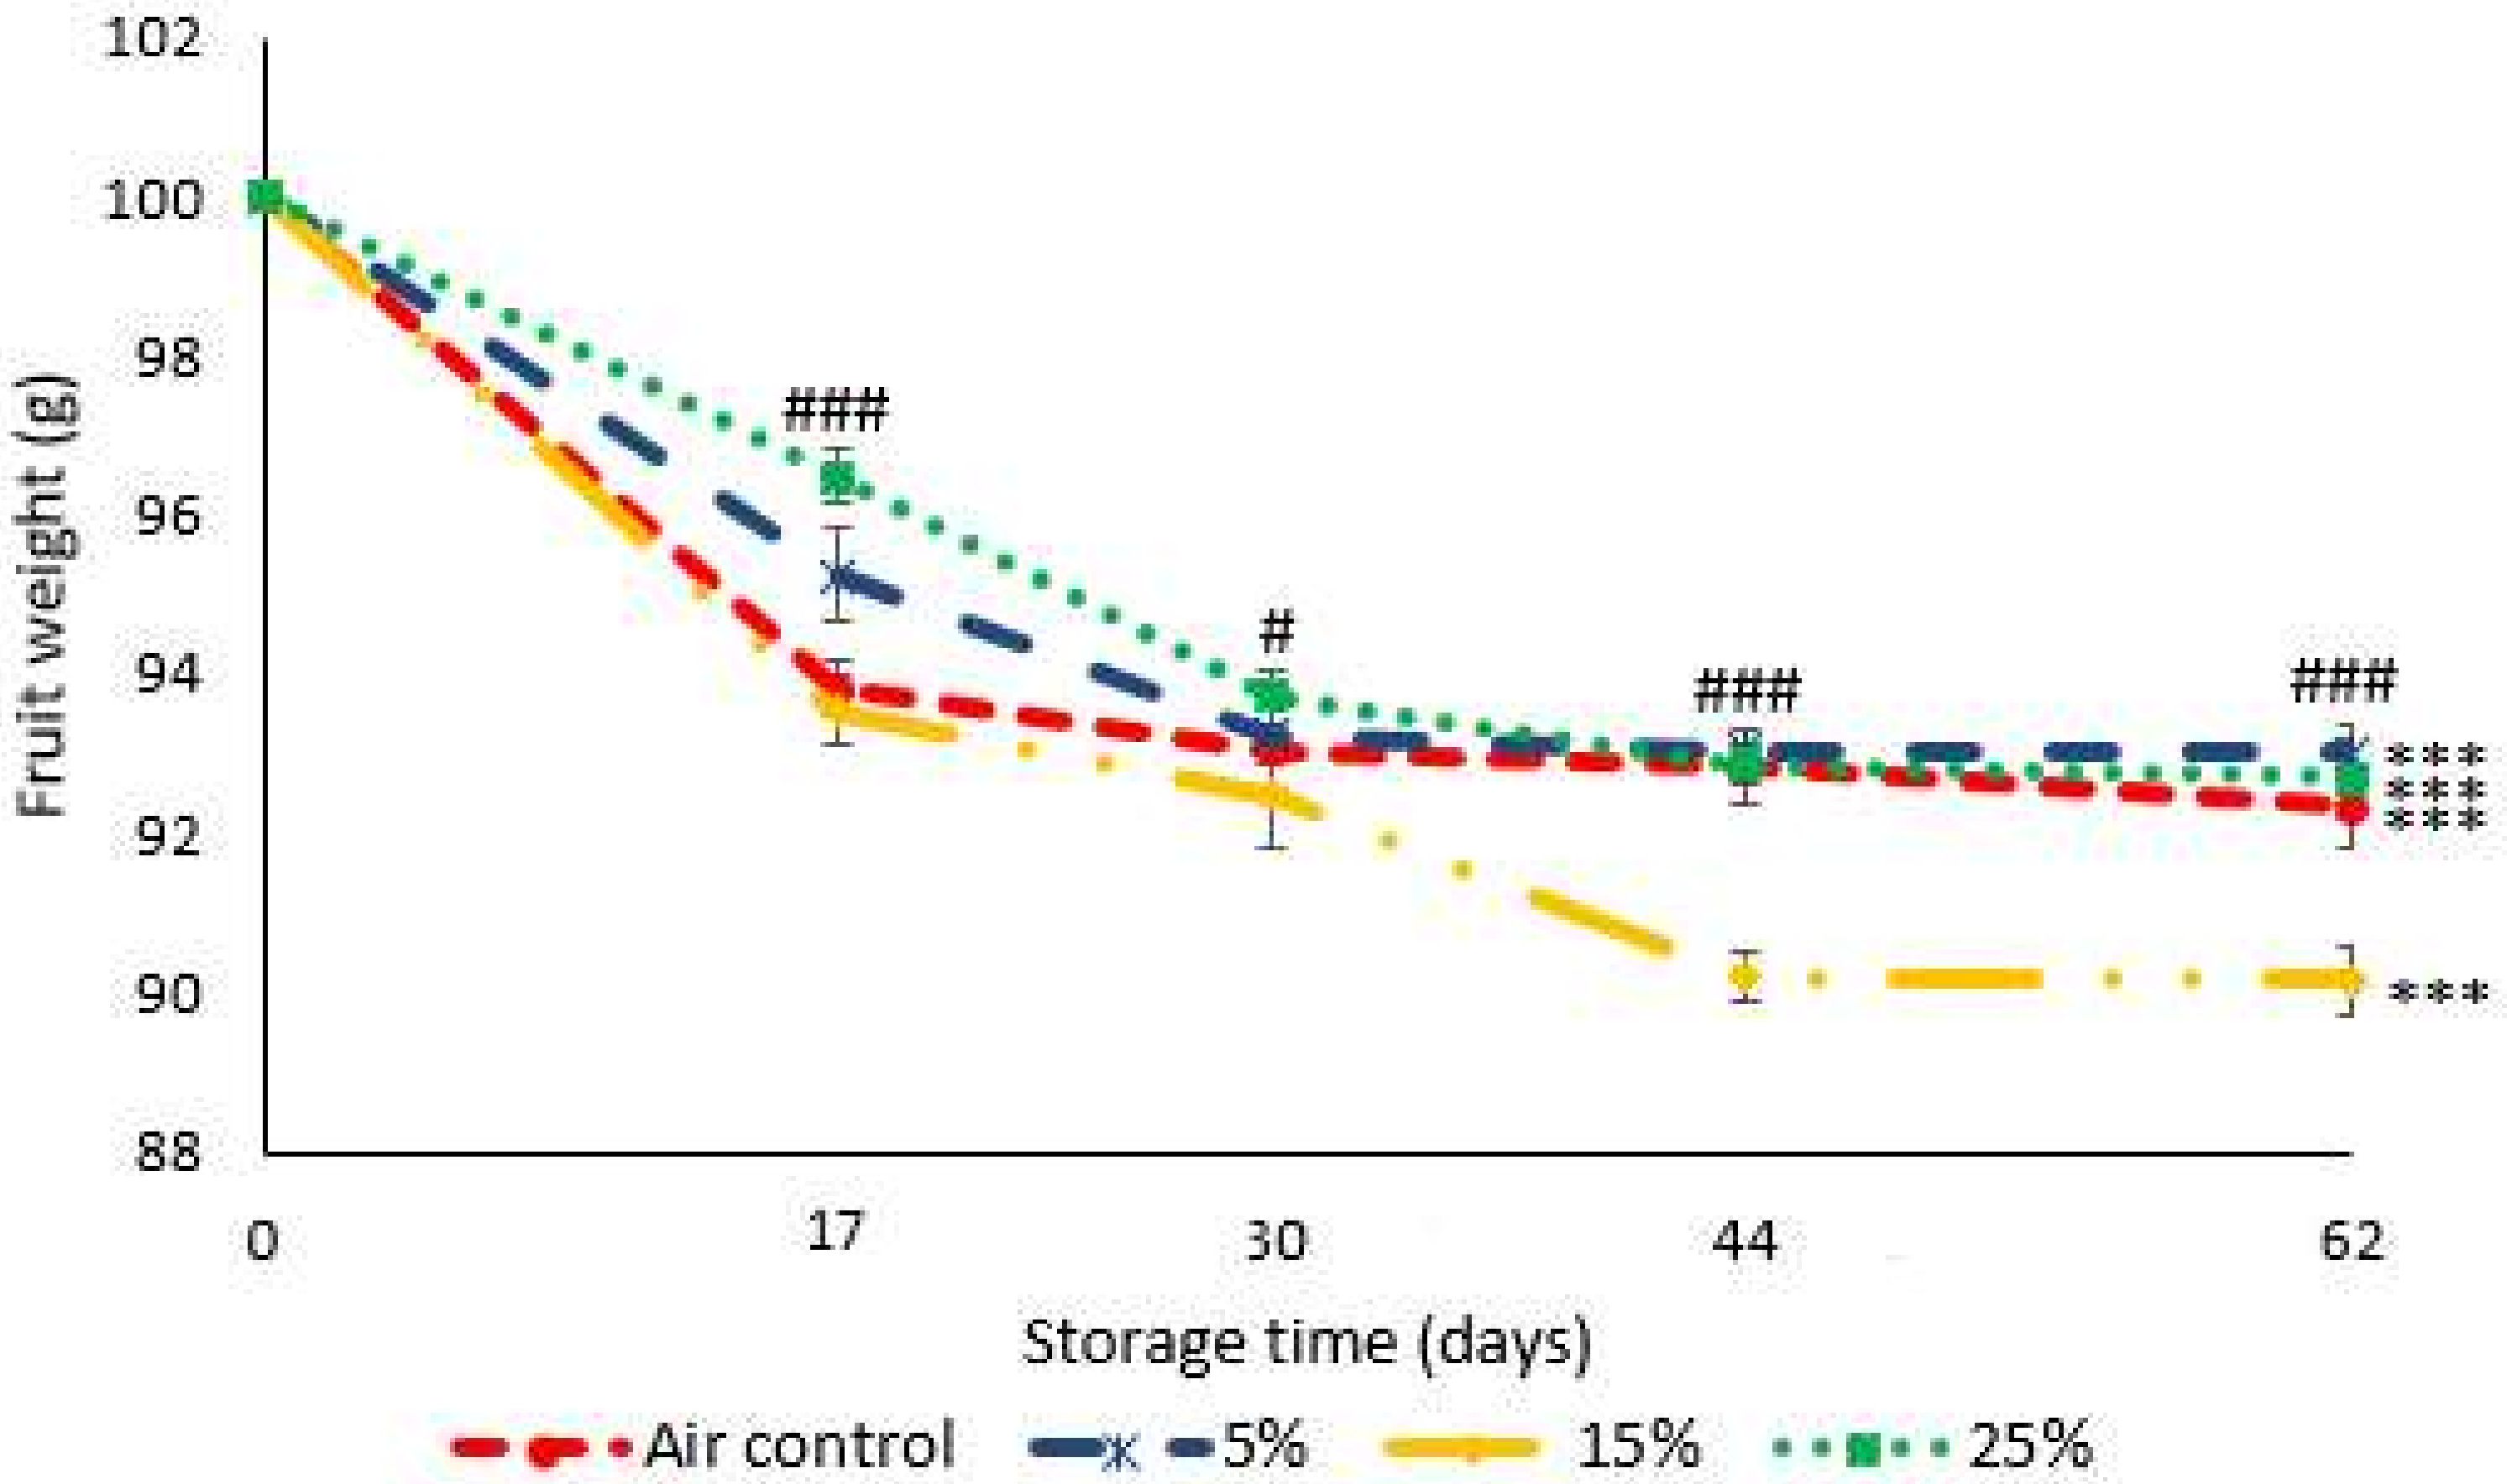
3.1. Fruit Weight
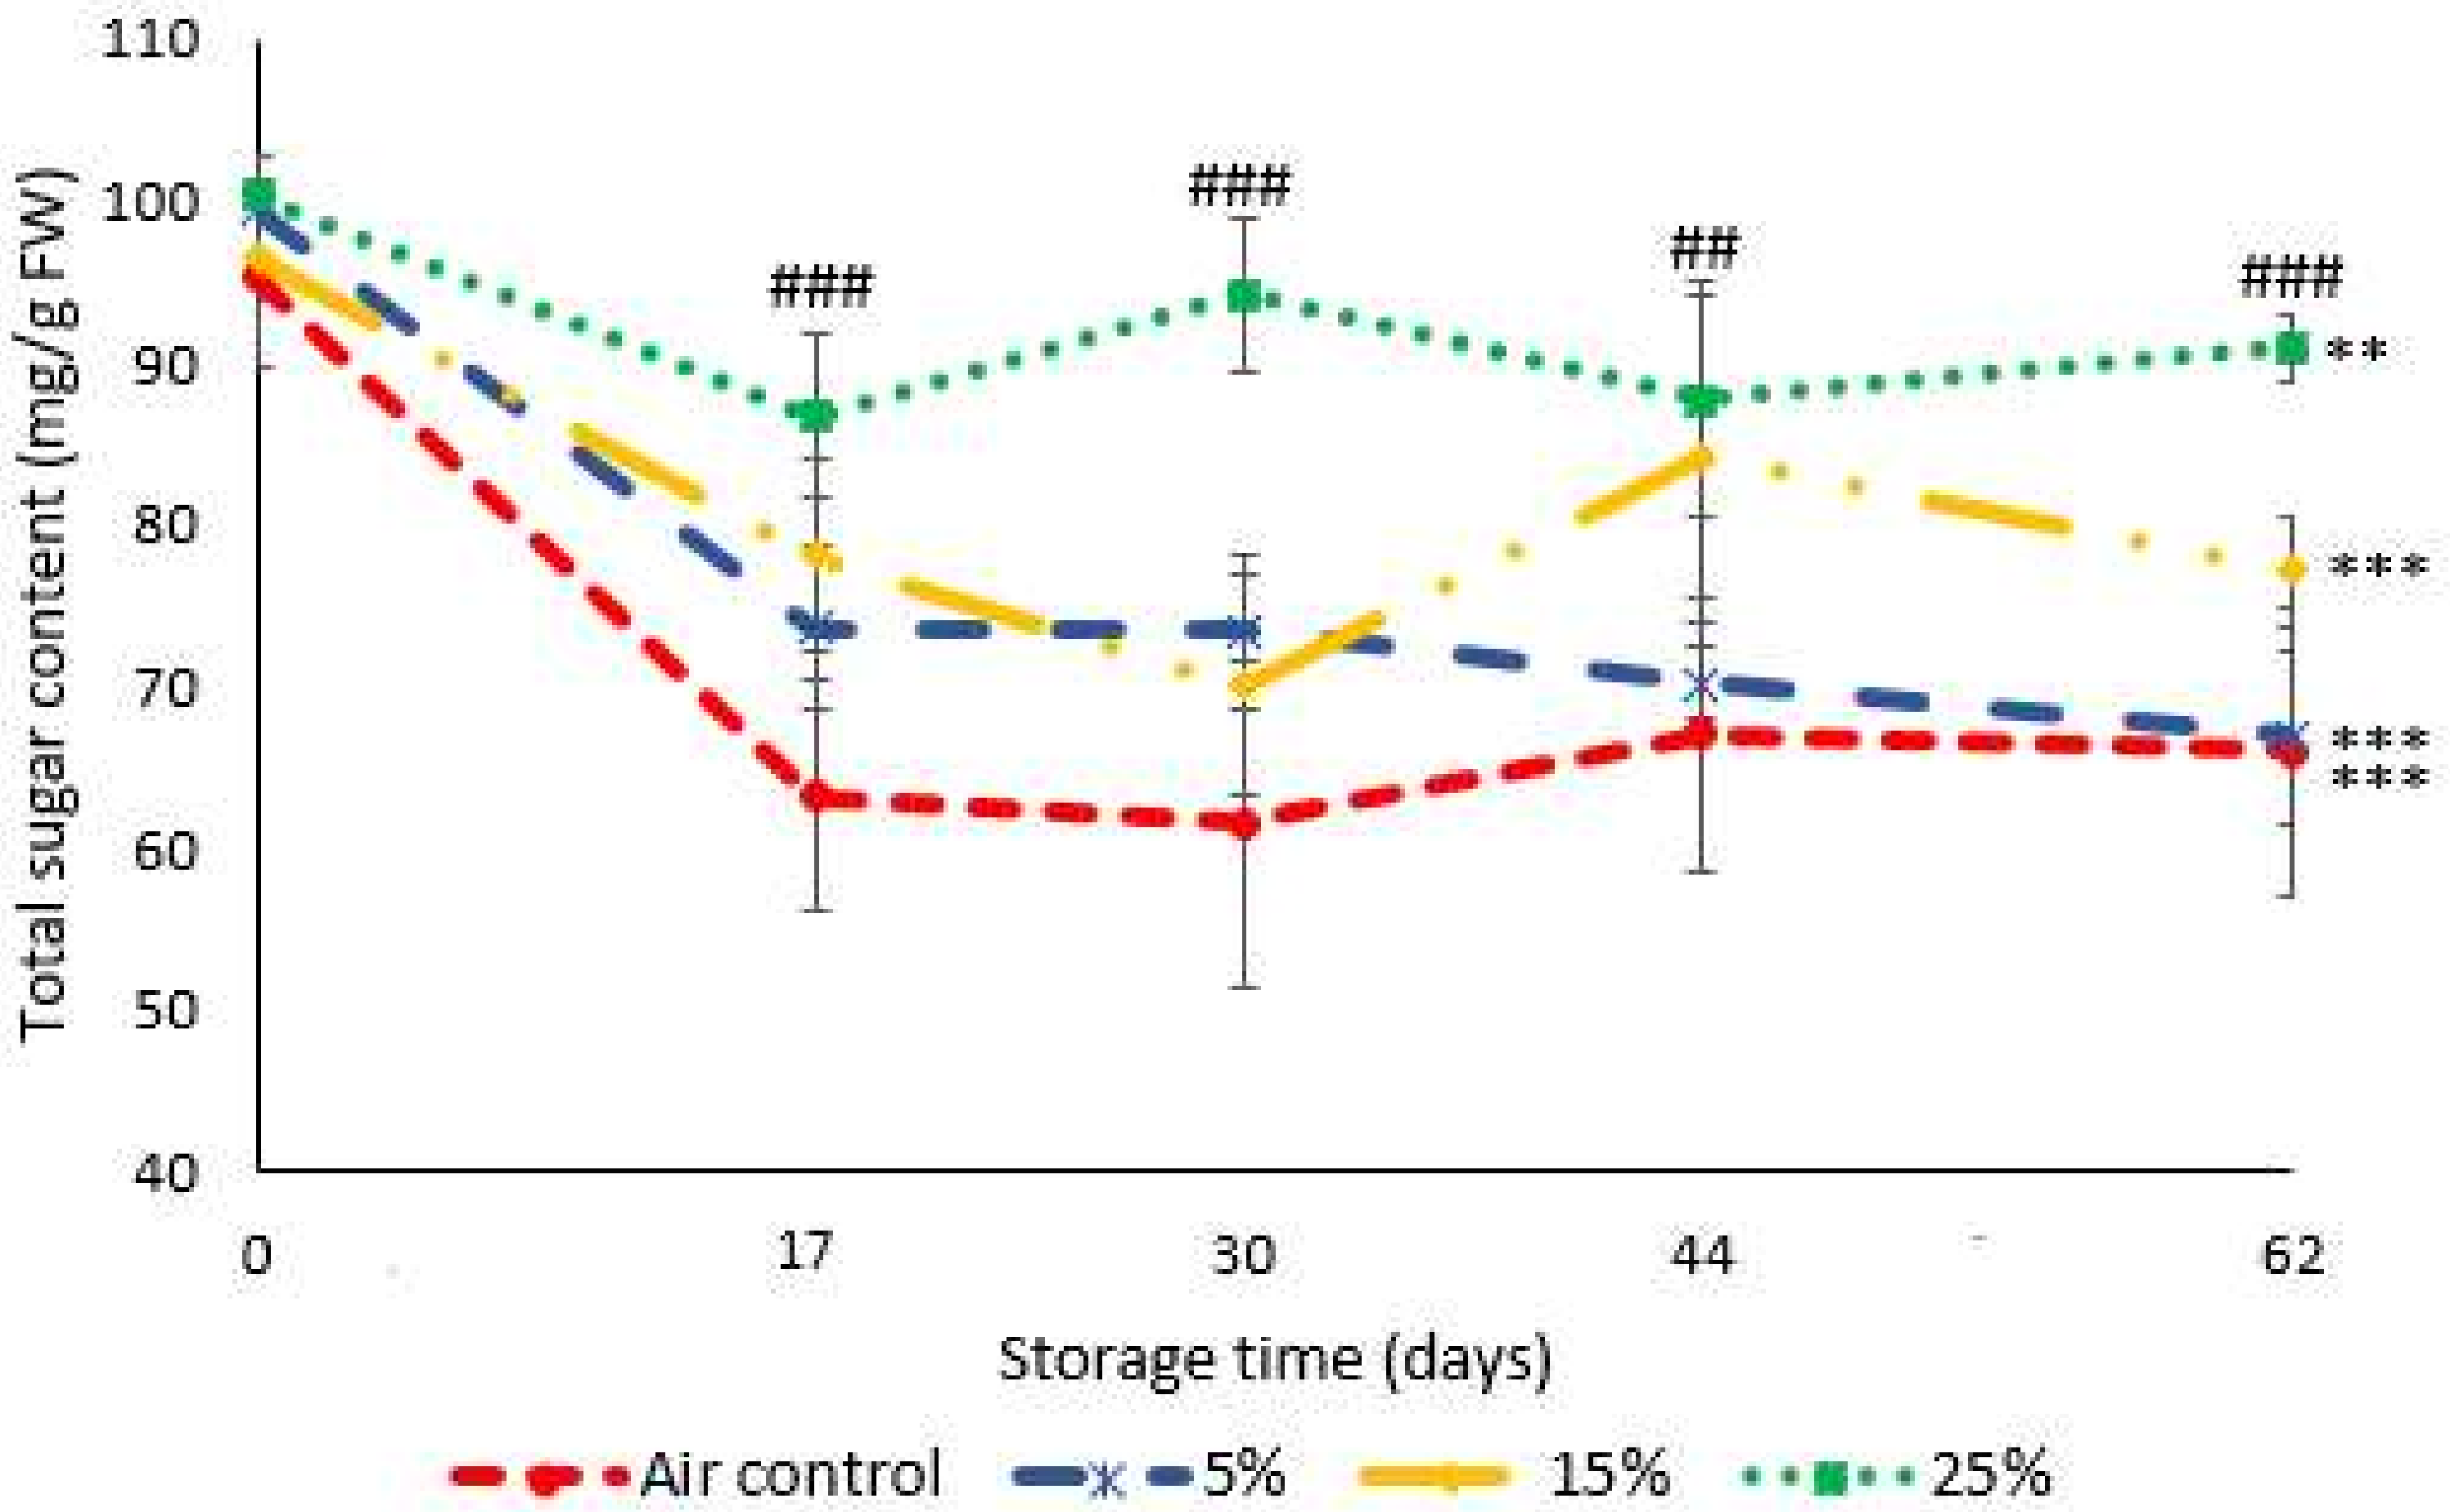
3.2. Sugars
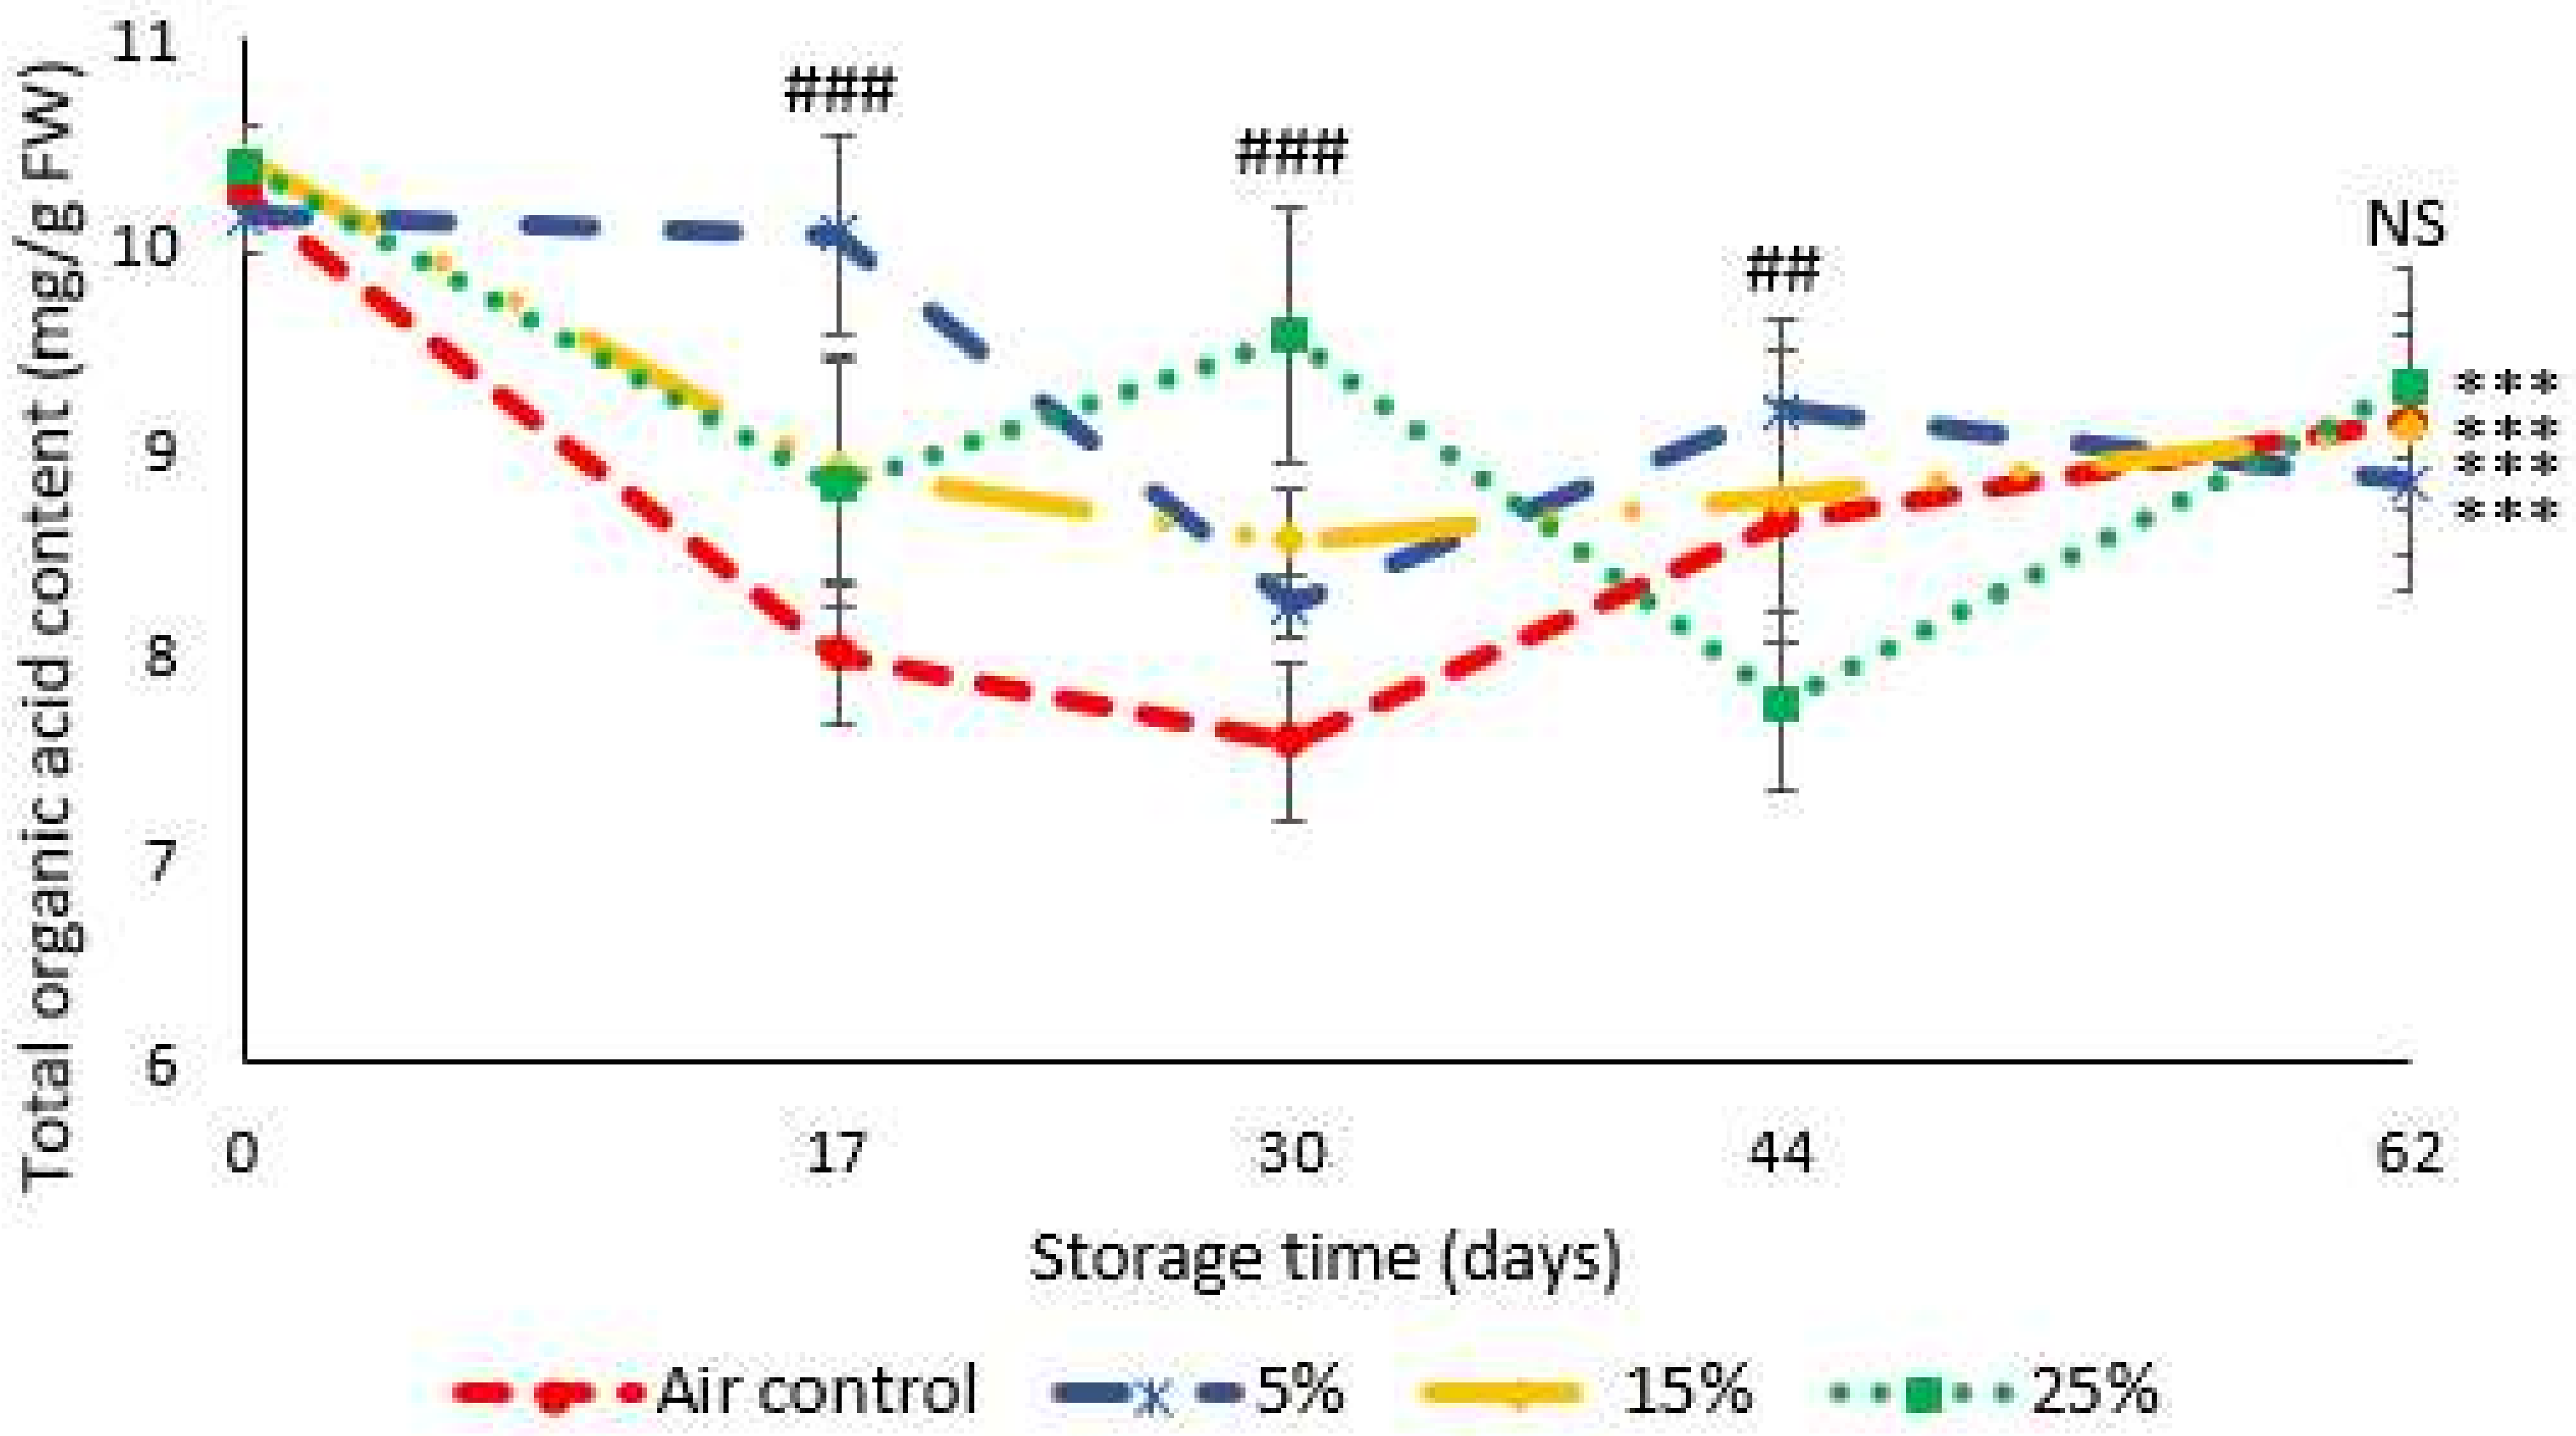
3.3. Organic Acids
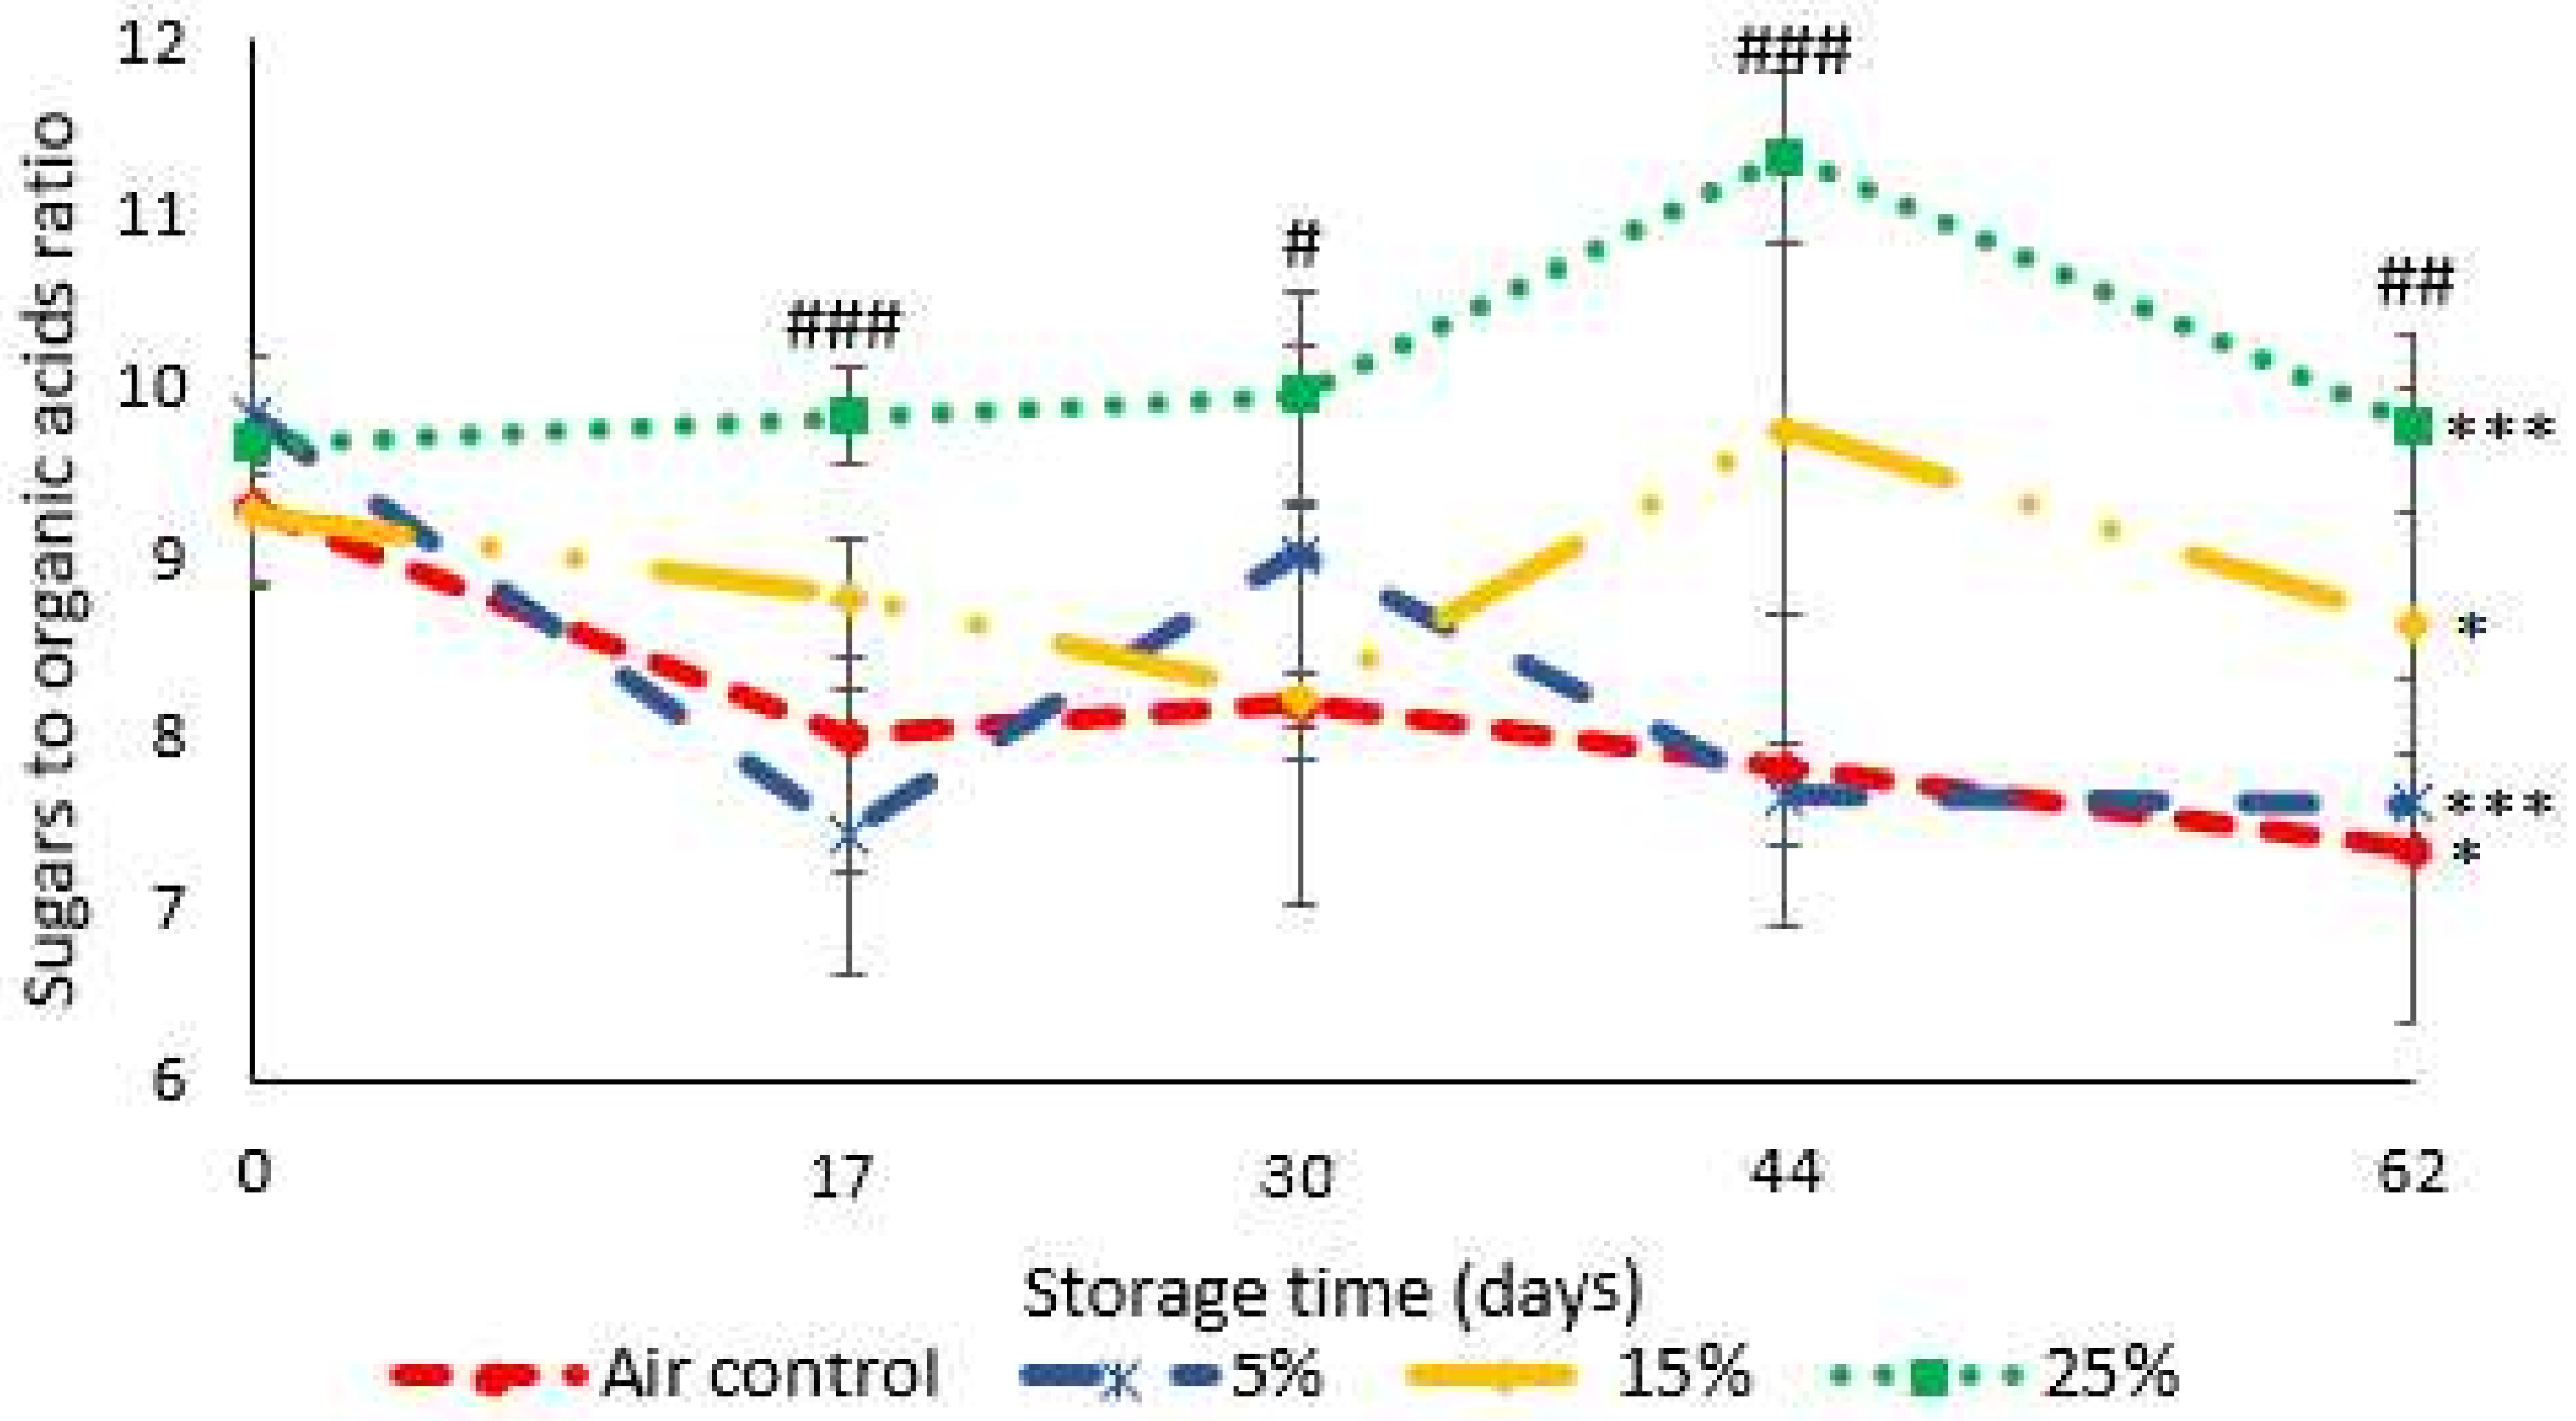
3.4. Sugars to Organic Acids Ratio
3.5. Individual Phenolics
4. Discussion
5. Conclusions
Supplementary Materials
Author Contributions
Funding
Data Availability Statement
Conflicts of Interest
References
- Grace, M.H.; Xiong, J.; Esposito, D.; Ehlenfeldt, M.; Lila, M.A. Simultaneous LC-MS quantification of anthocyanins and non-anthocyanin phenolics from blueberries with widely divergent profiles and biological activities. Food Chem. 2019, 277, 336–346. [Google Scholar] [CrossRef]
- Retamales, J.B.; Hancock, J.F. Blueberries, 2nd ed.; Cabi: Wallingford, UK, 2018. [Google Scholar]
- Skrovankova, S.; Sumczynski, D.; Mlcek, J.; Jurikova, T.; Sochor, J. Bioactive compounds and antioxidant activity in different types of berries. Int. J. Mol. Sci. 2015, 16, 24673–24706. [Google Scholar] [CrossRef] [Green Version]
- Barberis, A.; Spissu, Y.; Fadda, A.; Azara, E.; Bazzu, G.; Marceddu, S.; Angioni, A.; Sanna, D.; Schirra, M.; Serra, P.A. Simultaneous amperometric detection of ascorbic acid and antioxidant capacity in orange, blueberry and kiwi juice, by a telemetric system coupled with a fullerene- or nanotubes-modified ascorbate subtractive biosensor. Biosens. Bioelectron. 2015, 67, 214–223. [Google Scholar] [CrossRef] [PubMed]
- Bunea, A.; Rugină, D.; Pintea, A.; Andrei, S.; Bunea, C.; Pop, R.; Bele, C. Carotenoid and fatty acid profiles of bilberries and cultivated blueberries from Romania. Chem. Pap. 2012, 66, 935–939. [Google Scholar] [CrossRef]
- Curtis, P.J.; van der Velpen, V.; Berends, L.; Jennings, A.; Feelisch, M.; Umpleby, A.M.; Evans, M.; Fernandez, B.O.; Meiss, M.S.; Minnion, M.; et al. Blueberries improve biomarkers of cardiometabolic function in participants with metabolic syndrome-results from a 6-month, double-blind, randomized controlled trial. Am. J. Clin. Nutr. 2019, 109, 1535–1545. [Google Scholar] [CrossRef] [PubMed] [Green Version]
- Jennings, A.; Welch, A.A.; Spector, T.; Macgregor, A.; Cassidy, A. Intakes of anthocyanins and flavones are associated with biomarkers of insulin resistance and inflammation in women. J. Nutr. 2014, 144, 202–208. [Google Scholar] [CrossRef] [PubMed] [Green Version]
- Beaudry, R.M.; Moggia, C.E.; Retamales, J.B.; Hancock, J.F. Quality of “Ivanhoe” and “Bluecrop” blueberry fruit transported by air and sea from Chile to North America. HortScience 1998, 33, 313–317. [Google Scholar]
- Forney, C.F. Postharvest issues in blueberry and cranberry and methods to improve market—Life. Acta Hortic. 2009, 810, 785–798. [Google Scholar] [CrossRef]
- Liato, V.; Hammami, R.; Aïder, M. Influence of electro-activated solutions of weak organic acid salts on microbial quality and overall appearance of blueberries during storage. Food Microbiol. 2017, 64, 56–64. [Google Scholar] [CrossRef]
- Hancock, J.; Callow, P.; Serçe, S.; Hanson, E.; Beaudry, R. Effect of cultivar, controlled atmosphere storage, and fruit ripeness on the long-term storage of highbush blueberries. HortTechnology 2008, 18, 199–205. [Google Scholar] [CrossRef]
- Connor, A.M.; Luby, J.J.; Hancock, J.F.; Berkheimer, S.; Hanson, E.J. Changes in fruit antioxidant activity among blueberry cultivars during cold-temperature storage. J. Agric. Food Chem. 2002, 50, 893–898. [Google Scholar] [CrossRef]
- Cantwell, M. Properties and Recommended Conditions for Long-Term Storage of Fresh Fruits and Vegetables; UC Davis Postharvest Technology Center: Davis, CA, USA, 2001; p. 7. [Google Scholar]
- Concha-Meyer, A.; Eifert, J.D.; Williams, R.C.; Marcy, J.E.; Welbaum, G.E. Shelf life determination of fresh blueberries (Vaccinium corymbosum) stored under controlled atmosphere and ozone. Int. J. Food Sci. 2015, 2015, 164143. [Google Scholar] [CrossRef] [PubMed] [Green Version]
- Alsmairat, N.; Contreras, C.; Hancock, J.; Callow, P.; Beaudry, R. Use of combinations of commercially relevant O2 and CO2 partial pressures to evaluate the sensitivity of nine highbush blueberry fruit cultivars to controlled atmospheres. HortScience 2011, 46, 74–79. [Google Scholar] [CrossRef]
- Duarte, C.; Guerra, M.; Daniel, P.; Camelo, A.L.; Yommi, A. Quality Changes of Highbush Blueberries Fruit Stored in CA with Different CO2 Levels. J. Food Sci. 2009, 74, S154–S159. [Google Scholar] [CrossRef] [PubMed]
- Catuneanu, I.B.; Badulescu, L.; Dobrin, A.; Stan, A.; Hoza, D. The Influence of Storage in Controlled Atmosphere on Quality Indicators of Three Blueberries Varieties. Sci. Pap. B Hortic. 2017, 61, 91–100. [Google Scholar]
- Zheng, Y.; Yang, Z.; Chen, X. Effect of high oxygen atmospheres on fruit decay and quality in Chinese bayberries, strawberries and blueberries. Food Control 2008, 19, 470–474. [Google Scholar] [CrossRef]
- Petkovsek, M.M.; Stampar, F.; Veberic, R. Parameters of inner quality of the apple scab resistant and susceptible apple cultivars (Malus domestica Borkh.). Sci. Hortic. 2007, 114, 37–44. [Google Scholar] [CrossRef]
- Petkovsek, M.M.; Slatnar, A.; Stampar, F.; Veberic, R. The influence of organic/integrated production on the content of phenolic compounds in apple leaves and fruits in four different varieties over a 2-year period. J. Sci. Food Agric. 2010, 90, 2366–2378. [Google Scholar] [CrossRef]
- Mikulic-Petkovsek, M.; Schmitzer, V.; Slatnar, A.; Stampar, F.; Veberic, R. Composition of Sugars, Organic Acids, and Total Phenolics in 25 Wild or Cultivated Berry Species. J. Food Sci. 2012, 77, C1064–C1070. [Google Scholar] [CrossRef]
- R: A Language and Environment for Statistical Computing 2021. Available online: https://www.r-project.org/ (accessed on 15 January 2021).
- Saltveit, M.E. Respiratory Metabolism. In Postharvest Physiology and Biochemistry of Fruits and Vegetables; Yahia, E.M., Carrillo-López, A., Eds.; Woodhead Publishing: Duxford, UK, 2019; pp. 73–91. [Google Scholar]
- Armstrong, W.; Beckett, P.M. Experimental and modelling data contradict the idea of respiratory down-regulation in plant tissues at an internal [O2] substantially above the critical oxygen pressure for cytochrome oxidase. New Phytol. 2011, 190, 431–441. [Google Scholar] [CrossRef]
- Moggia, C.; Beaudry, R.M.; Retamales, J.B.; Lobos, G.A. Variation in the impact of stem scar and cuticle on water loss in highbush blueberry fruit argue for the use of water permeance as a selection criterion in breeding. Postharvest Biol. Technol. 2017, 132, 88–96. [Google Scholar] [CrossRef] [Green Version]
- Alamar, M.C.; Collings, E.; Cools, K.; Terry, L.A. Impact of controlled atmosphere scheduling on strawberry and imported avocado fruit. Postharvest Biol. Technol. 2017, 134, 76–86. [Google Scholar] [CrossRef] [Green Version]
- Kader, A.A. Regulation of fruit physiology by controlled/modified atmosphere. Acta Hortic. 1995, 398, 59–70. [Google Scholar] [CrossRef]
- El-Kazzaz, M.K.; Sommer, N.F.; Fortlage, R.J. Effect of Different Atmospheres on Postharvest Decay and Quality of Fresh Strawberries. Phytopathology 1983, 73, 282–285. [Google Scholar] [CrossRef] [Green Version]
- Falagán, N.; Miclo, T.; Terry, L.A. Graduated Controlled Atmosphere: A Novel Approach to Increase “Duke” Blueberry Storage Life. Front. Plant Sci. 2020, 11, 221. [Google Scholar] [CrossRef] [PubMed]
- Shangguan, L.; Song, C.; Leng, X.; Kayesh, E.; Sun, X.; Fang, J. Mining and comparison of the genes encoding the key enzymes involved in sugar biosynthesis in apple, grape, and sweet orange. Sci. Hortic. 2014, 165, 311–318. [Google Scholar] [CrossRef]
- Zhang, J.; Nie, J.-Y.; Li, J.; Zhang, H.; Li, Y.; Farooq, S.; Bacha, S.A.S.; Wang, J. Evaluation of sugar and organic acid composition and their levels in highbush blueberries from two regions of China. J. Integr. Agric. 2020, 19, 2352–2361. [Google Scholar] [CrossRef]


| Condition | Storage Time (Days) | Sugar Content (mg/g FW) | ||
|---|---|---|---|---|
| Sucrose | Glucose | Fructose | ||
| Air control | 0 | 10.56 ± 0.51 a | 34.42 ± 2.06 a | 50.34 ± 3.24 a |
| 17 | 8.81 ± 1.14 ab, B | 22.24 ± 2.57 b, C | 32.22 ± 3.81 b, D | |
| 30 | 7.96 ± 1.11 b, C | 21.61 ± 3.71 b, C | 31.93 ± 6.03 b, C | |
| 44 | 9.51 ± 1.30 ab | 23.05 ± 3.14 b, B | 34.47 ± 4.94 b, B | |
| 62 | 9.65 ± 1.96 ab, B | 22.68 ± 3.16 b, C | 33.62 ± 4.75 b, C | |
| Significance | * | *** | *** | |
| 5% CO2 | 0 | 11.10 ± 0.38 a | 35.76 ± 1.18 a | 52.62 ± 1.81 a |
| 17 | 10.79 ± 1.43 ab, A | 26.15 ± 1.68 b, B | 36.67 ± 2.90 b, C | |
| 30 | 8.73 ± 1.10 c, BC | 26.08 ± 1.56 bc, B | 38.63 ± 3.70 b, B | |
| 44 | 9.89 ± 0.49 abc | 24.47 ± 1.36 bc, B | 35.80 ± 1.88 b, B | |
| 62 | 9.27 ± 0.75 bc, B | 23.08 ± 2.21 c, C | 34.62 ± 2.50 b, C | |
| Significance | ** | *** | *** | |
| 15% CO2 | 0 | 11.56 ± 0.11 a | 34.35 ± 1.05 a | 50.60 ± 1.75 a |
| 17 | 9.72 ± 0.66 ab, AB | 27.34 ± 2.36 bc, B | 41.04 ± 3.06 bc, B | |
| 30 | 9.15 ± 0.72 b, B | 24.07 ± 2.46 c, BC | 36.85 ± 3.78 c, BC | |
| 44 | 10.39 ± 1.58 ab | 29.18 ± 3.73 b, A | 44.58 ± 4.89 ab, A | |
| 62 | 10.86 ± 1.49 ab, AB | 26.45 ± 1.48 bc, B | 39.83 ± 2.33 bc, B | |
| Significance | * | *** | *** | |
| 25% CO2 | 0 | 11.24 ± 0.29 ab | 36.20 ± 0.30 a | 52.90 ± 1.17 a |
| 17 | 10.67 ± 1.04 b, A | 30.59 ± 2.30 c, A | 45.45 ± 2.22 b, A | |
| 30 | 12.90 ± 0.90 a, A | 34.99 ± 1.63 ab, A | 46.91 ± 2.36 b, A | |
| 44 | 10.68 ± 0.64 b | 32.23 ± 2.99 bc, A | 44.86 ± 3.68 b, A | |
| 62 | 11.88 ± 0.30 ab, A | 33.85 ± 0.90 abc, A | 45.20 ± 1.11 b, A | |
| Significance | ** | ** | *** | |
| Significance | 17 | * | *** | *** |
| 30 | *** | *** | *** | |
| 44 | NS | *** | *** | |
| 62 | * | *** | *** | |
| Condition | Storage Time (Days) | Organic Acid Content (mg/g FW) | |||
|---|---|---|---|---|---|
| Citric | Tartaric | Malic | Shikimic | ||
| Air control | 0 | 9.03 ± 0.10 a | 0.51 ±0.02 ab | 0.67 ±0.05 a | 0.030 ±0.004 a |
| 17 | 7.22 ± 1.00 ab, B | 0.40 ± 0.07 bc, AB | 0.36 ± 0.10 b | 0.017 ± 0.001 b | |
| 30 | 6.79 ± 0.99 b, B | 0.38 ± 0.06 c, B | 0.38 ± 0.03 b | 0.015 ± 0.001 b, B | |
| 44 | 7.88 ± 1.09 ab | 0.43 ± 0.06 bc | 0.32 ± 0.03 b, AB | 0.016 ± 0.002 b, AB | |
| 62 | 8.13 ± 1.53 ab | 0.56 ± 0.10 a | 0.43 ± 0.05 b, A | 0.014 ± 0.001 b, AB | |
| Significance | * | ** | *** | *** | |
| 5% CO2 | 0 | 8.90 ± 0.10 ab | 0.55 ± 0.07 | 0.66 ± 0.53 a | 0.024 ± 0.000 a |
| 17 | 9.11 ± 1.38 a, A | 0.50 ± 0.10 A | 0.42 ± 0.11 b | 0.019 ± 0.002 b | |
| 30 | 7.43 ± 1.03 b, B | 0.44 ± 0.06 AB | 0.35 ± 0.01 b | 0.016 ± 0.001 c, B | |
| 44 | 8.28 ± 0.44 ab | 0.46 ± 0.04 | 0.43 ± 0.03 b, A | 0.018 ± 0.001 bc, A | |
| 62 | 7.91 ± 0.77 ab | 0.48 ± 0.03 | 0.42 ± 0.05 b, A | 0.016 ± 0.002 c, A | |
| Significance | * | NS | *** | *** | |
| 15% CO2 | 0 | 9.13 ± 0.13 | 0.57 ± 0.03 a | 0.70 ± 0.04 a | 0.023 ± 0.000 a |
| 17 | 8.23 ± 0.51 AB | 0.34 ± 0.04 b, B | 0.31 ± 0.04 b | 0.019 ± 0.001 b | |
| 30 | 7.75 ± 0.71 AB | 0.43 ± 0.04 ab, AB | 0.36 ± 0.05 b | 0.016 ± 0.002 bc, AB | |
| 44 | 7.86 ± 1.51 | 0.48 ± 0.15 a | 0.40 ± 0.16 b, A | 0.015 ± 0.002 c, AB | |
| 62 | 8.27 ± 1.26 | 0.49 ± 0.06 a | 0.33 ± 0.09 b, B | 0.013 ± 0.002 c, B | |
| Significance | NS | * | *** | *** | |
| 25% CO2 | 0 | 9.11 ± 0.07 a | 0.54 ± 0.03 a | 0.71 ± 0.02 a | 0.03 ± 0.000 a |
| 17 | 8.04 ± 0.49 b, AB | 0.43 ± 0.07 bc, AB | 0.34 ± 0.05 b | 0.018 ± 0.000 b | |
| 30 | 8.72 ± 0.55 ab, A | 0.48 ± 0.06 ab, A | 0.34 ± 0.05 b | 0.019 ± 0.002 b, A | |
| 44 | 7.12 ± 0.69 c | 0.37 ± 0.06 c | 0.26 ± 0.04 c, B | 0.015 ± 0.001 c, B | |
| 62 | 8.52 ± 0.32 ab | 0.50 ± 0.04 ab | 0.28 ± 0.02 bc, B | 0.014 ± 0.001 c, AB | |
| Significance | *** | ** | *** | *** | |
| Significance | 17 | * | * | NS | NS |
| 30 | * | . | NS | * | |
| 44 | NS | NS | * | * | |
| 62 | NS | NS | ** | . | |
Publisher’s Note: MDPI stays neutral with regard to jurisdictional claims in published maps and institutional affiliations. |
© 2021 by the authors. Licensee MDPI, Basel, Switzerland. This article is an open access article distributed under the terms and conditions of the Creative Commons Attribution (CC BY) license (https://creativecommons.org/licenses/by/4.0/).
Share and Cite
Smrke, T.; Cvelbar Weber, N.; Veberic, R.; Hudina, M.; Jakopic, J. Modified Atmospheric CO2 Levels for Maintenance of Fruit Weight and Nutritional Quality upon Long-Term Storage in Blueberry (Vaccinium corymbosum L.) ‘Liberty’. Horticulturae 2021, 7, 478. https://doi.org/10.3390/horticulturae7110478
Smrke T, Cvelbar Weber N, Veberic R, Hudina M, Jakopic J. Modified Atmospheric CO2 Levels for Maintenance of Fruit Weight and Nutritional Quality upon Long-Term Storage in Blueberry (Vaccinium corymbosum L.) ‘Liberty’. Horticulturae. 2021; 7(11):478. https://doi.org/10.3390/horticulturae7110478
Chicago/Turabian StyleSmrke, Tina, Nika Cvelbar Weber, Robert Veberic, Metka Hudina, and Jerneja Jakopic. 2021. "Modified Atmospheric CO2 Levels for Maintenance of Fruit Weight and Nutritional Quality upon Long-Term Storage in Blueberry (Vaccinium corymbosum L.) ‘Liberty’" Horticulturae 7, no. 11: 478. https://doi.org/10.3390/horticulturae7110478