Review

Sap Analysis: A Powerful Tool for Monitoring Plant Nutrition

by
Eduardo Esteves
1,
Guilherme Locatelli
1,
Neus Alcon Bou
1 and
Rhuanito Soranz Ferrarezi
2,*
1
Indian River Research and Education Center, University of Florida, 2199 S Rock Road, Fort Pierce, FL 34945, USA
2
Department of Horticulture, University of Georgia, 1111 Plant Sciences Bldg, Athens, GA 30602, USA
*
Author to whom correspondence should be addressed.
Horticulturae 2021, 7(11), 426; https://doi.org/10.3390/horticulturae7110426
Submission received: 29 August 2021 / Revised: 12 October 2021 / Accepted: 20 October 2021 / Published: 22 October 2021
(This article belongs to the Special Issue Recent Advances in Nutrition and Fertilization of Horticultural Crops)

Abstract

:
Horticultural crop production is moving towards an era of higher nutrient use efficiency since nutrient deficiencies can reduce plant growth, productivity, and quality, and overfertilization can cause environmental pollution. Rapid nutrient concentration diagnostic is essential to minimize the negative effects of Huanglongbing (HLB) or citrus greening in citrus by providing the required nutrients before deficiency symptoms appear, reducing the impact of the disease on crop production. Sap analysis is an additional tool for fine-tuning nutrient applications in citrus. The main objective of this paper is to review the different methodologies and results obtained with sap analysis, considering its potential application in citrus production. Results from other crops show the pros and cons of using this tool. Substantial research has been conducted on vegetables and greenhouse crops, but few studies are available on perennial species such as citrus. Inconsistency in the extraction and analysis methods and the lack of specific sufficiency ranges for citrus open the path for further studies. Along with soil and leaf analyses, sap analysis is a complementary technique that can improve nutrient use efficiency in citrus production. Moreover, sap analysis has the potential to optimize fertilizer application, minimize environmental impacts and improve sustainability.

1. Introduction

Horticultural crops such as fruits and vegetables require optimized irrigation and fertilization strategies to achieve high yield and quality [1,2,3,4]. Enhanced nutrition is a viable strategy to keep citrus (Citrus spp.) trees productive and the growers in business in the Huanglongbing (HLB) or citrus greening era [5,6,7,8,9,10,11]. However, some growers are applying more nutrients than needed to compensate for the negative effects of HLB [12,13,14,15,16]. An excessive fertilization strategy can reduce profitability and damage the environment due to groundwater contamination, eutrophication, and change in microbial dynamics [2,12,17,18,19]. Citrus production and agriculture in general are moving towards more precise nutrient management, where optimized and more efficient techniques are taking place [3,10,20,21]. To optimize citrus nutrition and nutrient supply, it is essential to understand the crop nutrient requirements and have real-time diagnostic tools to determine the current nutrient status inside the plant. In this scenario, leaf and soil nutrient analysis are standard tools to assess the nutrient status of citrus trees [14,22,23,24], but the nutrients contained in the leaf tissue may reflect an accumulation during the plant’s entire cycle or season, rather than indicating the real-time concentration that is available for plant development, especially with elements such as Ca and B, which are unlikely to be remobilized once they are incorporated into the plant tissue [25,26,27]. This also applies to elements such as N, which may need more sensitive methods to determine real-time changes [2,19,27,28,29,30]. In this scenario, more precise monitoring tools and techniques are required.
Plant sap analysis is an option for determining plant nutrient status. Some authors define sap as the liquid portion extracted from xylem and phloem, plus the apoplastic, cytosolic, and vascular fluids [19,29,30,31], although there is no consensus yet in the scientific community about this definition. Researchers consider sap as fluids from conductive tissues [26], either xylem, phloem, or a mix [19,29,30,31]; others describe sap as the xylem fluids [32,33,34]; and several consider sap as just the phloem fluids obtained by insect stylectomy [35,36,37]. Nevertheless, the nutrients found in sap are readily available for the plant’s development [26,28]; therefore, sap analysis is compared as a tree “blood test”.
Plant sap analysis provides an early determination of the plant nutrient status since it relies on real-time information [1,28,29,38,39,40]. Plant mineral levels, nutritional deficiencies, and excesses could be determined before they cause any damage to plant development and consequently fruit yield [26,28]. Different sap analysis methods are available, and some private companies and commercial laboratories compare sap of new vs. old leaves. In addition to the regular macro and micronutrient indicators that leaf analysis provides, some laboratories include NO3-N and sugar content in their reports. These two parameters can provide information on the plant metabolism, if N is being transformed rapidly into proteins, or if there are high levels of soluble N resulting in increased water uptake and dilution of sugar levels, which could increase pest and disease attack [11,41,42]. Furthermore, sap analysis provides the opportunity for growers to adjust fertilization and apply the specific amount of nutrients needed, not only for plant nutrition but also for improving environmental sustainability.
The first reports and attempts to study the effects of fertilization on sap composition were performed in the U.S. by Dr. Pettinger and Dr. Arnon in the 1930s [43,44]. The early publications on measuring and interpreting plant sap dates were generated in Europe in the 1970s [25,45]. In Florida, there is vast experience with sap analysis, especially for vegetable and greenhouse crops. Dr. George Hochmuth (Emeritus Professor, University of Florida) conducted numerous sap testing and interpretation studies, emphasizing portable devices and quick testing [31,46,47,48].
In recent years, plant sap analysis is receiving more attention in citrus [43,44] because it can assess plant nutrient uptake more precisely, increase fertilizer efficiency, reduce environmental constraints, enhance fruit quality, and improve disease management [1,26,40,49]. The analysis is not considered an alternative to leaf analysis but a complementary tool for nutrient and disease management [1,19,26,38,39,40,50]. Research indicates that HLB-affected citrus trees have lower nutrient concentrations in leaves than healthy trees [6,44,48,49]. Sap analysis can rapidly determine nutrient deficiencies and guide the application of the required nutrient accordingly during each phenological stage.
However, sap analysis has its limitations. The availability of different equipment and methodologies introduces variabilities and inaccuracies to the results, reducing the reliability of the information [1,50]. According to [51], there is a gap between sample collection, chemical analysis, and nutrient supplementation in sap analysis. Future research should standardize the sampling and extraction methodology, establish reference levels for each nutrient, and develop correlations with yield and fruit quality variables. Some private companies and laboratories have developed sufficiency ranges and interpretation charts for some crops; however, many of these laboratories do not disclose their methods and/or reference levels, making it harder for growers and scientists to compare results. This is critical for sap analysis since the results are affected by different factors. A large portion of the studies focused mainly on N and greenhouse crops [2,28,29,47]. Still, little research has been conducted with micronutrients, which seem to alleviate the effect of plant diseases such as HLB in citrus [6,15,16].
Our objective with this publication is to review the different methodologies and results obtained with sap analysis, considering the potential application of this nutrient management technique in citrus. Additionally, we suggest some research ideas, as sap analysis could become another tool for improving citrus nutrition and nutrient use efficiency. If plant sap analysis is combined with soil and leaf analysis as a management tool, growers will have access to a more robust approach to assess citrus nutrition and address many current and future challenges, increasing fruit yield and juice quality, enhancing fertilizer application, increasing revenue, and reducing environmental impacts.

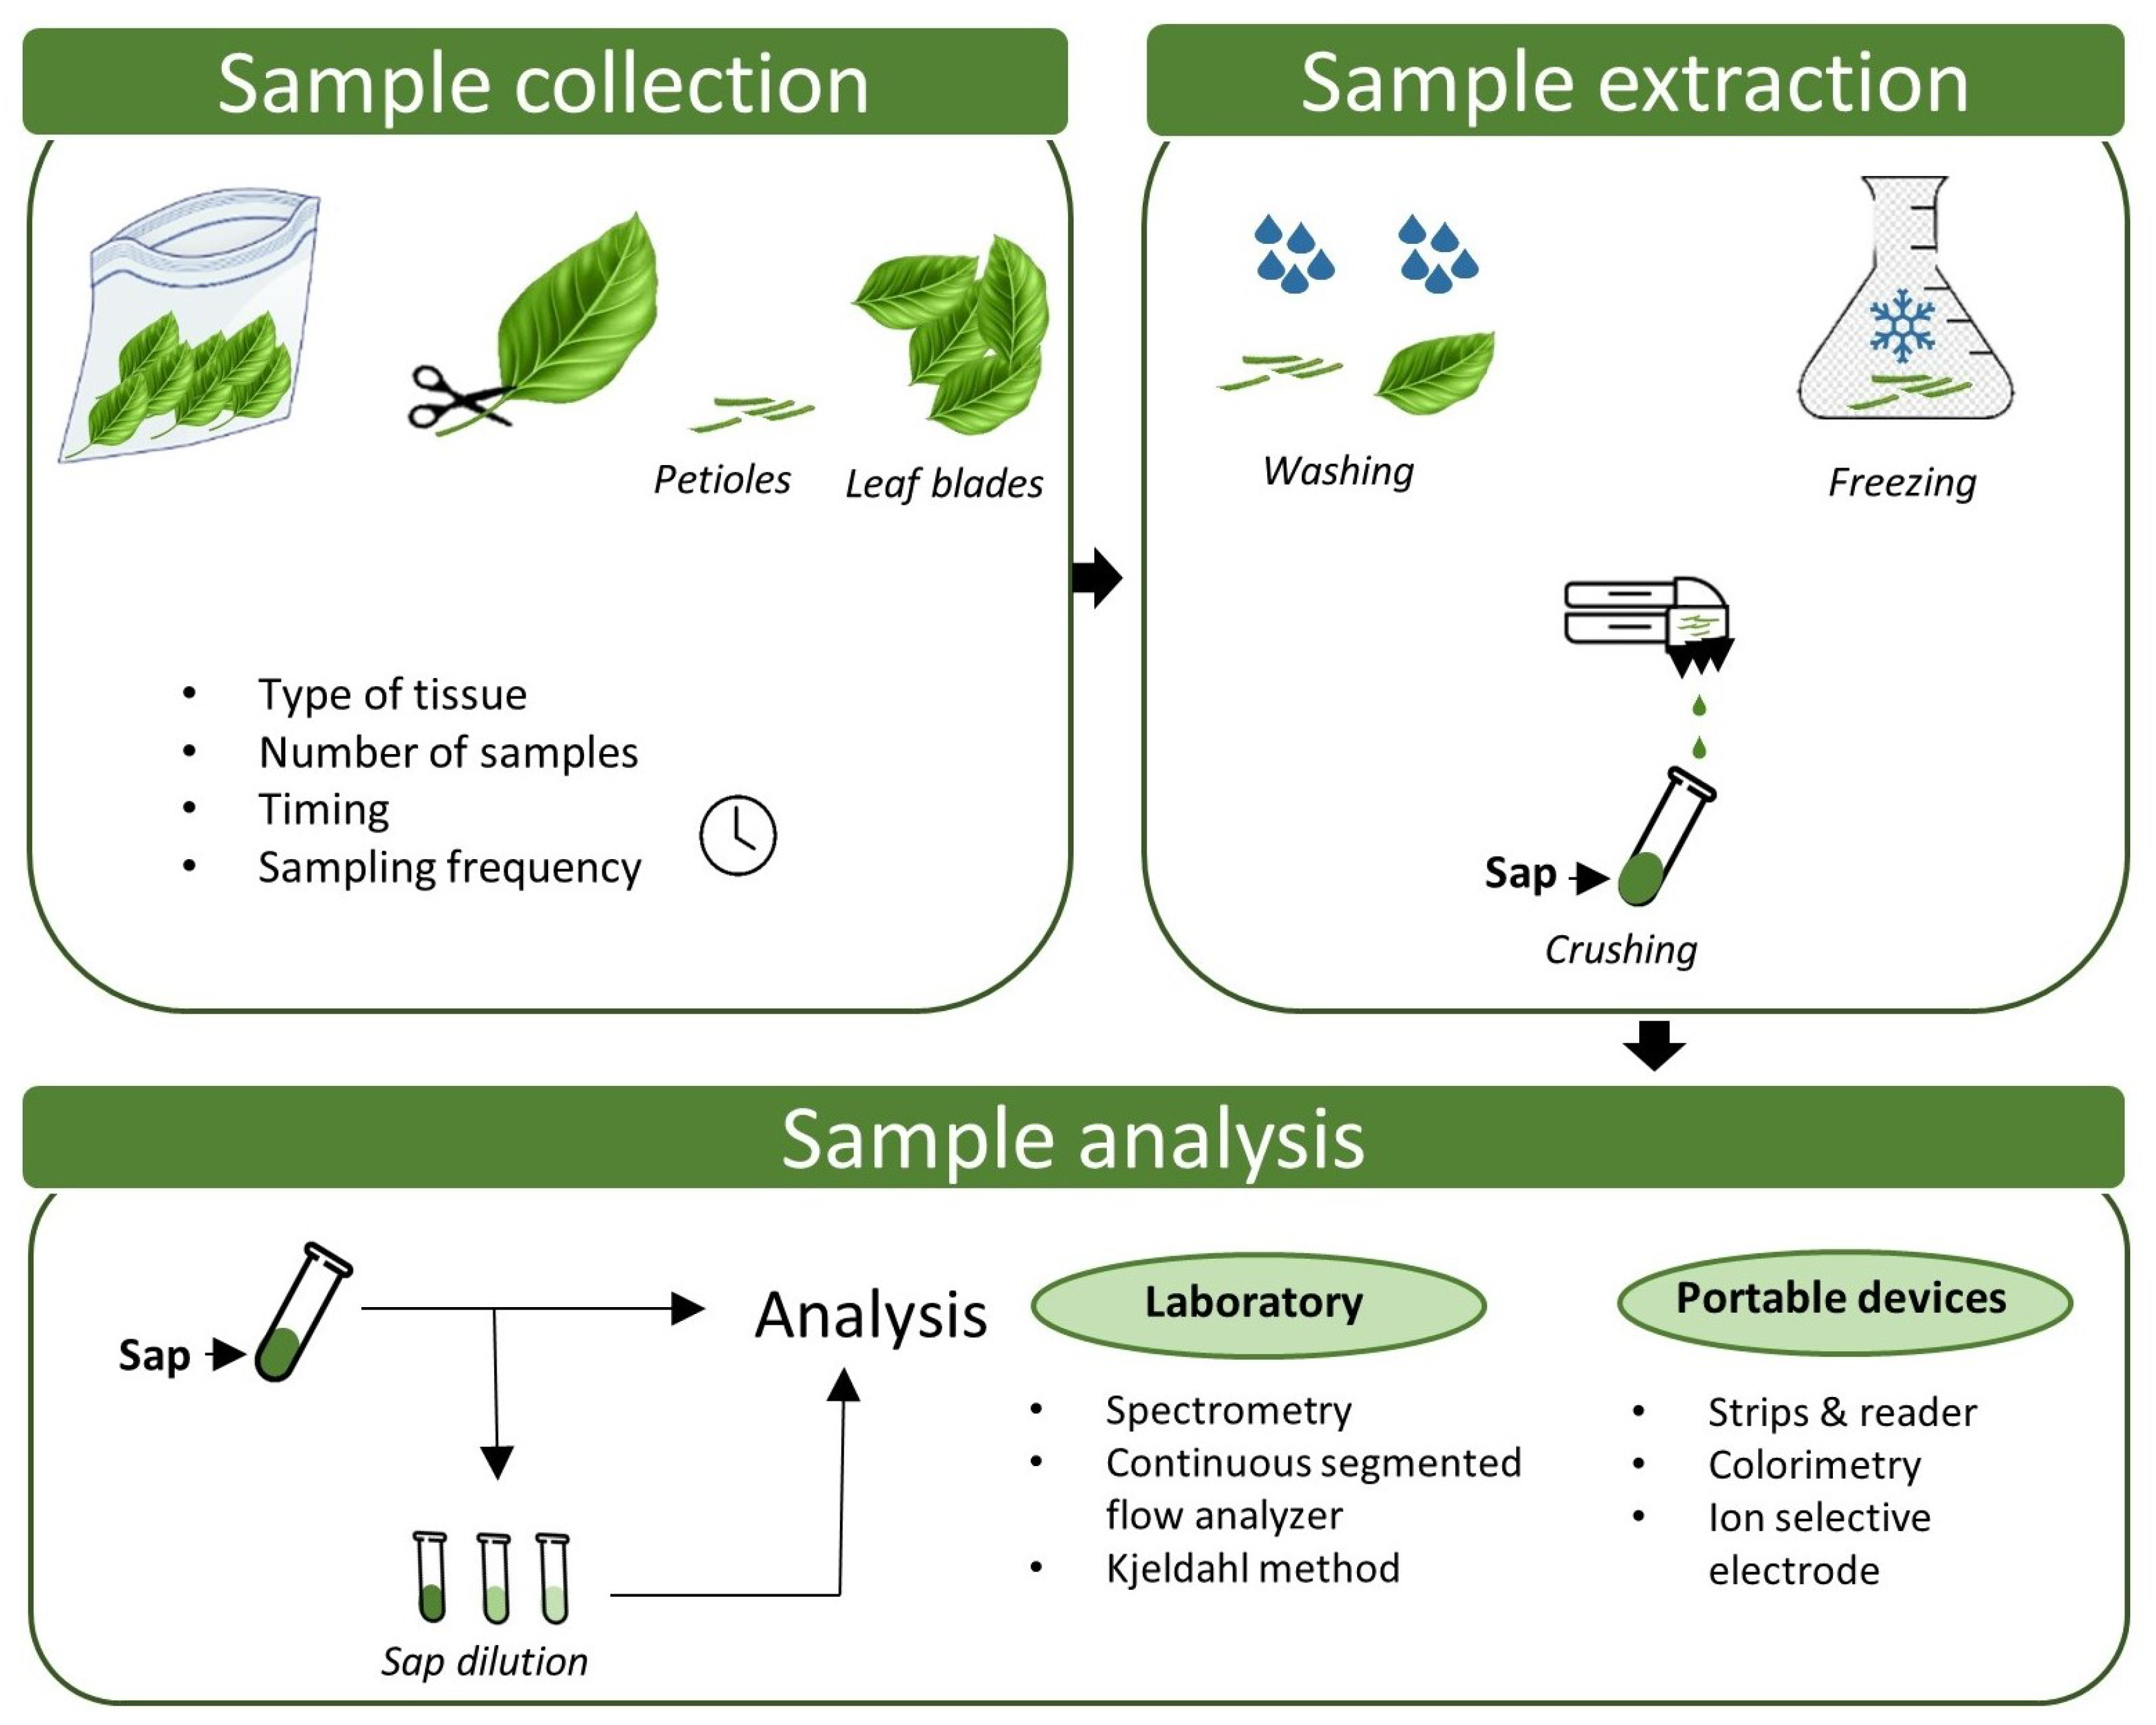
2. Procedures for Sap Analysis

Plant sap analysis is an operationally defined method, meaning that the analysis results will highly depend on the chosen methodology since it has not been standardized. There is still no consensus among the scientific community regarding a unique sap analysis methodology for sample collection, tissue type (petioles, shoot tips, and leaf blades), pressing equipment, sap extraction, or fluids analyses [19,27,28,34,47]. Therefore, our goal is to describe the different definitions and methodologies involved in sap analysis so that readers and the scientific community can have a baseline to start defining a general, standardized, and consented methodology. There are three main steps in the sap analysis: sample collection, sap extraction, and sap analysis (Figure 1).

2.1. Sample Collection

The sample collection is a critical activity that requires specific considerations. The sampling strategy must consider and separate potential differences typically found in groves, such as soil types, cultivars, and management practices [26]. The samples should be taken at a similar stage within the same group of well-watered trees because sap nutrient concentration may vary depending on the crop stage, some of them declining with the growth stage and time [26,27,39,49,52]. At the sample collection, we should consider the type of tissue and timing.

2.1.1. Type of Tissue

The type of tissue sampled might impact the results obtained [1,38,39,40,50]. Most authors have used petioles as the sampled tissue, usually taking the petioles from the most recent fully expanded leaf [2,19,28,29,30,34,40,53,54]. Instead of using petioles, in [55] and [56], the leaf blade midribs were used for sap analysis in broccoli (Brassica oleracea) and sugar cane (Saccharum officinarum), respectively, while in [52], the use of leaf blade vs. petioles was compared for sap analysis in strawberries (Fragaria × ananassa). In [57,58,59], leaf blades for sap analysis was recommended, which is becoming an interesting adaptation of the method by private companies in the Netherlands [19].
There are different approaches depending on the crop to be sampled regarding the number of leaves/petioles for each sampling unit. For potatoes (Solanum tuberosum) and tomatoes (Lycopersicon esculentum), some studies reported around 20–25 leaves and petioles from the most recent fully expanded leaves [29,40,60]. In strawberries, researchers have reported the need for 60 to 100 leaves and petioles [52,53,59], while grapevines (Vitis spp.) may require about 200 [61]. The number of tissue samples may also be a function of the nutrient to be measured and the methodology. [30] reported the need for 22, 3, and 113 tomato petioles when analyzing NO3-N, Cl and H2PO4, respectively. The number of leaves/petioles for each sampling unit might be a function of different factors, including site-specific conditions. We propose collecting 30 to 60 whole citrus leaves (including petioles) for extracting enough sap for one sample—suggesting no more than three leaves per tree—and a separate analysis of each sample. This coincides with the methodology used by [57] and [58], who took 40 leaves when working with sweet orange (Citrus sinensis) cultivars.
Nowadays, some commercial laboratories offer an analysis comparing old to new growth, especially for a nutrient mobility assessment. In citrus, an old leaf is considered a dark-green, active leaf and distant from the growing point. A new leaf would be fully expanded, but from the latest flush, located close to the growing point and with a light green color. Few authors have followed this approach of collecting old and new growth [58]. Most of the published work related to sap analysis has been focused on N and mostly in greenhouse crops, taking the most recent fully expanded leaves and petioles [2,19,28,29,39,40,53,55,56,60]. It is well known that N is a mobile element inside the plant, moving from old to new growth. These are probably valid reasons why most published work has not compared old and new growth results. However, in [29], the limitation of sap analysis to show a decrease in plant N accumulation later in the crop cycle if the petioles are always collected from the top part of the plant (new growth) is highlighted. Furthermore, N should not be the only element of interest in sap analysis, as there are other essential nutrients with low mobility inside the plant, such as Ca and B [62], which may benefit from an old vs. new growth comparison. The nutrient assessment of perennial crops could be improved with this perspective.

2.1.2. Timing and Frequency

Consistency is a critical aspect of plant sap sampling since both the time of day and the frequency should remain constant for comparing the results. The time of day is an essential factor, as nutrient concentrations may vary throughout the day. In wheat (Triticum aestivum), sampling before and after 2 pm showed a 10% and 40% difference for K and Fe sap concentrations, respectively, with higher values in the afternoon [35]. In another experiment with tomatoes, higher NO3-N, NH4+, and H2PO4-P sap values were also found in the afternoon [34]. However, in ‘Sultana’ grapevines, K levels were 50% lower in the afternoon [61]. In potato, sap NO3-N levels tended to increase at noon and mid-afternoon, decreasing later at night [60]. As the timing for collecting sap samples has also been inconsistent among different studies, some methodologies suggested collecting leaves before 10 am (generally between 7 and 10 am) in crops such as sweet peppers (Capsicum annuum) and broccoli [2,28,55]. In contrast, others preferred tomato leaves to be collected from 10 to noon [29] or even in the afternoon [62]. The fluctuations in nutrient concentration are probably associated with leaf water potential variations; therefore, morning hours may be suggested for sap sampling, as this would minimize variability [60].
The sampling frequency is another factor to consider. Results have indicated that sap N levels may remain constant during the crop cycle, suggesting that sampling could be carried out just once during a crop cycle. When working with sweet pepper in greenhouse conditions, petiole sap NO3-N content remained relatively stable throughout the crop cycle [2]. Similar results were found in muskmelon (Cucumis melo) and tomatoes [39]. However, when dealing with open field conditions, the nutrient levels may increase or decrease depending on the crop stage, as supported by [26,31,52]. Frequent and low N dosing, combined with fertigation and drip irrigation, may contribute to a constant petiole sap NO3-N content through the crop cycle in greenhouse conditions [2,19,39,49]. According to [29], the sap test could show steady N concentrations because the petioles are always collected from the top of the plants (new growth), forcing samples to be taken from old and new growth. Therefore, it may be inferred that perennial crops in open field conditions may require more than one sampling per season. For citrus, the sampling frequency would depend on the market and the variety. Fruit quality monitoring for the fresh industry, e.g., mandarins (Citrus reticulata), grapefruit (Citrus × paradisi), and sweet oranges, would require more frequent sampling throughout the season.

2.2. Sample Extraction

After the samples have been collected, they should be kept cool, prevented from desiccation, and processed within the first 24 h to avoid degradation, leading to inaccurate results and wrong interpretations [26].
Sampled tissue could be sliced into 0.5 cm pieces, submerged into ether (98% v/v), and put into a freezer for at least 2 h [25]. The rationale for freezing is to crystalize the tissue and help obtain the fluids in the latter pressing, as NO3-N and K release increased when petioles were frozen [61]. As chlorophyll could interfere with the analysis, the ether is used for sap extraction. Later, the sample is defrosted, and the ether and chlorophyll solution (green colored fluid) is separated from the sap by a funnel. This methodology was followed by [27,30,56,57,58]. Some authors also froze and defrosted tissues before pressing, but they did not mention the use of ether in their methods [28,53]. Other studies treated their samples without freezing and conducted pressing/crushing immediately [19,31,54,55,60].
When pressing/crushing is part of the methodology, the press/crusher should be made of PVC, stainless steel, or even nylon to avoid cross-contamination with metallic elements [26]. While using petioles as the sampled tissue, some authors sliced the petioles in 5–10 mm pieces and then pressed tomato and sweet pepper tissues in a stainless steel garlic crusher [19,28,54]. A similar methodology was followed by [2], collecting larger petioles (1 cm slices) in sweet pepper and using a garlic press for sap analysis. However, cutting and/or washing pieces of petioles may reduce the N and K sap concentrations in muskmelon and sweet pepper than pressing the whole petiole [54], which shows the importance of standardizing the sap sample extraction. Instead of using a garlic press, other studies used a hydraulic press for crushing the tissues [26,27,30]. Besides pressing/crushing, other interesting methods include using a Pasteur pipette for collecting sap [34] or using aphid stylectomy to obtain the fluid [35,63]. The authors of this review have tried pressing citrus leaf petioles and blades with a garlic press without success. The garlic crusher seems to be more effective with leaves and petioles that are ‘fleshier’, such as tomatoes, sweet peppers, or potatoes; however, citrus leaves might require a hydraulic press or another type of extraction. It would be important to quantify and set a standard pressure for citrus leaves to standardize the methodology.

2.3. Sample Analysis

The plant sap analysis could be performed by a laboratory with specialized equipment or by the user/grower with portable devices. Nevertheless, before any analysis, a dilution may be required. Typically, the sap is diluted because the nutrient concentration exceeds the measurement range of the device [49,50], but also the green chlorophyll color may interfere with the measurement of colorimetric devices [48]. A compilation of different dilution ratios for each nutrient is listed in Table 1.
Portable devices are usually a faster and cheaper method for obtaining results [31,40,64]. When using some ion-selective strips, a color reagent is added to the pressed sap, and the color is compared with a standard chart color that indicates different levels (low, medium, and high) [62]. These strips could also be analyzed with a reader based on reflectometry, which upgrades the method from semiquantitative to quantitative [48,65]. Around 1990, a battery-operated handheld ion-selective electrode was introduced, which directly measured sap without the need for dilutions and/or color reagents [50]. With these portable devices, many reference levels and sufficiency ranges were developed. The University of Florida has used petiole-sap testing for vegetable crops in Florida with mobile devices. Studies include N and K sufficiency ranges for tomatoes, sweet peppers, strawberries, and watermelons (Citrullus lanatus), but not for citrus [31,47]. Some publications compile and describe the handheld devices available for measuring petiole sap NO3-N in potatoes, including their brand names, pros, and cons [40]. The accuracy of a portable ion-selective electrode was compared to a laboratory method for sap NO3-N analysis. The studies concluded that this device was sufficiently accurate to guide on-farm decisions [66]. However, other authors suggest using strips instead of electrodes for NO3-N evaluation in vegetables [65]. This portable equipment could give real-time and on-site data; however, they have limitations. For example, according to [50], fouling the ion-selective membrane of an electrode meter can cause inaccuracies that would add more limitations to sap analysis.
Moreover, organic compounds and ions such as Cl could interfere with the electrode measurement, reducing the accuracy [65]. Likewise, when using test strips, it is possible that the high dilution rate, in addition to other ions or substances, may affect the results [61,66]. These quick analyses should be used carefully, with results compared against laboratory check analysis and using equipment calibrated and serviced regularly [49,66].
On the other hand, there are several non-portable methods for analyzing the sap extract (Table 1). While in [26,27,34], atomic absorption spectrophotometry and [30] used high-performance liquid chromatography were used, others [56] used the Kjeldahl method for inorganic forms of N and sulfuric digestion and distillation for the rest of the nutrients. A plasma spectrometer has also been used to analyze sap in citrus [43], while in [2,33], a continuous segmented flow analyzer was used to measure sap levels from tomato and sweet pepper, respectively.
The vast range of methods for each step is evident. The differences in methodologies make it more challenging when interpreting results, developing reference levels, and spreading the concept among users/growers. The accuracy and precision may differ from method to method and the turnaround time for obtaining the results.

3. Sap as a Potential Nutrition Index for Citrus

An adequate fertilizer application requires knowledge of the crop’s nutrient requirement. Soil and leaf analyses are needed to develop a nutrient management plan and follow the best management practices [62]. However, the nutrient concentrations in the crop tissue and the interpretation of results may differ from crop to crop, even among cultivars within the same crop.
Studies have measured sap nutrient levels for ‘Valencia’ and ‘Hamlin’ sweet oranges, and the results are shown in Table 2 [57]. These are not meant to be sufficiency ranges but just an idea of how citrus sap nutrient levels vary. For example, citrus sap NO3-N values may be lower compared to other crops. Some vegetables, such as pepper or eggplant, have NO3-N reference levels above 1000 mg L−1 [2,26,31], while in [58], 223 mg L−1 was reported as the highest value in their study with ‘Pera’ sweet oranges. According to [57], NO3-N represents no more than 5% of the total N in citrus, and this could happen because citrus has a high NO3-N reduction rate. Therefore, higher NO3-N values in citrus sap could indicate health or metabolic issues.
Sap nutrient concentration could be a function of many factors, such as sampling stage and cultivar. The crop sampling stage may affect sap P levels, as these are reduced after fruit set in nectarines (Prunus persica var. nucipersica) and some vegetables [26]. This finding is also supported by [30], who found that sap P levels in tomatoes had a coefficient of variation of 71% through the crop cycle, compared to 9% for K and 11% for NO3-N. This suggests that the sap P levels may vary significantly through the crop cycle, even in controlled environmental conditions. Moreover, when sampling different cultivars from the same crop, substantial differences may arise. In sweet orange cultivars, sap P levels could vary considerably, as in [57], the presented P sap values were ten times higher in ‘Pera’ oranges than ‘Hamlin’ and ‘Valencia’ [58], even when both experiments followed similar methods. In addition, sap P levels were affected by P fertilization treatments in the ‘Valencia’ cultivar but not in ‘Hamlin’ [57], suggesting the strong influence of the cultivar.
In nutrient assessment, sap analysis could be a more sensitive tool than leaf analysis in citrus. When supplying Zn and Mn as fertilizers to ‘Pera’ sweet orange trees, in [58], a 2-fold increase with Zn and a 3-fold increase with Mn in leaf nutrient concentrations were found with leaf analysis. However, with sap analysis, they found a 5-fold increase with both Zn and Mn. Sap analysis could also indicate interactions that may be hidden in the leaf analysis. Researchers obtained significantly lower sap P levels with a Zn fertilization treatment when compared to Mn fertilization in ‘Pera’ sweet oranges [58]. This could be explained by the well-known negative interaction between Zn and P [62]. When checking correlations, sap NO3-N was negatively correlated with both sap Cu (−0.93) and leaf Cu (−0.91) [58]. The other correlations between leaf and sap nutrients were not significant (p > 0.05), which supports the idea that leaf analysis could indicate the nutrient accumulation, while sap analysis could provide the real-time nutrient availability inside the plant. Nevertheless, research is still needed for considering sap analysis as a supplemental tool for nutrient management in citrus, especially when looking for reference levels and understanding how these levels are influenced by different types of soil, climate, and management.
Limited research has been published in citrus sap analysis, especially related to result interpretation. Further studies should establish sufficiency ranges for sap measurements in citrus (both HLB-affected and non-affected) to allow precise crop production since there is the potential for optimizing fertilizer application by interpreting data from plant sap analysis. Citrus nutrient management can be improved significantly by combining soil test, leaf, and plant sap analysis.

4. Sap as a Nutrition Index for Other Crops

Unlike citrus, sap analysis has been studied in vegetable crops and some perennials in recent years. Many studies have focused on optimizing crop N management since this technique is susceptible to NO3-N changes in the crop [29,39,40,53,56]. However, the materials and methods varied with each experiment.

4.1. Vegetables

Tomato is probably the crop with the highest number of publications related to sap analysis. Most of these studies aimed to fine-tuning N fertilization in controlled environments. In a fertilization experiment with different N rates, in [29], the N rate and the type of fertigation and irrigation systems affected the sap NO3-N concentration. Similar results were obtained by [55] with broccoli. The authors reported that sap analyses successfully assessed crop N status, creating a management tool for N fertilization.
The different fertilization rates or the irrigation system could influence the sap values and the soil or substrate used to sustain the crop. Lower P sap concentrations were found in tomatoes when grown in a soil and sand substrate compared to Rockwool [26]. Apparently, P fixations/reactions in the soil caused the lower sap P levels, as these reactions did not occur in the Rockwool. One of the most interesting findings in the same experiment was the competition between NO3-N vs. Cl and Ca2+ vs. Mg2+ at the sap level, meaning that the supply of one of these nutrients could impair the uptake of the other and vice versa. This finding is also supported by other authors [30,67].
Sufficiency levels may not be easy to define and might require taking several samples from different cultivars, soils, management regimes, etc. Nowadays, there are emerging methods for determining sufficiency values. Studies have determined N reference values by equations describing the relationship between petiole sap NO3-N and the Nitrogen Nutrition Index (NNI) in crops such as tomato, muskmelon, and sweet pepper. To calculate NNI, a critical N curve related to the dry weight of the crop is needed [2,39]. As a reference for vegetable sap nutrient values, sap sufficiency levels for two tomato crop stages are compiled in Table 3.
The N accumulation in tomato biomass was highly correlated with the petiole sap NO3-N concentration in the leaves during the crop cycle [29]. Moreover, the sap NO3-N results with portable devices have matched laboratory analyses across the full range of NO3-N concentrations examined. Therefore, studies concluded that sap analysis is a practical method to assess crop N status, and petiole sap NO3-N is preferable to leaf N content as it gives a real-time assessment of crop N status and can be analyzed with quick on-site tests. However, high sap NO3-N concentrations could result from NO3-N excess in the soil solution due to the high N supply at a specific event or time point [30,39]. If these results are not contrasted with other analytical methods like leaf analysis, they could provide a misleading interpretation of excess N in the crop. Thus, the importance of keeping both leaf and sap analysis as complementary tools for nutrient assessment is highlighted.
Sap analysis has also been evaluated in potatoes, especially for N nutrition, as some researchers found it highly correlated with the rate of N-fertilizer applied [60,64]. Other studies have compared different methods for N assessment, including sap analysis and chlorophyll meters. The chlorophyll meters tend to indicate the N assimilation; however, they do not detect luxury N consumption in potatoes, as opposed to the sap analysis [40]. Moreover, the sap analysis seems to be a more sensitive tool to differentiate fertilization rates at different stages [51]. Even though sap analysis results are highly dependent on external factors (cultivar, soil, fertilizer supply, and weather), sap analysis seems to be a more accurate method to assess N status in potatoes than chlorophyll meters [40,65]. Additionally, sap analysis provides a more holistic assessment in terms of plant nutrition.

4.2. Strawberry

Sap analysis has been studied extensively in strawberries. In [59], authors correlated dry leaf weight and leaf sap, and found that sap NO3-N was not significantly correlated with leaf NO3-N, and the same result was found for Cl, B, Zn, and S. It is not surprising that leaf and sap NO3-N are not correlated, as the NO3-N is rapidly reduced and transformed into proteins, once is taken up by plants [68]. NH4+, P, K, Mg, Ca, Fe, Mn, and Cu were significantly correlated. However, B and Zn may not be correlated due to their low mobility inside the plant [62], allowing sap analysis to assess immobile nutrients more accurately. Strawberry reference levels from different authors are shown in Table 4. Although some values are in a similar range, others may differ due to different methodologies and/or cultivars.
When interpreting sap analysis results, it is advisable to look for possible interactions among nutrients. As mentioned previously, Cl vs. NO3-N is a good example, as there is an interaction in which a reduced NO3-N uptake takes place when high amounts of Cl are available in the soil [26,30,67]. This is important because a nutrition approach using either water or fertilizers high in Cl could lead to N deficiencies in the crop [67]. Another interesting interaction occurs between K and Ca. In [70], a strawberry trial was conducted in Spain from November to May, applying three different soil preplant treatments: NPK, NPK + manure, and NPK + manure + gypsum + dolomite. Leaf and sap samples were collected for analysis at 8,12, 19, and 23 weeks after planting. The sap results showed an interaction between K and Ca, as the treatment having no Ca (NPK) had higher K sap levels when compared to the other two treatments. Sap analysis could become a valuable tool for tracking fruit quality as the K:Ca ratio influences fruit quality in strawberries [71].

4.3. Grapevine

Another crop studied regarding sap analysis and nutritional diagnosis methods is grapevine. After working with sap analysis in different fertilization levels, in [26], specific nutrient guidelines were defined for sap in grapevine (Table 5). One-year-old plants of Vitis vinifera ‘Red Globe’ were grown with three different increasing fertilization treatments: N (0, 2.56, 5.12, 7.68, and 9.60 g per plant), P2O5 (0, 0.98, 1.47, 2.44, and 3.42 g per plant), and K2O (0, 2.30, 4.61, 6.91, and 9.22 g per plant) [72]. Following the methodology proposed by [25], sap NO3-N, NH4+, PO4H3, and K were evaluated. Sap analysis was proven to indicate the crop N status, as it responded linearly to the increasing fertilization rates. Another interesting finding was the negative correlation (−0.88) between applied P and sap NO3-N, as increasing P rates resulted in reduced sap NO3-N levels. Leaf analysis was more effective than sap analysis to show the current P and K status. However, the sap P and K values could be a function of the crop growth stage, as mentioned previously by other authors [34]. Nevertheless, sap analysis had a higher sensitivity for determining interactions and antagonisms among nutrients; therefore, it seems to be an effective complementary tool for assessing grapevine nutrient status.

5. Conclusions

As agriculture moves towards precision, sap analysis is a complementary tool for nutrition management in citrus production. Limitations regarding methodologies and results interpretation are gaps that might be filled with appropriate research. Much work is still to be conducted regarding methodology standardization and the determination of reference levels in HLB-affected and non-affected trees. If managed appropriately, sap analysis can optimize fertilizer application to meet tree nutrient requirements, reduce environmental impacts, and improve sustainability. Before the scientific community determines a standardized methodology and reliable sufficiency ranges, sap analysis should be used with caution.

Author Contributions

Conceptualization, E.E., G.L., N.A.B. and R.S.F.; methodology, E.E., G.L., N.A.B. and R.S.F.; investigation, E.E., G.L., N.A.B. and R.S.F.; resources, R.S.F.; writing—original draft preparation, E.E., G.L., N.A.B. and R.S.F.; writing—review and editing, E.E. and R.S.F.; supervision, R.S.F.; project administration, R.S.F.; funding acquisition, R.S.F. All authors have read and agreed to the published version of the manuscript.

Funding

This research was partially funded by the Southern SARE On-Farm Research Grant Award #2020-38640-31521.

Institutional Review Board Statement

Not applicable.

Informed Consent Statement

Not applicable.

Acknowledgments

We thank W. Cody Estes Sr. (Estes Groves, Inc.) and Scott D. Wall (New Age Laboratories) for technical support. This review was written to complement the information provided by the 2021 Plant Sap Analysis Workshop in Citrus Production organized by R.S.F. and E.E. available at https://irrec.ifas.ufl.edu/faculty-members-/ferrarezi/plant-sap-analysis.

Conflicts of Interest

The authors declare no conflict of interest. The funders had no role in the interpretation of data, in the writing of the manuscript, or in the decision to publish the results.

References

  1. Incrocci, L.; Massa, D.; Pardossi, A. New trends in the fertigation management of irrigated vegetable crops. Horticulturae 2017, 3, 37. [Google Scholar] [CrossRef]
  2. Rodríguez, A.; Peña-Fleitas, M.T.; Padilla, F.M.; Gallardo, M.; Thompson, R.B. Petiole sap nitrate concentration to assess crop nitrogen status of greenhouse sweet pepper. Sci. Hortic. 2021, 285, 110157. [Google Scholar] [CrossRef]
  3. Ferrarezi, R.S.; Jani, A.D.; Thomas James, H.; Gil, C.; Ritenour, M.A.; Wright, A.L. Sweet orange orchard architecture design, fertilizer, and irrigation management strategies under Huanglongbing-endemic conditions in the Indian River citrus district. HortScience 2020, 55, 2028–2036. [Google Scholar] [CrossRef]
  4. Thompson, R.B.; Incrocci, L.; Voogt, W.; Pardossi, A.; Magán, J.J. Sustainable irrigation and nitrogen management of fertigated vegetable crops. Acta Hortic. 2017, 1150, 363–378. [Google Scholar] [CrossRef]
  5. Rouse, R.; Irey, M.; Gast, T.; Boyd, M.; Willis, T. Fruit Production in a Southwest Florida citrus grove using the boyd nutrient / SAR Foliar Spray. Proc. Fla. State Hortic. Soc. 2012, 125, 61–64. [Google Scholar]
  6. Zambon, F.T.; Kadyampakeni, D.M.; Grosser, J.W. Ground application of overdoses of manganese have a therapeutic effect on sweet orange trees infected with Candidatus Liberibacter asiaticus. HortScience 2019, 54, 1077–1086. [Google Scholar] [CrossRef] [Green Version]
  7. Morgan, K.T.; Kadyampakeni, D.M. Nutrition of Florida Citrus Trees, 3rd ed.; University of Florida IFAS Extension: Gainesville, FL, USA, 2020. [Google Scholar]
  8. Quaggio, J.A.; Souza, T.R.; Zambrosi, F.C.B.; Mattos, D.; Boaretto, R.M.; Silva, G. Citrus fruit yield response to nitrogen and potassium fertilization depends on nutrient-water management system. Sci. Hortic. 2019, 249, 329–333. [Google Scholar] [CrossRef]
  9. Kadyampakeni, D.M.; Morgan, K.T.; Nkedi-Kizza, P.; Kasozi, G.N. Nutrient management options for Florida citrus: A review of NPK application and analytical methods. J. Plant Nutr. 2015, 38, 568–583. [Google Scholar] [CrossRef]
  10. Kadyampakeni, D.M.; Morgan, K.T.; Schumann, A.W. Citrus fertigation and irrigation practices for managing HLB in Florida. Proc. Fla. State Hortic. Soc. 2016, 129, 64–68. [Google Scholar]
  11. Spann, T.M.; Schumann, A.W. The role of plant nutrients in disease development with emphasis on citrus and Huanglongbing. Proc. Fla. State Hortic. Sci. 2009, 122, 169–171. [Google Scholar]
  12. Esteves, E. Nitrogen, Calcium and Magnesium Management for Improving the Performance of HLB-Affected Citrus Trees; University of Florida: Gainesville, FL, USA, 2020. [Google Scholar]
  13. Atta, A.A.; Morgan, K.T.; Hamido, S.A.; Kadyampakeni, D.M.; Mahmoud, K.A. Water and soil nutrient dynamics of Huanglongbing-Affected citrus trees as impacted by ground-Applied nutrients. Agronomy 2020, 10, 1485. [Google Scholar] [CrossRef]
  14. Atta, A.A.; Morgan, K.T.; Kadyampakeni, D.M.; Kamal, M.A. Effect of soil and / or foliar applied nutrients on leaf nutrient accumulation and water uptake on Huanglongbing affected ‘ Valencia ’ citrus trees. Proc. Fla. State Hortic. Soc. 2018, 131, 58–64. [Google Scholar]
  15. Atta, A.A.; Morgan, K.T.; Hamido, S.A.; Kadyampakeni, D.M. Effect of essential nutrients on roots growth and lifespan of Huanglongbing affected citrus trees. Plants 2020, 9, 483. [Google Scholar] [CrossRef] [Green Version]
  16. Uthman, Q.O.; Kadyampakeni, D.M.; Nkedi-Kizza, P.; Barlas, N.T.; Atta, A.A.; Morgan, K.T. Comparative response of Huanglongbing-affected sweet orange trees to nitrogen and zinc fertilization under microsprinkler irrigation. Agriculture 2020, 10, 489. [Google Scholar] [CrossRef]
  17. Roccuzzo, G.; Zanotelli, D.; Allegra, M.; Giuffrida, A.; Torrisi, B.F.; Leonardi, A.; Quiñones, A.; Intrigliolo, F.; Tagliavini, M. Assessing nutrient uptake by field-grown orange trees. Eur. J. Agron. 2012, 41, 73–80. [Google Scholar] [CrossRef]
  18. Kadyampakeni, D.M.; Morgan, K.T.; Schumann, A.W.; Nkedi-Kizza, P.; Mahmoud, K. Ammonium and nitrate distribution in soil using drip and microsprinkler irrigation for citrus production. Soil Sci. Soc. Am. J. 2014, 78, 645. [Google Scholar] [CrossRef]
  19. Padilla, F.M.; Farneselli, M.; Gianquinto, G.; Tei, F.; Thompson, R.B. Monitoring nitrogen status of vegetable crops and soils for optimal nitrogen management. Agric. Water Manag. 2020, 241, 106356. [Google Scholar] [CrossRef]
  20. Zekri, M.; Schumann, A.; Vashisth, T.; Kadyampakeni, D.; Morgan, K.; Boman, B.; Obreza, T. Fertilizer application methods. In Florida Citrus Production Guide; Diepenbrock, L.M., Dewdney, M.M., Vashisth, T., Eds.; University of Florida IFAS: Gainesville, FL, USA, 2018; pp. 59–61. [Google Scholar]
  21. Obreza, T.A.; Zekri, M.; Futch, S.H. General soil fertility and citrus tree nutrition. In Nutrition of Florida Citrus Trees; Morgan, K.T., Kadyampakeni, D.M., Eds.; University of Florida IFAS Extension: Gainesville, FL, USA, 2020; p. 108. [Google Scholar]
  22. Morgan, K.T.; Kadyampakeni, D.M.; Zekri, M.; Schumann, A.W.; Vashisth, T.; Obreza, T.A. 2020–2021 Florida citrus production guide: Nutrition management for citrus trees. In 2020–2021 Florida Citrus Production Guide; University of Florida IFAS Extension: Gainesville, FL, USA, 2020; p. 264. [Google Scholar]
  23. Zekri, M. The Critical Importance of Citrus Tree Nutrition, 1st ed.; AgNet Media: Newberry, FL, USA, 2016; ISBN 978-0-9978348-0-2. [Google Scholar]
  24. Obreza, T.A.; Zekri, M.; Hanlon, E.A. Soil and leaf tissue testing for commercial citrus production. In Nutrition of Florida Citrus Trees; Morgan, K.T., Kadyampakeni, D.M., Eds.; UF/IFAS: Gainesville, FL, USA, 2020; p. 108. [Google Scholar]
  25. Cadahía, C. Fertirrigación, 3rd ed.; Ediciones Mundi-Prensa: Madrid, Spain, 2005. [Google Scholar]
  26. Cadahía, C.; Frutos, I.; Eymar, E. La Savia Como Indice de Fertilización, 1st ed.; Ediciones Mundi-Prensa: Madrid, Spain, 2008. [Google Scholar]
  27. Eymar, E.; Cadahia, C.; Sanchez, A.; Lopez-Vela, D. Nutritional diagnosis based on sap analysis for containerized Cupressus glabra and Cupressocyparis leylandii with fertigation systems. Commun. Soil Sci. Plant Anal. 2000, 31, 1225–1248. [Google Scholar] [CrossRef]
  28. Olsen, J.K.; Lyons, D.J. Petiole sap nitrate is better than total nitrogen in dried leaf for indicating nitrogen status and yield responsiveness of capsicum in subtropical Australia. Aust. J. Exp. Agric. 1994, 34, 835–843. [Google Scholar] [CrossRef]
  29. Farneselli, M.; Tei, F.; Simonne, E. Reliability of petiole sap test for N nutritional status assessing in processing tomato. J. Plant Nutr. 2014, 37, 270–278. [Google Scholar] [CrossRef]
  30. Llanderal, A.; García-Caparrós, P.; Segura, M.L.; Contreras, J.I.; Lao, M.T. Nutritional changes in petiole sap over space and time in a tomato crop greenhouse. J. Plant Nutr. 2019, 42, 1205–1217. [Google Scholar] [CrossRef]
  31. Hochmuth, G.J. Efficiency ranges for nitrate-nitrogen and potassium for vegetable petiole sap quick tests. Horttechnology 1994, 4, 218–222. [Google Scholar] [CrossRef]
  32. Killiny, N.; Hijaz, F. Chemical composition of xylem sap of Citrus sinensis L. Osbeck (sweet orange). Trends Plant Sci. 1998, 3, 188–195. [Google Scholar]
  33. Ceballos-Laita, L.; Gutierrez-Carbonell, E.; Takahashi, D.; Abadía, A.; Uemura, M.; Abadía, J.; López-Millán, A.F. Effects of Fe and Mn deficiencies on the protein profiles of tomato (Solanum lycopersicum) xylem sap as revealed by shotgun analyses. J. Proteom. 2018, 170, 117–129. [Google Scholar] [CrossRef] [Green Version]
  34. Oliveira, M.N.S.; Oliva, M.A.; Martínez, C.A.; Silva, M.A.P. e Variação diurna e sazonal do pH e composição mineral da seiva do xilema em tomateiro. Hortic. Bras. 2003, 21, 10–14. [Google Scholar] [CrossRef]
  35. Palmer, L.J.; Stangoulis, J.C.R. Changes in the elemental and metabolite profile of wheat phloem sap during grain filling indicate a dynamic between plant maturity and time of day. Metabolites 2018, 8, 53. [Google Scholar] [CrossRef] [PubMed] [Green Version]
  36. Killiny, N. Metabolomic comparative analysis of the phloem sap of curry leaf tree (Bergera koenegii), orange jasmine (Murraya paniculata), and Valencia sweet orange (Citrus sinensis) supports their differential responses to Huanglongbing. Plant Signal. Behav. 2016, 11, e1249080. [Google Scholar] [CrossRef] [Green Version]
  37. Hijaz, F.; Manthey, J.A.; Van der Merwe, D.; Killiny, N. Nucleotides, micro- and macro-nutrients, limonoids, flavonoids, and hydroxycinnamates composition in the phloem sap of sweet orange. Plant Signal. Behav. 2016, 11, e1183084. [Google Scholar] [CrossRef] [PubMed] [Green Version]
  38. Rosen, C.J.; Eliason, R. Nutrient Management in Minnesota Fruit & Vegetable Crops for Commercial; University of Minnesota: Minneapolis, MN, USA, 2005. [Google Scholar]
  39. Peña-Fleitas, M.T.; Gallardo, M.; Thompson, R.B.; Farneselli, M.; Padilla, F.M. Assessing crop N status of fertigated vegetable crops using plant and soil monitoring techniques. Ann. Appl. Biol. 2015, 167, 387–405. [Google Scholar] [CrossRef]
  40. Goffart, J.P.; Olivier, M.; Frankinet, M. Potato crop nitrogen status assessment to improve N fertilization management and efficiency: Past-present-future. Potato Res. 2008, 51, 355–383. [Google Scholar] [CrossRef]
  41. Datnoff, L.E.; Elmer, W.H.; Huber, D.M. Mineral Nutrition and Plant Disease; The American Phytopathological Society: Saint Paul, MN, USA, 2007. [Google Scholar]
  42. García-Mina, J.M. Plant nutrition and defense mechanism: Frontier knowledge. In Advances in Citrus Nutrition; Srivastava, A.K., Ed.; Springer: Berlin/Heidelberg, Germany, 2012; p. 477. [Google Scholar]
  43. Arnon, D.I. Effect of ammonium and nitrate nitrogen on the mineral composition and sap characteristics of barley. Soil Sci. 1939, 48, 295–307. [Google Scholar] [CrossRef]
  44. Pettinger, N.A. The expressed sap of corn plants as an indicator or nutrient needs. J. Agric. Res. 1931, 43, 95–119. [Google Scholar]
  45. Cadahía, C.; Hernando, V. Diagnosis of the evolution of mineral nutrition in plants using sap analysis. In Proceedings of the Proceedings of the 7th International Colloquium on Plant Analysis and Fertilizer Problems, Hannover, Germany, 2–6 September 1974; pp. 157–165. [Google Scholar]
  46. Studstill, D.W.; Simonne, E.H.; Hutchinson, C.M.; Hochmuth, R.C.; Dukes, M.D.; Davis, W.E. Petiole sap testing sampling procedures for monitoring pumpkin nutritional status. Commun. Soil Sci. Plant Anal. 2003, 34, 2355–2362. [Google Scholar] [CrossRef]
  47. Hochmuth, G. Plant Petiole Sap-Testing for Vegetable Crops; University Florida: Gainesville, FL, USA, 1999; Volume CIR1144, pp. 1–6. [Google Scholar]
  48. Hochmuth, G.; Maynard, D.; Vavrina, C.; Hanlon, E.; Simonne, E. HS964/EP081: Plant Tissue Analysis and Interpretation for Vegetable Crops in Florida; UF/IFAS Extension University Florida: Gainesville, FL, USA, 2012; Volume HS 964, p. 55. [Google Scholar]
  49. Thompson, R.; Tremblay, N.; Fink, M.; Gallardo, M.; Padilla, F. Tools and strategies for sustainable nitrogen fertilisation of vegetable crops. In Advances in Research on Fertilization Management of Vegetable Crops; Tei, F., Nicola, S., Benincasa, P., Eds.; Springer: Berlin/Heidelberg, Germany, 2017; pp. 183–219. ISBN 978-3-319-53624-8. [Google Scholar]
  50. Hartz, T.K. The assessment of soil and crop nutrient status in the development of efficient fertilizer recommendations. Acta Hortic. 2003, 627, 231–240. [Google Scholar] [CrossRef]
  51. Wu, J.; Wang, D.; Rosen, C.J.; Bauer, M.E. Comparison of petiole nitrate concentrations, SPAD chlorophyll readings, and QuickBird satellite imagery in detecting nitrogen status of potato canopies. Field Crop. Res. 2007, 101, 96–103. [Google Scholar] [CrossRef]
  52. Opstad, N. Mineral Concentrations in leaf dry matter and leaf and petiole sap in strawberry depend on leaf age and plant developmental stage. Acta Hortic. 2010, 868, 143–148. [Google Scholar] [CrossRef]
  53. Lacroix, C.R.; Cousin, I. Petiolar sap nitrate as a guide in the fertilization of strawberry. Acta Hortic. 1997, 439, 753–762. [Google Scholar] [CrossRef]
  54. Farneselli, M.; Simonne, E.H.; Studstill, D.W.; Tei, F. Washing and/or cutting petioles reduces nitrate-nitrogen and potassium sap concentrations in vegetables. J. Plant Nutr. 2006, 29, 1975–1982. [Google Scholar] [CrossRef]
  55. Bélec, C.; Villeneuve, S.; Coulombe, J.; Tremblay, N. Influence of nitrogen fertilization on yield, hollow stem incidence and sap nitrate concentration in broccoli. Can. J. Plant Sci. 2001, 81, 765–772. [Google Scholar] [CrossRef] [Green Version]
  56. Joris, H.A.W.; Souza, T.R.; Montezano, Z.F.; Vargas, V.P.; Cantarella, H. Evaluating nitrogen behavior in sugarcane after fertilization using leaf and sap extract analyzes. Am. J. Plant Sci. 2014, 05, 2655–2664. [Google Scholar] [CrossRef] [Green Version]
  57. De Souza, T.R.; Bôas, R.L.V.; Quaggio, J.A.; Salomão, L.C. Nutrientes na Seiva de plantas cítricas fertirrigadas. Rev. Bras. Frutic. 2012, 34, 482–492. [Google Scholar] [CrossRef] [Green Version]
  58. da Silva, J.R.; de Alvarenga, F.V.; Boaretto, R.M.; Lopes, J.R.S.; Quaggio, J.A.; Coletta Filho, H.D.; Mattos, D. Following the effects of micronutrient supply in HLB-infected trees: Plant responses and ‘Candidatus Liberibacter asiaticus’ acquisition by the Asian citrus psyllid. Trop. Plant Pathol. 2020, 45, 597–610. [Google Scholar] [CrossRef]
  59. Daugaard, H.; Todsen, T.T. Nitrogen fertilization of strawberries: N(min), leaf dry matter, and leaf sap analyses as control methods. J. Plant Nutr. 1999, 22, 1679–1685. [Google Scholar] [CrossRef]
  60. Vitosh, M.L.; Silva, G.H. Factors affecting potato petiole sap nitrate tests. Commun. Soil Sci. Plant Anal. 1996, 27, 1137–1152. [Google Scholar] [CrossRef]
  61. Nagarajah, S. A petiole sap test for nitrate and potassium in ’Sultana’ grapevines. Aust. J. Grape Wine Res. 1999, 5, 56–60. [Google Scholar] [CrossRef]
  62. Havlin, J.L.; Tisdale, S.L.; Nelson, W.L. Soil Fertility and Fertilizers, 8th ed.; Pearson: London, UK, 2013. [Google Scholar]
  63. Killiny, N. Collection of the phloem sap, pros, and cons. Plant Signal. Behav. 2019, 14, 1618181. [Google Scholar] [CrossRef]
  64. Errebhi, M.; Rosen, C.J.; Birong, D.E. Calibration of a petiole sap nitrate test for irrigated “Russet Burbank” potato. Commun. Soil Sci. Plant Anal. 1998, 29, 23–35. [Google Scholar] [CrossRef]
  65. Parks, S.E.; Irving, D.E.; Milham, P.J. A critical evaluation of on-farm rapid tests for measuring nitrate in leafy vegetables. Sci. Hortic. 2012, 134, 1–6. [Google Scholar] [CrossRef]
  66. Peña-Fleitas, M.T.; Gallardo, M.; Padilla, F.M.; Rodríguez, A.; Thompson, R.B. Use of a portable rapid analysis system to measure nitrate concentration of nutrient and soil solution, and plant sap in greenhouse vegetable production. Agronomy 2021, 11, 819. [Google Scholar] [CrossRef]
  67. Grattan, S.R.; Grieve, C.M. Salinity-mineral nutrient relations in horticultural crops. Sci. Hortic. 1999, 78, 127–157. [Google Scholar] [CrossRef]
  68. Taiz, L.; Zeiger, E. Plant Physiology, 5th ed.; Sinauer Associates Inc.: Sunderland, MA, USA, 2010. [Google Scholar]
  69. Casado, M. Estudio de la Fertilización y Nutrición del Fresón Mediante el Análisis de Savia; Universidad Complutense de Madrid: Madrid, Spain, 1974. [Google Scholar]
  70. Peñalosa, J.M.; Cadahia, C.; Sarro, M.J.; Masaguer, A. Improvement of strawberry nutrition in sandy soils by addition of manure, calcium and magnesium. J. Plant Nutr. 1994, 17, 147–153. [Google Scholar] [CrossRef]
  71. Haghshenas, M.; Arshad, M.; Nazarideljou, M.J. Different K:Ca ratios affected fruit color and quality of strawberry ‘Selva’ in soilless system. J. Plant Nutr. 2018, 41, 243–252. [Google Scholar] [CrossRef]
  72. Pino, P.; Callejas, R.; Razeto, B.; Reginato, G. Análisis químico del extracto peciolar para evaluar el estado nutricional en la vid. Pesqui. Agropec. Bras. 2012, 47, 111–117. [Google Scholar] [CrossRef] [Green Version]
Figure 1. Sap analysis methodologies: sample collection, sample extraction, and sample analysis. Procedures inside each stage are not necessarily a sequence but different approaches used in several studies.
Horticulturae 07 00426 g001
Table 1. Dilution ratios used in different studies for several types of analyses.
Nutrients AnalyzedSolventRatioType of AnalysisAuthors
NO3-N, NH4+, P, B, Ca, K, Mg, and NaHCl 2%1:25Spectrometry[26]
Fe, Cu, Mn, and ZnHCl 2%1:10Spectrometry
ClHCl 2%1:25Ion selective electrode
Total N--Kjeldahl method
NO3-NDeionized water1:200Colorimetry[28]
KDeionized water1:20Spectrometry
NO3-NDistilled water1:20Strips and reader[55]
NO3-N and KDistilled/deionized water1:50Strips and reader, colorimetry, and electrodes[48]
Table 2. Sap nutrient concentration for control treatments in ‘Valencia’ and ‘Hamlin’ sweet oranges (Citrus sinensis). Adapted from [57].
CultivarpHNH4+NO3-NTotal NPKCaMgSBCuFeMnZn
Sap Nutrient Concentration (mg L−1)
‘Valencia’5.423.662.886.436004000596.8474.4156.84.02.11.70.92.6
‘Hamlin’5.522.861.684.435003800581.8468.5139.43.62.11.30.92.4
Table 3. Sap nutrient concentration for tomato (Lycopersicon esculentum) throughout the crop cycle and at harvest. Adapted from [30,31].
Crop StageSap Nutrient Concentration (mg L−1)Authors
NO3-NH2PO4-PK+Ca2+Mg2+Na+Cl
Throughout the crop cycle125339.54533555168855123120[30]
Harvest700-3500----[31]
Table 4. Reference levels for leaf petiole sap in strawberries (Fragaria × ananassa).
Crop Stage Sap Nutrient Concentration (mg L−1)
NO3-NPK+Ca2+Mg2+Na+ClAuthors
Blooming summer350–500295–4254500–5000850–1000300–45040–50-[69]
Fruit set summer600–800140–2104300–4800450–600200–30030–40500
March500–700250–3604200–5600700–1200300–610-500–780[26]
May300–550220–3304200–5800500–610190–310-330–500
March200–500-1800–2500----[31]
April200–500-1500–2000----
Table 5. Sap nutrient concentration levels for ‘Red Globe’ grapevine (Vitis vinifera) during the crop cycle. Adapted from [26].
Crop StageSap Nutrient Concentration (mg L−1)
NO3-NPK+Ca2+Mg2+
Vegetative flush17001552800600480
Blooming300530200012001000
Veraison550870335014001400
Publisher’s Note: MDPI stays neutral with regard to jurisdictional claims in published maps and institutional affiliations.

