Article

Evaluation of 130 Eggplant (Solanum melongena L.) Genotypes for Future Breeding Program Based on Qualitative and Quantitative Traits, and Various Genetic Parameters

1
Bangladesh Agricultural Research Institute, Gazipur 1701, Bangladesh
2
Institute of Cotton Research, Chinese Academy of Agricultural Sciences, Anyang 455000, China
3
Department of Clinical Laboratories Sciences, The Faculty of Applied Medical Sciences, Taif University, P.O. Box 11099, Taif 21944, Saudi Arabia
4
Department of Biology, College of Science, Taif University, P.O. Box 11099, Taif 21944, Saudi Arabia
5
Department of Agronomy, Bangladesh Wheat and Maize Research Institute, Dinajpur 5200, Bangladesh
*
Authors to whom correspondence should be addressed.
Horticulturae 2021, 7(10), 376; https://doi.org/10.3390/horticulturae7100376
Submission received: 2 September 2021 / Revised: 30 September 2021 / Accepted: 3 October 2021 / Published: 8 October 2021
(This article belongs to the Special Issue Advances in Molecular Breeding of Vegetable Crops)

Abstract

:
Eggplant is an essential widespread year-round fruit vegetable. This study was conducted using 130 local germplasm of brinjal to select diverse parents based on the multiple traits selection index for the future breeding program. This selection was performed focusing on 14 qualitative and 10 quantitative traits variation and genetic parameters namely, phenotypic and genotypic variance (PV and GV) and genotypic and phenotypic coefficients of variation (GCV and PCV), broad-sense heritability (hBS), genetic advance, traits association, genotype by trait biplot (G × T), heatmap analysis and multi-trait index based on factor analysis and genotype-ideotype distance (MGIDI). Descriptive statistics and analysis of variance revealed a wide range of variability for morpho-physiological traits. Estimated hBS for all the measured traits ranged from 10.6% to 93%, indicating that all the traits were highly inheritable. Genetic variances were low to high for most morpho-physiological traits, indicating complex genetic architecture. Yield per plant was significantly correlated with fruit diameter, fruits per plant, percent fruits infestation by brinjal shoot and fruit borer, and fruit weight traits indicating that direct selection based on fruit number and fruit weight might be sufficient for improvement of other traits. The first two principal components (PCs) explained about 81.27% of the total variation among lines for 38 brinjal morpho-physiological traits. Genotype by trait (G × T) biplot revealed superior genotypes with combinations of favorable traits. The average genetic distance was 3.53, ranging from 0.25 to 20.01, indicating high levels of variability among the germplasm. The heat map was also used to know the relationship matrix among all the brinjal genotypes. MGIDI is an appropriate method of selection based on multiple trait information. Based on the fourteen qualitative and ten quantitative traits and evaluation of various genetic parameters, the germplasm G80, G54, G66, and G120 might be considered as best parents for the future breeding program for eggplant improvement.

1. Introduction

Eggplant or brinjal (Solanum melongena L.; 2n = 2x = 24) is considered a rich member of the species Solanaceae, which contains approximately 1300 species. It can be grown in diversified climatic conditions of various ecological regions. It possesses high species richness with considerable flexibility of phenotypic adaptability that made the species the most important vegetable economically. Eggplant is a general term for various Solanum species cultivated for their fruits, including the East Asian aubergine (S. melongena L.) and the two African native eggplants, Scarlet (S. aethiopicum L.) and Gboma (S. macrocarpon L.) [1]. Eggplant has become prominent due to its health-promoting properties. Therefore, eggplant and its relatives have numerous medicinal applications, with 77 distinct medicinal properties [2]. Eggplant is a widespread vegetable that grown from the subtropics to the Mediterranean region, popularly in Asia, Africa, and the southern part of the USA, with significant production in 2019 globally (55.15 million tons). Asia produces more than 90% of global eggplant production with 87% of the growing area coverage [3,4]. It ranks second most-produced vegetable after potato in Bangladesh.
It occupies roughly 15% of total vegetable farmland and produces about 8% of total vegetable production [5]. However, wild forms grow in sympatry with landraces and cultivars throughout their distinct areas of origin and domestication. Natural gene flow between wild and cultivated materials, followed by natural and human selection, has resulted in intermediate phenotypes that correlate with many wild features. The contribution of features of breeding importance to diversity is unequal. The variables that contributed the most to the divergence between accessions in Indian landraces of S. melongena were yield per plant, fruit width, number of long-styled flowers per plant, flowering earliness, total phenolic content, and ascorbic acid content [6]. Nevertheless, the results depend on the sample size used. To date, there has not been any large-scale study of a representative sample containing the complete phenotypic diversity of each cultivated eggplant. In Bangladesh, eggplant is grown throughout the country, however, the yield is not sufficient due to the lack of improved and desired variety and remarkable infestation of insect pests. However, morphological characterization has been useful in studying the relationship and diversity of various eggplant varieties. The European Eggplant Genetic Resources Network (EGGNET) defined the morphological characterization for eggplant [7], which has been validated and used in the characterization of eggplant breeding materials in numerous studies [8,9,10]. Therefore, creating variation through mutation, hybridization, and biotechnology approaches is an expensive and time-consuming method [8]. Consequently, characterizing collected germplasm (populations) is required to identify lines suitable for new variety development [11]. Plant breeders are interested in genetic diversity studies based on qualitative and quantitative traits because such traits can be scored quickly and easily using low-cost methods.
The phenotypic variation of fruits, plants, and other interesting traits has been demonstrated in many articles on Solanum or S. aethiopicum or two or more eggplant species [12,13,14,15,16,17,18,19]. Moreover, summarizing the phenotypic diversity of eggplants following the Mendelian or quantitative heredity patterns of traits of interest have been widely studied in many reports [20,21,22]. Different scientists [23,24,25] studied in-depth genetic diversity, heritability and genetic advance in eggplant genotypes. Consequently, breeders face a challenge in selecting genotypes that combine high yields in multiple attributes, which requires a reliable decision support tool. In plant breeding studies, a strong selection approach can save a lot of time and resources.
The Smith–Hazel Index (SH index) is widely utilized in plant breeding as a multi-trait selection index [26]. Reversing a phenotypic covariance matrix and a vector of economic weights is required to calculate the SH index. As a result of the presence of multicollinearity, poorly conditioned matrices and biased index coefficients would occur, affecting genetic gain estimations [26]. To account for the multicollinearity issue in multi-trait indexes, a combination of multivariate approaches is effective in overcoming their limits. FAI-BLUP is a factor analysis-based model in which each ideotype’s factorial scores are created based on desirable and undesirable elements [26]. Then, depending on the genotype-ideotype distance, a geographic probability is calculated allowing genotype ranking. Olivoto and Nardino [27] offered a new multi-trait genotype-132 ideotype distance index (MGIDI) and the entire current index is combined with the exercise calculations in the R-Metan package, which contains all the functions required for genotype selection in plant breeding programs.
In Bangladesh, however, numerous genotypes of eggplant are available. The Bangladesh Agricultural Research Institute (BARI Plant)’s Genetic Resource Center (PGRC) collects and preserves several types of eggplant germplasm from all around Bangladesh. Studying the level of accessible diversity in a crop development program is a crucial stage in crop improvement, which can be accomplished through the collection and evaluation of germplasm. Therefore, the present study was carried out to determine the inherent variation of local eggplant germplasm to identify the promising germplasm that exhibits genetic diversity for crop improvement programs through advanced multi-disciplinary analysis.

2. Material and Methods

2.1. Experimental Site

The experiment was executed at PGRC of BARI at Gazipur, Bangladesh during winter (Rabi season) 2019–2020 at 23.988929 N latitude, 90.412393 E longitudes and 8.40 m above sea level. The soil in the test field was silty clay with a pH of 6.

2.2. Experimental Materials, Treatments, Desing and Procedures

A total of 130 genotypes (126 locally collected germplasm and Bangladesh has developed and released four Bt brinjal varieties expressing Cry1Ac gene (Bt brinjal), viz., BARI Bt brinjal-1,2,3 and 4 variety as a check) were used in the experiment (Table S1).
All 130 genotypes were arranged in an augmented randomized complete block design (augmented RCBD) with four check varieties and seven blocks was followed in this study. All check varieties received seven replications, giving a total of 154 experimental plots. The plot size was 3 m × 2.1 m. Each genotype was implanted in three rows per plot. The spacing was 70 × 60 cm.
Direct seeding was completed with inside the well-organized seedbeds on 12 November 2019. Thirty-day-old seedlings were transplanted in the organized pits of the predominant experimental plot on 22 December 2019.
Fertilizer doses were 10 tons ha−1 Cowdung, 210 kg ha−1 Urea, 33 kg ha−1 triple superphosphate (TSP), 200 kg ha−1, MP and 5 kg ha−1 Borax ([28]. The total requirement of Cow-dung, TSP and Borax was applied during final land preparation about one week before transplanting. Urea and MP were supplied in the three equal splits [29]. Four times weeding and mulching were carried out in the first 25 days of mid-December. Sumithion 60 EC at 2.5 ml L−1, Sevin 75 WP at 0.1 g pit−1 and Vertimac 18 EC at 1.2 ml L−1 were sprayed for controlling insect and mite, respectively. The data was noted as per the descriptor developed by IBPGR, 1990.

2.3. Data Recorded

Fourteen qualitative traits and ten quantitative traits (Table 1) were considered during the morphological characterization based on EGGNET [7] and IBPGR descriptors [30].

Quantitative Traits Measuring

Data on the number of days required from planting to the first opening of the flower (for example early genotypes took <91 days), optimum genotypes took 91–105 days, and late genotypes took >105 days).
Data on plant height was recorded from five randomly selected plants at the edible fruiting stage (for example, short (~30 cm), intermediate (~60 cm), and tall (61–100 cm).
The normalized difference vegetation index (NDVI) was measured by hand green seeker (Trimble) and green seeker RT100 (Agri Optics). Quantification of two natural light sources (near infrared-NIR and red light) is measured by NDVI. These two natural lights have individual mechanisms on vegetation. For example, NIR is reflected by the vegetation, whereas red light is absorbed by the vegetation.
The NDVI formula is:
NDVI = NIR Red NIR + Red
The chlorophyll content in plant leaves was determined with a SPAD meter (Model: SPAD-502). The SPAD value was carried from the middle portion of the leaf of the tagged main shoot at the first flowering stage through using a self-calibrating Minolta chlorophyll meter. Measurements at each experimental plot consisted of an average of five readings [31].
Leaf area was calculated with an Automatic Leaf Area Meter (Leaf area meter-LICOR-3300, USA) at the first flowering stage of a single leaf. The leaf area index (LAI) of the crop at different growth stages was calculated using the equation as described by [32].
Data on fruit length, fruit diameter, mean number of edible fruits, and mean weight of edible fruits were measures from 10 randomly selected fruits.
Length of fruit was measured from base of calyx to tip of fruit (for example, very short (<1 cm), short (3–5 cm), Intermediate (6–10 cm), long (11–20 cm) and very long (>20 cm))
Fruit diameter was estimated as small (2–3 cm), intermediate (4–5 cm), large (6–10 cm), and very large (>10 cm)
The mean number of edible fruits was very low (<7), low (7–12), intermediate (13–18), high (19–24), very high (>25)).
The mean weight of edible fruit was low (<30 g), intermediate (30–60 g) and high (>60 g)).
The multi-trait index based on factor analysis and genotype-ideotype distance (MGIDI) proposed by [27] was used to select the novel donors with high performing under optimum and low nitrogen conditions. We also compared the result of the MGIDI index with the result of the Smith–Hazel (SH) index proposed by Smith (29) and Hazel (30) multiple trait index based on factor analysis and ideotype-design (FAI-BLUP) index proposed by [33]. The MGIDI [33] was computed as follows:
M T S I i = [ j = 1 f ( γ i j γ j ) 2 ] 0.5
where MGIDIi is the distance index of multi-trait genotype-ideotype for the ith genotype, γij is the score of the ith genotype in the jth factor I = 1, 2, …, g; j = 1, 2, …, f), g and f are the number of genotypes and factors, respectively, and Fj is the ideotype’s jth score. This means that the genotype with the lowest MGIDI is closest to the ideotype, and as a result, it has the ideal values for all the analyzed features.

2.4. Statistical Analysis

Statistical analyses were performed under the R-statistics platform (software version 4.0.2) [34]. Analyses of variance (ANOVA) for each trait were assessed by using the R package ‘augmented RCBD’ [35]. Phenotypic and genetic variance (PV and GV), along with genotypic and phenotypic coefficients of variation (GCV and PCV), were calculated using the formula provided by [36]. Broad sense heritability (hBS), genetic advance (GA) calculation as formula elucidated in [37]. Components of the phenotypic variance of each trait were estimated using restricted maximum likelihood methods. For the estimation of variance components of linear mixed-effect ‘‘lmer’’, lme4 package was employed. R package ggplot2, scales and GGally were used for heatmap analysis.
The hierarchical clustering was performed using Spearman’s rank correlation algorithm. Principal component analysis (PCA) was performed using R package ggplot2, ggfortify, usethis, devtools, plyr, scales and grid. Using a two-way matrix of 10 characteristics and 130 genotypes, a G × T biplot was constructed. The first two PCs were plotted. Genotypes were schemed according to scores on each PC, and traits were plotted based on the eigenvectors on each PC. The genotypic, phenotypic variance and broad-sense heritability were estimated using Agricola R-package [38] with “metan” package. Mathematic figures were plotted using the ggplot2 package [39].

3. Results

3.1. Qualitative Traits

To determine the variability of the examined germplasm, different qualitative traits were evaluated (Table 2 and Table 3).

3.2. Variability in Growth and Foliage

All the traits studied related to plant growth habits and foliage exhibited noticeable variation among the germplasm except leaf hairs and corolla Color (Table 2). Plant growth habit was observed in upright (17.69%), intermediate (49.23%) and prostrate (33.08%). Leaf-blade lobing were exhibited four categories as Weak (45.38%), Intermediate (33.08%), Strong (17.69%), and very strong (3.85%). The leaf blade tip angles were also exhibited as four categories such as very acute (4.62%), Acute (21.54%), Intermediate (49.23%) and Obtuse (24.62%). Leaf prickles were found in maximum variation such as very few (10.0%), few (29.23%), intermediate (55.38%), many (3.58%) and very many (1.54%) in the studied germplasm. Leaf hairs and showed minimum variation. Corolla Colors were found light violet (31.54%), pale violet (64.62%) and white (3.85%). All the fruits traits displayed distinctive variation among the genotypes except fruit cross-section and fruit position (Table 3). The maximum variation was identified in overall leaf prickles, fruit calyx prickles, fruit color at ripening and fruit flesh density.

3.3. The Analysis of Variance and Frequency Distribution of Quantitative Traits

The germplasm panel, consisting of 126 accessions with four check varieties, was tested for characterized through different morphological traits including 14 qualitative and 10 quantitative traits. Analysis of variance (ANOVA) showed high significant variation among the accessions with a check for all the investigated traits. ANOVA for all the traits also revealed highly significant differences among the check, accession by check interaction as well as among the accession (Table 4) excluding normalized difference vegetation index (NDVI), plant height (PH), single leaf area (SLA), and yield per plant (YPP) for check varieties. Adjusted blocks are insignificant for all the traits. All the traits matched with normal distribution except for some traits skewed left and some were right (Figure 1 and Figure 2).

3.4. Descriptive Statistic of the Traits

For morpho-physiological traits evaluated in this study, their descriptive statistics including means and standard error (std.Error), standard deviations (std.Dev), minimum (Min), maximum (Max), skewness and kurtosis are summarized in Table 5. All the phenotypic values are shown a wide range of variability. Plant height (PH) ranged from 87.82 to 139.57. The NDVI value ranged from 0.33 to 0.78, SPAD ranged from 25.37 to 66.97, single leaf area (SLA) ranged from 86.12 to 242.85 cm2, DFF ranged from 70.21 to 80.5 days, FD ranged from 0.77 to 9.47 cm, FL ranged from 3.71 to 24.93 cm, FW ranged from 10.00 to 650.40 g, TF ranged from 10.21 to 49.21, and YPP ranged from 0.24 to 10.57 kg.
Skewness is a measure of the asymmetry and kurtosis is a measure of ’peakedness’ of a distribution. The skewness and kurtosis were non-significant for all the traits except PH, TF and YPP indicating all the traits fitted with a normal distribution (Figure 2). The traits SLA, DFF, FD, TF and YPP were significant, and the distribution is positively skewed, which means that more accessions are below the mean than expected in a normal distribution. Only the trait SPAD was non-significant, and the distribution is negatively skewed, which means that more accessions above the mean than expected in a normal distribution (Figure 2). The traits PH, TF and YPP were significant and positive for kurtosis which means heavily leptokurtic distributions (Figure 2).
The results pertaining to genetic parameters viz., phenotypic coefficient of variation (PCV), genotypic coefficient of variation (GCV), broad-sense heritability (h2 BS), and genetic advance as percent of the mean (GAM) for all the 10 traits are summarized in Table 6. TF had the highest PCV (54.76%) and GCV (53.64%), followed by FD, FL, FW, and YPP. High PCV and high GCV suggesting that these traits were under the influence of genetic control. The traits PH, NDVI, and SPAD were noted for moderate magnitudes of both PCV and GCV respectively. The traits DFF recorded for low magnitudes of both PCV and GCV, respectively.

3.5. Variability in Fruit Traits

All the traits studied related to the fruit of eggplant showed distinct variation among the germplasm except fruit cross-section and fruit position (Table 6). The maximum variation was found in ‘fruit Color at ripening stage’. Six categories of fruit Color at ripening such as milky white (1.54%), lilac grey (5.38%), Purple (24.62%), green with mottled at the distal end (39.23%), and Green with yellowish stripe (28.46%) and purple with light green at the distal end (2.31%) were observed. The next higher variation was found in ‘fruit flesh density’. Very loose (spongy), loose (crumbly), average density, dense, and very dense type of fruit flesh density was found where the majority of the germplasm exhibited average density type. On the other hand, fruit calyx prickles were found as very few (1.6%), few (13.9%), intermediate (36.5%), many (23.0%), and very many (25.0%). Fruit Color distribution was exhibited as uniform (50.8%), mottled (13.1%), netted (16.8%), and striped (27.9%). No fruits were found curved in 80.56% of the germplasm. Only 8.33 % germplasm showed curved and 11.11% showed slightly curved. Fruit apexes were exhibited as two categories as rounded (40.28%) and depressed (59.72%).

3.6. Analysis of Correlation Matrix

The phenotypic correlation analysis is being used to explore a linear relationship between various traits, which was visualized in the correlation matrix (Figure 3). In this analysis, DFF displayed a significant positive correlation with FL, while NDVI was correlated negatively. FW exhibited a strong negative correlation with TF and TF showed a negative correlation with YPP. FW and PH showed a moderate positive significant correlation with YPP (Figure 3).

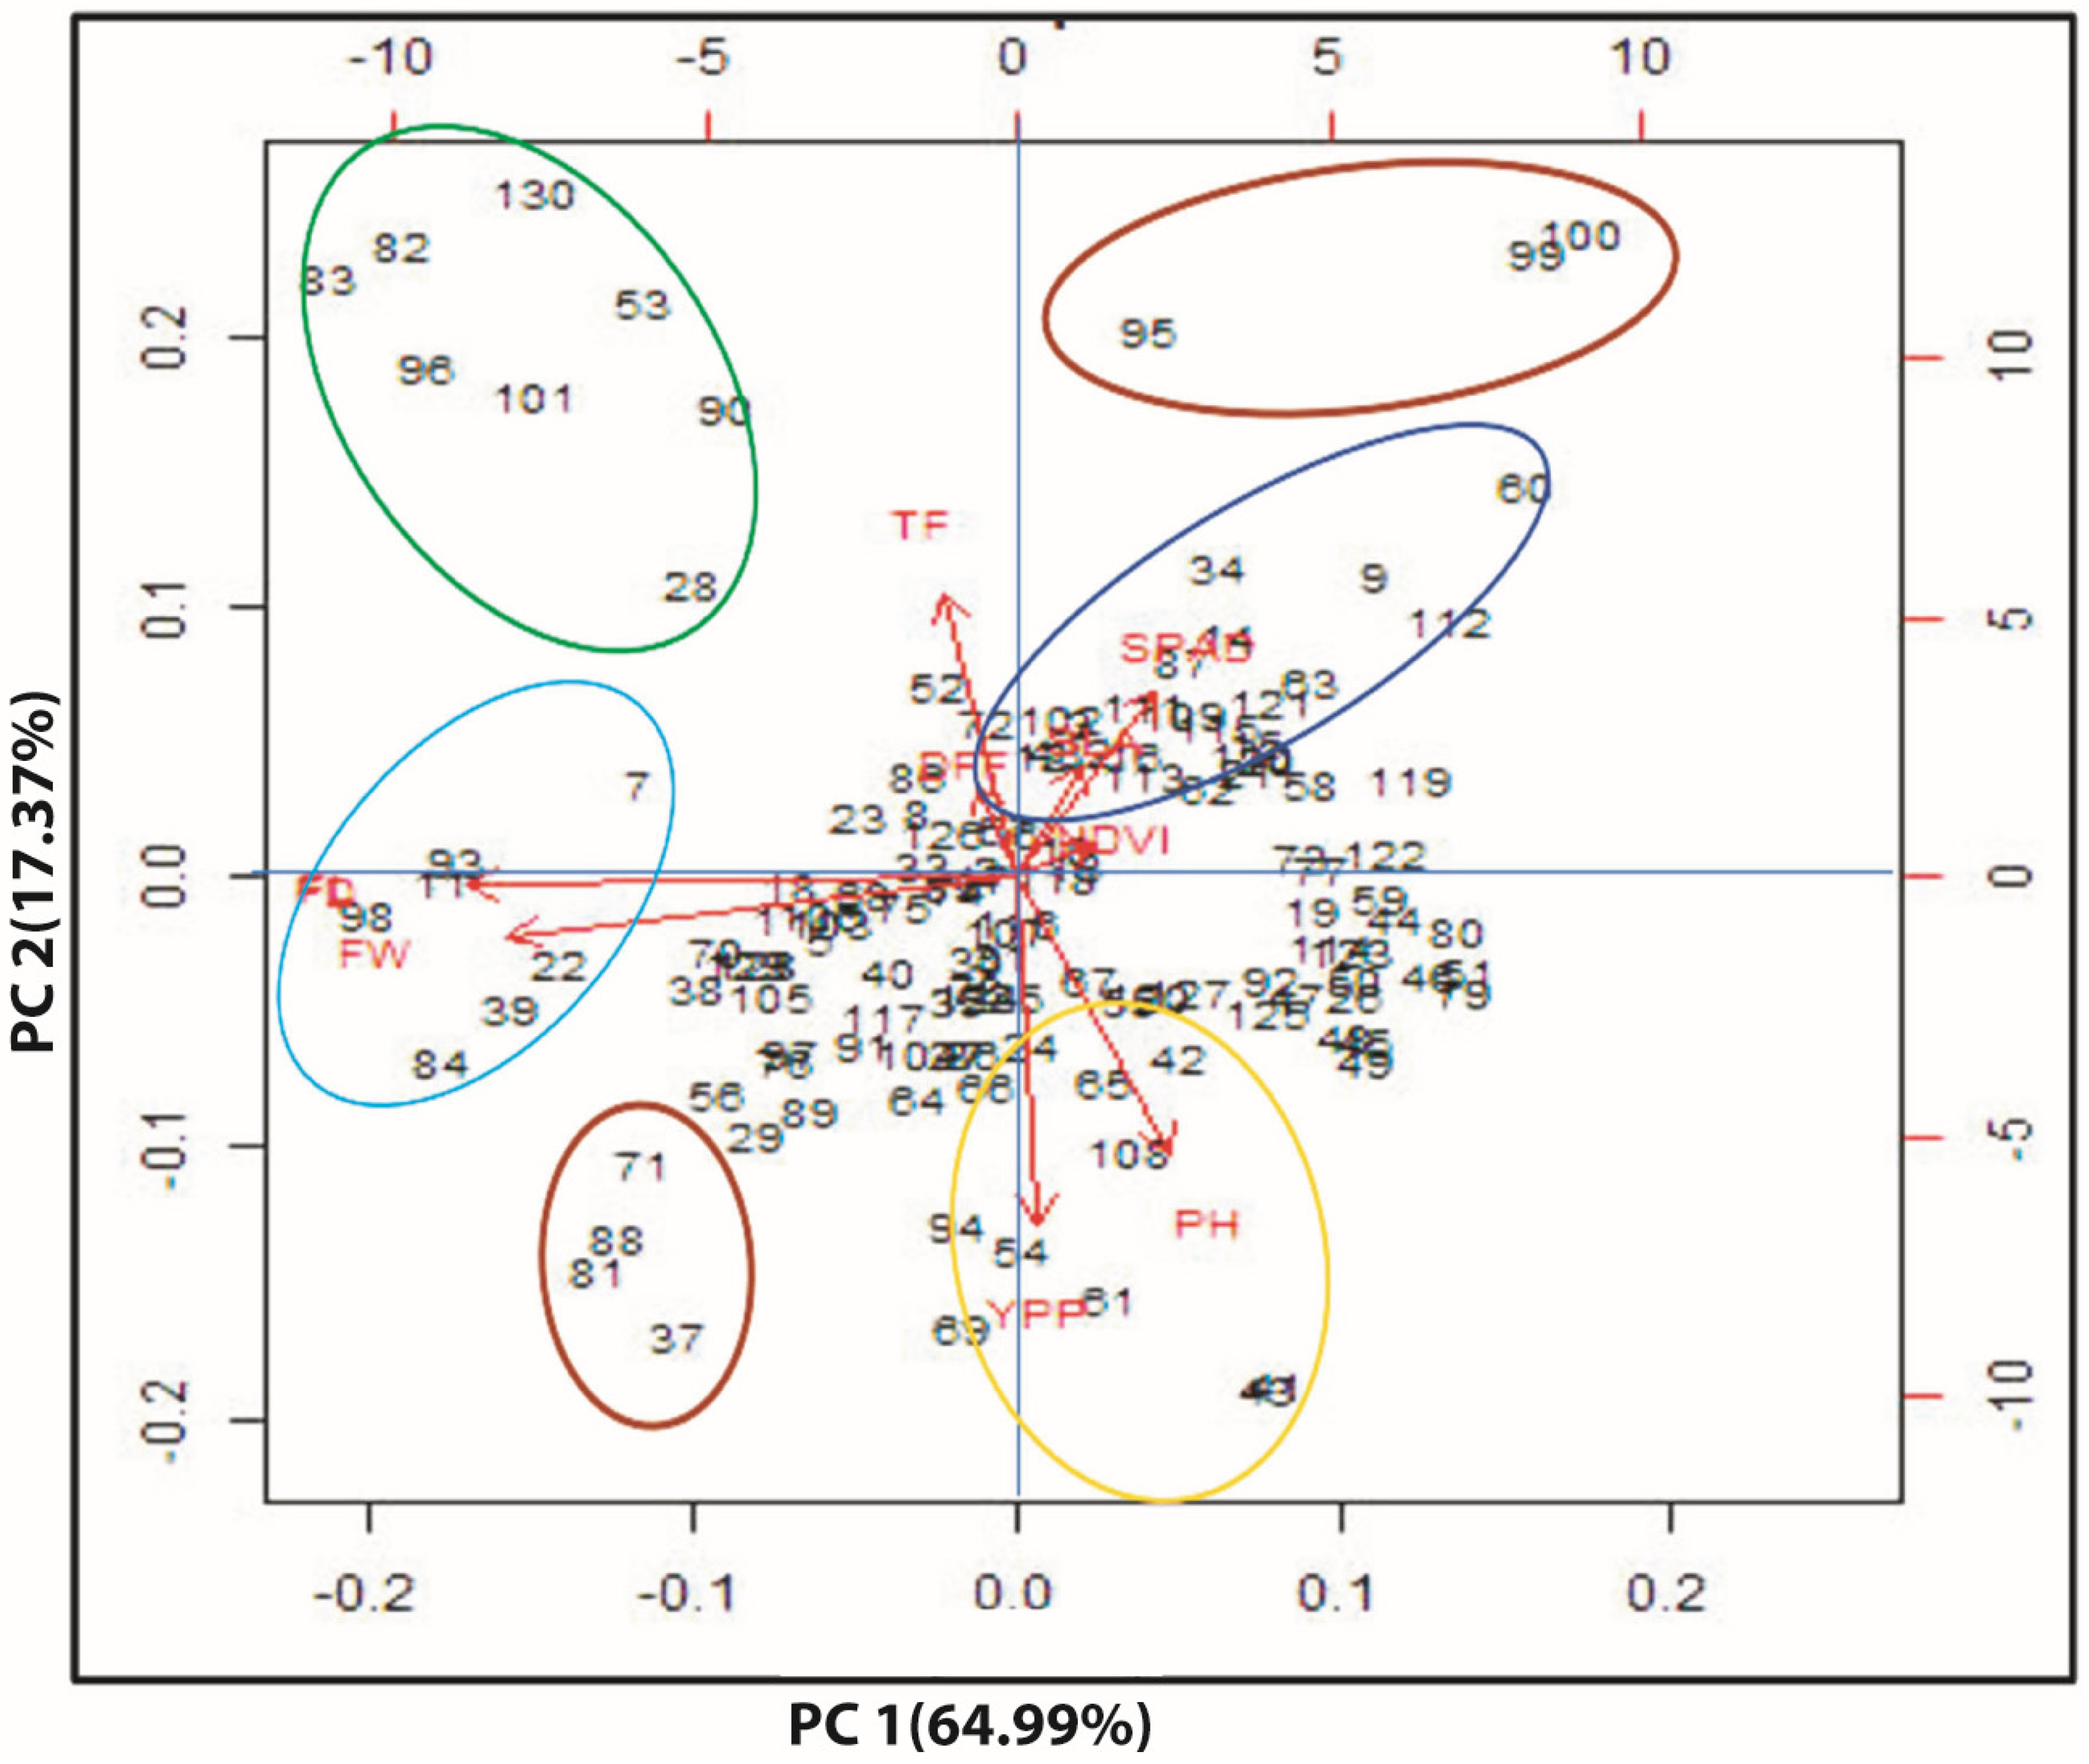
3.7. Multivariate Analysis

Multivariate analysis is a tool to find patterns and relationships between several variables simultaneously. To understand the relationship among 130 eggplant genotypes with various morpho-physiological traits, principal component, biplot, and heatmap analysis were done which revealed different clusters of genotypes that performed better in different aspects. The genotypes by traits biplot were constructed from a two-way matrix of 10 morpho-physiological traits and 130 eggplant genotypes using the relative value of the trait (Figure 4). Again, biplot analysis showed the trait profiles of the genotypes, especially, those genotypes positioned far away from the origin and the results indicated a correlation between traits with genotypes. Again, traits on opposite sides of the origin are negatively correlated and traits near each other are positively correlated. Moreover, traits at 90° to each other are not correlated, concerning the origin. The principal component (PC) analysis identified a total of 10 principal components (PCs) for the morpho-physiological traits. Among them, the first two PC explained 82.26% of the entire morpho-physiological variations (Figure 4). This biplot revealed superior genotypes with higher levels of expression of favorable trait combinations. The total outcome proposed that TF, FD, SLA, FW, PH, and YPP could help to detect superior genotypes in elite germplasm.

3.8. Heatmap Analysis

The heatmap represented the overall performance of 10 observable traits among the 130 germplasm. A heatmap is a two-dimensional data visualization technique that uses color to show the scope of a phenomenon. Color variation by hue or intensity provides the reader with a visual representation of how the phenomenon is grouped or varies over space. It depicts the relative patterns of highly abundant features against a background of mostly low-abundance features (Figure 5).
A heatmap analysis of characteristics was performed to demonstrate a chromatic examination of the genotypes. The heatmap analysis produced two dendrograms: one in the vertical direction, representing the germplasm, and one in the horizontal direction, representing the traits that caused the diffusion. The red diagonal depicts each accession’s perfect connection to itself. The relationship measurements for pairs of germplasm are represented by the symmetric off-diagonal elements. Based on the morpho-physiological properties of the germplasm studied, six clusters emerged through hierarchical clustering (Figure 5). Group (a) included 43 germplasm from clusters v (30 germplasm) and vi (13 germplasm), while group (b) included the remaining 87 germplasm from four clusters. Out of a total of 87 germplasm, cluster-i received 33, cluster-ii received 13, cluster-iii received 30, and cluster-iv received 11 (Figure 5). Dendrogram two also revealed two significant groups: group (a) is associated with seven traits (FD, FL, FW, YPP, NDVI, SPAD, and TF), while group (b) is associated with three traits (DFF, PH, and SLA) (b). Surprisingly, the dendrogram two groups and sub-groups revealed the disparity effects of different eggplants.

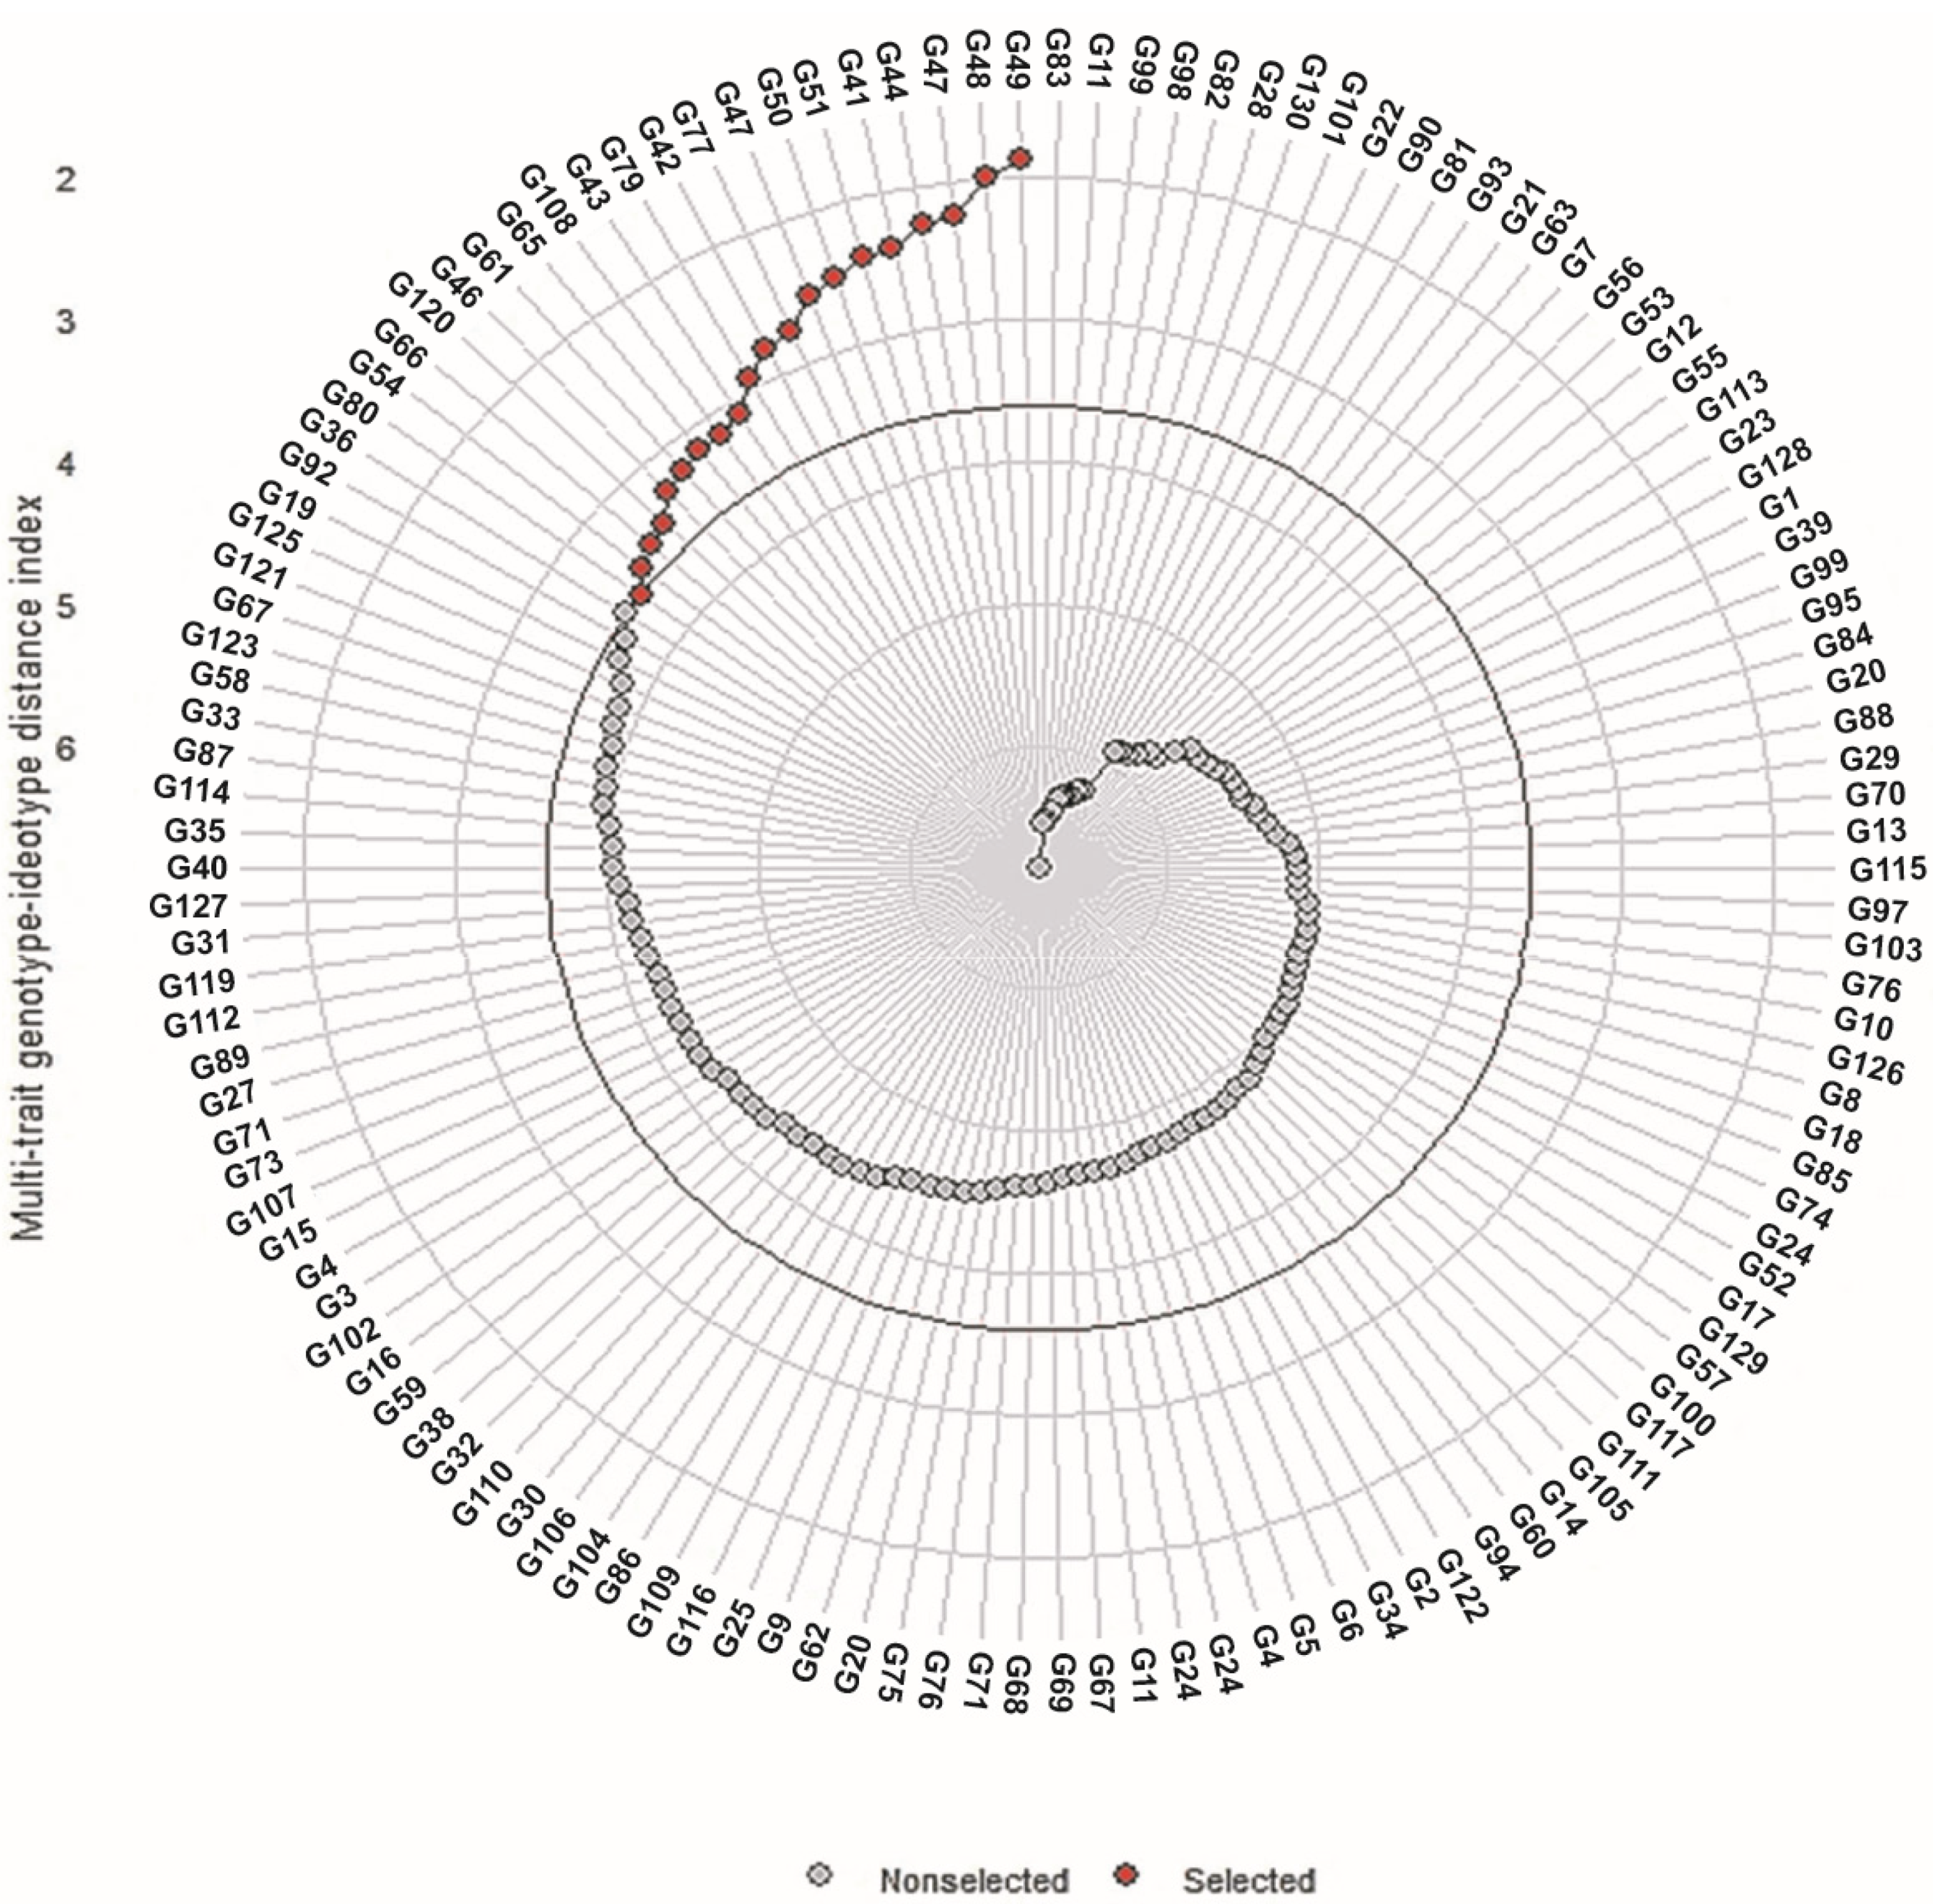
3.9. Multi-Trait Index Based on Factor Analysis and Genotype-Ideotype Distance (MGIDI)

The MGIDI index was intended to select the genotypes with respect to considering all measured traits. Based on the analysis, a highly significant genotypic effect was noted for 10 measured traits involving DFF (Day), PH (cm), FD, FL, FW, NDVI, SLA (cm2), SPAD, TF, and YPP (kg) (Table 1). The broad-sense heritability (h2) ranged from 71.07% (for DFF) to 98.25% (for SLA). All filtered traits are evaluated with high heritability values, which indicates that the selection gain of these traits is promising. Among selected traits, traits FD, FL, FW, TF, and YPP showed the highest genetic advanced mean. However, the genotypes selected using the MGIDI index were G80, G54, G66, G120, G46, G61, G65, G108, G4, G79, G42, G77, G47, G50, G51, G43, G44, G48, and G49 (Figure 6). The strengths and weaknesses of all the genotypes are shown in Figure 7.

4. Discussion

In the present study, numerous qualitative and quantitative features were assessed in 130 brinjal genotypes in order to discover superior genotypes. Genetic diversity research is critical for the successful evaluation, preservation, and use of germplasm resources [40]. The breeding strategy is mostly determined by the degree of genetic variation, and morphological characteristics are viewed as a critical initial step in characterizing and identifying plant genetic resources [41]. Screening for qualitative and quantitative features is crucial for determining a plant’s socioeconomic preferences.

4.1. Qualitative Traits

All qualitative traits are found to have significant variations except leaf hairs, corolla color, fruit cross-section, and fruit position (Table 2 and Table 3). Some other previous reports also published a similar type of fruit curvature [42,43,44]. Eggplant is a herbaceous plant, mostly upright in nature [45]. Our results demonstrated that 17.69% upright, 49.23% intermediate, and 33.08% prostrate growth habit among all the studied genotypes (Table 2). Shekar et al. [46] clustered the eggplant plants into upright and intermediate. Islam et al. [42] saw 48% intermediate, 45% upright, and 7% prostrate growth habit at vegetative stage among the studied genotypes. They suggested that the plant growth habit is used for the identification of eggplant varieties.
As per leaf blade length, eggplant genotypes were divided into two groups, viz., intermediate and short [47]. They reported that 30 genotypes had intermediate leaf blade length while five genotypes showed short leaf blade length. Similarly, based on leaf blade width, the genotypes were divided into three types, viz., wide, intermediate, and narrow [45]. Osei et al. [13] found significant variation in leaf blade length and width in eggplant. In the current study, we distributed eggplant genotypes into three types, viz., very strong (5 genotypes), strong, intermediate (43 genotypes), and weak (59 genotypes), based on leaf blade lobing (Table 2). Sunseri et al. [48] reported 60% weak, 37% intermediate, and 3% strong leaf blade lobbing in eggplant. In our investigation, 6 genotypes had very acute, 28 had acute leaf blade tip angle followed by intermediate leaf blade tip angle, which includes 64 genotypes, while 32 genotypes each had obtuse. Sunseri et al. [48] observed 62% acute, 33% very acute, and 5% intermediate leaf blade tip angle in eggplant. Dash et al. [49] noticed acute leaf blade tip angle in many eggplant genotypes. A much higher variation was observed in leaf prickle (Table 2), where most of the genotype (72 genotypes) had intermediate prickle on the leaf. Sunseri et al. [48] noted that leaf prickles were absent in 25% of genotypes, whereas the remaining genotypes produced 40% very few, 25% few, and 5% both intermediate and many prickles. Tiwari et al. [50] noted prickles in stem, petiole, calyx including peduncle, and leaf including veins in eggplant. Many leaf hairs (98.46%) are found in most of the genotypes. Light violet (31.54%), pale violet (64.62%), and white (3.85%) colors were noted among the studied genotypes for corolla Color (Table 2).
In the present study, we described eight distinctive traits of eggplant fruits (Table 3). For traits related to the fruit calyx prickles, fruit color distribution, fruit color at ripening, and fruit flesh density much higher variation were observed in the cultivated eggplant (Table 3). Similar kinds of fruit calyx prickle distribution were also reported by [45]. It was noticed that 68 genotypes had no curvature on fruit; 37 genotypes showed slightly curved fruit and 25 genotypes had curved fruit. Sunseri et al. [48,51] reported sickle-shaped, snaked-shaped, curved, and U-shaped eggplant fruits along with fruits with no curvature. Eggplant genotypes were distributed into two types: rounded (39 genotypes) and depressed (91 genotypes), on the basis of fruit apex shape. Sunseri et al. [48] reported that 38, 34, and 28% of eggplant genotypes had depressed, rounded, and protruded types of fruit apex shape, respectively. Eggplant fruits traits variations are important in protection from UV irradiation, insect attack in plants as well as socio-economic value. More fruit color variation was noted by [52] and [53], which support our present study. Solaimana et al. [51] found uniform and stripped fruit color distribution. The variations in fruits color were also described by [51,54,55]. Tiwari et al. [50] divided the eggplant fruits into six color groups i.e., green (37.27%), purple (25.45%), milky white (13.62%), purple-black (12.72%), light purple or lilac grey (9.09%), and scarlet red (1.08%). Fruit flesh density is an important characteristic for the determination of fruit volume and weight. A wide range of variation was observed in fruit flesh density, the highest number of genotypes had very loose flesh density (74 genotypes).

4.2. Quantitative Traits

4.2.1. Genetic Components

The proposed index of 0–10% for low, 10–20% for moderate, and 20% for high variation was used to characterize the projected GCV and PCV values. In our experiment, closer PCV and GCV values were estimated in most of the traits which possibly were less influenced by the environment suggesting the reliability of selection based on these traits. The assessed 10 quantitative traits exhibited a wide range of variation and more or less similar results were observed by [48,53,56]. The selection procedure considers the differences between traits based on the degree of heredity. In order to understand the predicted selection benefits, assessing genetic progress may be an important method for improving crops. Several studies have shown that selection can effectively use available genetic variations with a certain degree of heritability to improve specific traits [26,57]. The concern of both heritability and genetic advance is more effective over the distinctively use of heritability. We found that the phenotype variance values of all traits were higher than the genotype variance, indicating that the environment regulates the expression of traits. The same kind of outcome also was gained from several studies for various traits in eggplant [51,58,59,60,61].
The evidence of the traits having essential potential in the assortment process due to low environmental impacts was calculated using strong GA with hBS for all yield-related traits except DFF. Heterosis breeding has the potential to improve traits with poor heritability and genetic advance [28]. Regarding the hBS and GA index [62], which were greater than 60% for high, 30–60% for moderate, and 0–30% for low, we discovered that all traits were highly heritable together with a high genetic advance mean value except DFF, implying that direct selection can be effective for eggplant crop improvement based on these traits with the effect of additive genes; a more or less similar result was obtained by many researchers [63,64]. Due to the strong influence of the environment on genetic effects, low to moderate heritability and genetic advanced values will inhibit the improvement of traits. Therefore, effective selection can only be achieved by selecting higher values of GCV, PCV, hBS, and GA, which means that the influence of additive genes is more stable than the influence of the environment. High GAM was also observed for all traits except DFF. This revealed that if the selection was carried out for the next generation for these features, a greater improvement in the population mean may be seen.

4.2.2. Correlation Matrix

The plant breeding correlation matrix is an outstanding method to assess the relationship between two or more variables. For higher genotype selection procedures, considering the correlation matrix can be a scaling measure [65]. In the correlation matrix, DFF displayed a strong positive correlation with FL, while NDVI was correlated negatively, FW and PH showed a moderate positive correlation with YPP (Figure 6). A moderate to positive significant association can be proposed; selection based on these traits can help increase the yield of this crop. More or less similar results were consistent with the study of [28,64,66,67].

4.3. Multivariate Statistical

Compared with univariate and bivariate statistical methods, multivariate statistical methods can analyze more than one relationship at the same time. There are many multivariate data analysis methods, each of which has a different purpose, such as Regression analysis, factor analysis, cluster analysis, analysis of variance, discriminant analysis, etc. [68]. Biplot analysis is usually employed to assess the component effects creating the genotypic variations.
The highest values indicate the highest influence of the trait on the total variation. Biplot analysis determines varietal stability in the multi-environmental trial [69]. It describes the relationship between different genotype traits. The association between morpho-physiological traits among the 130 genotypes was observed by the biplot analysis [70]. Again, the biplot analysis showed the trait profiles of the genotypes, especially, those genotypes positioned far away from the origin and the results indicated a correlation between traits with genotypes (Figure 4). An acute angle between two elements indicates a positive correlation, and an obtuse angle between two elements indicates a negative correlation. As a result, principal components (PC) analysis provides a good screening of available genotypes and aids in the selection of possible parents for crop breeding initiatives. In our data, the first two PC accounted for 82.36% of the overall variation (Figure 4). The yield potential of accessions was represented in PC 1; thus, the accessions contributing to this component are likely to undergo direct selection, or selected parents can be used in hybridization operations. These PC1 results are consistent with the results of the correlation analysis. The figure summarizes the information of the matrix in principal components, where the cosine of the angle between the vectors connecting the objects to the origin is proportional to the correlation coefficient between these objects. The heatmap shows the highest and lowest values of each genotype in different colors against all the traits comparing. The intensity of the color indicates the degree of high or low of the traits. Hierarchical clustering based on the morpho-physiological traits of the studied germplasm revealed six clusters (Figure 5). The heatmap analysis depicted the degree of correspondence among the morphological traits assessed in brinjal genotypes, and this result was consistently supported by [71,72].

4.4. Multi-Trait Index Based on Factor Analysis and Genotype-Ideotype Distance (MGIDI)

Experienced breeders often try to combine several desired traits into a new genotype to produce high performance. When measuring multiple traits, it is often difficult to select a genotype from the ideotypes. In this regard, various multivariate methods are widely used, such as principal component analysis, factor analysis, cluster analysis, and different samples to group measured traits or select test genotypes [73]. We used a two-way heat map clustering pattern and PCA to connect test genotypes and measured attributes in this study (Figure 6 and Figure 7), however, we could not pick specific genotypes. To make the selection of genotypes with several features easier, [27] the recently introduced MGIDI (multi-trait genotype-ideotypes distance index) is a new method for genotype selection based on multiple trait information. The eggplant genotypes were ranked based on information on measured multiple traits (Figure 7). The MGIDI index selected genotypes G80, G54, G66, G120, G46, G61, G65, G108, G4, G79, G42, G77, G47, G50, G51, G43, G44, G48, and G49 as promising eggplant genotypes. Apart from these genotypes, G80 was very close to the cut point, which recommends that this genotype can exist desirable features. Hence, the researcher should pay particular attention to assessing genotypes that are very close to the cut point [27]. The application of the MGIDI index to plant crop research is predicted to grow rapidly. Similarly, This index was used to find the best strawberry genotype [74].

5. Conclusions

The current study clearly established that the improvement of brinjal yield and related traits can be obtained through selection with the valuation of different genetic parameters analysis. Most of the qualitative traits showed distinct variations among the germplasm. Qualitatively, the maximum variation was observed in leaf prickles, fruit calyx prickles, fruit color at ripening, and fruit flesh density. Quantitatively, the highest variation was observed in fruit yield per plant which was followed by fruit weight. Nevertheless, the present study has shown that selection with the evaluation of various analyzes of genetic parameters such as GCV, PCV, hBS, and GA can achieve an improved eggplant yield and related traits. It can be observed that practically all of the agronomic traits tested in this study exhibit significant variability based on the recorded data and additional analyses (heatmap analysis, correlation matrix, PCA, MGIDI analysis). Therefore, the germplasm G80, G54, G66, and G120 might be considered as best parents based on the qualitative and quantitative characters for the future breeding program. The present findings have a great genetic potential for the studied germplasm. Concurrently, the promising germplasm identified in the present study might be used in future breeding programs for eggplant improvement.

Supplementary Materials

The following are available online at https://www.mdpi.com/article/10.3390/horticulturae7100376/s1, Table S1: Experimental materials (130 genotypes) with estimated parameters.

Author Contributions

Conceptualization, M.S.U. (Md. Shalim Uddin), M.B., R.A., S.R., N.J., M.G.H., S.A.B., M.S.U. (Md. Sorof Uddin), A.B.M.K., M.G.A., N.H. and M.A.L.A.; methodology, M.S.U. (Md. Shalim Uddin), M.B., R.A. and S.R.; software, M.S.U. (Md. Shalim Uddin) and A.H.; validation, M.S.U. (Md. Shalim Uddin) and A.B.M.K.; formal analysis, M.S.U. (Md. Shalim Uddin) and A.H.; investigation, M.S.U. (Md. Shalim Uddin), M.B., R.A., S.R., N.J., M.G.H., S.A.B., M.S.U. (Md. Sorof Uddin), A.B.M.K., M.G.A., N.H. and M.A.L.A.; resources, M.S.U. (Md. Shalim Uddin); data curation, M.S.U. (Md. Shalim Uddin) and A.H.; writing—original draft preparation, M.S.U. (Md. Shalim Uddin), M.B., R.A., S.R., N.J., M.G.H., S.A.B., Md. Sorof Uddin, A.B.M.K., M.G.A., N.H. and M.A.L.A.; writing—review and editing M.A., A.G. and A.H.; visualization, M.S.U. (Md. Shalim Uddin), M.B., R.A., S.R., N.J. and M.G.H.; supervision, M.S.U. (Md. Shalim Uddin); project administration, M.S.U. (Md. Shalim Uddin), M.A. and A.G.; funding acquisition, M.S.U. (Md. Shalim Uddin), M.A., A.G. and A.H. All authors have read and agreed to publish the current version of the manuscript.

Funding

The current work was funded by Project Implementation Unit, National Agricultural Technology Program-Phase II Project (NATP-2) using the research fund of WB, IFAD and GoB through Ministry of Agriculture and Taif University Researchers Supporting Project number (TURSP 2020/257), Taif University, Taif, Saudi Arabia.

Institutional Review Board Statement

Not applicable.

Informed Consent Statement

Not applicable.

Data Availability Statement

Data recorded in the current study are available in all Tables and Figures of the manuscript.

Acknowledgments

The research has been conducted in Bangladesh Agricultural Research Institute (BARI) under the Program Based Research Grant (PBRG), Sub-Project entitled “Collection and Characterization of Important Plant Genetic Resources in Bangladesh.” The project was approved by Project Implementation Unit National Agricultural Technology Program-Phase II Project (NATP-2), Bangladesh Agricultural Research Council (BARC), Ministry of Agriculture, Bangladesh. The authors also extend their appreciation to Taif University for funding current work by Taif University Researchers Supporting Project number (TURSP 2020/257), Taif University, Taif, Saudi Arabia.

Conflicts of Interest

The authors declare no conflict of interest.

References

  1. Aubriot, X.; Daunay, M.-C. Eggplants and relatives: From exploring their diversity and phylogenetic relationships to conservation challenges. In The Eggplant Genome; Springer: Berlin/Heidelberg, Germany, 2019; pp. 91–134. [Google Scholar]
  2. Minardi, A. Food Security in Developing Countries: The Case of “Production of Appropriate Food: Sufficient, Safe and Sustainable” Project. Ph.D Thesis, (Ph.D. in Agro-Food System, Academic Year 2017/2018). Catholic University of Sacred Heart, Via Emilia Parmense, Piacenza, Italy, 2019. Available online: http://tesionline.unicatt.it/bitstream/10280/67851/1/tesiphd_completa_Minardi.pdf (accessed on 15 July 2021).
  3. Bhagirath, C.; Kadambini, G. The Development and Regulation of Bt Brinjal in India (Eggplant/Aubergine); International Service for the Acquisition of Agri-biotech Applications: Ithaca, NY, USA, 2009. [Google Scholar]
  4. BBS. Statistical Yearbook of Bangladesh. Bangladesh Bureau of Statistics; Ministry of Planning, Government of the Peoples’ Republic of Bangladesh: Dhaka, Bangladesh, 2020; p. 139.
  5. Prabakaran, R.K.-S.; Balakrishnan, S.; RameshKumar, S.; Arumugam, T.; Anandakumar, C. Genetic diversity, trait relationship and path analysis in eggplant landraces. Electron. J. Plant 2015, 6, 831–837. [Google Scholar]
  6. Van der Weerden, G.M.; Barendse, G.W. A web-based searchable database developed for the EGGNET project and applied to the Radboud University Solanaceae database. Acta Hortic. 2007, 745, 503–506. [Google Scholar] [CrossRef]
  7. Boyaci, H.F.; Topcu, V.; Akin, T.; Yildirim, I.K.; Mehmet, O.; Aktas, A. Morphological and molecular characterization and relationships of Turkish local eggplant heirlooms. Not. Bot. Horti Agrobot. Cluj Napoca 2015, 43, 100–107. [Google Scholar] [CrossRef] [Green Version]
  8. Mat Sulaiman, N.N.; Rafii, M.Y.; Duangjit, J.; Ramlee, S.I.; Phumichai, C.; Oladosu, Y.; Datta, D.R.; Musa, I. Genetic variability of eggplant germplasm evaluated under open field and glasshouse cropping conditions. Agronomy 2020, 10, 436. [Google Scholar] [CrossRef] [Green Version]
  9. Muñoz-Falcón, J.; Prohens, J.; Vilanova, S.; Nuez, F. Diversity in commercial varieties and landraces of black eggplants and implications for broadening the breeders’ gene pool. Ann. Appl. Biol. 2009, 154, 453–465. [Google Scholar] [CrossRef]
  10. Gramazio, P.; Prohens, J.; Plazas, M.; Mangino, G.; Herraiz, F.J.; Vilanova, S. Development and genetic characterization of advanced backcross materials and an introgression line population of Solanum incanum in a S. melongena background. Front. Plant Sci. 2017, 8, 1477. [Google Scholar] [CrossRef]
  11. Adeniji, O.; Aloyce, A. Farmer’s knowledge of horticultural traits and participatory selection of African eggplant varieties (Solanum aethiopicum) in Tanzania. Tropicultura 2012, 30, 185–191. [Google Scholar]
  12. Datta, D.R.; Rafii, M.Y.; Misran, A.; Jusoh, M.; Yusuff, O.; Sulaiman, N.M.; Momodu, J. Genetic diversity, heritability and genetic advance of Solanum melongena L. from three secondary centers of diversity. Bangladesh J. Plant Taxonom. 2021, 28, 155–169. [Google Scholar] [CrossRef]
  13. Osei, M.; Oluoch, M.; Osei, C.; Banful, B. Morphological characterisafion of African Eggplant (Solanum spp.) Germplasm in some African countries. Agric. Innov. Sustain. Dev. 2010. Available online: https://library.faraafrica.org/wp-content/uploads/2019/11/Agricultural-Innovations-for-Sustainable-Development.pdf#page=171 (accessed on 15 July 2021).
  14. Plazas, M.; Vilanova, S.; Gramazio, P.; Rodríguez-Burruezo, A.; Fita, A.; Herraiz, F.J.; Ranil, R.; Fonseka, R.; Niran, L.; Fonseka, H. Interspecific hybridization between eggplant and wild relatives from different genepools. J. Am. Soc. Hortic. Sci. 2016, 141, 34–44. [Google Scholar] [CrossRef] [Green Version]
  15. Polignano, G.; Uggenti, P.; Bisignano, V.; Della Gatta, C. Genetic divergence analysis in eggplant (Solanum melongena L.) and allied species. Genet. Resour. Crop. Evol. 2010, 57, 171–181. [Google Scholar] [CrossRef]
  16. Cericola, F.; Portis, E.; Toppino, L.; Barchi, L.; Acciarri, N.; Ciriaci, T.; Sala, T.; Rotino, G.L.; Lanteri, S. The population structure and diversity of eggplant from Asia and the Mediterranean Basin. PloS ONE 2013, 8, e73702. [Google Scholar]
  17. Syfert, M.M.; Castañeda-Álvarez, N.P.; Khoury, C.K.; Särkinen, T.; Sosa, C.C.; Achicanoy, H.A.; Bernau, V.; Prohens, J.; Daunay, M.C.; Knapp, S. Crop wild relatives of the brinjal eggplant (Solanum melongena): Poorly represented in genebanks and many species at risk of extinction. Am. J. Bot. 2016, 103, 635–651. [Google Scholar] [CrossRef] [PubMed] [Green Version]
  18. Taher, D.; Solberg, S.Ø.; Prohens, J.; Chou, Y.-y.; Rakha, M.; Wu, T.-h. World vegetable center eggplant collection: Origin, composition, seed dissemination and utilization in breeding. Front. Plant Sci. 2017, 8, 1484. [Google Scholar] [CrossRef] [PubMed]
  19. Collonnier, C.; Fock, I.; Kashyap, V.; Rotino, G.; Daunay, M.; Lian, Y.; Mariska, I.; Rajam, M.; Servaes, A.; Ducreux, G. Applications of biotechnology in eggplant. Plant Cell Tissue Organ Cult. 2001, 65, 91–107. [Google Scholar] [CrossRef]
  20. Daunay, M.-C. Eggplant. In Vegetables II; Springer: Berlin/Heidelberg, Germany, 2008; pp. 163–220. [Google Scholar]
  21. Mutegi, E.; Snow, A.A.; Rajkumar, M.; Pasquet, R.; Ponniah, H.; Daunay, M.C.; Davidar, P. Genetic diversity and population structure of wild/weedy eggplant (Solanum insanum, Solanaceae) in southern India: Implications for conservation. Am. J. Bot. 2015, 102, 140–148. [Google Scholar] [CrossRef]
  22. Praneetha, K.J.D.S. Evaluation of brinjal (Solanum melongena L.) local types for yield and its quality characters. IJCS 2018, 6, 292–297. [Google Scholar]
  23. Rahman, M.; Islam, K.; Jahan, M.; Uddin, M. Efficacy of some botanicals in controlling brinjal shoot and fruit borer, Leucinodes orbonalis. Progress. Agric. 2009, 20, 35–42. [Google Scholar] [CrossRef] [Green Version]
  24. Sharmin, D.; Meah, M.; Moniruzzaman, M. Inheritance of resistance to phomopsis blight and fruit rot in brinjal. J. Agrofor. Environ. 2010, 3, 135–140. [Google Scholar]
  25. Rocha, J.R.D.A.S.D.C.; Machado, J.C.; Carneiro, P.C.S. Multitrait index based on factor analysis and ideotype-design: Proposal and application on elephant grass breeding for bioenergy. Gcb Bioenergy 2018, 10, 52–60. [Google Scholar] [CrossRef]
  26. Sellami, M.H.; Lavini, A.; Pulvento, C. Phenotypic and Quality Traits of Chickpea Genotypes under Rainfed Conditions in South Italy. Agronomy 2021, 11, 962. [Google Scholar] [CrossRef]
  27. Olivoto, T.; Nardino, M. MGIDI: Toward an effective multivariate selection in biological experiments. Bioinformatics 2021, 37, 1383–1389. [Google Scholar] [CrossRef] [PubMed]
  28. Banerjee, S.; Verma, A.; Bisht, Y.S.; Maurya, P.; Jamir, I.; Mondal, S.; Bhattacharjee, T.; Chattopadhyay, A. Genetic variability, correlation coefficient and path coefficient analysis in brinjal germplasm. Int. J. Chem. Stud. 2018, 6, 3069–3073. [Google Scholar]
  29. Guide, F.F.R. Bangladesh Agricultural Research Council (BARC); BARC: Dhaka, Bangladesh, 2012.
  30. Withers, L.A.; Wheelans, S.K.; Williams, J.J.E. In vitro conservation of crop germplasm and the IBPGR databases. Euphytica 1990, 45, 9–22. [Google Scholar] [CrossRef]
  31. Reynolds, M.; Balota, M.; Delgado, M.; Amani, I.; Fischer, R. Physiological and morphological traits associated with spring wheat yield under hot, irrigated conditions. Funct. Plant Biol. 1994, 21, 717–730. [Google Scholar] [CrossRef]
  32. Radford, P. Growth analysis formulae-their use and abuse 1. Crop. Sci. 1967, 7, 171–175. [Google Scholar] [CrossRef]
  33. Rocha, J.R.D.A.S.D.C.; Nunes, K.V.; Carneiro, A.L.N.; Marçal, T.D.S.; Salvador, F.V.; Carneiro, P.C.S.; Carneiro, J.E.S. Selection of superior inbred progenies toward the common bean ideotype. Agron. J. 2019, 111, 1181–1189. [Google Scholar]
  34. Pinherio, J.; Bates, D.; DebRoy, S.; Deepayan, S.; Team, R.C. Linear and Nonlinear Mixed Effects Models. R Package Version 3.1-145. 2007, Volume 3, pp. 1–89. Available online: https://ftp.uni-bayreuth.de/math/statlib/R/CRAN/doc/packages/nlme.pdf (accessed on 15 July 2021).
  35. Aravind, J.; Mukesh, S.; Wankhede, D.; Kaur, V. Augmented RCBD: Analysis of Augmented Randomised Complete Block Designs. R Package Version 0.1. 2020, Volume 2. Available online: https://aravind-j.github.io/augmentedRCBD/ (accessed on 15 July 2021).
  36. Falconer, D.S. Problems on Quantitative Genetics; Longman: London, UK, 1983. [Google Scholar]
  37. Burton, G.W. Quantitative inheritance in grasses. 6th Intl. Grassland Cong. Proc. 1952, 1, 227–238. [Google Scholar]
  38. Olivoto, T.; Nardino, M. MGIDI: A novel multi-trait index for genotype selection in plant breeding. Bioinformatics 2020, 1–22. [Google Scholar] [CrossRef]
  39. Wickham, H.; Chang, W.; Wickham, M.H. Package ‘ggplot2’. Create elegant data visualisations using the grammar of graphics. R Package Version 2016, 2, 1–189. [Google Scholar]
  40. Sarkar, M.; Kundagrami, S. Multivariate analysis in some genotypes of mungbean [Vigna radiata (L.) Wilczek] on the basis of agronomic traits of two consecutive growing cycles. Legume Res. Int. J. 2016, 39, 523–527. [Google Scholar] [CrossRef] [Green Version]
  41. Carrillo-Perdomo, E.; Vidal, A.; Kreplak, J.; Duborjal, H.; Leveugle, M.; Duarte, J.; Desmetz, C.; Deulvot, C.; Raffiot, B.; Marget, P. Development of new genetic resources for faba bean (Vicia faba L.) breeding through the discovery of gene-based SNP markers and the construction of a high-density consensus map. Sci. Rep. 2020, 10, 1–14. [Google Scholar]
  42. Islam, M.; Chhanda, R.; Pervin, N.; Hossain, M.; Chowdhury, R. Characterization and genetic diversity of brinjal germplasm. Bangladesh J. Agric. Res. 2018, 43, 499–512. [Google Scholar] [CrossRef]
  43. Begum, F.; Islam, A.A.; Rasul, M.G.; Mian, M.K.; Hossain, M.M. Morphological diversity of eggplant (Solanum melongena) in Bangladesh. Emir. J. Food Agric. 2013, 25, 45–51. [Google Scholar] [CrossRef]
  44. Solaiman, A.H.M.; Nishizawa, T.; Khatun, M.; Ahmad, S. Morphological characterization and genetic diversity studies of promising brinjal genotypes for hybridization program in Bangladesh. J. Adv. Agric. 2014, 3, 218–228. [Google Scholar] [CrossRef]
  45. Parida, H.; Mandal, J.; Mohanta, S. A note on morphological characterization of brinjal (Solanum melongena L.) genotypes. J. Crop. Weed 2020, 16, 250–255. [Google Scholar] [CrossRef]
  46. Shekar, K.C.; Ashok, P.; Sasikala, K. Characterization, character association, and path coefficient analyses in eggplant. Int. J. Veg. Sci. 2013, 19, 45–57. [Google Scholar] [CrossRef]
  47. Kumar, G.; Meena, B.; Kar, R.; Tiwari, S.K.; Gangopadhyay, K.; Bisht, I.; Mahajan, R. Morphological diversity in brinjal (Solanum melongena L.) germplasm accessions. Plant Genet. Resour. 2008, 6, 232–236. [Google Scholar] [CrossRef]
  48. Sunseri, F.; Polignano, G.B.; Alba, V.; Lotti, C.; Bisignano, V.; Mennella, G.; Drsquo, A.; Bacchi, M.; Riccardi, P.; Fiore, M.C.; et al. Genetic diversity and characterization of African eggplant germplasm collection. Afr. J. Plant Sci. 2010, 4, 231–241. [Google Scholar]
  49. Dash, S.P.; Singh, J.; Sharma, D. Morphological characterization of brinjal (Solanum melongena L.) germplasm. J. Pharmacogn. Phytochem. 2019, 8, 1574–1578. [Google Scholar]
  50. Tiwari, S.K.; Bisht, I.S.; Kumar, G.; Karihaloo, J.L. Diversity in brinjal (Solanum melongena L.) landraces for morphological traits of evolutionary significance. Veg. Sci. 2016, 43, 106–111. [Google Scholar]
  51. Solaimana, A.H.M.; Nishizawa, T.; Khatun, M.; Ahmad, S. Physio-morphological characterization genetic variability and correlation studies in brinjal genotypes of Bangladesh. Comput. Math. Biol. 2015, 4, 1–36. [Google Scholar]
  52. Begum, M.N.S.; Shirazy, B.J.; Mahbub, M.M.; Siddikee, M.A. Performance of Brinjal (Solanum Melongena) Genotypes through Genetic Variability Analysis. Am. J. Plant Biol. 2017, 43, 499–512. [Google Scholar]
  53. Shinde, K.; Birajdar, U.; Bhalekar, M.; Patil, B. Genetic divergence in brinjal (Solanum melongena L.). Veg. Sci. 2012, 39, 103–104. [Google Scholar]
  54. Singh, S.; Khemariya, P.; Rai, A.; Rai, A.C.; Koley, T.K.; Singh, B. Carnauba wax-based edible coating enhances shelf-life and retain quality of eggplant (Solanum melongena) fruits. LWT 2016, 74, 420–426. [Google Scholar] [CrossRef]
  55. Hassan, I.; Jatoi, S.A.; Arif, M.; Siddiqui, S.U. Genetic Variability in Eggplant for Agro-Morphological Traits; World Vegetable Center: Tainan, Taiwan, 2015. [Google Scholar]
  56. Premabati Devi, C.; Munshi, A.D.; Behera, T.K.; Choudhary, H.; Saha, P. Characterisation of cultivated breeding lines of eggplant (Solanum melongena L.) and related wild Solanum species from India. J. Hortic. Sci. Biotechnol. 2016, 91, 87–92. [Google Scholar] [CrossRef]
  57. Koundinya, A.; Das, A.; Layek, S.; Chowdhury, R.; Pandit, M.e. Genetic variability, characters association and path analysis for yield and fruit quality components in Brinjal. J. Appl. Nat. Sci. 2017, 9, 1343–1349. [Google Scholar] [CrossRef] [Green Version]
  58. Kumar, S.R.; Arumugam, T.; An, C.; Premalakshmi, V. Genetic variability for quantitative and qualitative characters in Brinjal (Solanum melongena L.). Afr. J. Agric. Res. 2013, 8, 4956–4959. [Google Scholar]
  59. Sherly, J.; Shanthi, A. Variability, heritability and genetic advance in brinjal (Solanum melongena L.). Res. Crop. 2009, 10, 105–108. [Google Scholar]
  60. Singh, O.; Kumar, J. Variability, heritability and genetic advance in brinjal. Indian J. Hortic. 2005, 62, 265–267. [Google Scholar]
  61. Verma, P.; Kushwaha, M.; Panchbhaiya, A. Studies on variability, heritability and genetic advance for yield attributing traits in brinjal (Solanum melongena L.) for two different seasons. Int. J. Curr. Microbiol. Appl. Sci. 2018, 7, 1543–1552. [Google Scholar] [CrossRef]
  62. Chattopadhyay, A.; Dutta, S.; Hazra, P. Characterization of genetic resources and identification of selection indices of brinjal (Solanum melongena L.) grown in eastern India. Veg. Crop. Res. Bull. 2011, 74, 39. [Google Scholar] [CrossRef] [Green Version]
  63. Shende, R.; Desai, S.; Lachyan, T. Genetic variability and response to selection in brinjal (Solanum melangena L.). Int. J. Curr. Res. 2015, 7, 21545–21547. [Google Scholar]
  64. Calus, M.P.; Veerkamp, R.F. Accuracy of multi-trait genomic selection using different methods. Genet. Sel. Evol. 2011, 43, 1–14. [Google Scholar] [CrossRef] [Green Version]
  65. Konyak, W.; Kanaujia, S.; Jha, A.; Chaturvedi, H.; Ananda, A. Genetic variability, correlation and path coefficient analysis of brinjal. SAARC J. Agric. 2020, 18, 13–21. [Google Scholar] [CrossRef]
  66. Saha, S.; Haq, M.E.; Parveen, S.; Mahmud, F.; Chowdhury, S.R.; Harun-Ur-Rashid, M. Variability, correlation and path coefficient analysis: Principle tools to explore genotypes of brinjal (Solanum melongena L.). Asian J. Biotechnol. Genet. Eng. 2019, 2, 1–9. [Google Scholar]
  67. Dugard, P.; Todman, J.; Staines, H. Approaching Multivariate Analysis: A Practical Introduction; Routledge/Taylor & Francis Group: Abingdon, UK, 2010. [Google Scholar]
  68. Otieno, O.V.; Owuor, O.N. Multivariate genotype and genotype by environment interaction biplot analysis of sugarcane breeding data using R. Int. J. Stat. Distrib. Appl. 2019, 5, 22. [Google Scholar]
  69. Yan, W.; Frégeau-Reid, J. Breeding line selection based on multiple traits. Crop. Sci. 2008, 48, 417–423. [Google Scholar] [CrossRef]
  70. Khan, M.M.H.; Rafii, M.Y.; Ramlee, S.I.; Jusoh, M.; Al Mamun, M. Genetic analysis and selection of Bambara groundnut (Vigna Subterranea [L.] Verdc.) Landraces for high yield revealed by qualitative and quantitative traits. Sci. Rep. 2021, 11, 1–21. [Google Scholar]
  71. Meyer, R.S.; Bamshad, M.; Fuller, D.Q.; Litt, A. Comparing medicinal uses of eggplant and related Solanaceae in China, India, and the Philippines suggests the independent development of uses, cultural diffusion, and recent species substitutions. Econ. Bot. 2014, 68, 137–152. [Google Scholar] [CrossRef]
  72. Virga, G.; Licata, M.; Consentino, B.B.; Tuttolomondo, T.; Sabatino, L.; Leto, C.; La Bella, S. Agro-morphological characterization of sicilian chili pepper accessions for ornamental purposes. Plants 2020, 9, 1400. [Google Scholar] [CrossRef] [PubMed]
  73. Bhandari, H.; Bhanu, A.; Srivastava, K.; Singh, M.; Shreya, H.A. Assessment of genetic diversity in crop plants-an overview. Adv. Plants Agric. Res. 2017, 7, 00255. [Google Scholar]
  74. Olivoto, T.; Diel, M.I.; Schmidt, D.; Lúcio, A.D.C. Multivariate analysis of strawberry experiments: Where are we now and where can we go? BioRxiv 2021, 1–10. [Google Scholar] [CrossRef]
Figure 1. Box plots showing the pattern of the measured traits of germplasm. DFF = Days to first flowering (day), FD = Fruit diameter (cm), FL = Fruit length (cm), FW = Fruit weight (g), YPP =Yield plant−1 (kg), NDVI = Normalized difference vegetation index, PH = Plant height (cm), SLA = Single leaf area (cm2), SPAD = Soil plant analyses development, TF = Total number of fruits.
Horticulturae 07 00376 g001
Figure 2. Frequency distribution of the germplasm based on quantitative traits: (A) Plant height, (B) NDVI, (C) SPAD value, (D) SLA, (E) DFF, (F) fruits diameter, (G) fruit length, (H) FW, (I) TF and (J) YPP of eggplant.
Horticulturae 07 00376 g002
Figure 3. Correlation matrix, scatter plot and phenotypic frequency distribution of traits; * p <= 0.05; ** p <= 0.01; *** p > 0.001; DFF = Days to first flowering (day), FD = Fruit diameter (cm), FL = Fruit length (cm), FW = Fruit weight (g), YPP =Yield Plant−1 (kg), NDVI = Normalized difference vegetation index, PH = Plant height (cm), SLA = Single leaf area (cm2), SPAD = Soil plant analyses development, TF = Total number of fruits.
Horticulturae 07 00376 g003
Figure 4. Genotypes by traits (G × T) biplot based on 130 germplasm and 10 quantitative traits of eggplant. DFF =Days to first flowering (day), FD = Fruit Diameter (cm), FL = Fruit Length (cm), FW = Fruit Weight (g), YPP =Yield Per Plant (kg), NDVI = Normalized Difference Vegetation Index, PH = Plant height (cm), SLA = Single Leaf Area (cm2), SPAD = Soil Plant Analyses Development, TF = Total Number of Fruits.
Horticulturae 07 00376 g004
Figure 5. Heatmap showing the clustering pattern of 130 eggplant genotypes with 10 morpho-physiological traits. Heat map displaying the relationship matrix among Eggplant genotypes. The red diagonal represents a perfect relationship of each accession with itself. The symmetric off-diagonal elements represent the relationship measures for pairs of genotypes. The white of warmer colors on the diagonal show clusters of closely related genotypes. DFF = Days to first flowering (day), FD = Fruit diameter (cm), FL = Fruit length (cm), FW = Fruit weight (g), YPP = Yield plant−1 (kg), NDVI = Normalized difference vegetation index, PH = Plant height (cm), SLA = Single leaf area (cm2), SPAD = Soil plant analyses development, TF = Total number of fruits.
Horticulturae 07 00376 g005
Figure 6. Germplasm ranking and selected germplasm from 130 local germplasm through multi-trait genotype-ideotypes distance index (MGIDI) considering 15% selection intensity.
Horticulturae 07 00376 g006
Figure 7. The strengths and weaknesses of all the genotypes.
Horticulturae 07 00376 g007
Table 1. Fourteen qualitative traits and ten quantitative traits.
Sl. No.TraitCodeSl. No.TraitCode
Qualitative TraitsQuantitative Traits
1.Plant Growth HabitPGH15.Days to First FloweringDFF (Day)
2.Leaf Blade LobingLBL16.Plant HeightPH (cm)
3.Leaf Blade Tip AngleLBTA17.Fruit DiameterFD (cm)
4.Leaf PricklesLP18.Fruit LengthFL (cm)
5.Leaf HairsLH19.Fruit WeightFW (g)
6.Corolla ColorCC20.Normalized Difference Vegetation IndexNDVI
7.Fruit Calyx PricklesFCP21.Single Leaf AreaSLA (cm2)
8.Fruit Color DistributionFCD22.Soil Plant Analyses DevelopmentSPAD
9.Fruit CurvatureFC23.Total Number of FruitsTF
10.Fruit Apex ShapeFAS24.Yield Per PlantYPP (kg)
11.Fruit Cross SectionFCS
12.Fruit Color at RipeningFCR
13.Fruit Flesh DensityFFD
14.Fruit PositionFP
Table 2. Variability in growth and foliage traits in eggplant germplasm.
Trait NamesDescriptor StateNo. of GermplasmGermplasm (%)
Plant Growth HabitUpright2317.69
Intermediate6449.23
Prostrate4333.08
Leaf Blade LobingWeak5945.38
Intermediate4333.08
Strong2317.69
Very strong53.85
Leaf Blade Tip AngleVery acute64.62
Acute2821.54
Intermediate6449.23
Obtuse3224.62
Leaf PricklesVery few1310.00
Few3829.23
Intermediate7255.38
Many53.85
Very many21.54
Leaf HairsVery many12898.46
Few21.54
CorollaColorLight Violet4131.54
Pale Violet8464.62
White53.85
Table 3. Variability in fruit traits in eggplant germplasm.
Descriptor NameDescriptor StateNo. of GermplasmGermplasm (%)
Fruit Calyx PricklesVery few32.31
Few3123.85
Intermediate4937.69
Many3224.62
Very many1511.54
Fruit Color DistributionUniform1813.85
Mottled2116.15
Netted1813.85
Striped7356.15
Fruit CurvatureNone (fruit straight)6852.31
Slightly curved3728.46
Curved2519.23
Fruit Apex ShapeRounded3930.00
Depressed9170.00
Fruit Cross SectionCircular (no grooves)130100.00
Fruit Color at RipeningMilky white21.54
Lilac grey75.38
Purple3224.62
Green with mottled at the distal end5139.23
Green with a yellowish stripe3728.46
Purple with light green at the distal end32.31
Fruit Flesh DensityVery loose (spongy)7456.92
Loose (crumbly)2418.46
Average density2116.15
Dense75.38
Very dense43.08
Fruit PositionPendant130100.00
Table 4. Analysis of variance of the tested quantitative traits.
TraitsSource of Variation
Accession (G) with C
(df = 129)
Check (C)
(df = 3)
Accession (G) vs. C
(df = 1)
Accession (G)
(df = 125)
Adjusted Block (B)
(df = 6)
Residuals
(df = 18)
DFF59.61 **161.62 **0.7 ns57.63 **20.31 ns16.67
FD390.72 **586.56 **766.74 **383.01 **31.44 ns27.71
FL3.91 **5.87 **7.67 **3.83 **0.31 ns0.28
FW8.63 **49.04 **0.36 ns7.72 **1.67 ns1.27
NDVI0.01 **0.01 ns0.07 **0.01 **0.0023 ns0.0028
PH169.94 **18.57 ns4014.75 **142.81 **3.14 ns7.57
SLA1572.19 **71.58 ns40431.19 **1297.33 **8.38 ns22.74
SPAD59.63 **235.78 **637.78 **50.78 **17.9 ns9.96
TF104.55 **128.42 **68.89 **104.26 **2.54 ns4.25
YPP9.59 **0.9 ns3.89 ns9.84 **0.97 ns1.12
ns, non-significant at p > 0.05; **, significant at p <= 0.01, DFF = Days to first flowering (day), FD = fruit diameter (cm), FL = Fruit length (cm), FW = Fruit weight (g), YPP = Yield plant−1 (kg), NDVI = Normalized difference vegetation index, PH = Plant height (cm), SLA = Single leaf area (cm2), SPAD = Soil plant analyses development, TF = Total number of fruits.
Table 5. Descriptive statistics of measured traits.
TraitMeanStd.ErrorCVMinMaxSkewnessKurtosis
PH111.41.052.5287.82139.570.21 ns2.25 *
NDVI0.560.019.550.330.780.11 ns2.7 ns
SPAD47.50.666.5425.3766.97−0.07 ns3.37 ns
SLA140.533.183.5586.12242.850.56 **2.37 ns
DFF98.40.74.1583.32122.070.46 *3.27 ns
FL47.251.611.353.7124.730.47 *2.71 ns
FD4.720.1611.350.779.470.47 *2.71 ns
FW7.550.2339.5210.00650.400.14 ns2.69 ns
TF18.650.8616.2710.2149.212.25 **7.16 **
YPP7.120.2846.140.2410.570.54 *5.41 **
ns, non-significant; *, ** indicate the significance at 5% and 1% level of probability.
Table 6. Estimation of statistical and genetic parameters of yield and its contributing traits of different eggplant germplasm.
TraitsPVGVGCVGCVPCVPCVhBShBSGAGAMGAM
PH142.81135.2410.44Medium10.73Medium94.7High23.3520.96High
NDVI0.010.004712.26Medium15.46Medium62.92High0.1120.07High
SPAD50.7840.8213.45Medium15Medium80.38High11.8224.88High
SLA1297.31274.625.4High25.63High98.25High7351.95High
DFF57.6340.966.5Low7.71Low71.07High11.1311.31Medium
FD383.01355.339.9High41.42High92.77High37.4579.27High
FL3.833.5539.9High41.42High92.77High3.7579.27High
FW7.726.4633.65High36.8High83.61High4.7963.47High
TF104.26100.0153.64High54.76High95.92High20.21108.37High
YPP9.848.7241.49High44.07High88.63High5.7480.58High
GV = Genotypic variance, PV = Phenotypic variance, GCV = Genotypic coefficients of variation, PCV = Phenotypic coefficients of variation, hBS = broad-sense heritability, GA = Genetic advance at 5% selection intensity, GAM = Genetic advance as the percentage of the mean at 5% selection intensity, DFF = Days to first flowering (day), FD = Fruit diameter (cm), FL = Fruit length (cm), FW = Fruit weight (g), YPP =Yield Plant−1 (kg), NDVI = Normalized difference vegetation index, PH = Plant height (cm), SLA = Single leaf area (cm2), SPAD = Soil plant analyses development, TF = Total number of fruits.
Publisher’s Note: MDPI stays neutral with regard to jurisdictional claims in published maps and institutional affiliations.

