Article

Water Use and Yield Responses of Chile Pepper Cultivars Irrigated with Brackish Groundwater and Reverse Osmosis Concentrate

1
Department of Plant and Soil Sciences, Oklahoma State University, 371 Agricultural Hall, Stillwater, OK 74078, USA
2
Department of Plant and Environmental Sciences, New Mexico State University, MSC 3Q, P.O. Box 30003, Las Cruces, NM 88003, USA
3
Department of Extension Plant Sciences, New Mexico State University, MSC 3AE, P.O. Box 30003, Las Cruces, NM 88003, USA
4
Department of Plant and Soil Science, Texas Tech University, Lubbock, TX 79409, USA
5
Brackish Groundwater National Desalination Research Facility, 500 La Velle Road, Alamogordo, NM 88310, USA
*
Author to whom correspondence should be addressed.
Horticulturae 2020, 6(2), 27; https://doi.org/10.3390/horticulturae6020027
Submission received: 3 March 2020 / Revised: 29 March 2020 / Accepted: 20 April 2020 / Published: 6 May 2020

Abstract

:
Freshwater availability is declining in most of semi-arid and arid regions across the world, including the southwestern United States. The use of marginal quality groundwater has been increasing for sustaining agriculture in these arid regions. Reverse Osmosis (RO) can treat brackish groundwater, but the possibility of using an RO concentrate for irrigation needs further exploration. This greenhouse study evaluates the water use and yield responses of five selected chile pepper (Capsicum annuum L.) cultivars irrigated with natural brackish groundwater and RO concentrate. The four saline water treatments used for irrigation were tap water with an electrical conductivity (EC) of 0.6 dS m−1 (control), groundwater with EC 3 and 5 dS m−1, and an RO concentrate with EC 8 dS m−1. The evapotranspiration (ET) of all chile pepper cultivars decreased and the leaching fraction (LF) increased, particularly in the 5 dS m−1 and 8 dS m−1 irrigation treatments. Based on the water use efficiency (WUE) of the selected chile pepper cultivars, brackish water with an EC ≤ 3 dS/m could be used for irrigation in scarce freshwater areas while maintaining the appropriate LFs. A piecewise linear function resulted in a threshold soil electrical conductivity (ECe) ranging between 1.0–1.3 dS m−1 for the tested chile pepper cultivars. Both piecewise linear and sigmoid non-linear functions suggested that the yield reductions in chile peppers irrigated with Ca2+ rich brackish groundwater were less than those reported in studies using an NaCl-dominant saline solution. Further research is needed to understand the role of supplementary calcium in improving the salt tolerance of chile peppers.

1. Introduction

Freshwater is an integral resource for all ecological and social activities, including food and energy production, industrial growth, and human health. As freshwater resources are unevenly and irregularly distributed [1], many arid and semi-arid parts of the world are facing acute water shortages. Similar water shortages affect the southwestern United States due to low rainfall and high evapotranspiration [2]. As agriculture is the largest consumer of freshwater [3], the use of marginal quality water resources, including brackish groundwater, has been increasing [4,5]. About 75% of the groundwater aquifers in the southwestern United States have brackish water, with an electrical conductivity (EC) of > 3 dS/m [6,7]. Additionally, the desalination of brackish groundwater through Reverse Osmosis (RO) produces potable, low saline water and high saline–sodic wastewater known as RO concentrate [7]. The application of desalinated water for irrigation can promote soil hydrological functions [8]. However, the disposal of RO concentrate from an inland desalination system can be problematic, and its sustainable management is a major environmental challenge that restricts the widespread application of RO for groundwater desalination. RO concentrate could serve as a potential source of irrigation for the production of salt-tolerant crops, along with brackish water available from natural saline aquifers [9,10], which will consequently encourage desalination through RO in freshwater scarce-areas.
Continued irrigation with brackish groundwater can lead to salt accumulation in soil which can lower yields, although plants differ extensively in their response to soil salinity. Most crop plants are glycophytes, which can be affected by even a moderate level of soil salinity [11]. Instead of accumulating salts, most glycophytes produce some chemicals (sugars and organic acids) to raise the concentration of constituents in the root cell. This process requires more energy, and thus their crop growth and yield are more susceptible to damage compared to halophytes [12]. Moreover, salt tolerance within the glycophytes group varies widely [13]. Sugarbeet (Beta vulgaris L.) and wheat (Triticum aestivum L.) are considered salt-tolerant; potato (Solanum tuberosum L.), sunflower (Helianthus annuus L.), maize (Zea mays L.), soybean (Glycine max L. Merrill.), and tomato (Solanum lycopersicum L.) are moderately salt-sensitive; and chickpea (Cicer arietinum L.) and lentil (Lens culinaris Medic.) are salt-sensitive [14].
Chile pepper (Capsicum annuum L.), also a glycophyte, is an important cash crop of the southwestern United States, cultivated over an area of 20,000 acres annually [15]. It is classified as moderately salt-sensitive, with a saturated soil paste extract EC (ECe) threshold value of 1.5 dS m−1 [16]. Studies have also reported threshold values between an ECe of 0–2 dS/m for peppers [17,18]. To the best of our knowledge, most studies on peppers have used NaCl as the sole or the dominant salinizing agent [17,18,19,20,21]. However, Na+, Ca2+, and Mg2+ are the dominant cations, and Cl, SO42−, and HCO3 are the dominant anions in most groundwater across the world [22]. It has been suggested that the adoption of salinizing solutions with a single salt may result in ambiguous and erroneous interpretations about plant responses to salinity [23]. Only a few accounts are available involving the use of natural brackish groundwater for growing chile peppers [24]. Therefore, more research on the use of natural brackish groundwater and RO concentrate for irrigating chile pepper cultivars is needed.
The use of brackish groundwater often brings risks and obligations to an agricultural system. The application of insufficient water quantities causes a lowering of the osmotic potential of soil water, ultimately causing stress to the plants [25], whereas over-application is economically ineffectual and could exacerbate salinity problems, including groundwater contamination [26]. There is very limited information available on the evapotranspiration (ET) responses of the chile pepper to varying irrigation salinity. An understanding of water uptake by the chile pepper under contrasting saline water treatments would allow the exploration of irrigation scheduling protocols for regions utilizing brackish groundwater. Therefore, the objectives of this study were to (1) quantify the influences of brackish groundwater and RO concentrate irrigation on the leaching fraction and water use of five chile pepper cultivars; and (2) determine their yield responses to the resulting soil salinity.

2. Materials and Methods

2.1. Experimental Set Up

The study was conducted in a greenhouse located at the Fabian Garcia Science Center of New Mexico State University (NMSU), Las Cruces, New Mexico (32.2805° N latitude and 106.770° W longitude at an elevation of 1186 m above sea level), consistent with the potential of greenhouse chile pepper production in New Mexico [27] and the New Mexico Department of Agriculture regulation of no land application of water with an EC > 4 dS m−1. The chile pepper cultivars selected for this study were AZ1904 (Curry Chile and Seed, Pearce, AZ, USA), Paprika LB25 (Biad Chile, Leasburg, NM, USA), Paprika 3441 (Olam, Las Cruces, NM, USA), and two NMSU varieties: NuMex Joe E. Parker and NuMex Sandia Select. The natural brackish groundwater and RO concentrate provided by the Brackish Groundwater National Desalination Research Facility (BGRNDRF), Alamogordo, were used in the irrigation treatments (Table 1). Sandy loam soil (78.7% sand, 11% silt, and 10.3% clay) with an initial ECe of 0.87 dS/m was air-dried, crushed, and sieved through a 4 mm sieve. A soil mix was prepared by mixing soil, sand, and organic peat in the ratio 8:1:1 on a volume basis. The soil mix was sterilized in an oven at 80 °C for at least 30 min. The cylindrical pots used in the experiment were 0.14 m in diameter and 0.25 m in depth. The bottom of each pot was perforated and covered with cheesecloth and then gravels to allow free drainage. The soil packing was done in 5 cm depth increments to obtain a bulk density of 1.36 g/cm3. The average day and night temperatures recorded during the study period (148 days) were 31.8 ± 0.2 °C and 24.4 ± 0.1°C.

2.2. Saline Irrigation Treatments

The four irrigation water treatments selected were tap water with the EC 0.6 dS m−1, brackish groundwater with the EC 3 and 5 dS m−1, and an RO concentrate with the EC 8 dS m−1. Before planting, the soil was washed three times with tap water to remove any pre-existing salts, and then the soil salinity was raised to the saline treatment level by irrigating twice with each of the saline water treatments. Four seeds of each chile pepper were sown in pots at a soil depth of 1–2 cm. After emergence, the seedlings were thinned, and only one vigorous seedling was retained in each pot. The irrigation water treatments were continuously applied at an interval of 3–4 days during the experiment period, based on the change in weights of some reference pots. The plants were fertigated using a water-soluble synthetic fertilizer (Miracle-Gro®; 15-30-15) at 2 g L−1 every six weeks.

2.3. Data Collection

The same amount of irrigation (I) was applied manually to each pot, and the deep percolation (D) was measured by collecting all the water coming out of the bottom of each pot. The ET was calculated using the following water balance equation:
ET = P + I − D − R − ΔS
where ET is the actual crop evapotranspiration (cm), P is the precipitation (cm), I is the irrigation amount (cm), D is the deep percolation (cm), R is the runoff (cm), and ΔS is the change in soil water storage (cm). As the experiments were carried out in a greenhouse, the precipitation and runoff were zero. The change in soil water storage (ΔS) was determined from the difference in weights of the pots at planting and final harvest. The leaching fraction (LF) was calculated for every irrigation as the ratio of D and I. The pods were hand-harvested at the horticultural green mature stage, and the fresh pod weights were measured. The water use efficiency (WUE) was calculated as the ratio of the total yield to total crop ET.
At the end of the experiments, the top 10 cm layer of soil was collected from each pot and saturated soil paste extracts were prepared using composite samples and analyzed for their ECe, magnesium (Mg), calcium (Ca), and sodium (Na) ion concentrations [28]. The sodium adsorption ratio (SAR) was determined using the following equation:
S A R =   [ N a + ] ( [ C a 2 + ] [ M g 2 + ] ) 2

2.4. Salinity-Yield Response Equations

The relative yield (Yr) was obtained as the ratio of actual total yield and maximum total yield for each cultivar. The relationship between the ECe at the end of the growing season and the relative yield was predicted using the piecewise linear function [16]:
Y r = 1 b   ( E C e a )
where a = the salinity threshold (dS m−1); b = the yield reduction, or slope (per dS m−1); and ECe = the EC of saturated soil extracts from the root zone (dS m−1).
Similarly, the relationships between the Yr and ECe of each cultivar were best-fitted with the sigmoid non-linear function [29]:
Y r = 1 ( 1 + c c 50 ) p
where Yr = relative yield; c = the EC of saturated soil extracts from the root zone (dS m−1), c50 = root zone ECe at which the yield had declined by 50% (dS m−1) and p is the exponential constant.

2.5. Statistical Analysis

The cylindrical pots for the experiments were arranged in a completely randomized factorial design with eight replicates of each cultivar and a saline water treatment combination. A two-way analysis of variance (ANOVA) was used to identify the significant differences at alpha 5% applying general linear model procedure (PROC GLM) for ET, D, ΔS, and WUE [30]. The means were separated using the least significance difference (LSD) post hoc test at a 5% significance level (p ≤ 0.05). The relationships of the ECe with the concentrations of Mg, Ca, and Na ions and SAR were tested for linear, quadratic and exponential functions using Sigmaplot version 14 (Systat Software Inc., San Jose, CA, USA), and the best fit was selected based on regression statistics. The relative yield response to the ECe was best fitted to the piecewise linear and sigmoid non-linear functions using the ‘nls2′ package in R [31].

3. Results and Discussion

3.1. Leaching Fraction over Growing Season

The leaching fractions (LF) for AZ 1904, NuMex Joe E. Parker, NuMex Sandia Select, Paprika LB25, and Paprika 3441 over the growing season are shown in Figure 1a–e, respectively. For almost one month after planting, LFs were similar for cultivars grown using the four saline water treatments. Over time, variations in the LF appeared and became a function of the irrigation water salinity for all five cultivars. Among the four irrigation water treatments, the LFs for the 0.6 dS m−1 (control) treatment were the least, while they were the most for the 8 dS m−1 RO irrigation treatment throughout the growing season. The differences in LFs of between 0.6 dS m−1 and 3 dS m−1 were considerably smaller compared to the other two treatments in all five cultivars.
The observed higher LFs under the saline treatments could be due to the self-adjusting nature of the plants under water and osmotic stresses. In response to saline irrigation water, the transpiration rate of chile pepper plants would have decreased due to the reduction in water potential caused by accumulated salts at the root zone [32]. Similar increases in LFs at a given irrigation rate occurred due to the reduction in transpiration rates for the bell pepper (Capsicum annuum L.) [33]. In the areas with a shallow water table, more deep percolation could cause secondary salinization [34]. Therefore, it is advisable to explore irrigation scheduling protocols before the application of the concentrate in a field to maintain the soil and groundwater quality [7].

3.2. Water Balance

A total irrigation of 106.3 cm was applied to each pot during the experiment period. The influence of irrigation water salinity on the total crop ET, ΔS and D are shown in Table 2. There was no significant interaction (p > 0.05) between the saline treatments and cultivars for D, ΔS, and ET, while the significant main effects of both the saline treatments and cultivars were observed. The total ET of five chiles showed a significant decrease (p ≤ 0.05) with increasing irrigation water salinity. The highest cumulative ET of the five cultivars was noted at 0.6 dS m−1 (control), which was only 4% greater than 3 dS m−1; however, it was around 12% and 17% greater compared to the 5 dS m−1 and 8 dS m−1 treatments, respectively. The total deep percolation was inversely related to the total crop ET and significantly increased from 24% of the total irrigation amount in the 0.6 dS m−1 (control) to 35% in the 8 dS m−1 (RO concentrate).
The reduction in ET with increasing water salinity could be attributed to retarded plant growth and a decrease in bioavailable water under saline soil conditions. The water uptake of plants, through apoplastic and symplastic pathways at roots, is largely regulated by the osmotic and matric potentials of the root zone [35]. Under saline soil conditions, the reduced osmotic potential affects the free energy of water and decreases the root water uptake by plants, which leads to a reduction in the plant growth and ET and thus an increase in leaching [36]. In addition, a salt crust formed at the top soil layer due to saline irrigation could reduce evaporation from the soil surface [37]. Therefore, the surface crusting (visual observations) could also have played some role in reducing the total ET of the chile pepper.
In contrast to the total ET, NuMex Sandia Select had the greatest D, while Paprika LB 25 and 3441 had the minimum among the five cultivars. The differences noticed in the cumulative ET among the cultivars could be attributed to natural variations in the growth of the cultivars. The overall change in soil water storage was small in all of the pots, but it decreased significantly across irrigation treatments from 1.56 cm in the 0.6 dS m−1 to 1.34 cm in the 8 dS m−1 irrigation water treatment.

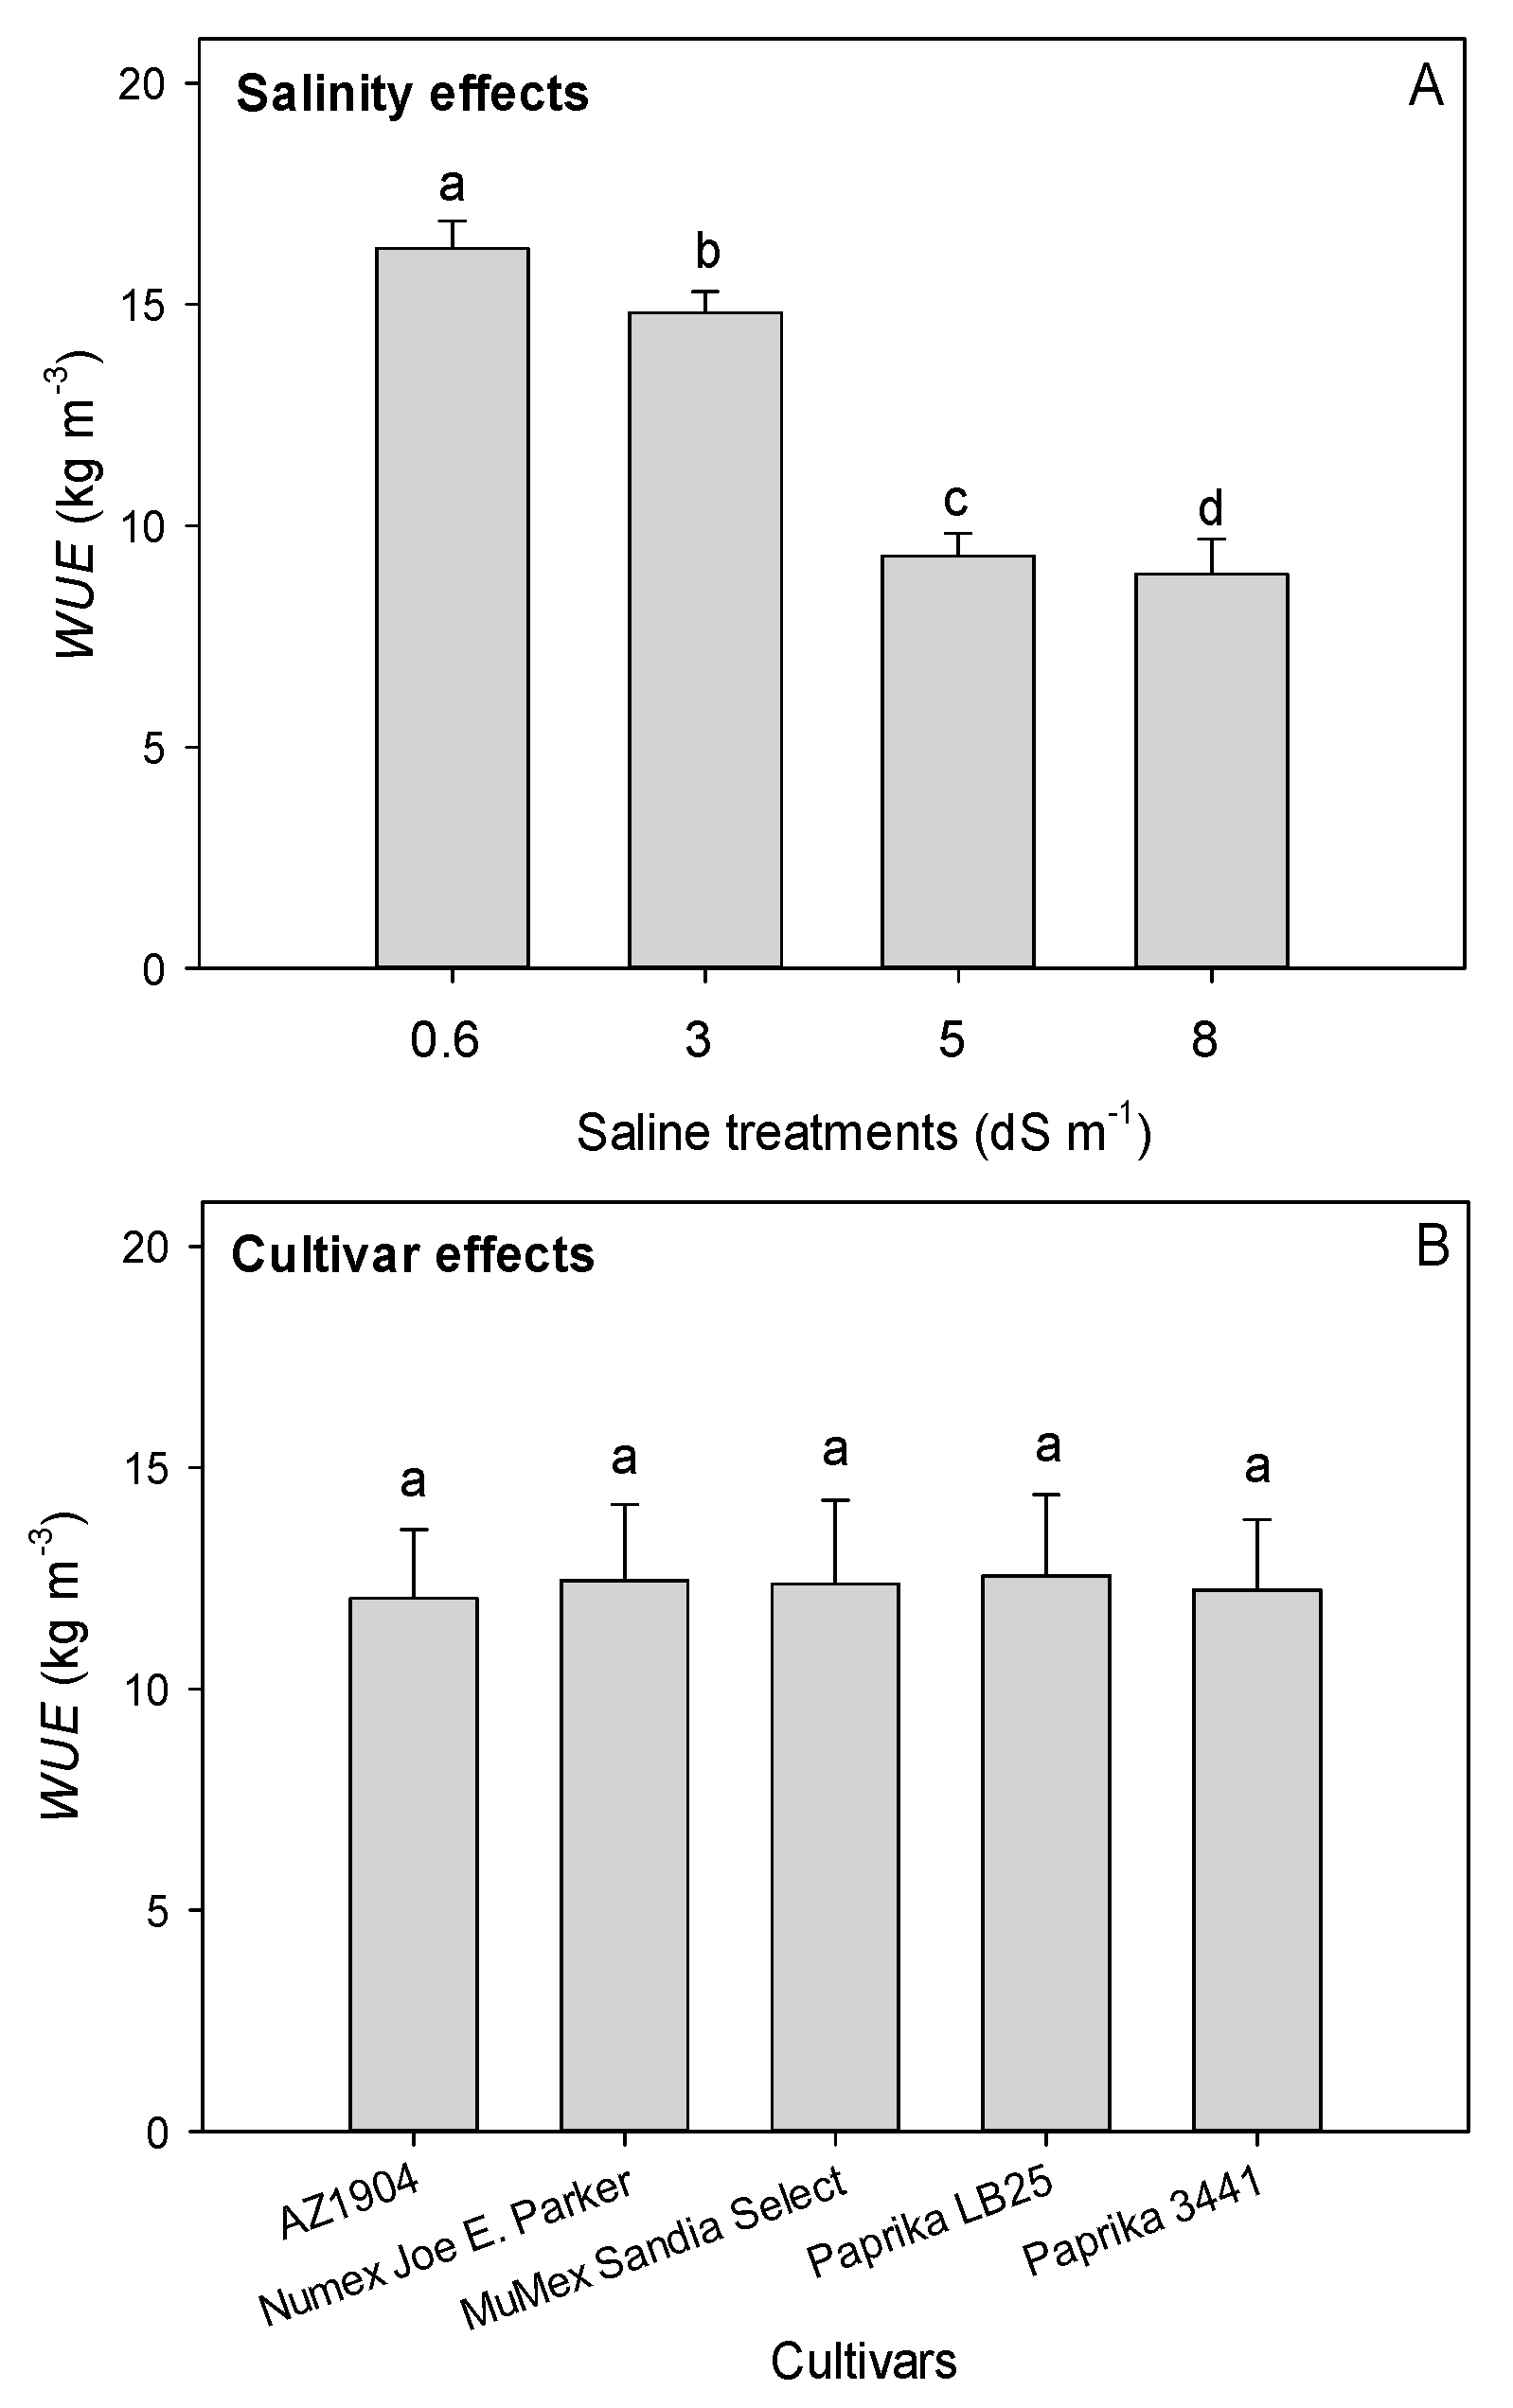
3.3. Water Use Efficiency

No significant interaction between the saline treatments and cultivars (p > 0.05) was observed for the WUE, while significant reductions (p ≤ 0.05) in the WUE were noted with the increasing salinity of the irrigation water (Figure 2A). The reduction in the WUE was only 9% in the 3 dS m−1 compared to the control treatment, while it was 38% and 42% in the 5 and 8 dS m−1 water treatments, respectively. The WUE is generally treated as an important physiological indicator of crops that are grown in water-scarce conditions. As the WUE of chile peppers irrigated with 3 dS/m was not much different from those irrigated with 0.6 dS/m, a slightly brackish groundwater (<3 dS m−1) might be considered for irrigating chile peppers if brackish groundwater is the only available source of irrigation, while simultaneously monitoring salts in the leachate water and soil. However, significant reductions can occur with a further increase in the salinity of the irrigation waters. A similar reduction in the WUE with an increased irrigation water salinity was reported in tomato [38,39]. The average WUE of the five chile pepper cultivars in this study was similar and was in agreement with results reported by Reina-Sanchez et al. (2005) for four tomato cultivars irrigated with saline water (Figure 2B) [40].

3.4. Accumulation of Mg2+, Ca2+ and Na+ Cations in Soil

There were no significant differences among the cultivars (p > 0.05) for the magnesium, calcium and sodium concentrations and the sodium adsorption ratios of saturated soil paste extracts (data not presented). Although all three Mg2+, Ca2+, and Na+ cation concentrations increased significantly (p ≤ 0.05) with the ECe, different responses were noted, especially at ECe higher than 9 dS m−1 (Figure 3A). A linear relationship of Mg2+ concentration was obtained with the ECe, while the response of Na+ and Ca2+ was positive exponential and negative exponential, respectively. It was observed that the Na/Ca ratio of the soil paste extract increased from 1.13 in the 0.6 dS m−1 to 1.87 in the 8 dS m−1 treatment. The reason could be the displacement of Ca2+ by Na+ and the subsequent Ca2+ leaching under high Na+ concentrations in soil [41]. The SAR increased linearly (p ≤ 0.05) with the increasing ECe (Figure 3B), which could be well explained by a greater increase in Na+ than in Ca2+ concentration under high salinity.

3.5. Yield Responses to Root-Zone Salinity

The relative yield responses of five chile pepper cultivars to the ECe were similar and considerably well explained by both piecewise linear and sigmoid non-linear functions; though the sigmoid function resulted in a slightly better fit for each of the five cultivars, as evident by their higher coefficient of determination (r2; 0.87–0.91) and lower residual sum of squares (RSS) values (Table 3). Likewise, the overall yield responses of chile pepper cultivars were slightly better explained by the sigmoid function compared to the piecewise function. The threshold value (a) estimated using the piecewise linear function ranged between 1.04–1.33 dS m−1, with Numex Joe E. Parker and Paprika LB25 having the lowest and greatest a value, respectively, among the cultivars. Whereas, both Paprika 3441 and NuMex Sandia Select resulted in threshold values (1.09 & 1.12 dS m−1) close to the observed value of 1.10 dS m−1 for all the cultivars. The a values obtained in this study were lower than the earlier threshold values of 1.5–1.8 dS m−1 suggested for the peppers [16,17,42]. Additionally, the determined slope (b) values of 0.038–0.046 were also lower as compared to the earlier reported values of 0.14 [43] and 0.12 [42].
The 50% yield reduction (c50) estimations from sigmoid non-linear functions were ranged between 10.75–13.55 dS m−1, which was in agreement with the range (12.15–14.21 dS m−1) predicted using piecewise linear equations for the chile pepper cultivars. The lowest c50 (10.75 dS m−1) was noted for NuMex Sandia Select, while Paprika 3441 had the greatest c50 of 13.55 dS m−1. The other three varieties showed similar yield reductions with an increase in soil salinity, and their c50 values were ranged between 12.01–12.22 dS m−1. The observed c50 values of all the chile peppers were much higher than the 6 dS m−1 proposed for the peppers [42,44]. Furthermore, the constant p values ranging between 1.26–2.11 were comparatively lower than the value of 3.0 suggested for most of the crops, including peppers [45].
Lower yield reductions in chile peppers against the soil salinity compared to previous reports could be attributed to the calcium dominated brackish groundwater used in this study. The considerable amount of calcium in the natural saline irrigation treatments has been reported to ameliorate the salinity’s impact on plants [46]. Calcium plays regulatory roles in the metabolism, water transport, and root hydraulic conductivity of plants under salt stress [47,48]. Moreover, high calcium levels can shield the cell membrane from detrimental salinity effects [49].

4. Conclusions

This study evaluated the effects of natural brackish groundwater and RO concentrate irrigation on the water use, leaching fraction, and yield responses of chile pepper cultivars. Saline irrigation caused a reduction in the water uptake of the chile peppers and increased LFs, particularly in the 5 dS m−1 and the 8 dS m−1. The WUE was not substantially different between 0.6 and 3 dS m−1 but decreased significantly in the other two higher salinity treatments. Therefore, irrigating chile peppers with up to 3 dS m−1 brackish water could be possible by maintaining appropriate leaching fractions to sustain chile pepper production in freshwater-scare areas, where brackish groundwater is the only available source of irrigation. The yield response curves showed that the yield reductions in the chile peppers irrigated with natural brackish water were lesser compared to those of NaCl-dominant solution studies. Low yield reductions could be related to significant Ca2+ concentrations in the brackish groundwater and RO concentrate. However, there is further need to investigate the effects of different Na+/Ca2+ concentrations on plant physiology, water transport, ion content and transport, growth, nutrition, and yields for improving the salt tolerance of chile peppers.

Author Contributions

Conceptualization, G.S.B. and M.K.S.; methodology, G.S.B., M.K.S., P.W.B., and S.J.W.; formal analysis, G.S.B. and R.K.S.; writing—original draft preparation, G.S.B.; writing—review and editing, M.K.S., R.K.S., P.W.B., S.J.W. and R.S.; visualization, G.S.B. and R.K.S.; supervision, M.K.S.; project administration, M.K.S. All authors have read and agreed to the published version of the manuscript.

Funding

This work was partially supported by the USDA National Institute of Food and Agriculture, Hatch project 1006850, and Nakayama Chair endowment.

Acknowledgments

Authors would like to acknowledge New Mexico State University Agricultural Experiment Station for the financial support through Graduate Research Award and Brackish Groundwater National Desalination Research Facility in Alamogordo, NM for providing the groundwater and RO concentrate. Authors thank Barbara Hunter and Jacob Pino for their assistance in analyzing soil and water samples.

Conflicts of Interest

The authors declare no conflict of interest.

References

  1. O’Neill, M.P.; Dobrowolski, J.P. Water and agriculture in a changing climate. HortScience 2011, 46, 155–157. [Google Scholar] [CrossRef] [Green Version]
  2. Singh, M.; Saini, R.K.; Singh, S.; Sharma, S.P. Potential of integrating biochar and deficit irrigation strategies for sustaining vegetable production in water-limited regions: A review. HortScience 2019, 54, 1872–1878. [Google Scholar] [CrossRef] [Green Version]
  3. Wallace, J. Increasing agricultural water use efficiency to meet future food production. Agric. Ecosyst. Environ. 2000, 82, 105–119. [Google Scholar] [CrossRef]
  4. Pasternak, D.; De Malach, Y. Irrigation with brackish water under desert conditions X. Irrigation management of tomatoes (Lycopersicon esculentum Mills) on desert sand dunes. Agric. Water Manag. 1995, 28, 121–132. [Google Scholar] [CrossRef]
  5. Ayars, J.E.; Schoneman, R.A. Irrigating field crops in the presence of saline groundwater. Irrig. Drain. 2006, 55, 265–279. [Google Scholar] [CrossRef]
  6. Hibbs, B.J.; Boghici, R.N.; Hayes, M.E.; Ashworth, J.B.; Hanson, A.N.; Samani, Z.A.; Kennedy, J.F.; Creel, R.J. Transboundary Aquifers of the El Paso/Ciudad Juarez/Las Cruces Region; Contract Report; Texas Water Development Board, Austin & New Mexico Water Resources Research Institute: Las Cruces, NM, USA, 1997; p. 148. [Google Scholar]
  7. Flores, A.M.; Shukla, M.K.; Daniel, D.; Ulery, A.L.; Schutte, B.J.; Picchioni, G.A.; Fernald, S. Evapotranspiration changes with irrigation using saline groundwater and RO concentrate. J. Arid Environ. 2016, 131, 35–45. [Google Scholar] [CrossRef]
  8. Assouline, S.; Russo, D.; Silber, A.; Or, D. Balancing water scarcity and quality for sustainable irrigated agriculture. Water Resour. Res. 2015, 51, 3419–3436. [Google Scholar] [CrossRef]
  9. Kankarla, V.; Shukla, M.; VanLeeuwen, D.; Schutte, B.; Picchioni, G. Growth, evapotranspiration, and ion uptake characteristics of alfalfa and triticale irrigated with brackish groundwater and desalination concentrate. Agronomy 2019, 9, 789. [Google Scholar] [CrossRef] [Green Version]
  10. Ozturk, O.F.; Shukla, M.K.; Stringam, B.; Picchioni, G.A.; Gard, C. Irrigation with brackish water changes evapotranspiration, growth and ion uptake of halophytes. Agric. Water Manag. 2018, 195, 142–153. [Google Scholar] [CrossRef]
  11. Glenn, E.P.; Brown, J.J.; Blumwald, E. Salt tolerance and crop potential of halophytes. Crit. Rev. Plant Sci. 1999, 18, 227–255. [Google Scholar] [CrossRef]
  12. Läuchli, A.; Epstein, E. Plant responses to saline and sodic conditions. Agric. Salin. Assess. Manag. 1990, 71, 113–137. [Google Scholar]
  13. Läuchli, A.; Grattan, S. Plant growth and development under salinity stress. In Advances in Molecular Breeding toward Drought and Salt Tolerant Crops; Springer: Dordrecht, Netherlands, 2007; pp. 1–32. [Google Scholar]
  14. Katerji, N.; Van Hoorn, J.; Hamdy, A.; Mastrorilli, M. Salinity effect on crop development and yield, analysis of salt tolerance according to several classification methods. Agric. Water Manag. 2003, 62, 37–66. [Google Scholar] [CrossRef]
  15. Nass, U. Quick Stats; USDA-NASS: Washington, DC, USA, 2016. [Google Scholar]
  16. Maas, E.V.; Hoffman, G.J. Crop salt tolerance—Current assessment. J. Irrig. Drain. Div. 1977, 103, 115–134. [Google Scholar]
  17. Chartzoulakis, K.; Klapaki, G. Response of two greenhouse pepper hybrids to NaCl salinity during different growth stages. Sci. Hortic. 2000, 86, 247–260. [Google Scholar] [CrossRef]
  18. Navarro, J.; Garrido, C.; Carvajal, M.; Martinez, V. Yield and fruit quality of pepper plants under sulphate and chloride salinity. J. Hortic. Sci. Biotechnol. 2002, 77, 52–57. [Google Scholar] [CrossRef]
  19. Cornillon, P.; Palloix, A. Influence of sodium chloride on the growth and mineral nutrition of pepper cultivars. J. Plant Nutr. 1997, 20, 1085–1094. [Google Scholar] [CrossRef]
  20. Niu, G.; Rodriguez, D.S.; Crosby, K.; Leskovar, D.; Jifon, J. Rapid screening for relative salt tolerance among chile pepper genotypes. HortScience 2010, 45, 1192–1195. [Google Scholar] [CrossRef]
  21. Aktas, H.; Abak, K.; Cakmak, I. Genotypic variation in the response of pepper to salinity. Sci. Hortic. 2006, 110, 260–266. [Google Scholar] [CrossRef] [Green Version]
  22. Grattan, S.; Grieve, C. Salinity-mineral nutrient relations in horticultural crops. Sci. Hortic. 1998, 78, 127–157. [Google Scholar] [CrossRef]
  23. Carter, C.T.; Grieve, C.M. Mineral nutrition, growth, and germination of Antirrhinum majus L.(snapdragon) when produced under increasingly saline conditions. HortScience 2008, 43, 710–718. [Google Scholar] [CrossRef] [Green Version]
  24. Baath, G.S.; Shukla, M.K.; Bosland, P.W.; Steiner, R.L.; Walker, S.J. Irrigation water salinity influences at various growth stages of Capsicum annuum. Agric. Water Manag. 2017, 179, 246–253. [Google Scholar] [CrossRef] [Green Version]
  25. Shani, U.; Dudley, L. Field studies of crop response to water and salt stress. Soil Sci. Soc. Am. J. 2001, 65, 1522–1528. [Google Scholar] [CrossRef]
  26. Tripler, E.; Ben-Gal, A.; Shani, U. Consequence of salinity and excess boron on growth, evapotranspiration and ion uptake in date palm (Phoenix dactylifera L., cv. Medjool). Plant Soil 2007, 297, 147–155. [Google Scholar] [CrossRef]
  27. Sharma, H.; Shukla, M.K.; Bosland, P.W.; Steiner, R.L. Physiological responses of greenhouse-grown drip-irrigated chile pepper under partial root zone drying. HortScience 2015, 50, 1224–1229. [Google Scholar] [CrossRef] [Green Version]
  28. Gavlak, R.G.; Horneck, D.A.; Miller, R.O. Plant, Soil, and Water Reference Methods for the Western Region; Western Rural Development Center: Fairbanks, AK, USA, 1994. [Google Scholar]
  29. Van Genuchten, M.T.; Hoffman, G.F. Analysis of crop salt tolerance data. In Soil Salinity under Irrigation: Processes and Management; Ecology studies; Shainberg, I., Shalhevet, J., Eds.; Springer-Verlag: New York, NY, USA, 1984; pp. 258–271. [Google Scholar]
  30. Institute, S. Base SAS 9.4 Procedures Guide; SAS Institute: Cary, NC, USA, 2015. [Google Scholar]
  31. Grothendieck, G. Non-linear regression with brute force. R package nls2. Available online: http://CRAN.R-project.org/package=nls2 (accessed on 30 December 2019).
  32. Acosta-Motos, J.; Ortuño, M.; Bernal-Vicente, A.; Diaz-Vivancos, P.; Sanchez-Blanco, M.; Hernandez, J. Plant responses to salt stress: Adaptive mechanisms. Agronomy 2017, 7, 18. [Google Scholar] [CrossRef] [Green Version]
  33. Ben-Gal, A.; Ityel, E.; Dudley, L.; Cohen, S.; Yermiyahu, U.; Presnov, E.; Zigmond, L.; Shani, U. Effect of irrigation water salinity on transpiration and on leaching requirements: A case study for bell peppers. Agric. Water Manag. 2008, 95, 587–597. [Google Scholar] [CrossRef]
  34. Beltrán, J.M.N. Irrigation with saline water: Benefits and environmental impact. Agric. Water Manag. 1999, 40, 183–194. [Google Scholar] [CrossRef]
  35. Bhantana, P.; Lazarovitch, N. Evapotranspiration, crop coefficient and growth of two young pomegranate (Punica granatum L.) varieties under salt stress. Agric. Water Manag. 2010, 97, 715–722. [Google Scholar] [CrossRef]
  36. Homaee, M.; Schmidhalter, U. Water integration by plants root under non-uniform soil salinity. Irrig. Sci. 2008, 27, 83–95. [Google Scholar] [CrossRef]
  37. Zhang, J.; Xu, X.; Lei, J.; Li, S.; Hill, R.; Zhao, Y. The effects of soil salt crusts on soil evaporation and chemical changes in different ages of Taklimakan Desert Shelterbelts. J. Soil Sci. Plant Nut. 2013, 13, 1019–1028. [Google Scholar] [CrossRef]
  38. Al-Karaki, G.N. Growth of mycorrhizal tomato and mineral acquisition under salt stress. Mycorrhiza 2000, 10, 51–54. [Google Scholar] [CrossRef]
  39. Yurtseven, E.; Kesmez, G.; Ünlükara, A. The effects of water salinity and potassium levels on yield, fruit quality and water consumption of a native central anatolian tomato species (Lycopersiconesculantum). Agric. Water Manag. 2005, 78, 128–135. [Google Scholar] [CrossRef]
  40. Reina-Sánchez, A.; Romero-Aranda, R.; Cuartero, J. Plant water uptake and water use efficiency of greenhouse tomato cultivars irrigated with saline water. Agric. Water Manag. 2005, 78, 54–66. [Google Scholar] [CrossRef]
  41. Hanson, B.; Grattan, S.R.; Fulton, A. Agricultural salinity and drainage. In University of California Irrigation Program; University of California: Davis, CA, USA, 1999. [Google Scholar]
  42. Rhoades, J.D.; Kandiah, A.; Marshali, A.M. The Use of Saline Waters for Crop Production; FAO: Rome, Italy, 1992. [Google Scholar]
  43. Maas, E.V.; Poss, J.A.; Hoffman, G.J. Salt tolerance of plants. Appl. Agric. Res. 1986, 1, 12–26. [Google Scholar]
  44. De Pascale, S.; Ruggiero, C.; Barbieri, G.; Maggio, A. Physiological responses of pepper to salinity and drought. J. Am. Soc. Hortic. Sci. 2003, 128, 48–54. [Google Scholar] [CrossRef] [Green Version]
  45. Van Genuchten, M.T.; Gupta, S. A reassessment of the crop tolerance response function. J. Indian Soc. Soil Sci. 1993, 41, 730737. [Google Scholar]
  46. Ehret, D.; Redmann, R.; Harvey, B.; Cipywnyk, A. Salinity-induced calcium deficiencies in wheat and barley. Plant Soil 1990, 128, 143–151. [Google Scholar] [CrossRef]
  47. Cramer, G.R.; Spurr, A.R. Salt reponses of lettuce to salinity. II. Effect of calcium on growth and mineral status. J. Plant Nutr. 1986, 9, 131–142. [Google Scholar] [CrossRef]
  48. Cabañero, F.J.; Martínez-Ballesta, M.C.; Teruel, J.A.; Carvajal, M. New evidence about the relationship between water channel activity and calcium in salinity-stressed pepper plants. Plant Cell Physiol. 2006, 47, 224–233. [Google Scholar] [CrossRef] [Green Version]
  49. Busch, D. Calcium regulation in plant cell and his role in signalling. Annu. Rev. Plant Physiol. 1995, 46, 95–102. [Google Scholar] [CrossRef]
Figure 1. Effect of different saline water treatments on the leaching fractions of (A) AZ1904, (B) NuMex Joe E. Parker, (C) NuMex Sandia Select, (D) Paprika LB25, and (E) Paprika 3441 over the growing season.
Horticulturae 06 00027 g001
Figure 2. (A) Water use efficiency (WUE) of the chile pepper cultivars under four saline irrigation waters, and (B) the WUE of five chile pepper cultivars across saline irrigation waters. Bars with the same letters are not significantly different according to the least significance difference test at p ≤ 0.05.
Horticulturae 06 00027 g002
Figure 3. Relationships of (A) magnesium (Mg), calcium (Ca), and sodium (Na) ions buildup and (B) the sodium adsorption ratio (SAR) with the salinity level (ECe) of soil irrigated with brackish water and reverse osmosis concentrate.
Horticulturae 06 00027 g003
Table 1. Mean (standard error) for chemical properties of the four saline water treatments over the growing period.
EC
dS m−1
Ion Concentration (meq/L)
MgCaNaKClSO4
Tap water0.60.75 (0.01)2.28 (0.01)2.73 (0.37)0.15 (0.01)1.64 (0.07)1.58 (0.02)
Well 138.65 (0.01)11.90 (0.38)8.94 (0.18)0.16 (0.00)11.91 (0.05)18.70 (0.79)
Well 2515.24 (0.28)17.60 (2.08)19.04 (1.92)0.21 (0.02)16.86 (1.72)38.78 (3.56)
RO conc.825.81 (0.16)29.43 (2.69)33.51 (2.96)0.37 (0.06)31.23 (5.04)67.15 (7.43)
Tap water is the control; EC: electrical conductivity; RO conc.: reverse osmosis concentrate.
Table 2. Effect of irrigation water salinity on the total deep percolation, change in soil water storage, and evapotranspiration of five chile pepper cultivars.
TreatmentDeep Percolation (cm)Change in Storage (cm)Evapotranspiration (cm)
Salinity (S; dS m−1)
0.625.06 d1.56 a76.99 a
328.06 c1.48 ab74.07 b
533.26 b1.42 bc68.93 c
836.73 a1.34 c65.55 d
LSD (0.05)1.360.091.37
Cutivars (C)
AZ 190432.55 b1.42 a69.65 c
NuMex Joe E. Parker30.80 c1.45 a71.37 b
NuMex Sandia Select34.77 a1.50 a67.34 d
LB 2527.56 d1.45 a74.60 a
344128.22 d1.43 a73.97 a
LSD (0.05)1.520.111.53
C X SNSNSNS
† Values within each column followed by same letter(s) are not significantly different according to the least significance difference test (p ≤ 0.05). NS = non-significant at p ≤ 0.05. Irrigation amount applied was 103.6 cm for all of the treatments.
Table 3. Regression statistics for two response functions applied to yield responses of five chile pepper cultivars against soil salinity.
Piecewise Linear Function
a
(dS m−1)
b
(dS m−1)−1
r2RSSN
AZ19041.190.0440.880.2132
NuMex Joe E. Parker1.040.0450.900.2432
Numex Sandia Select1.120.0450.890.2532
Paprika LB251.330.0460.850.2532
Paprika 34411.090.0380.890.1732
All cultivars1.100.0430.871.18160
Sigmoid non-linear function
c50
(dS m−1)
pr2RSSN
AZ190412.222.1100.890.1832
NuMex Joe E. Parker11.611.6330.910.1932
Numex Sandia Select10.751.2620.890.3232
Paprika LB2512.011.7610.870.1632
Paprika 344113.551.5370.900.1232
All cultivars12.111.6180.880.94160
a: salinity (ECe) threshold; b: slope; c50: ECe at which yield is reduced by 50%; p: regression constant for sigmoid function.

