Seed Shape Description and Quantification by Comparison with Geometric Models


Abstract
:1. Introduction
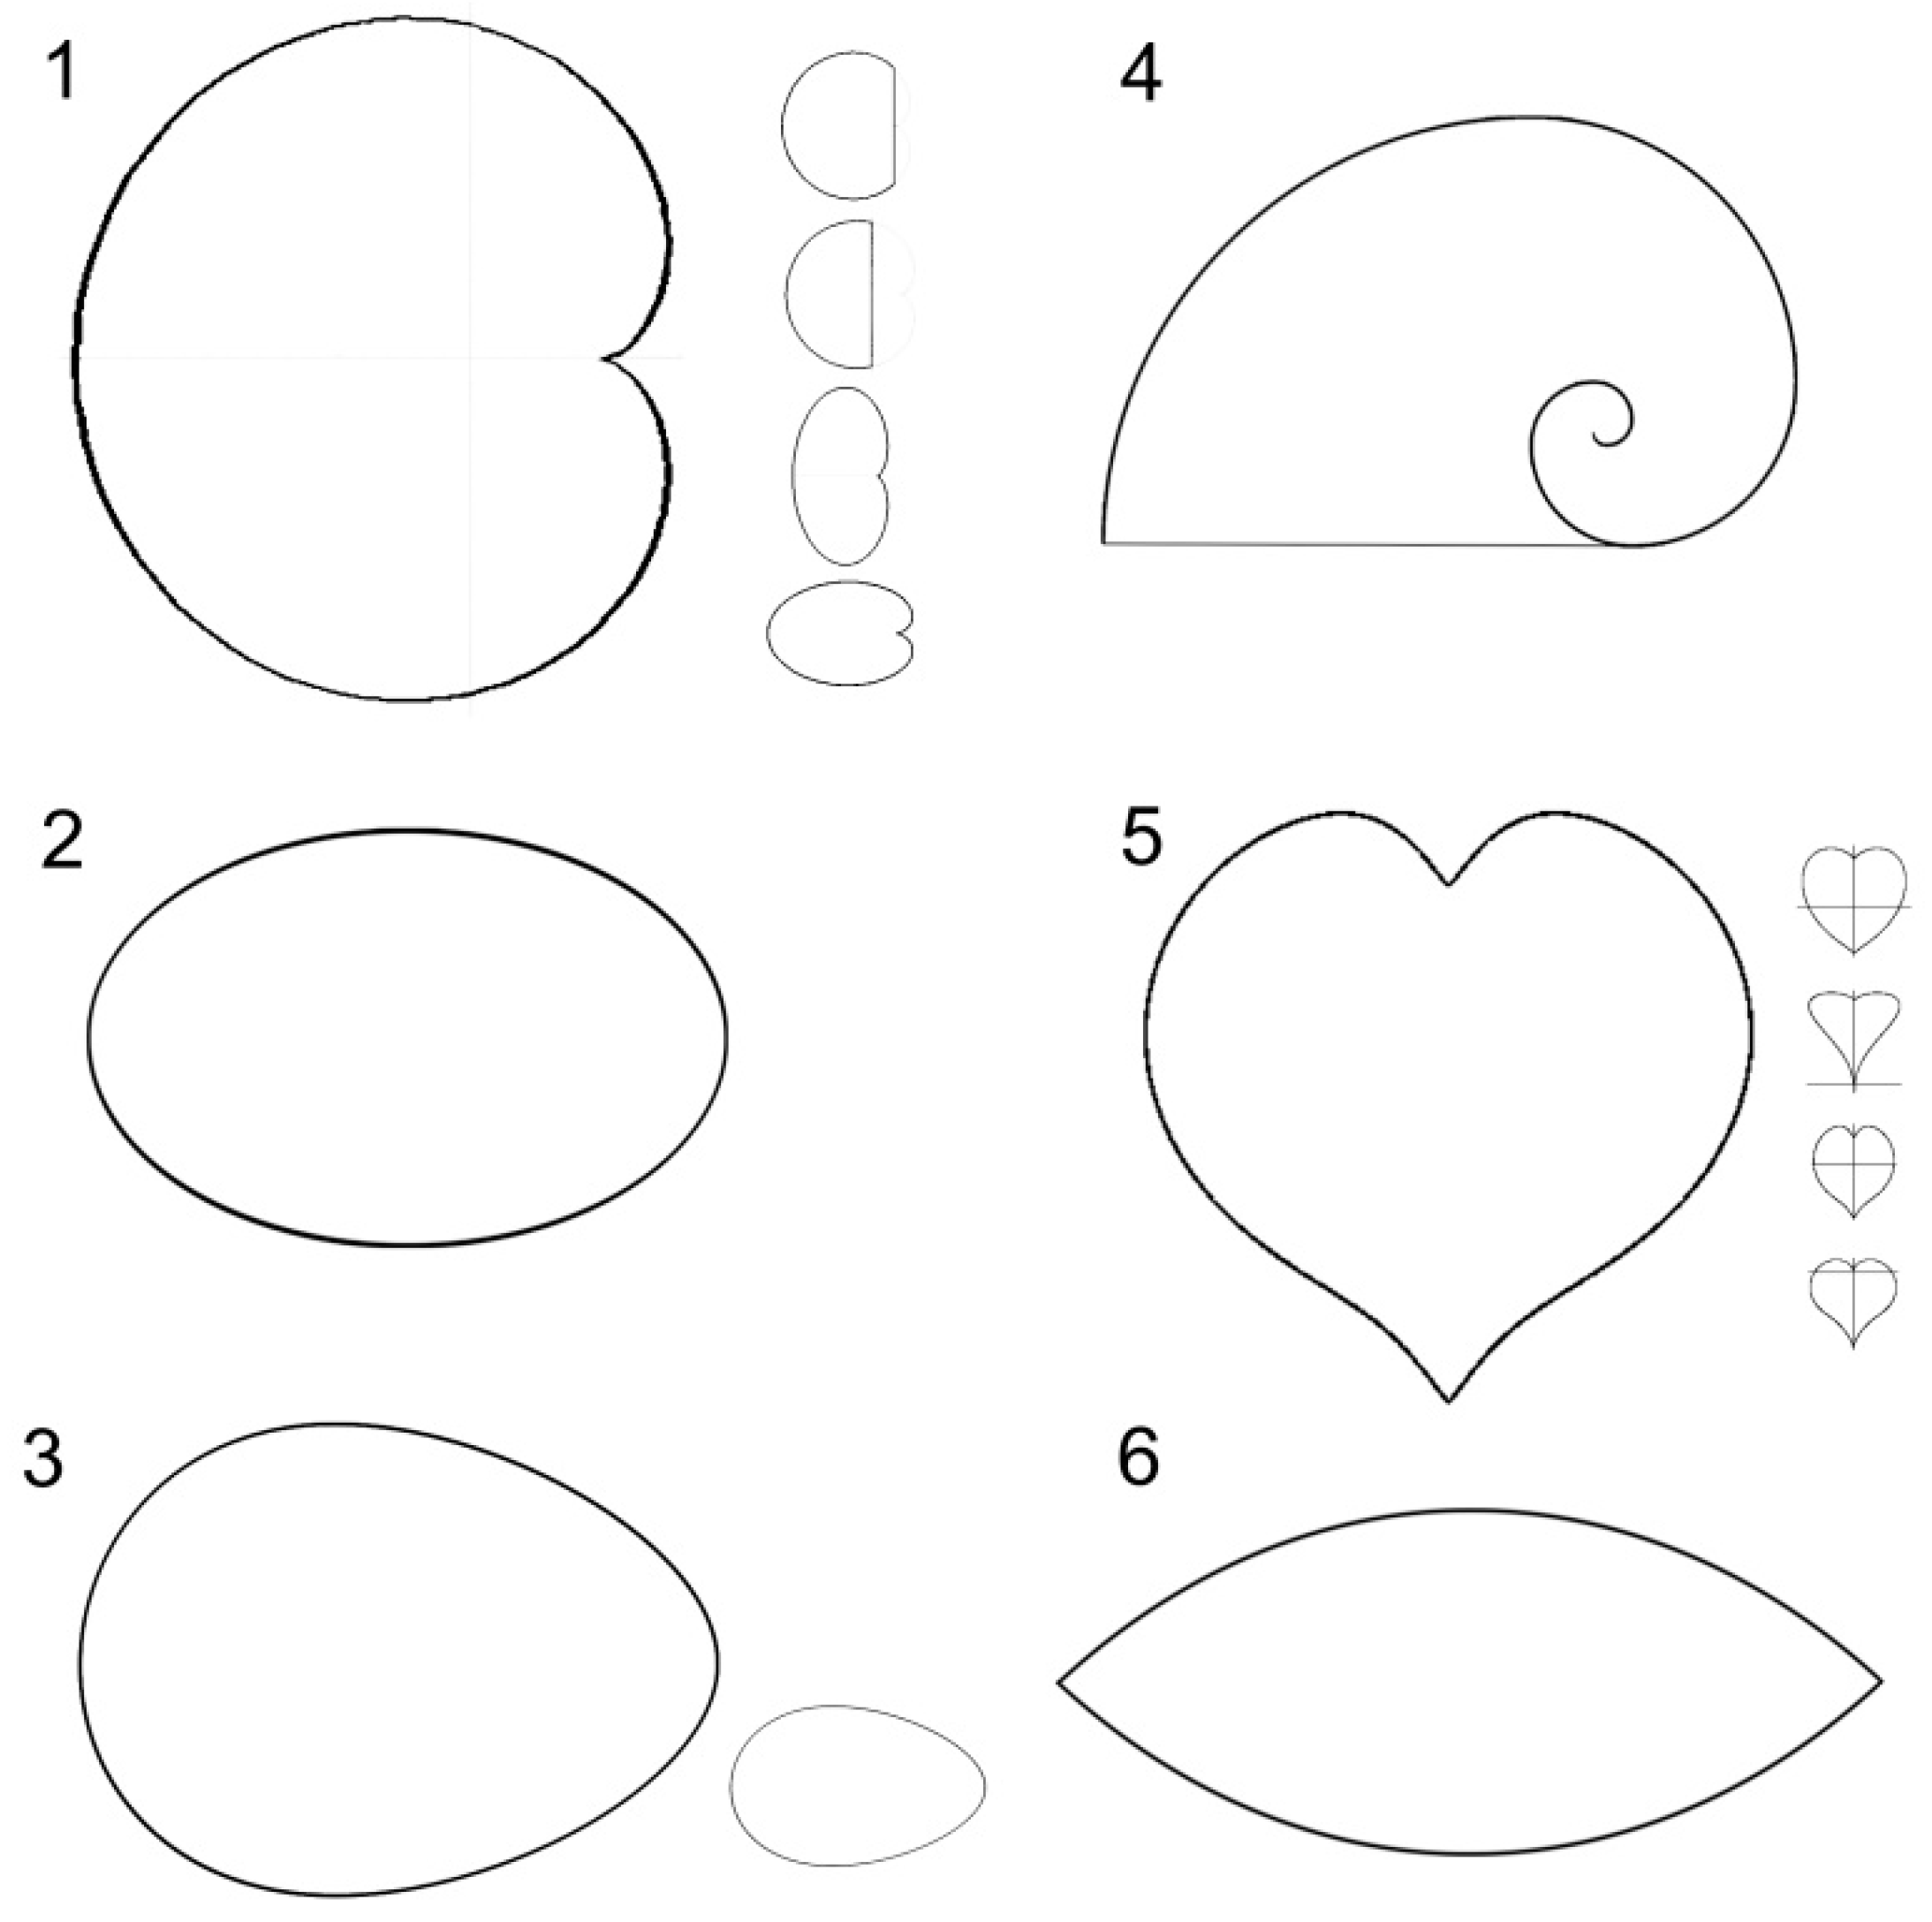
2. Geometric Models
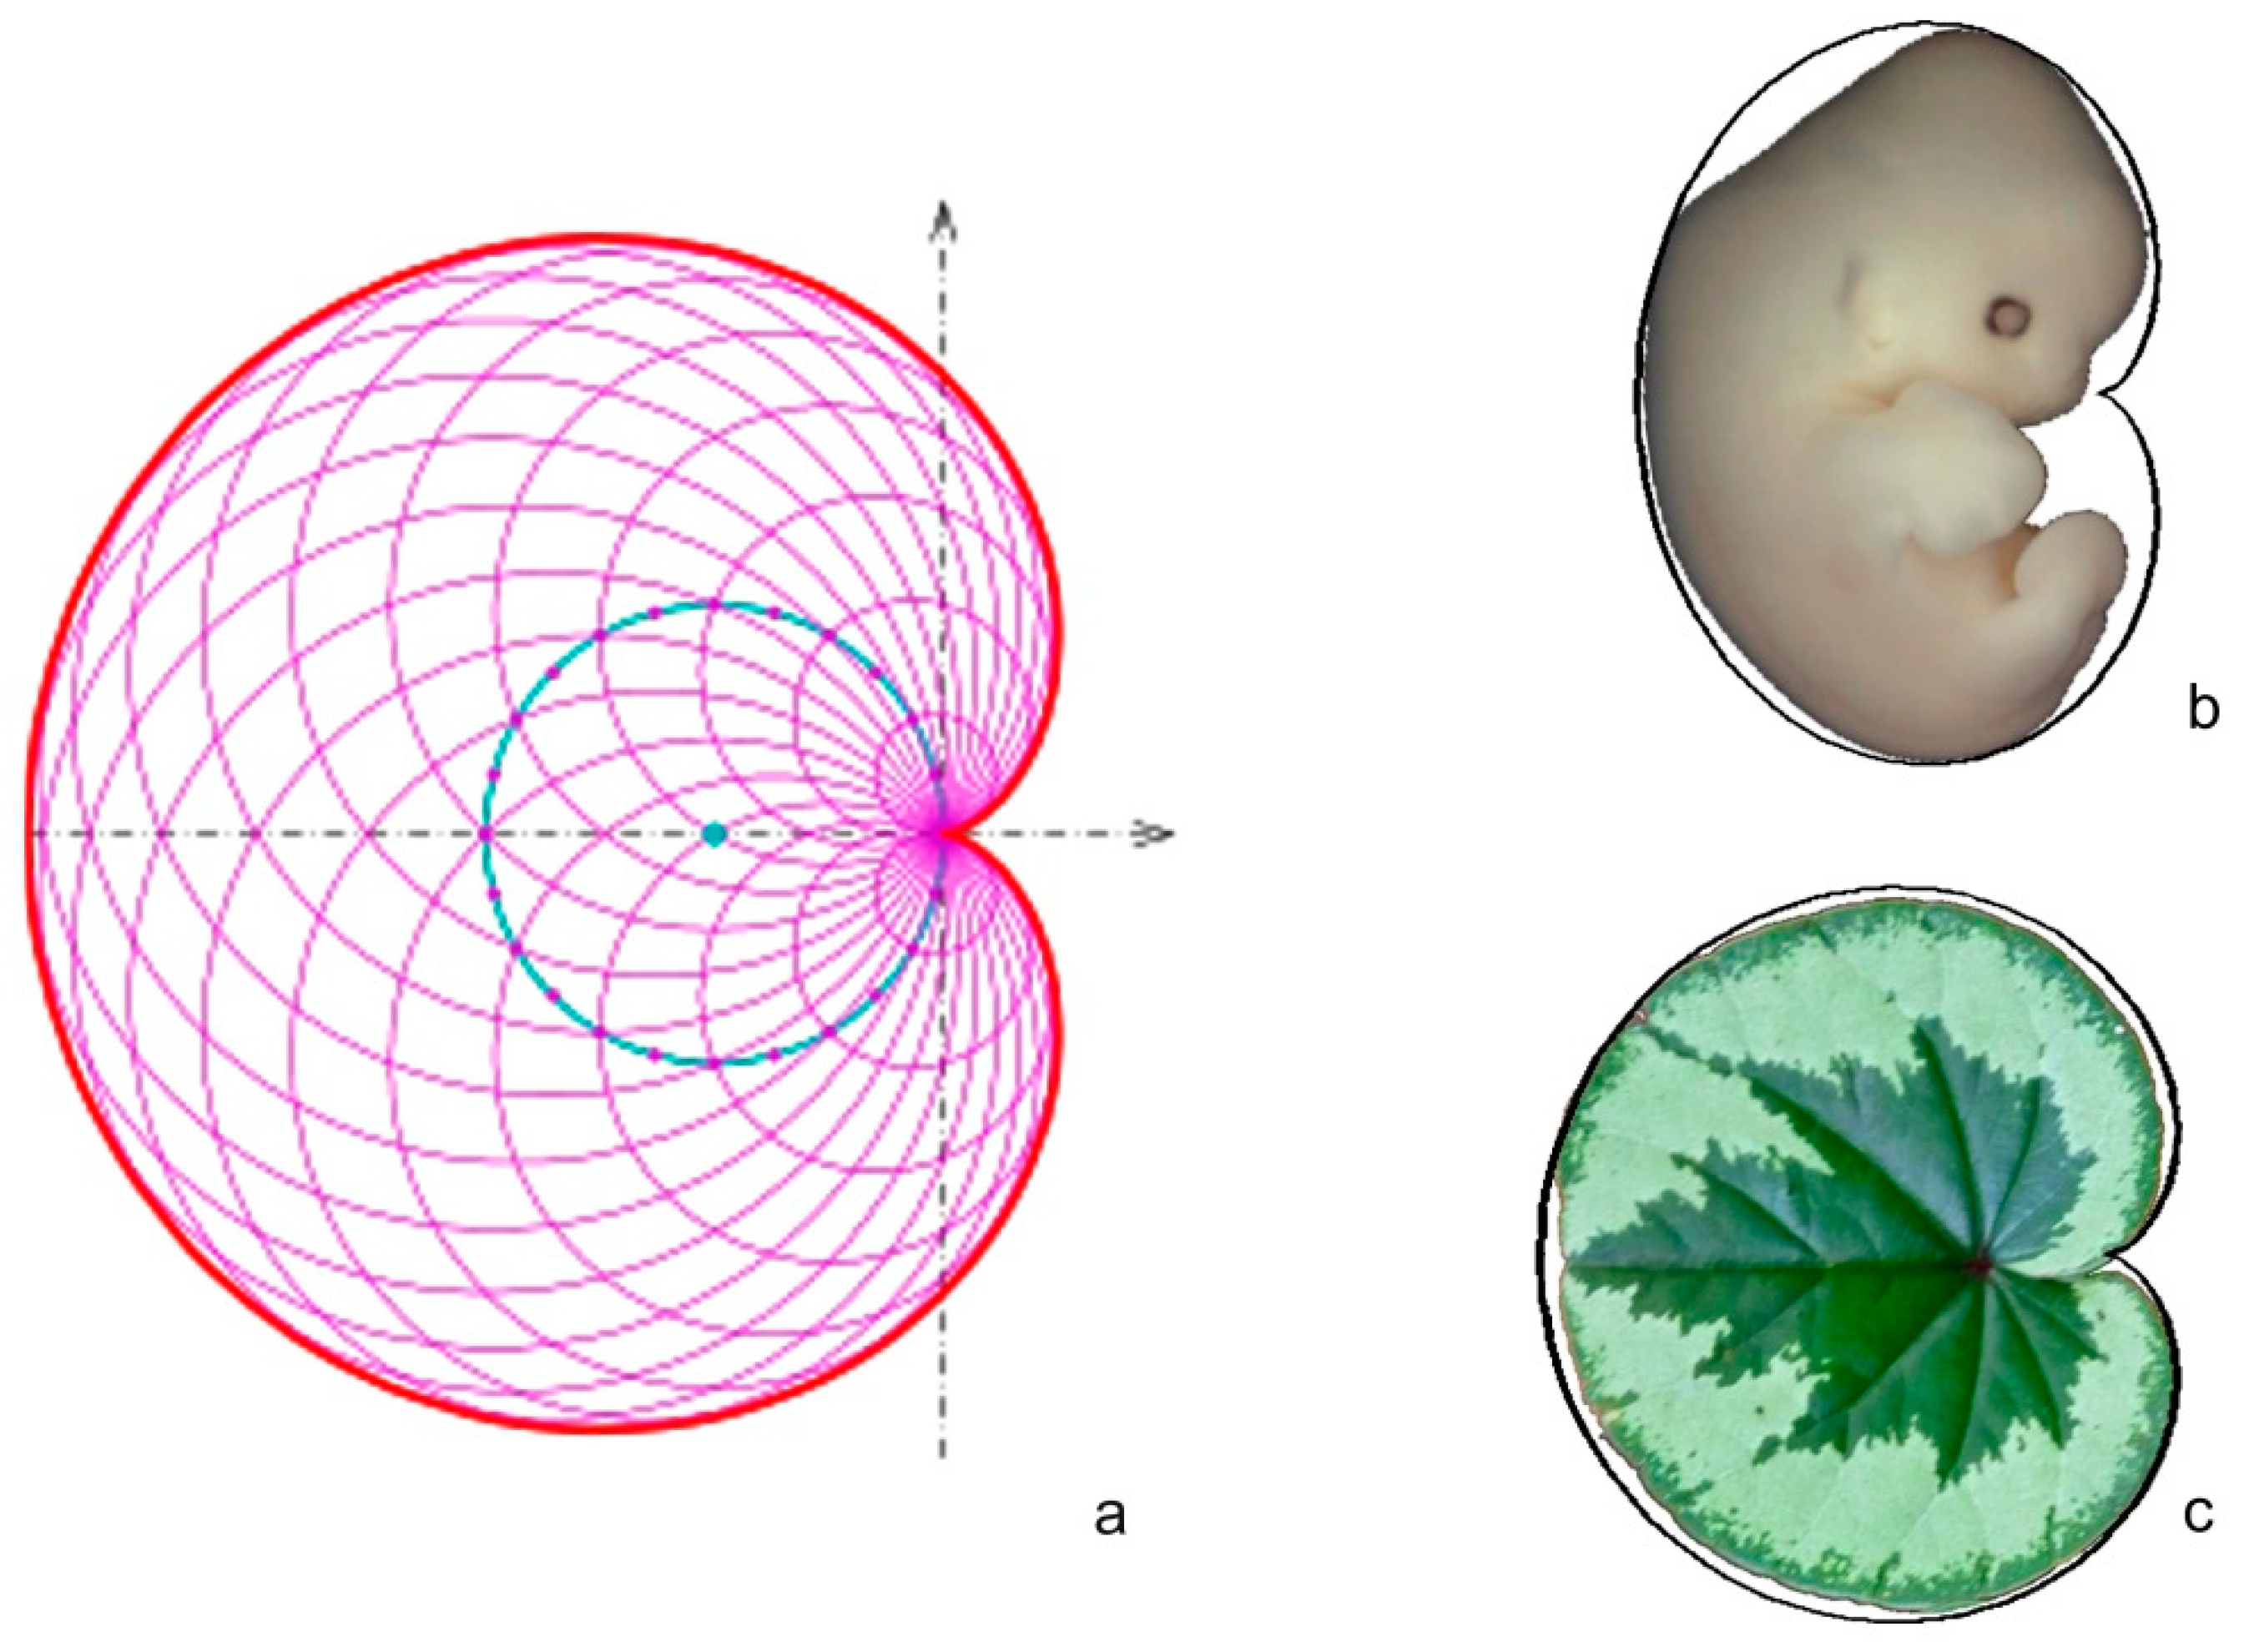
2.1. Cardioid
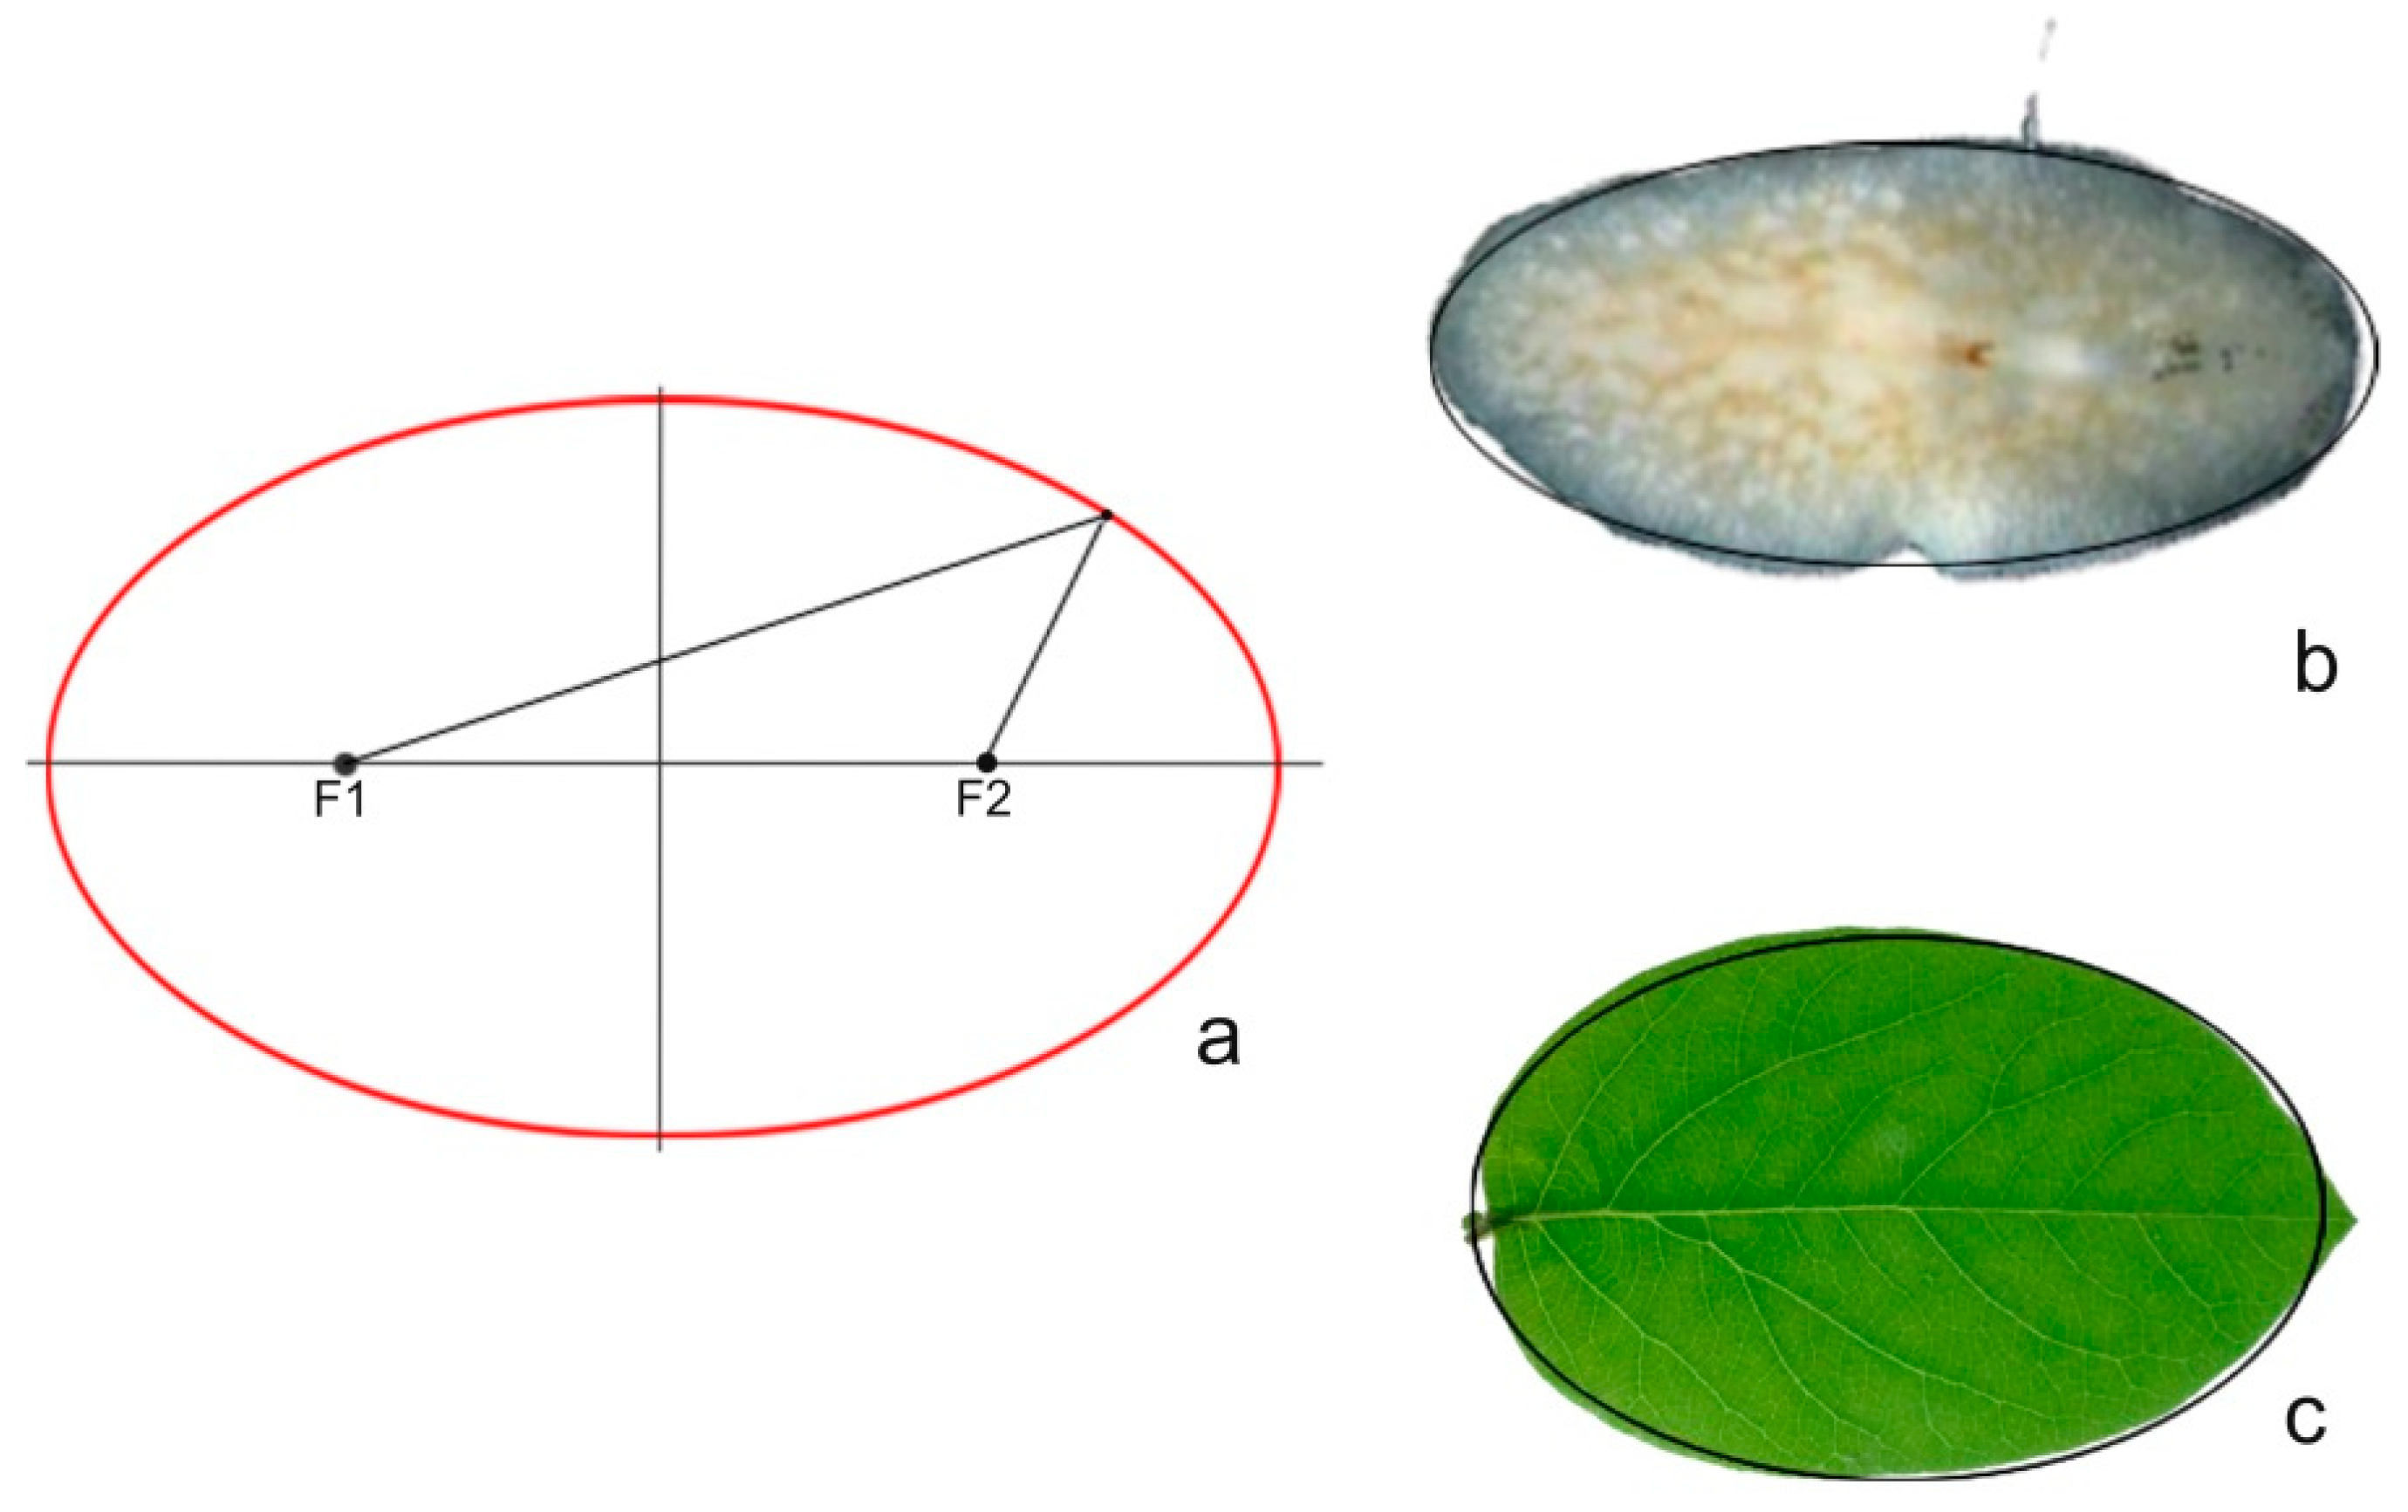
2.2. Ellipse
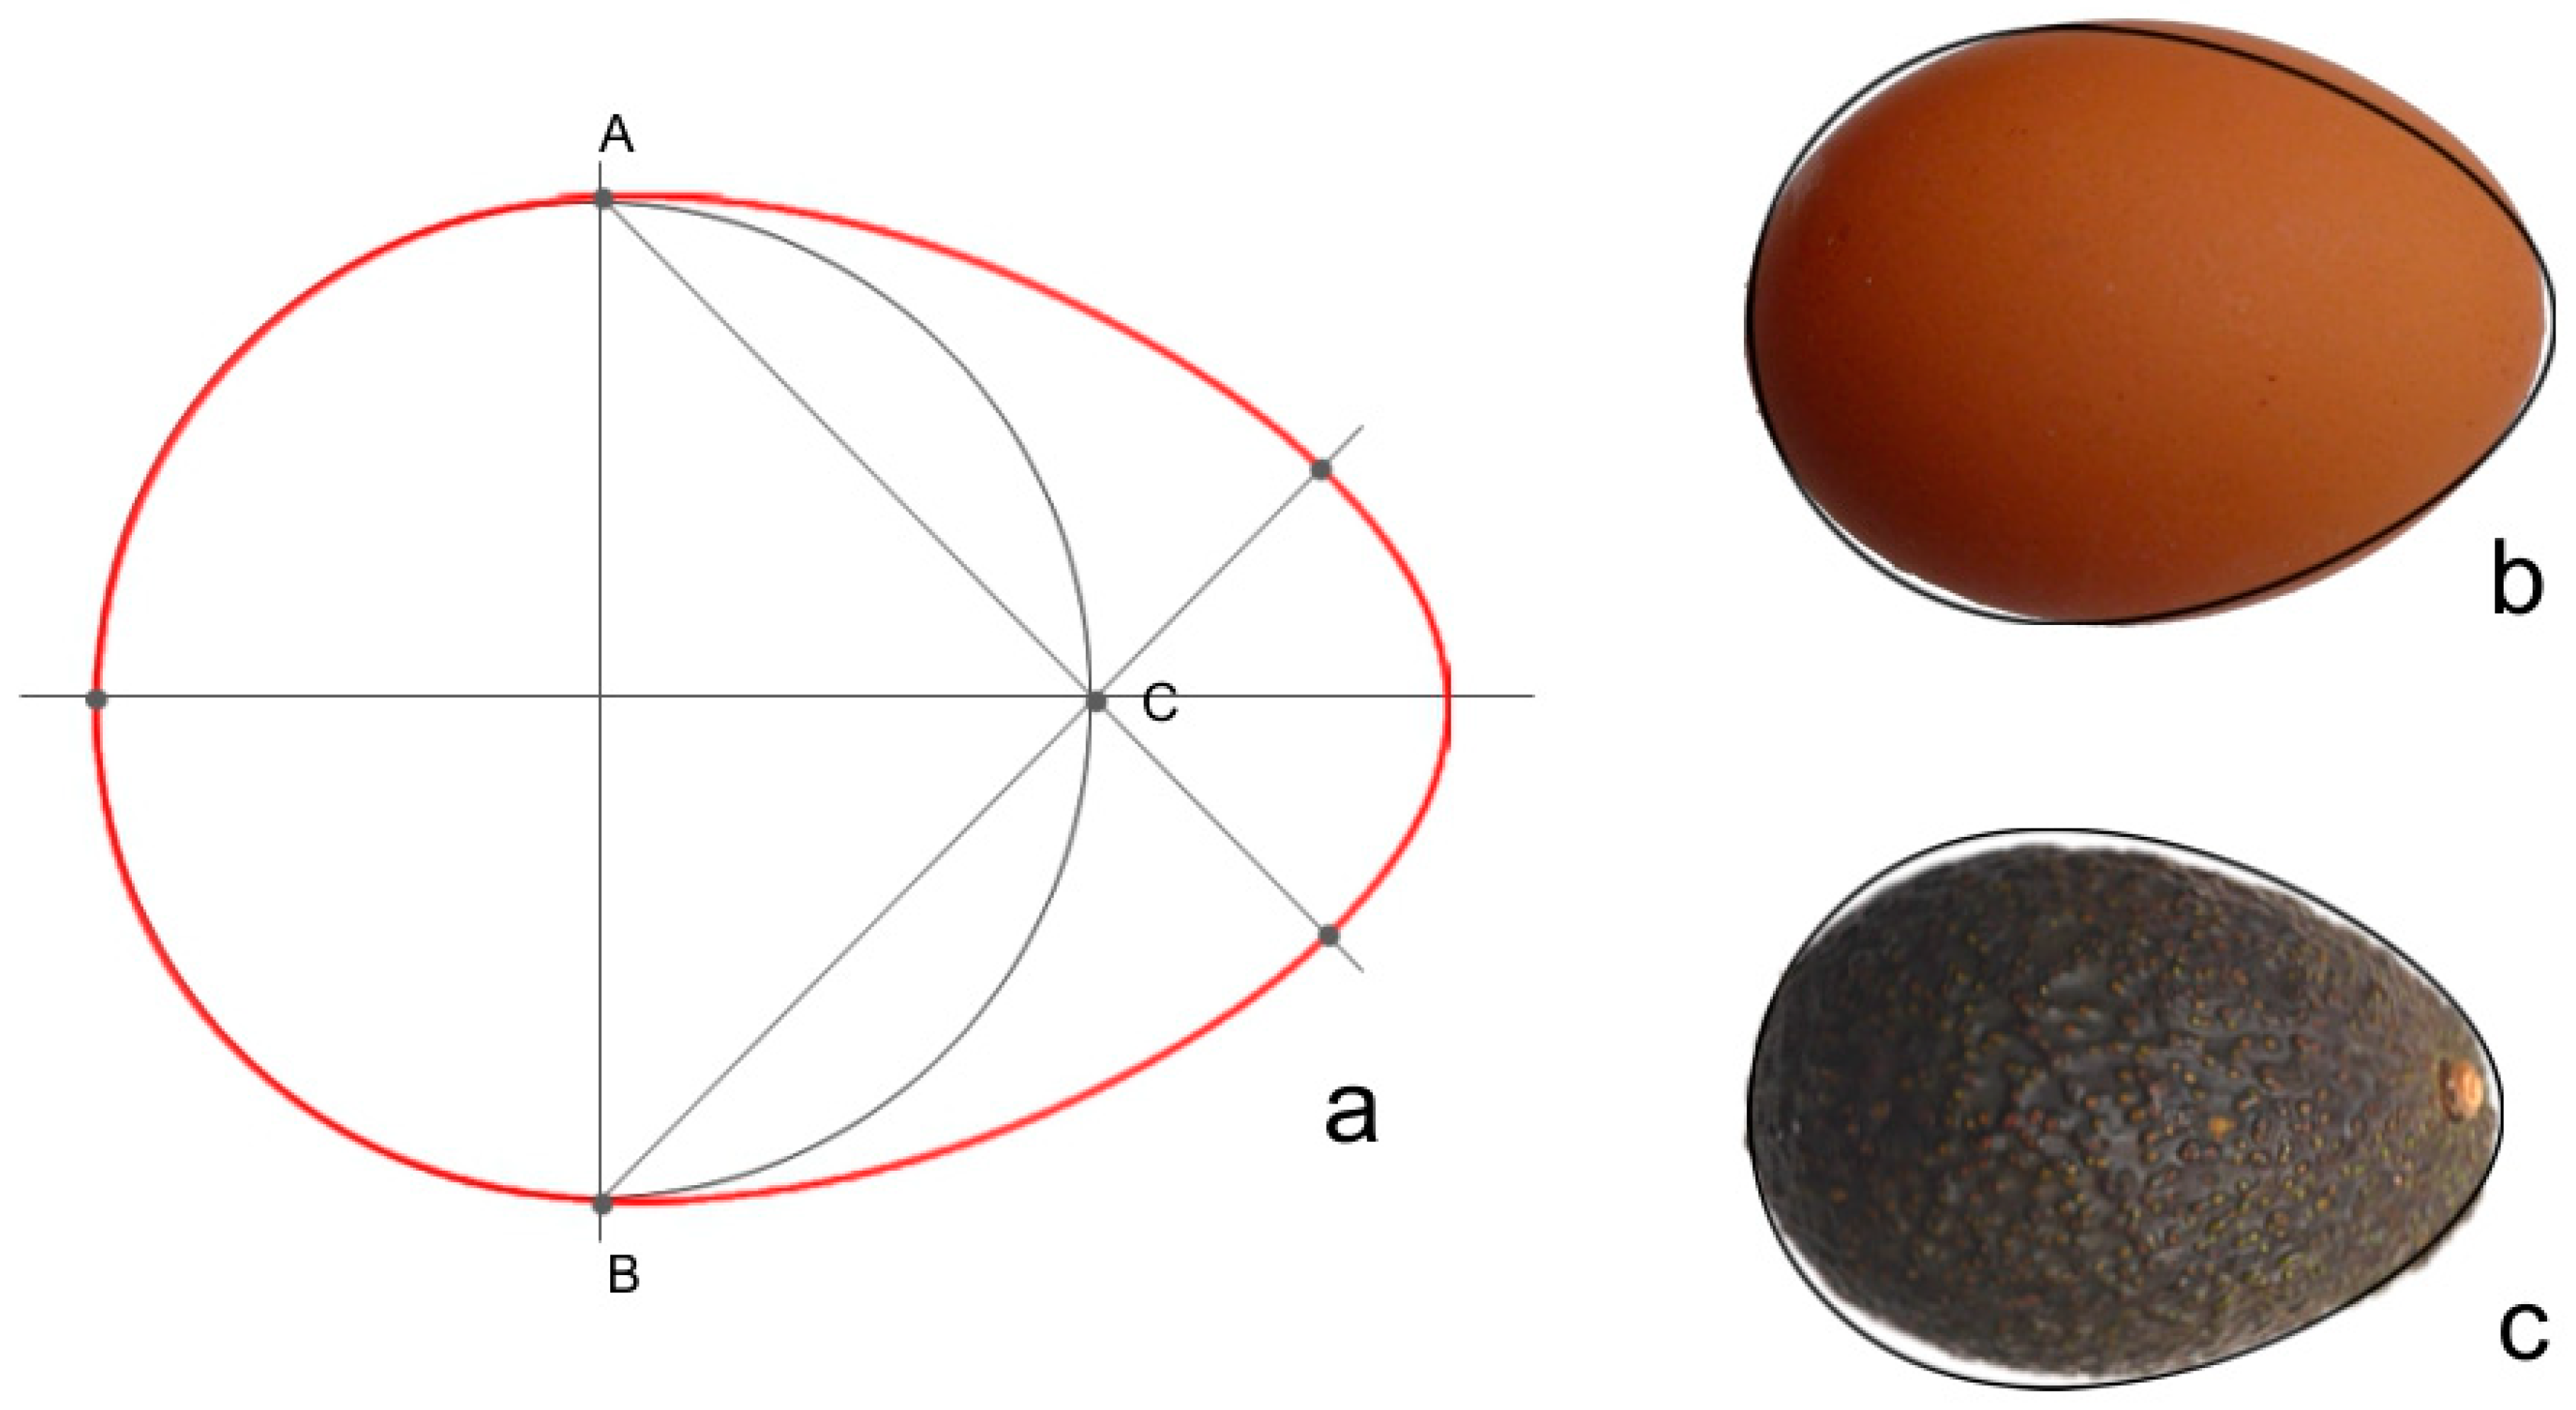
2.3. Oval
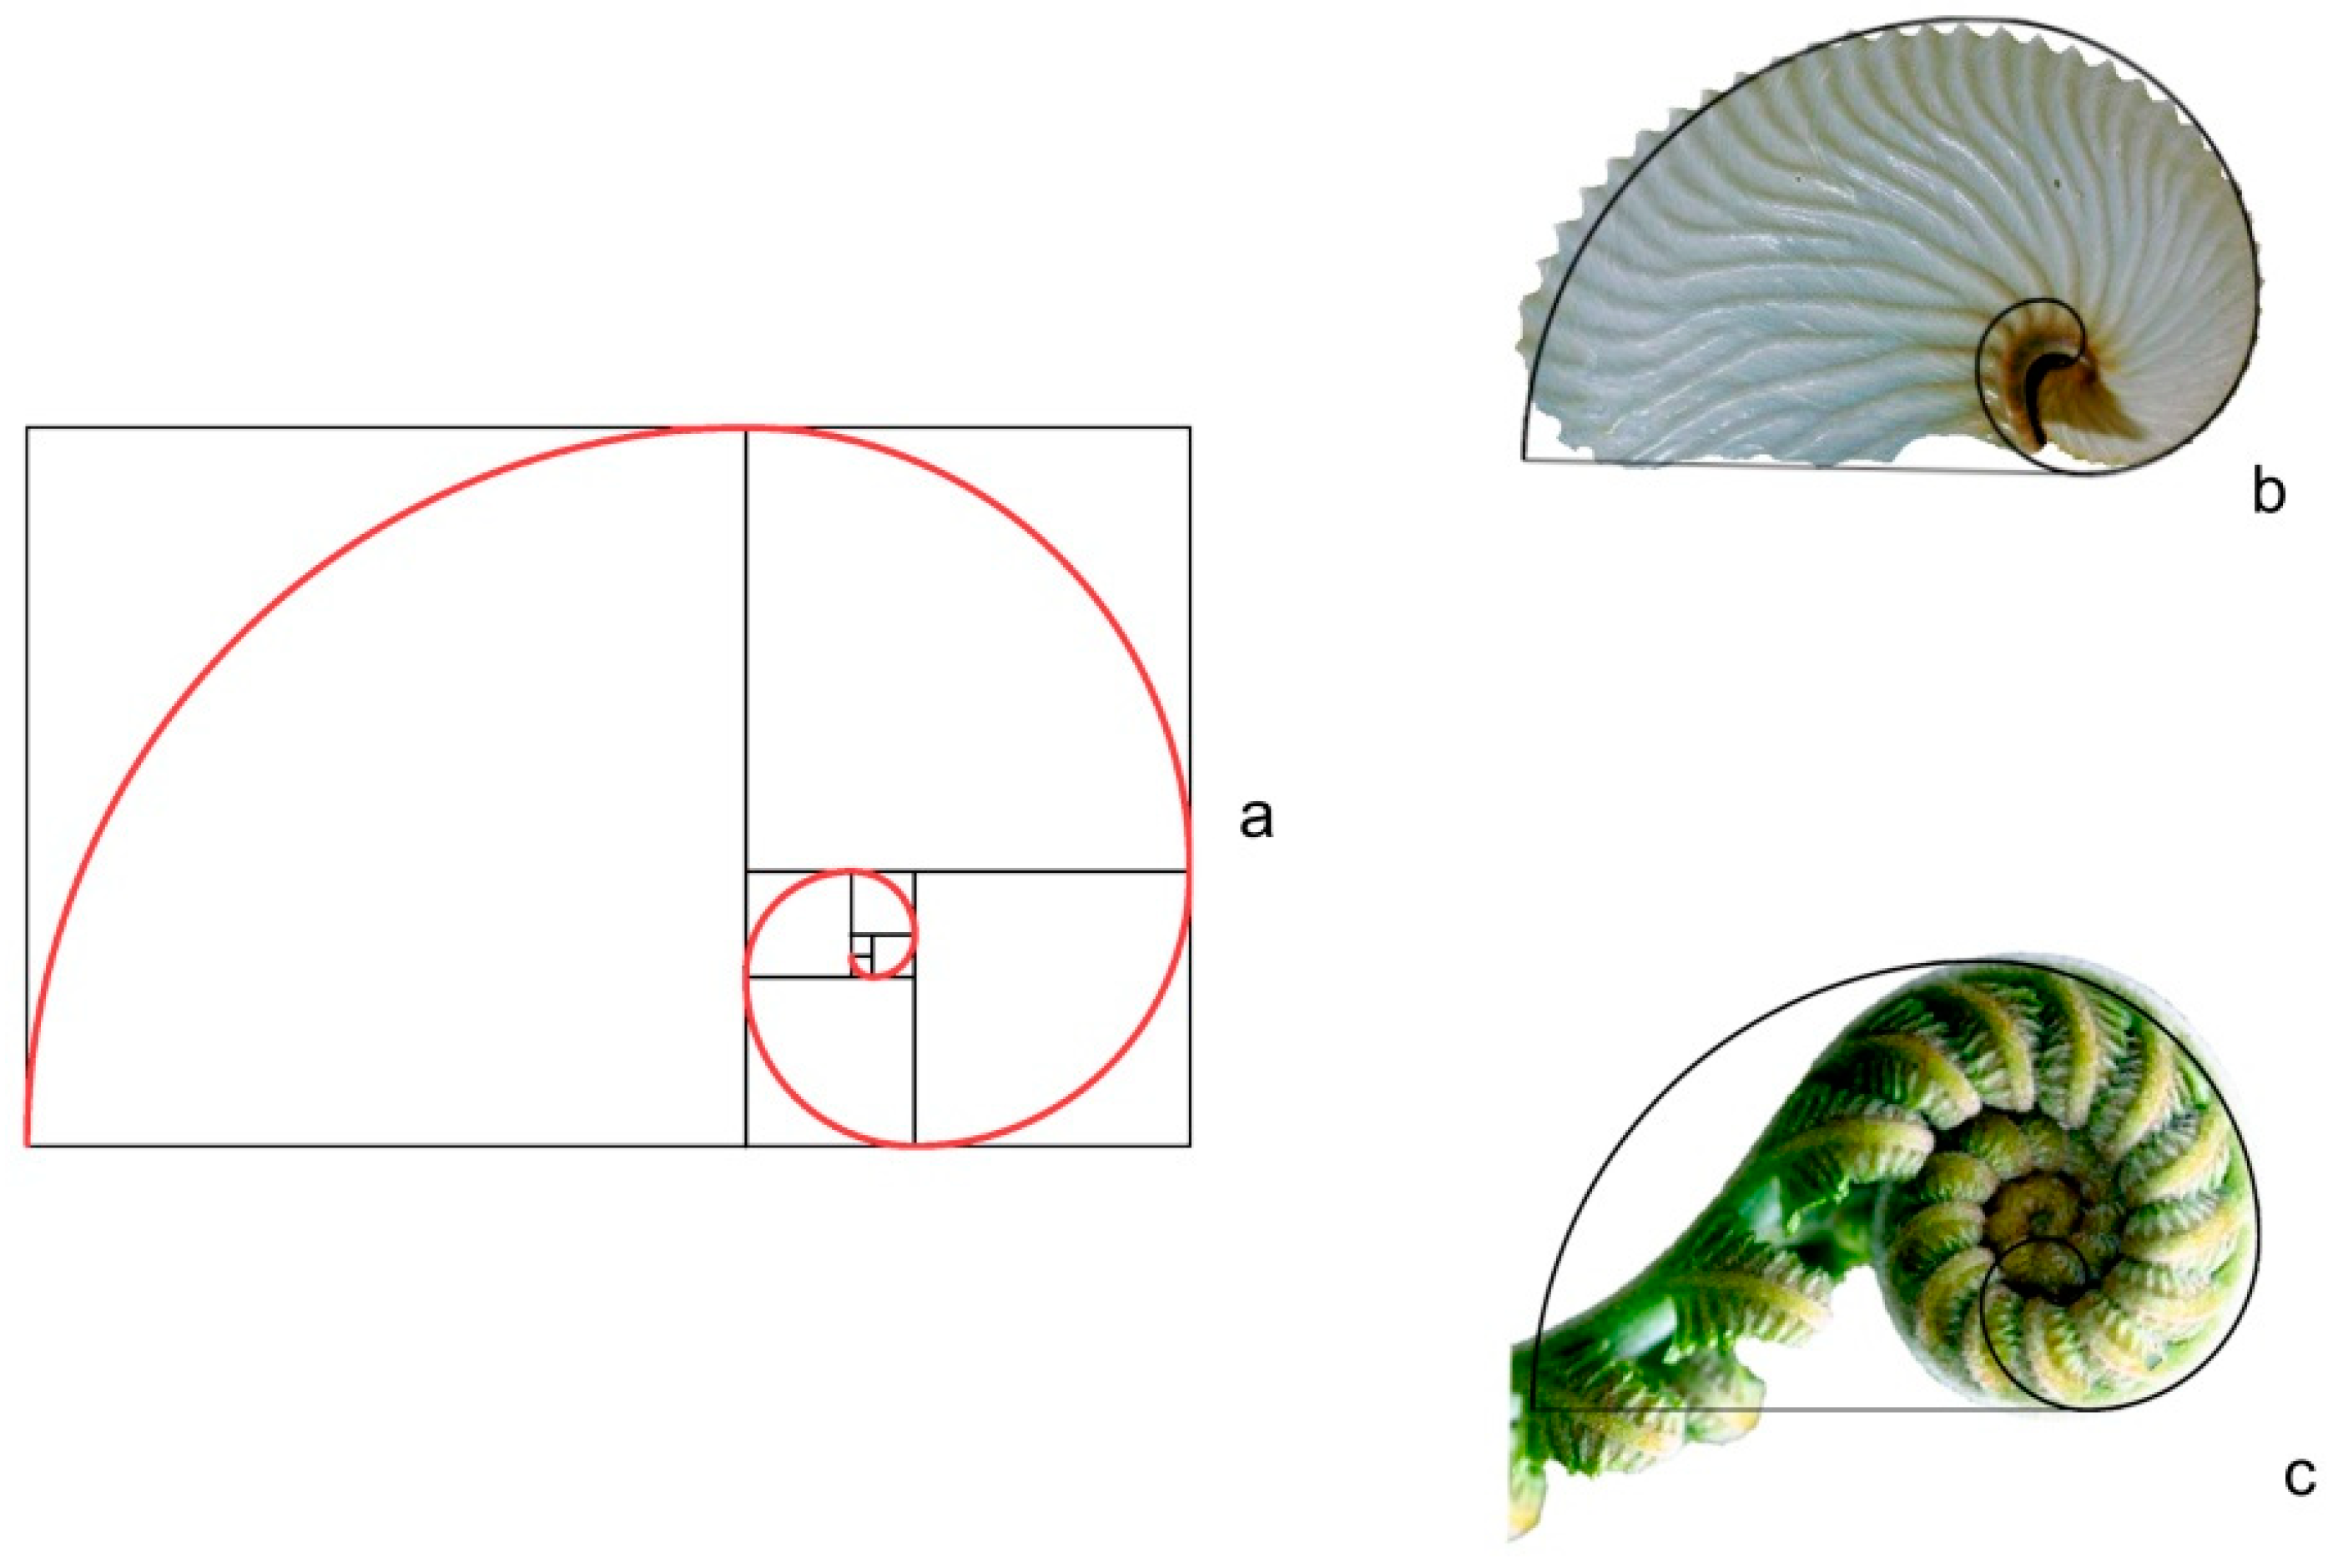
2.4. Contour of Fibonacci’s Spiral
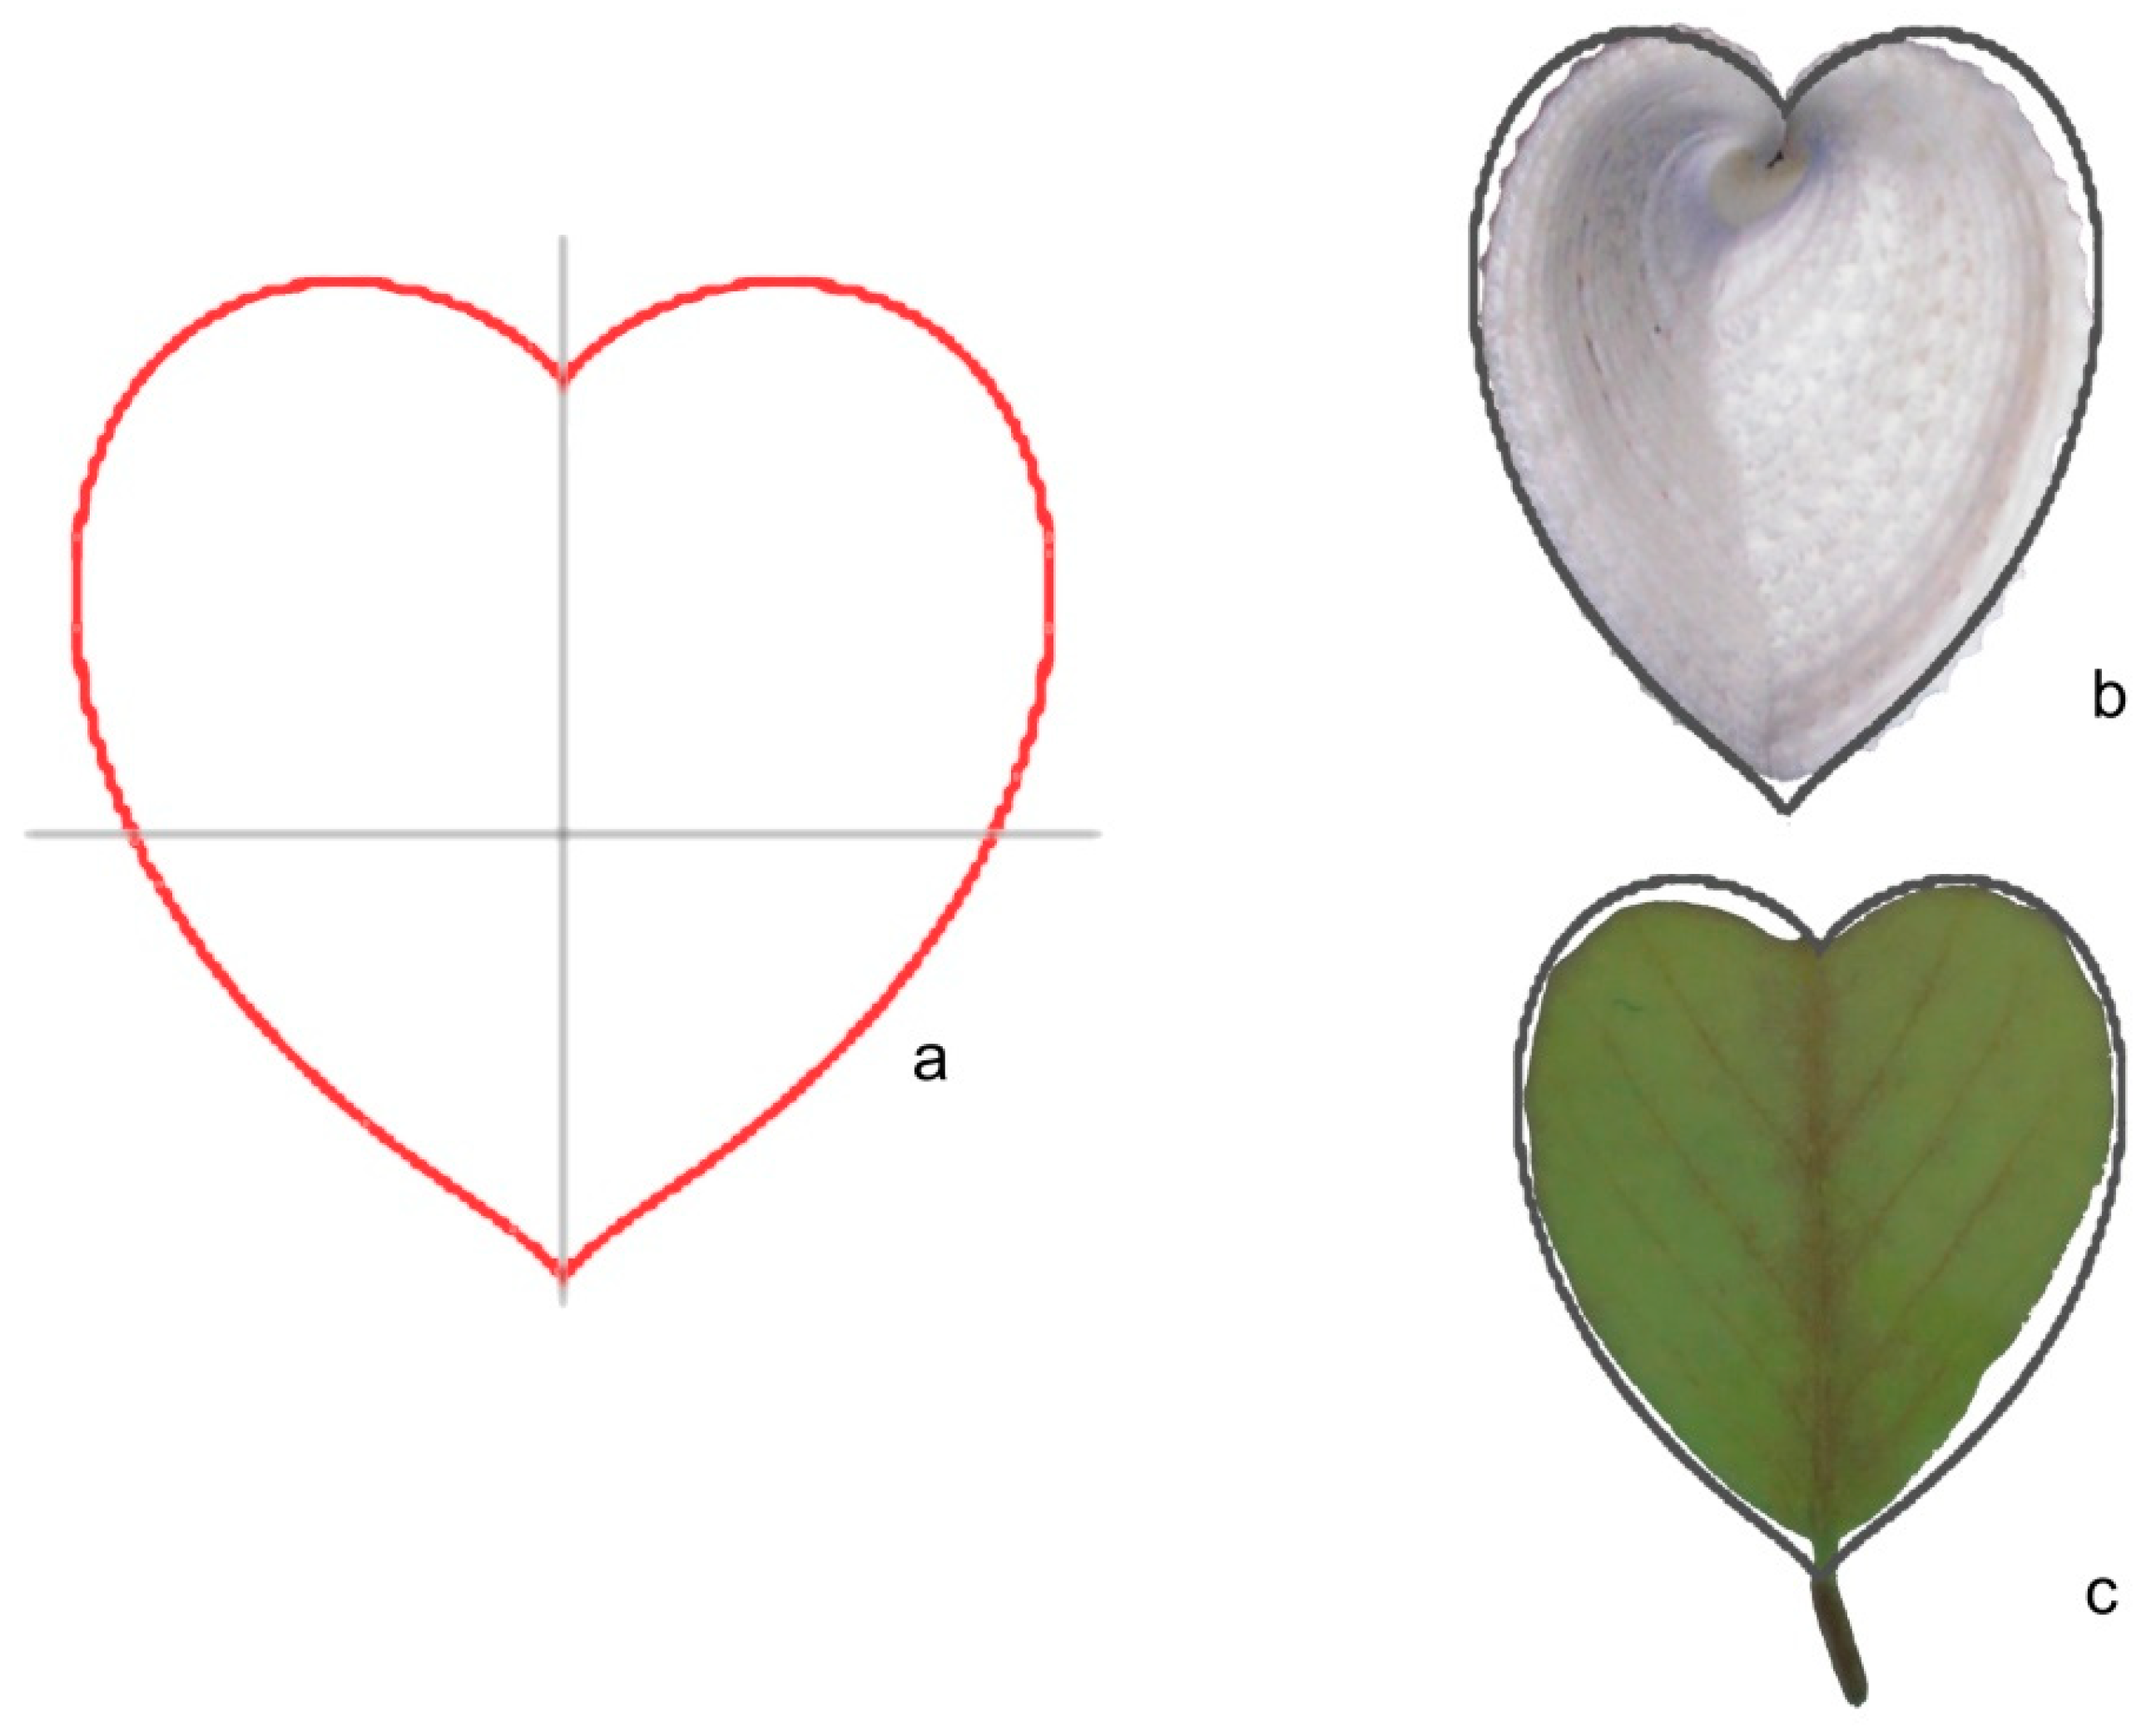
2.5. Heart Curve
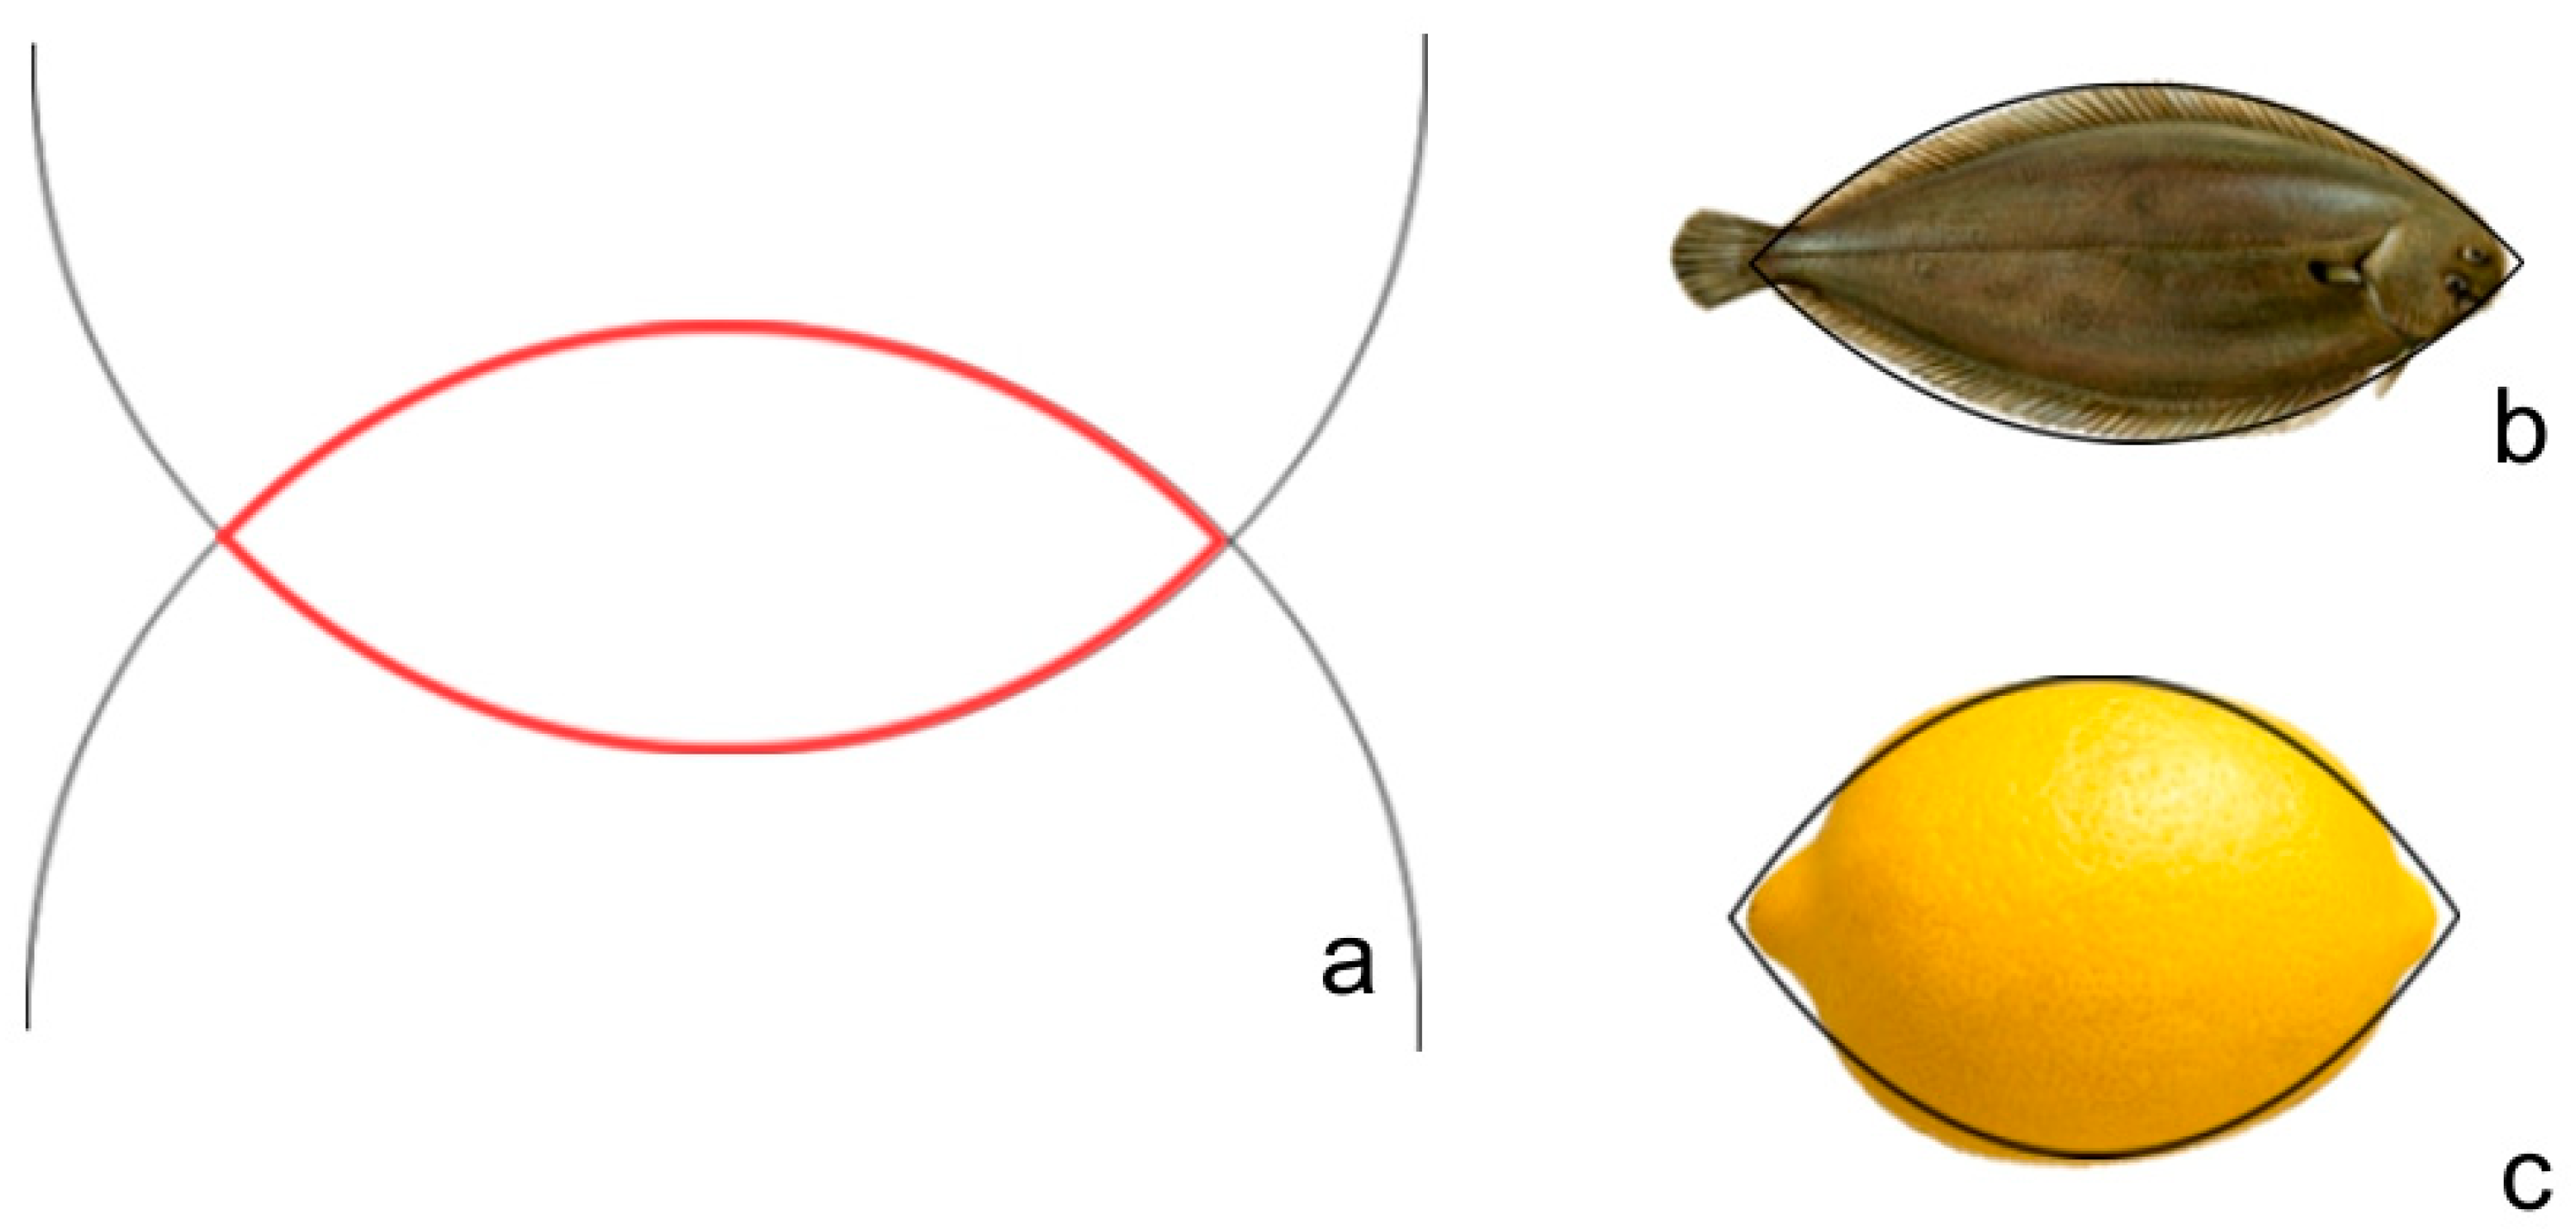
2.6. Lens
3. Models Predominant in Particular Species and Taxonomic Groups
3.1. Variations in Seed Shape
3.2. The Cardioid as a Tool for Seed Shape Quantification in Model Species
3.3. The Cardioid Applies also to Capparis Seeds Allowing Description of Intra-Specific Variability
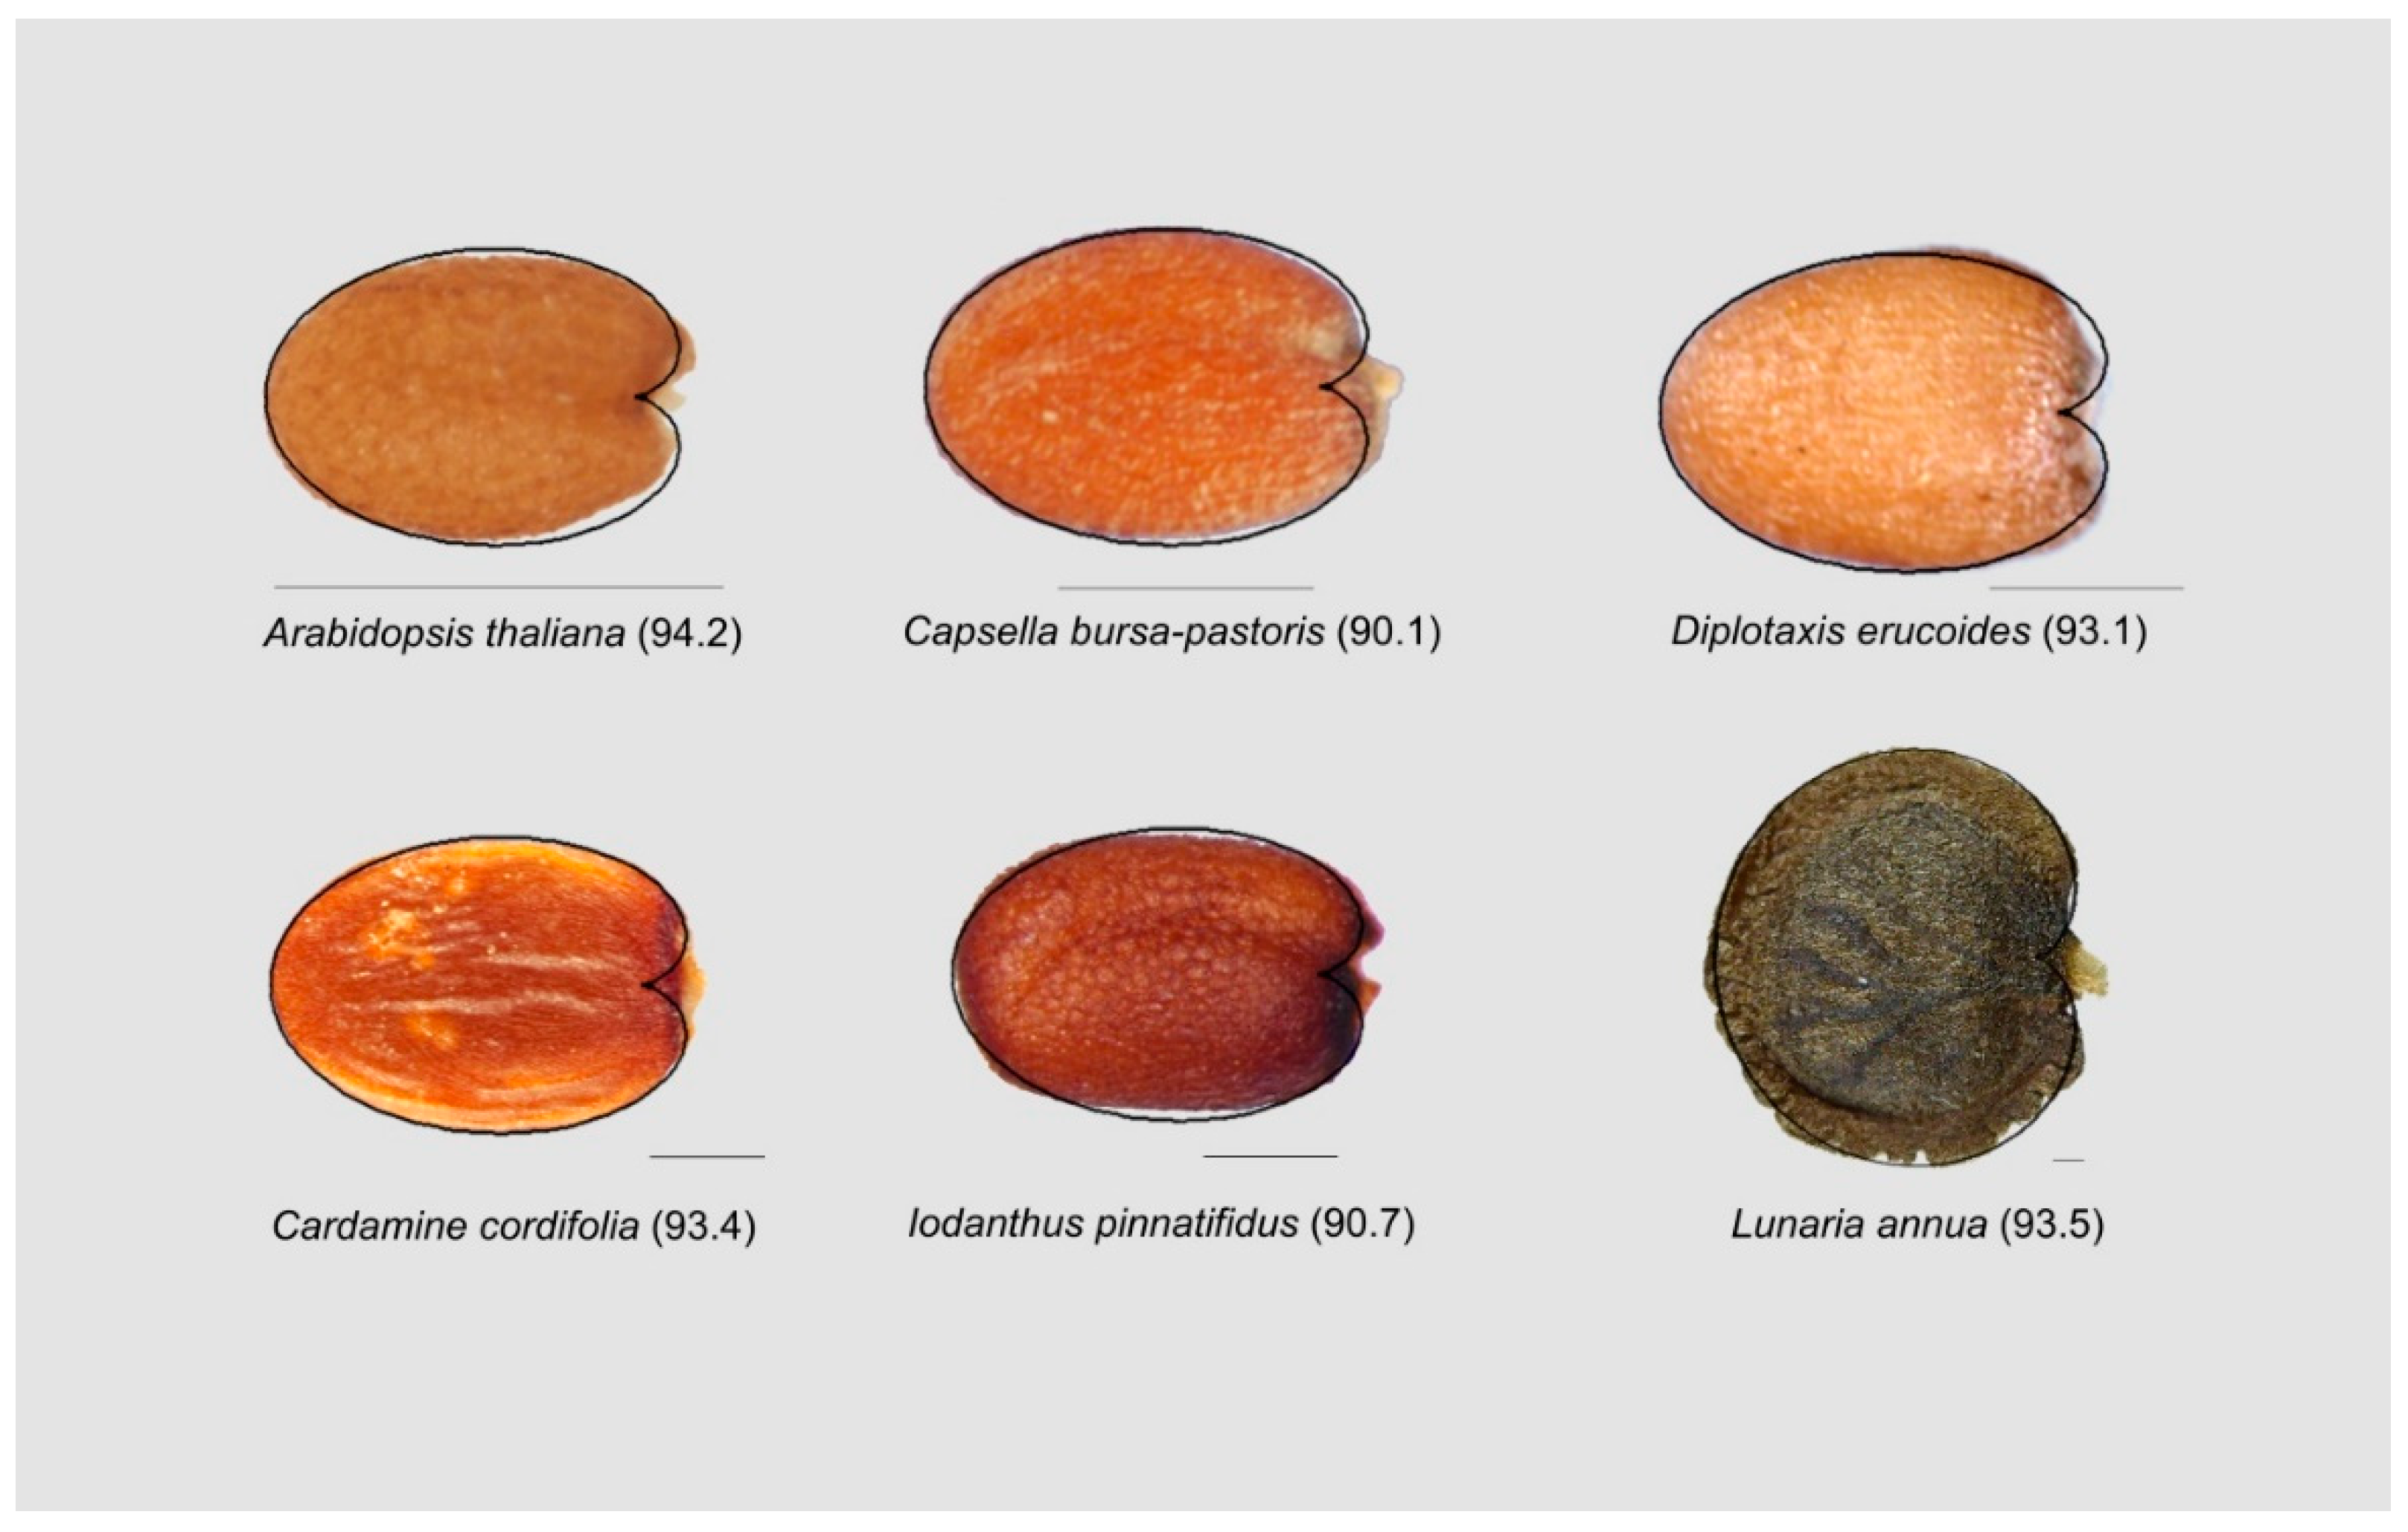
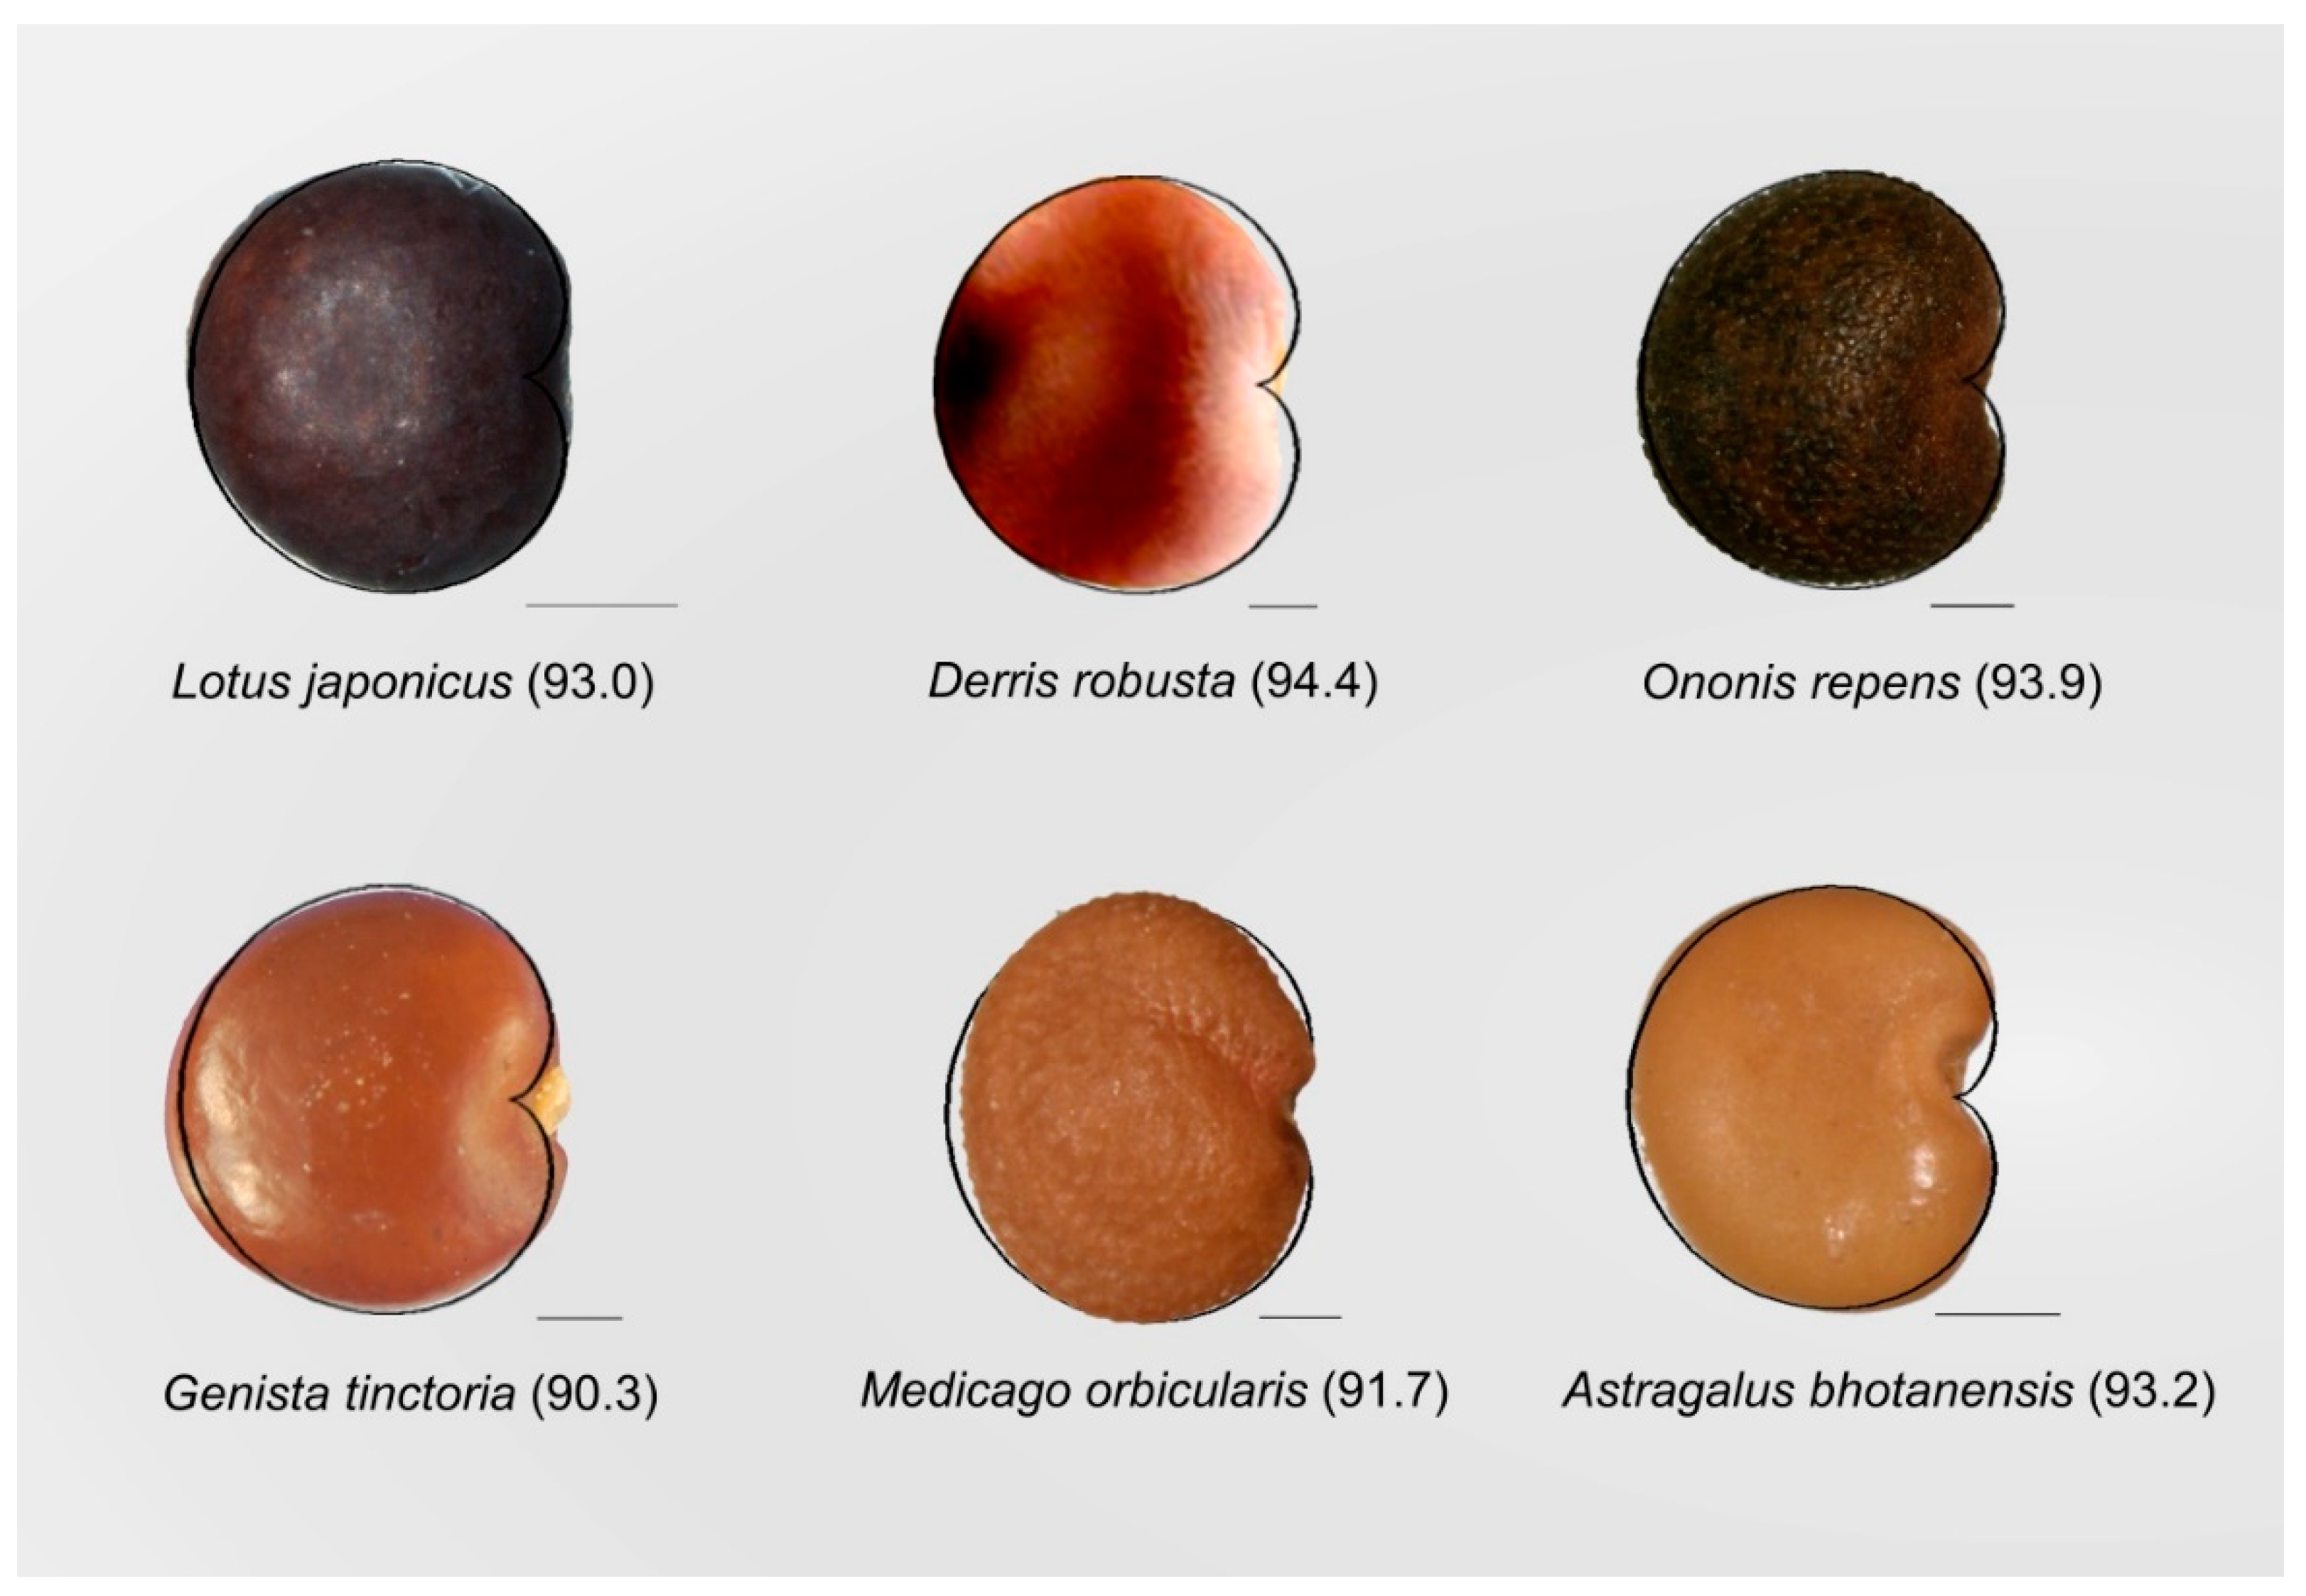
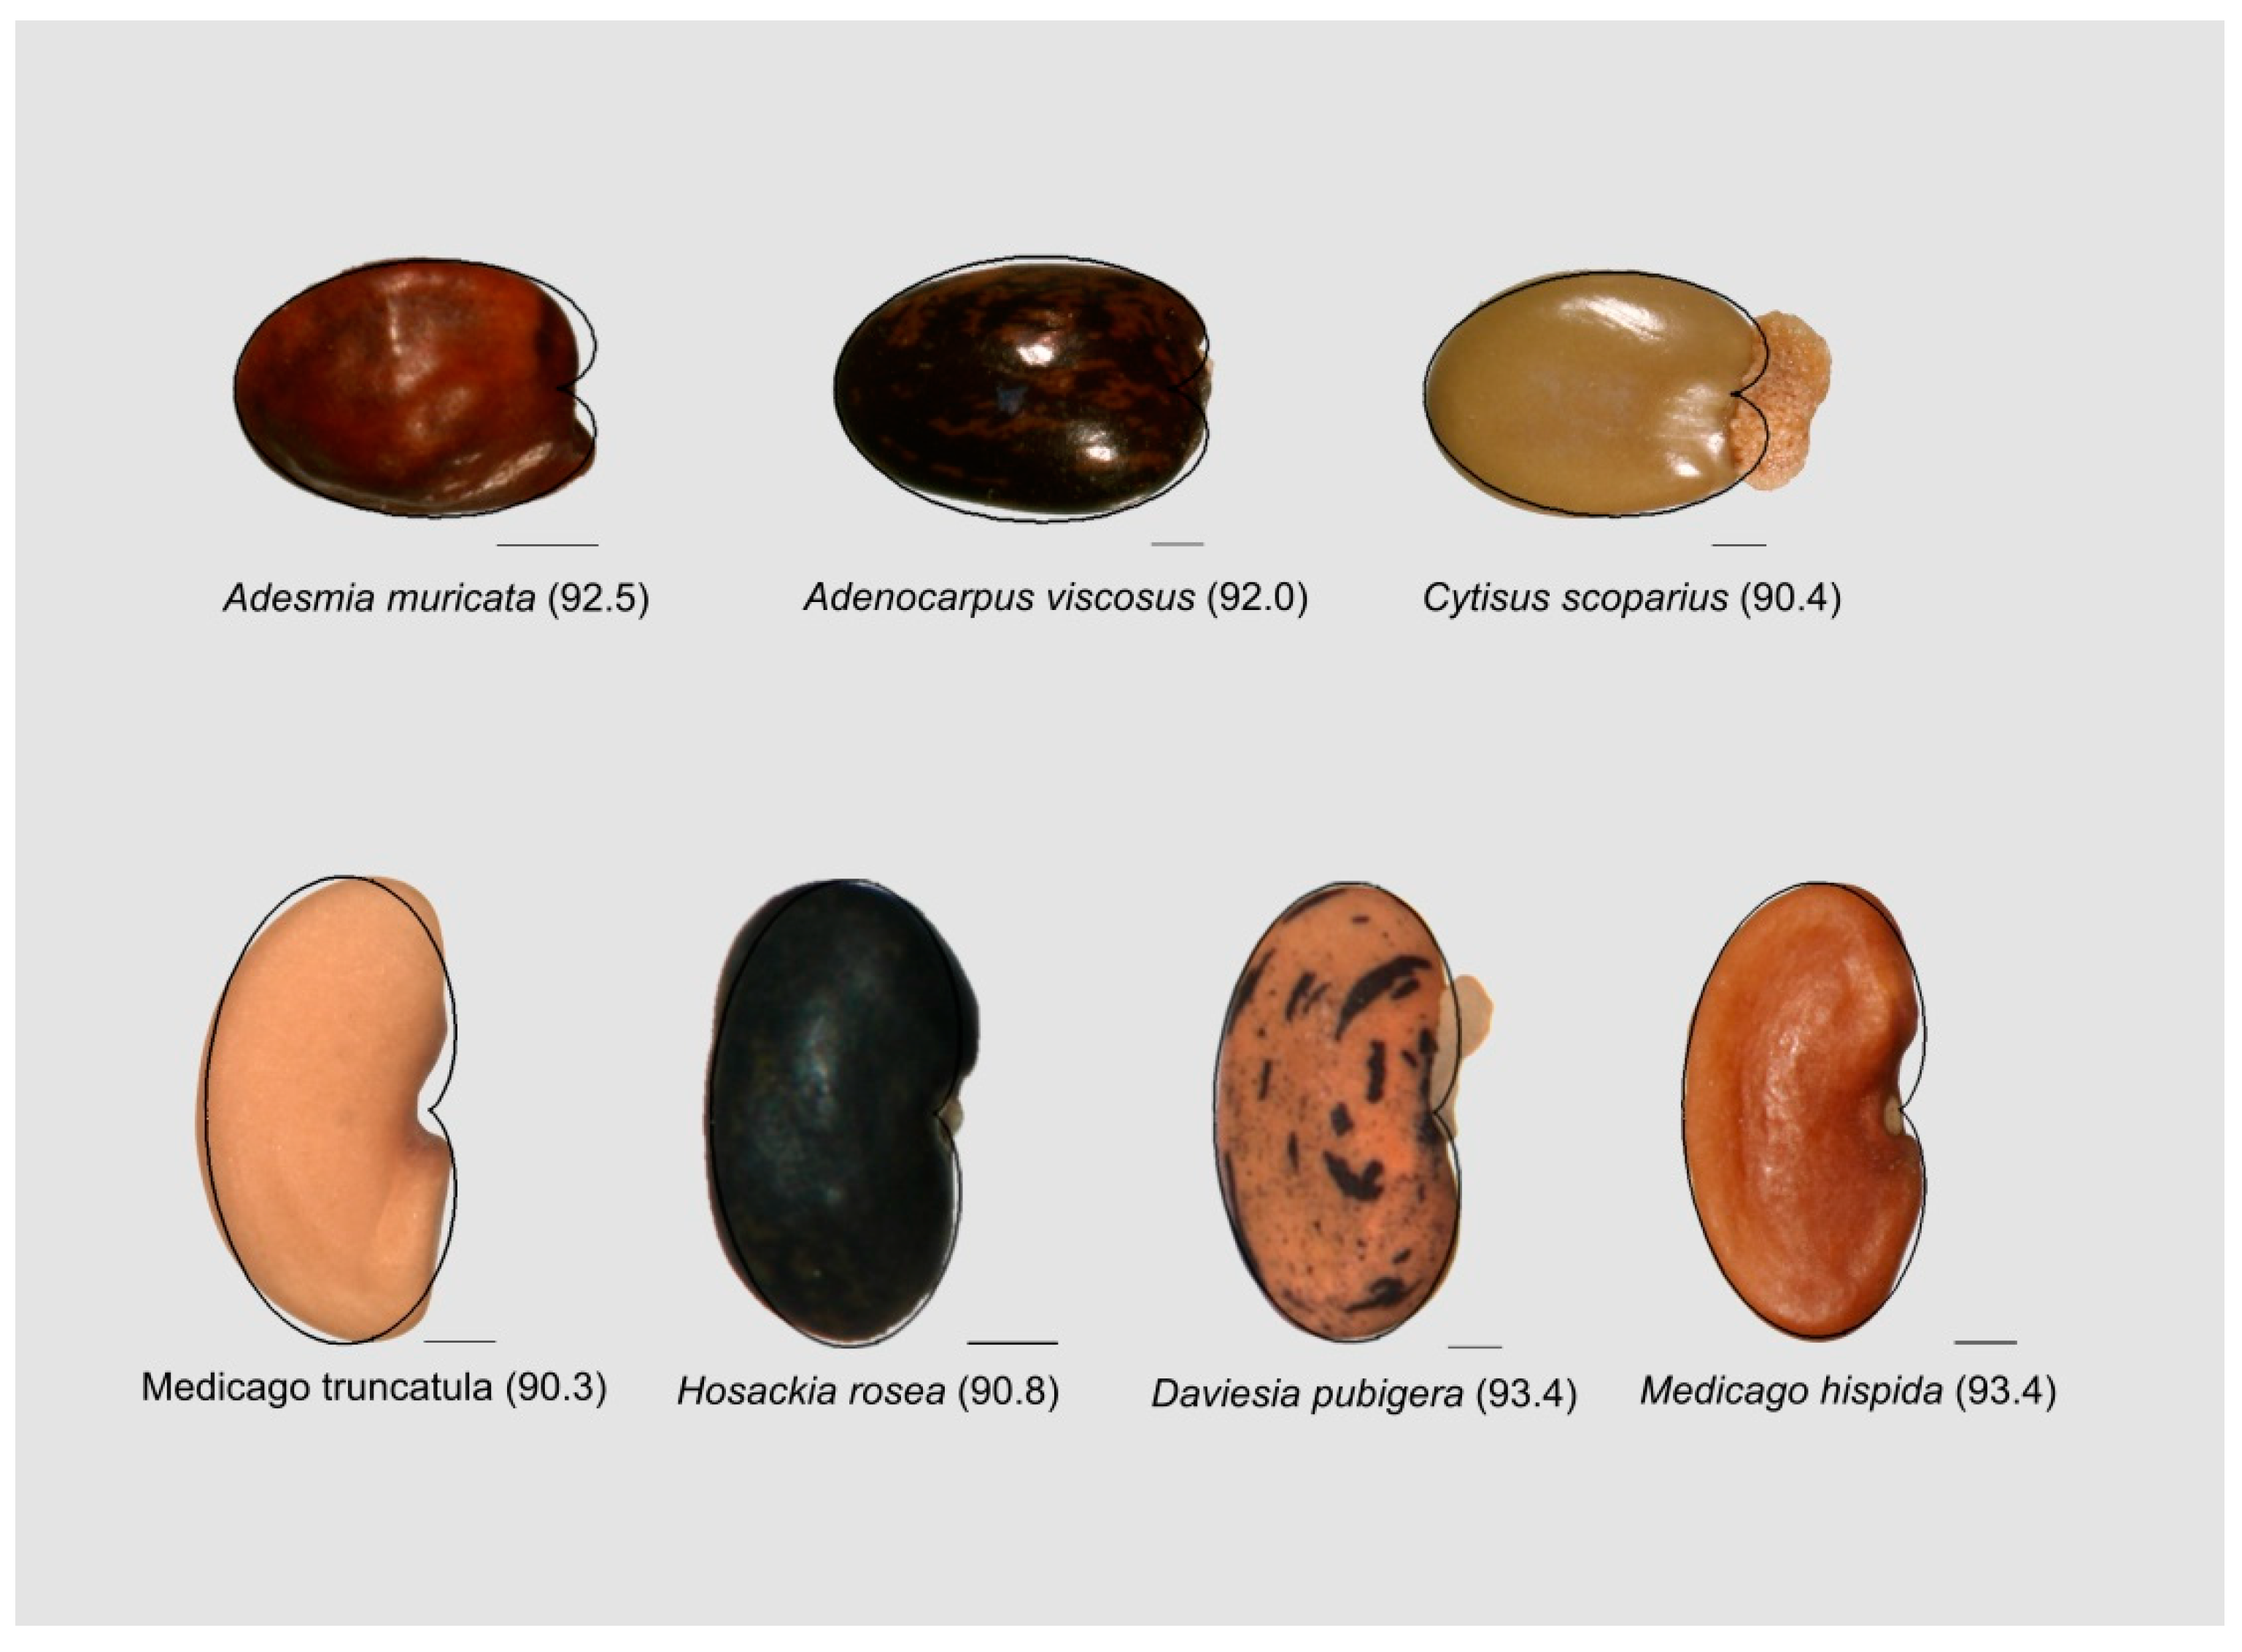
3.4. The Cardioid as a Tool for Seed Shape Quantification in Other Species of Brassicaceae and Legumes
3.5. The Cardioid as a Model in Seeds of Other Families
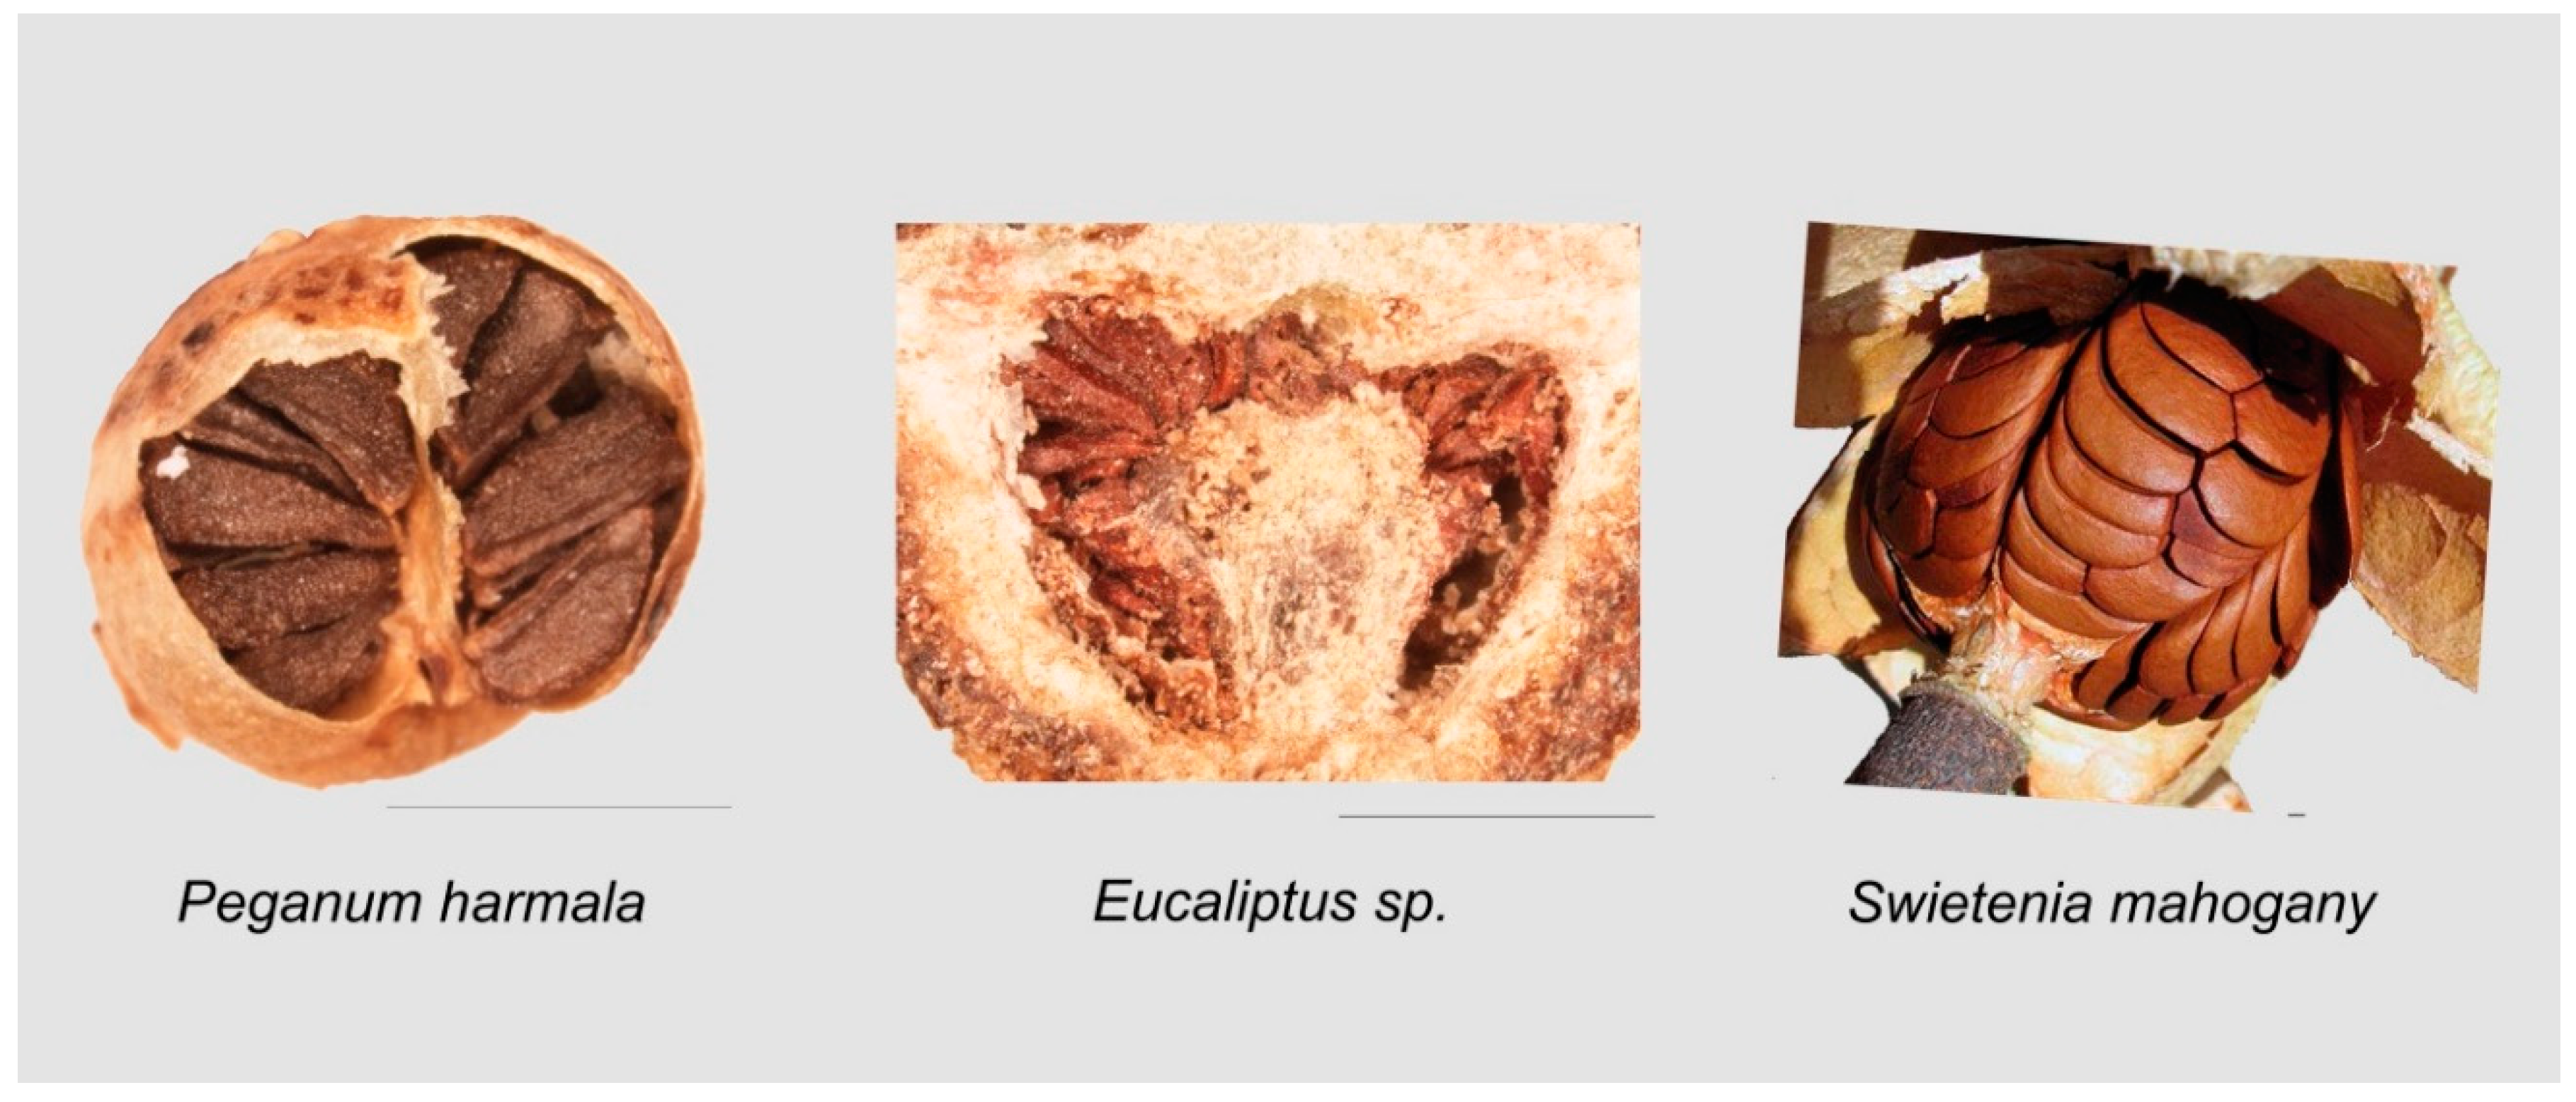
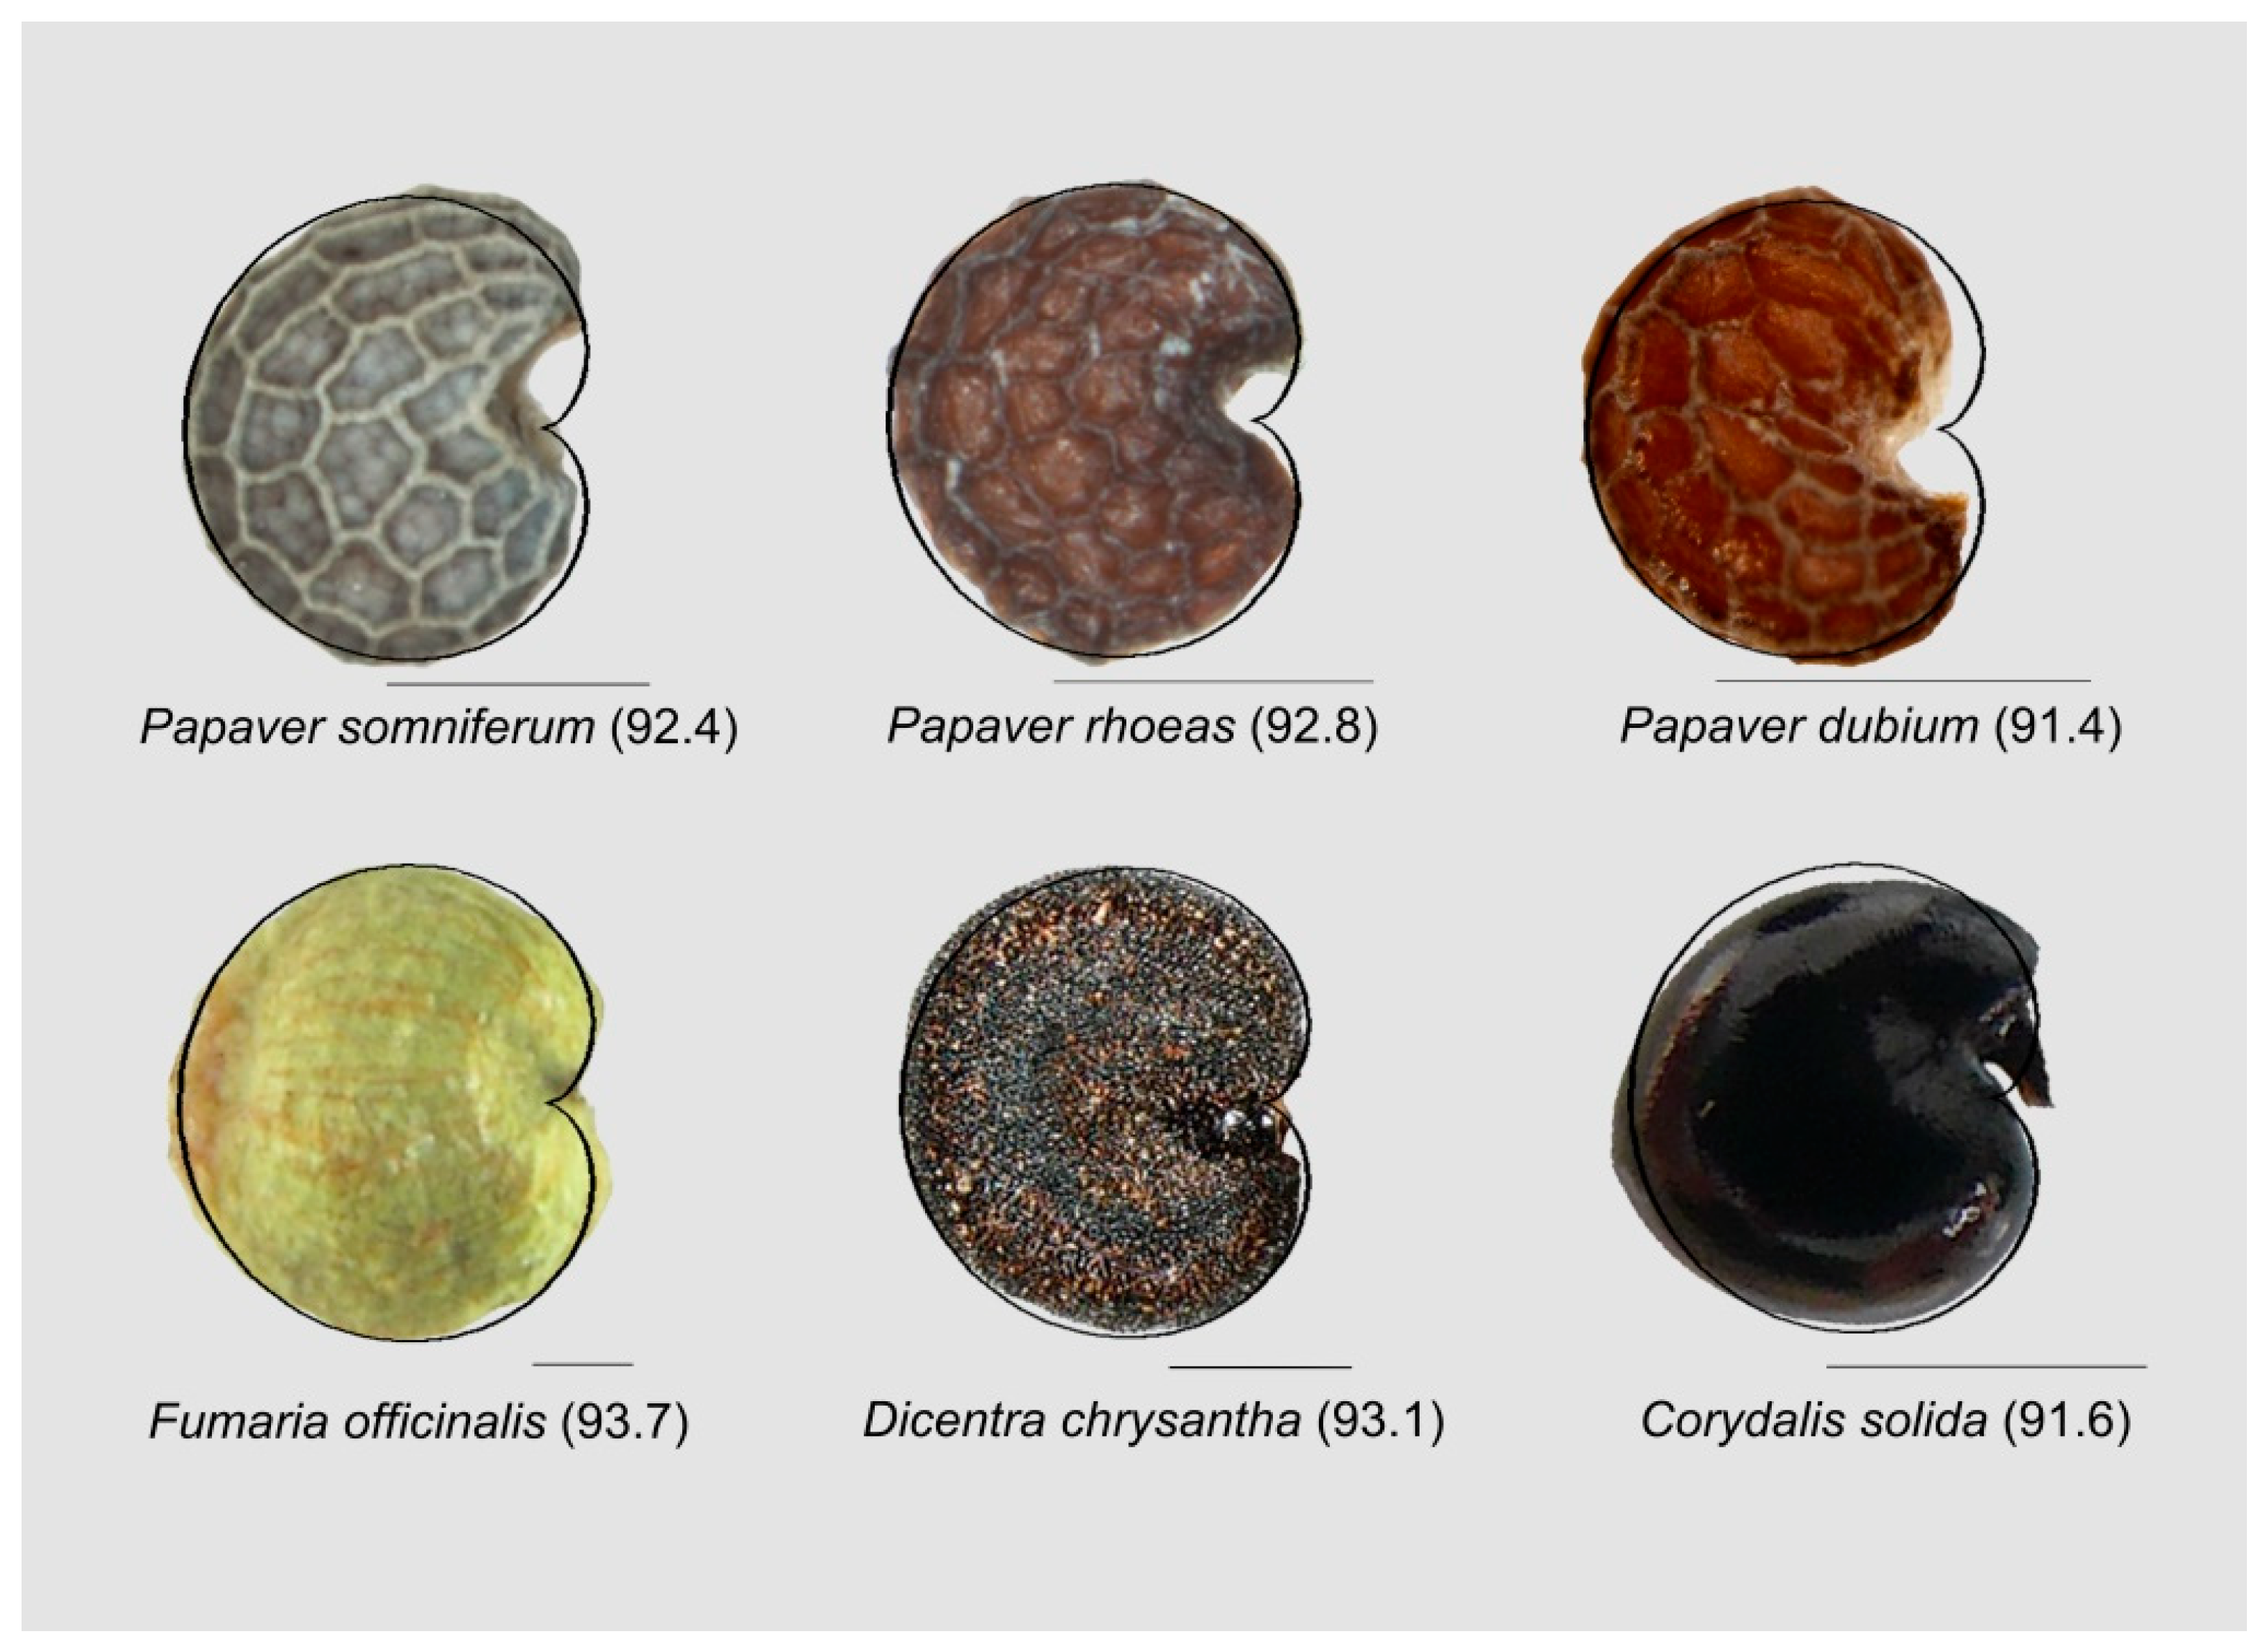
3.5.1. Papaveraceae
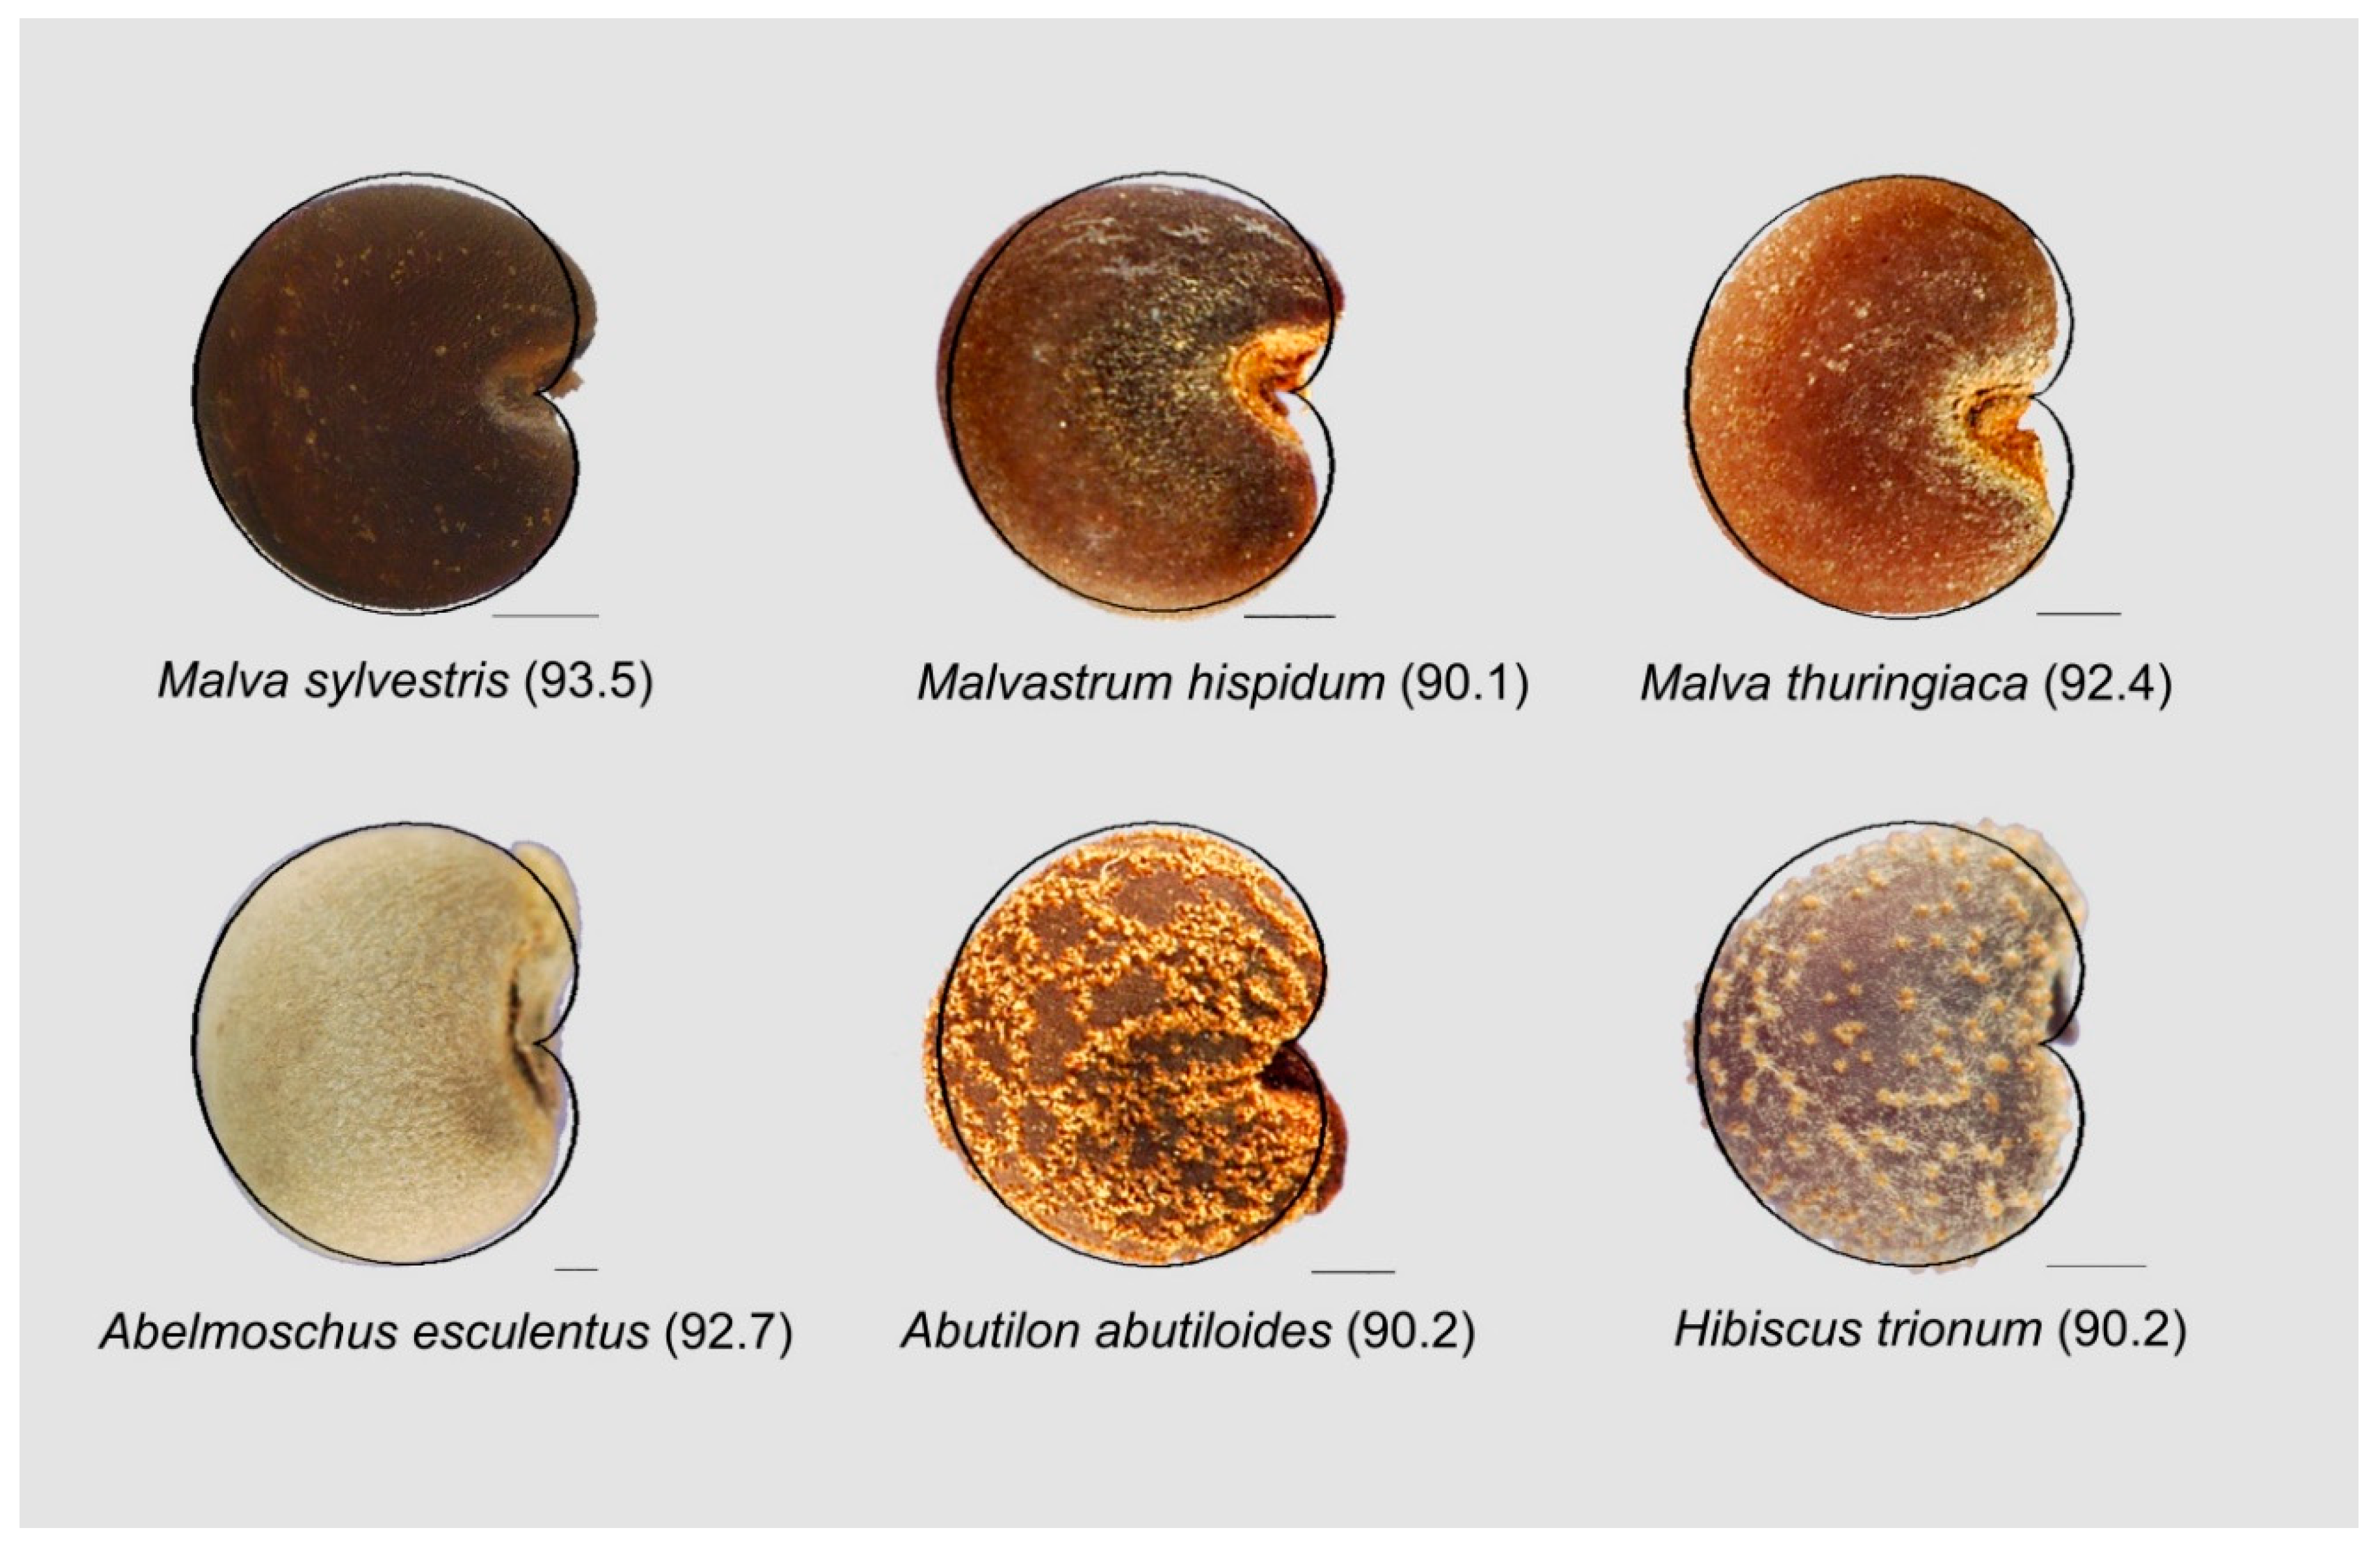
3.5.2. Malvaceae
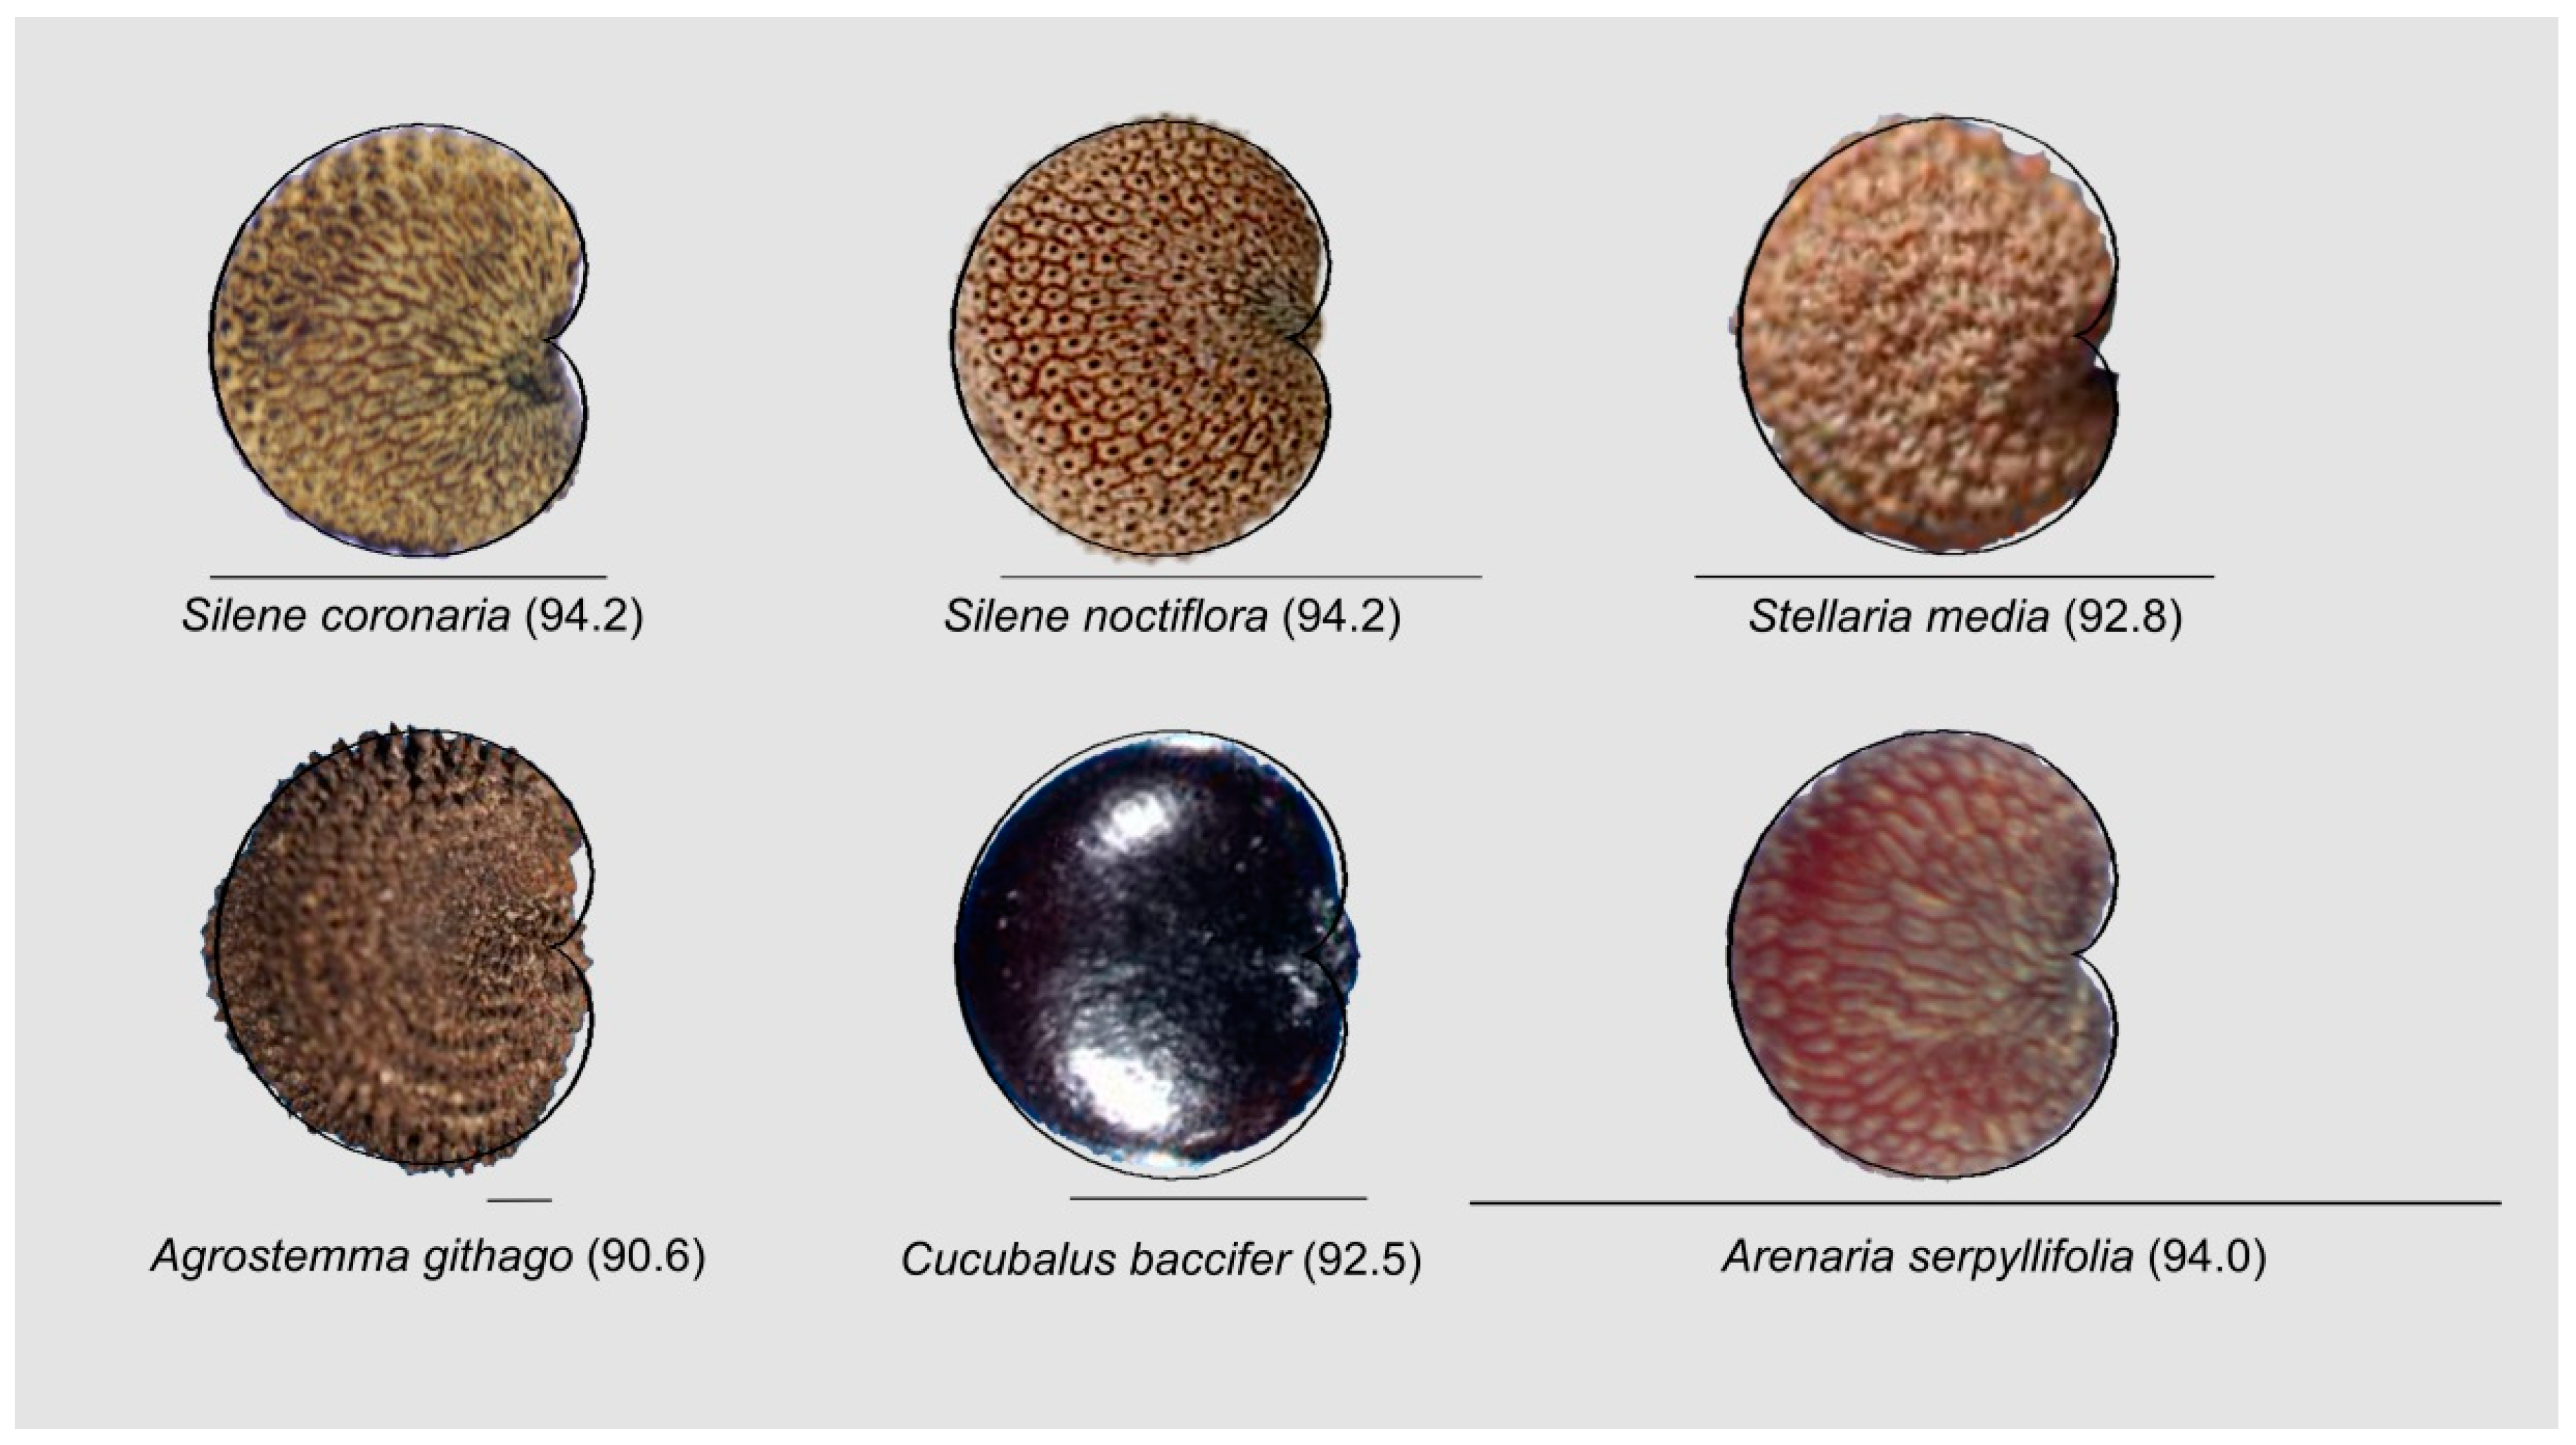
3.5.3. Caryophyllaceae
3.6. The Ellipse Is a Model for Seed Morphology in Diverse Families
3.6.1. Euphorbiaceae
3.6.2. Oleaceae
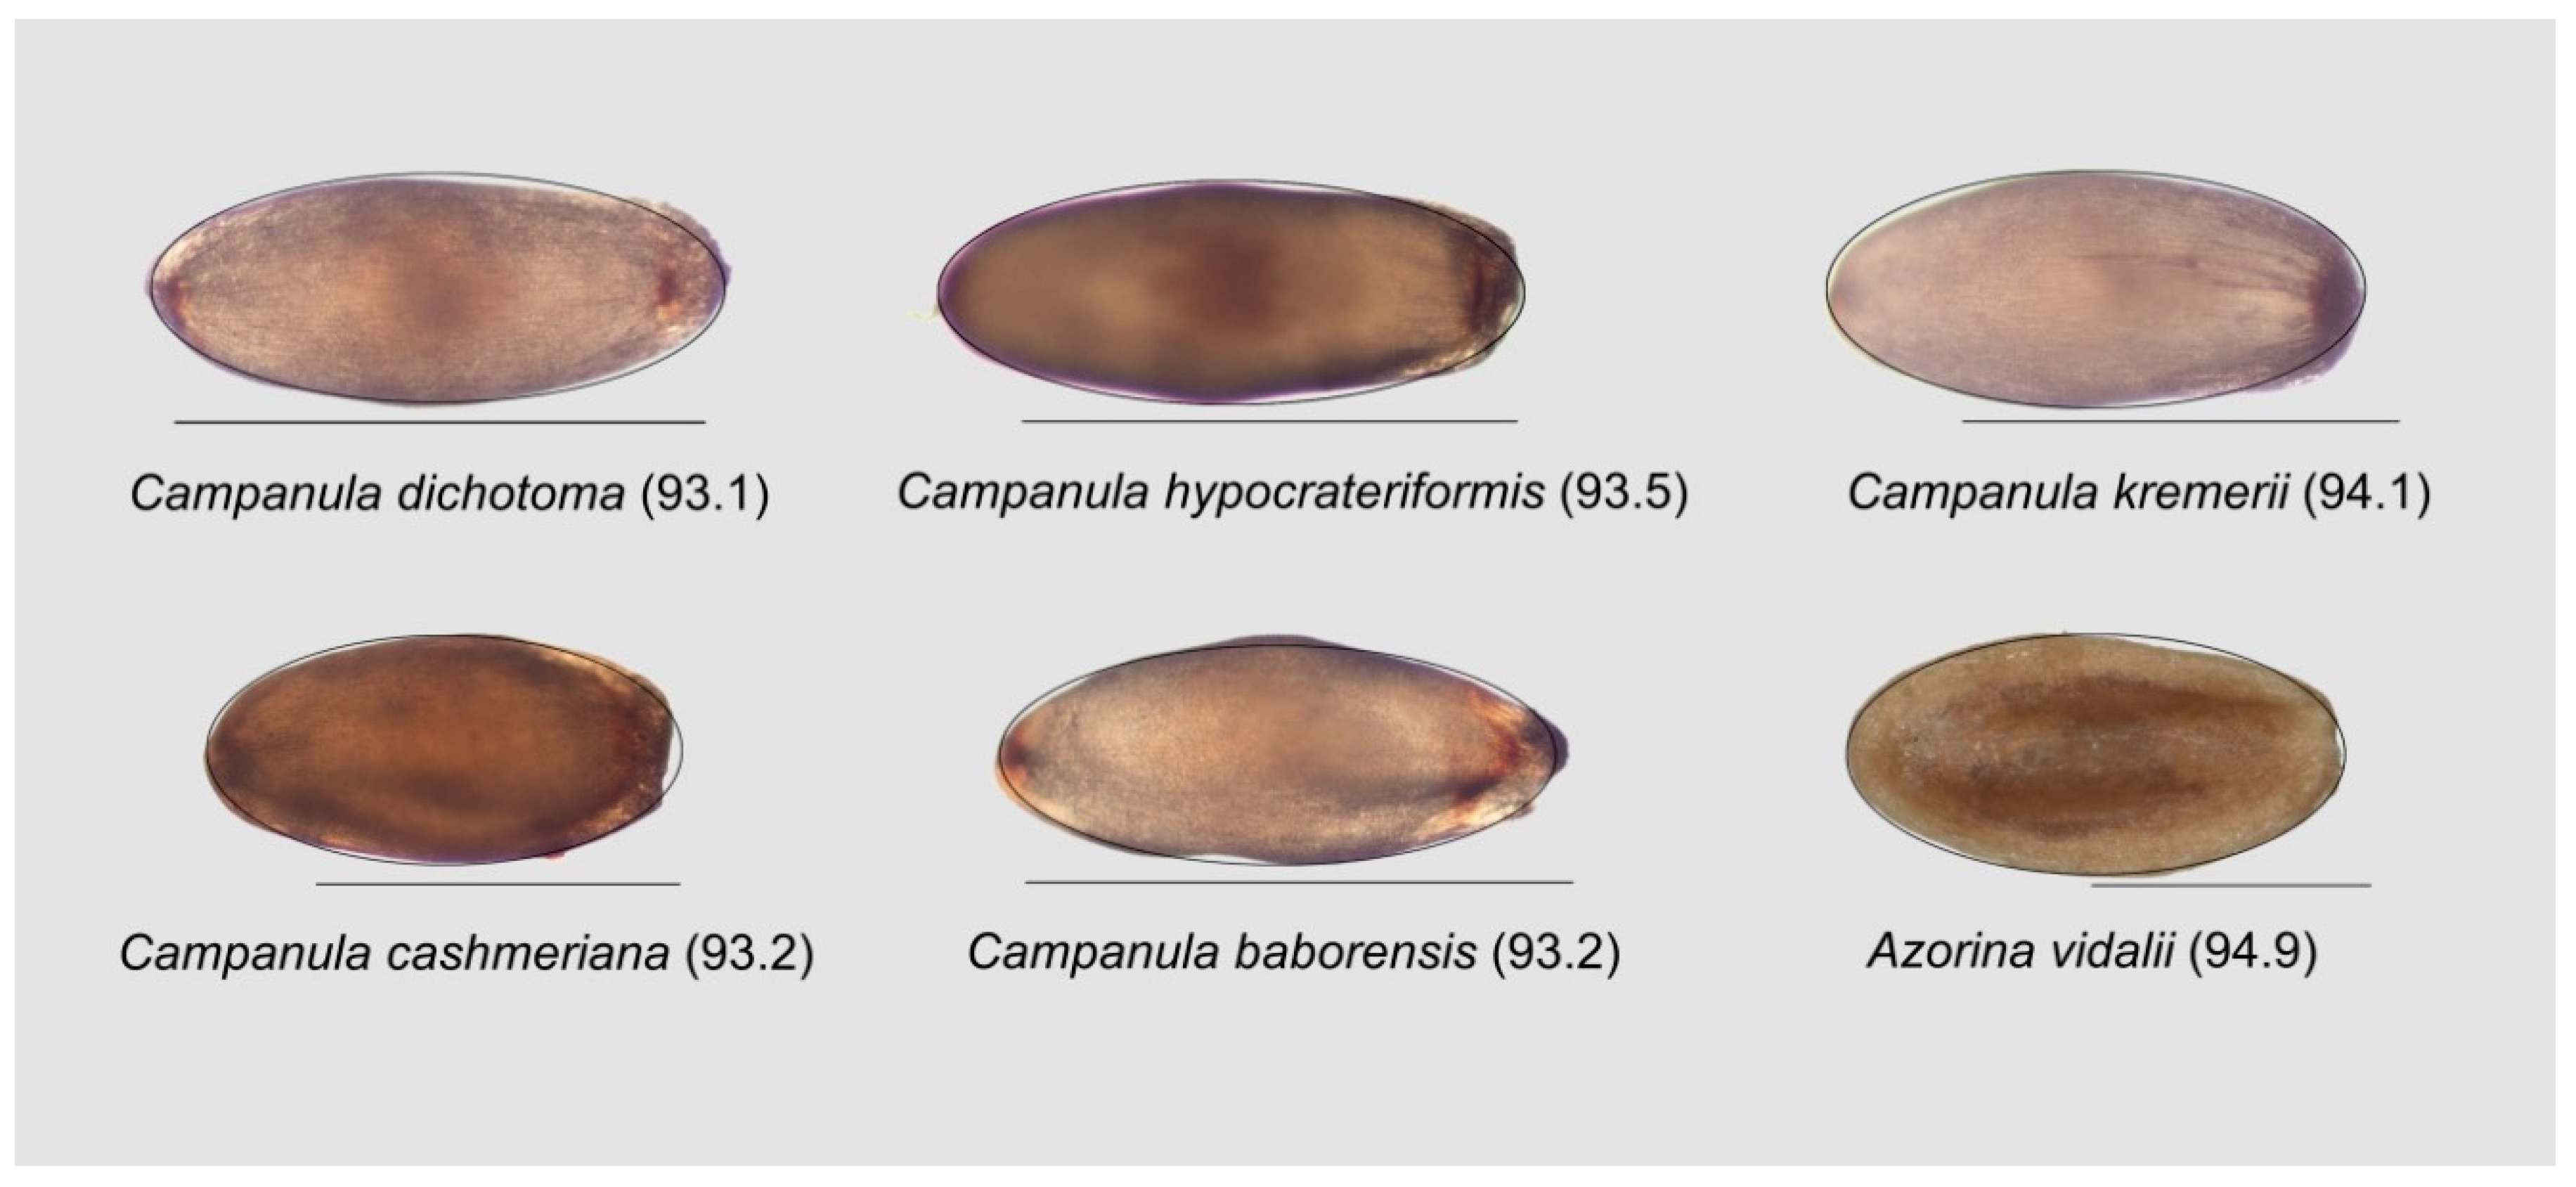
3.6.3. Campanulaceae
3.6.4. Fagaceae
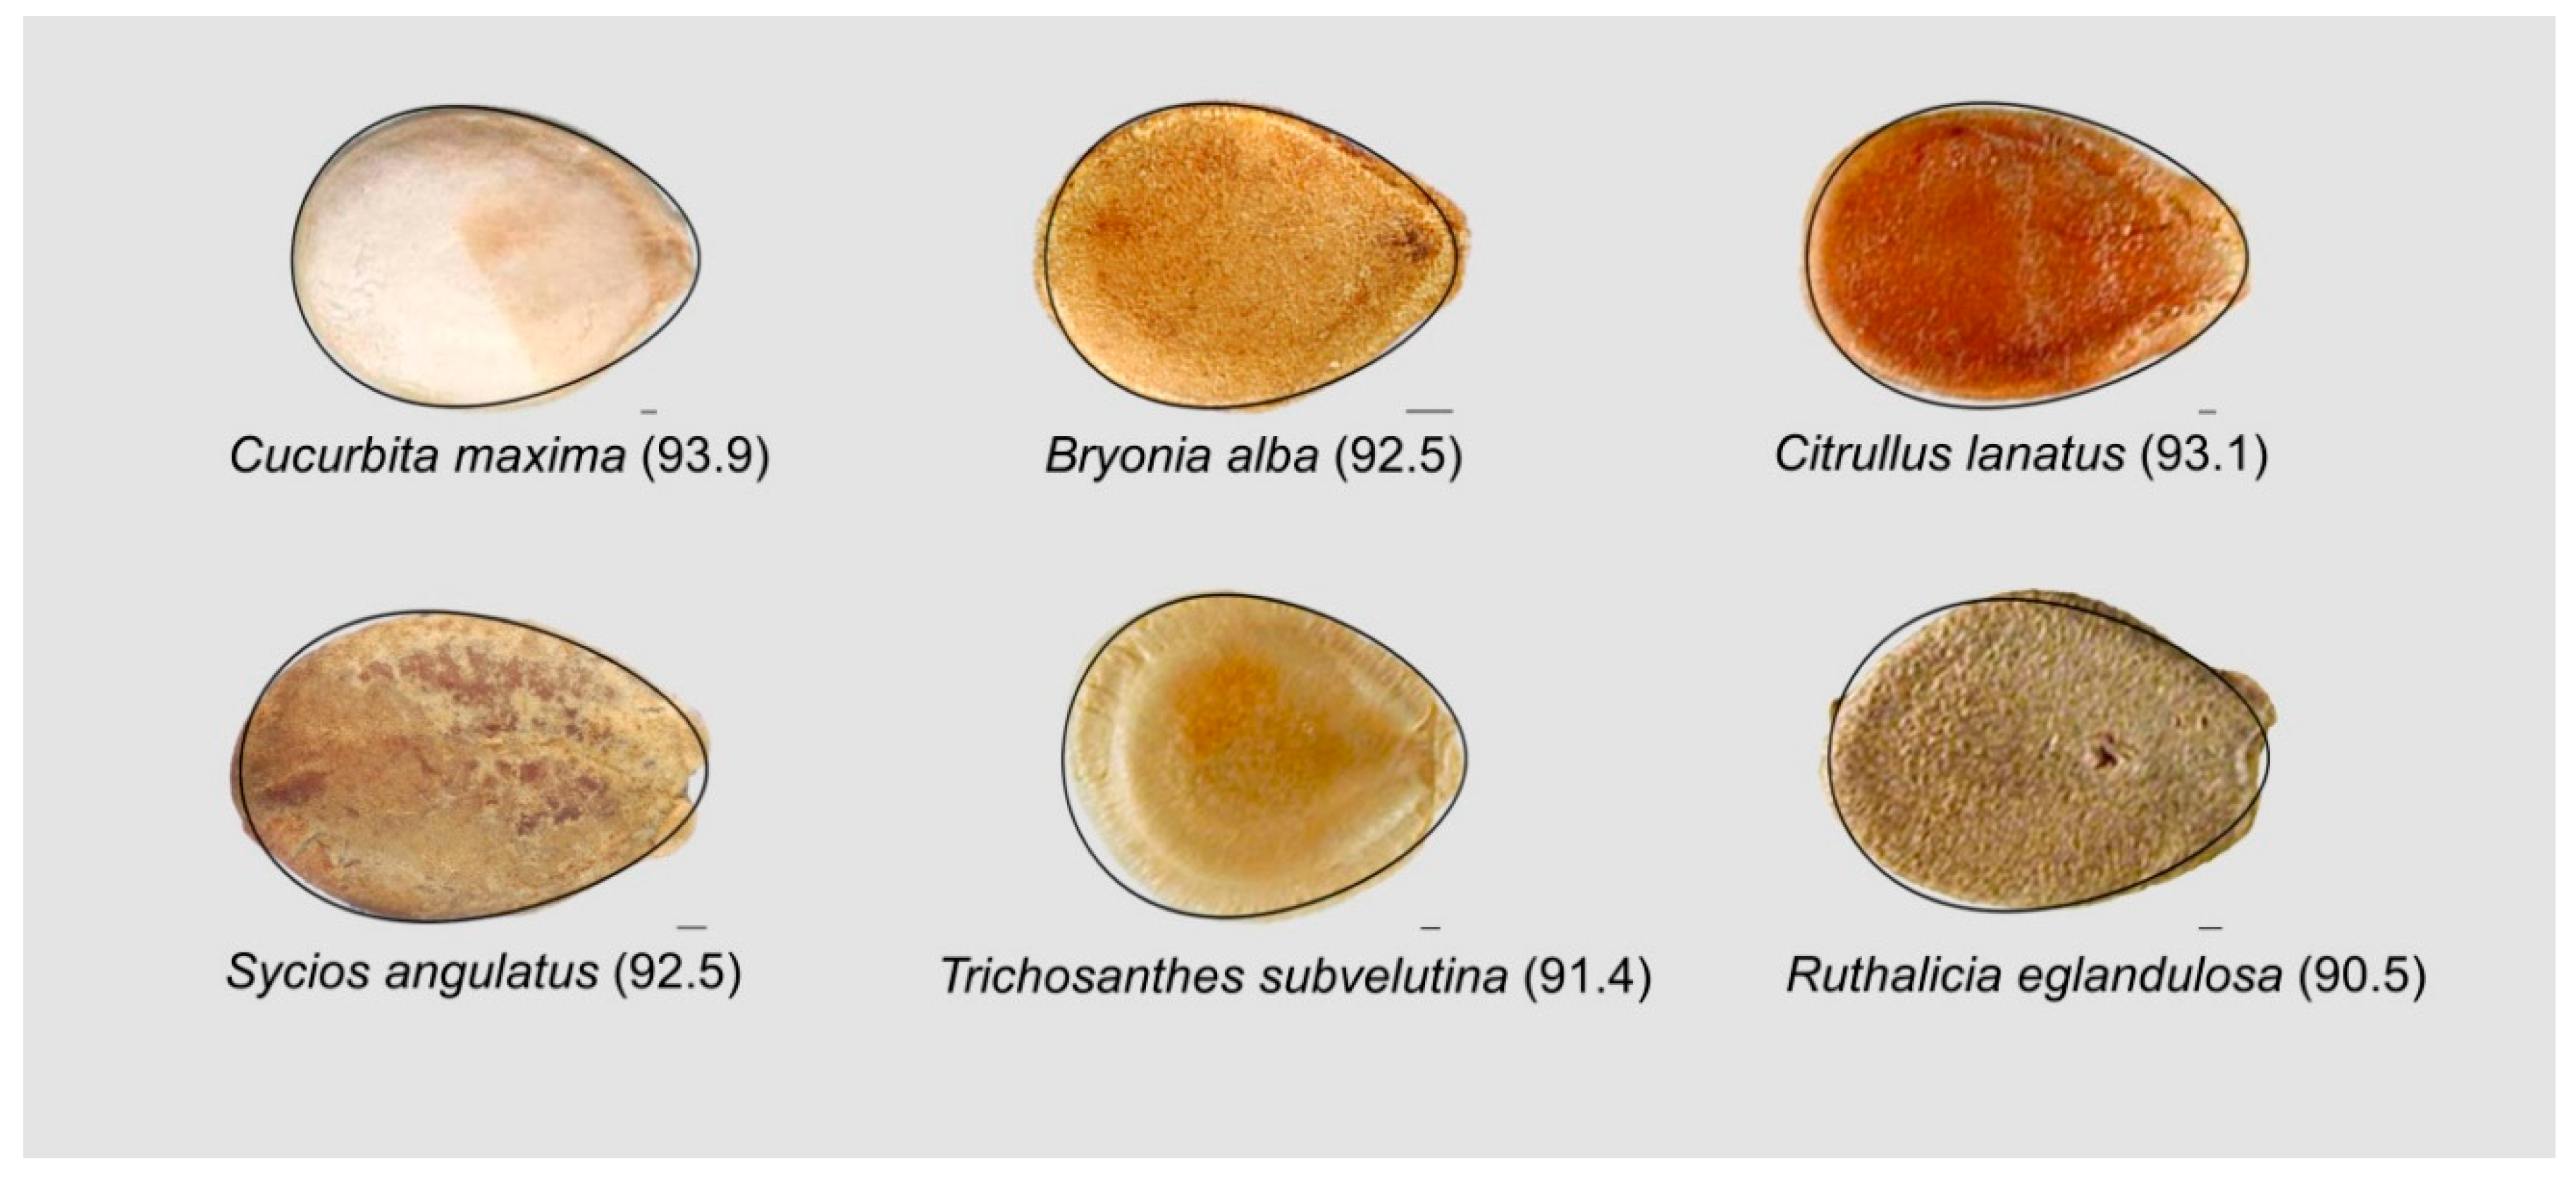
3.7. The Oval Describes the Bi-Dimensional Image of Seeds in the Cucurbitaceae Well as in Other Families
3.8. Seed Images Resembling Lenses
3.9. Other Geometric Figures Useful in Seed Description and Quantification
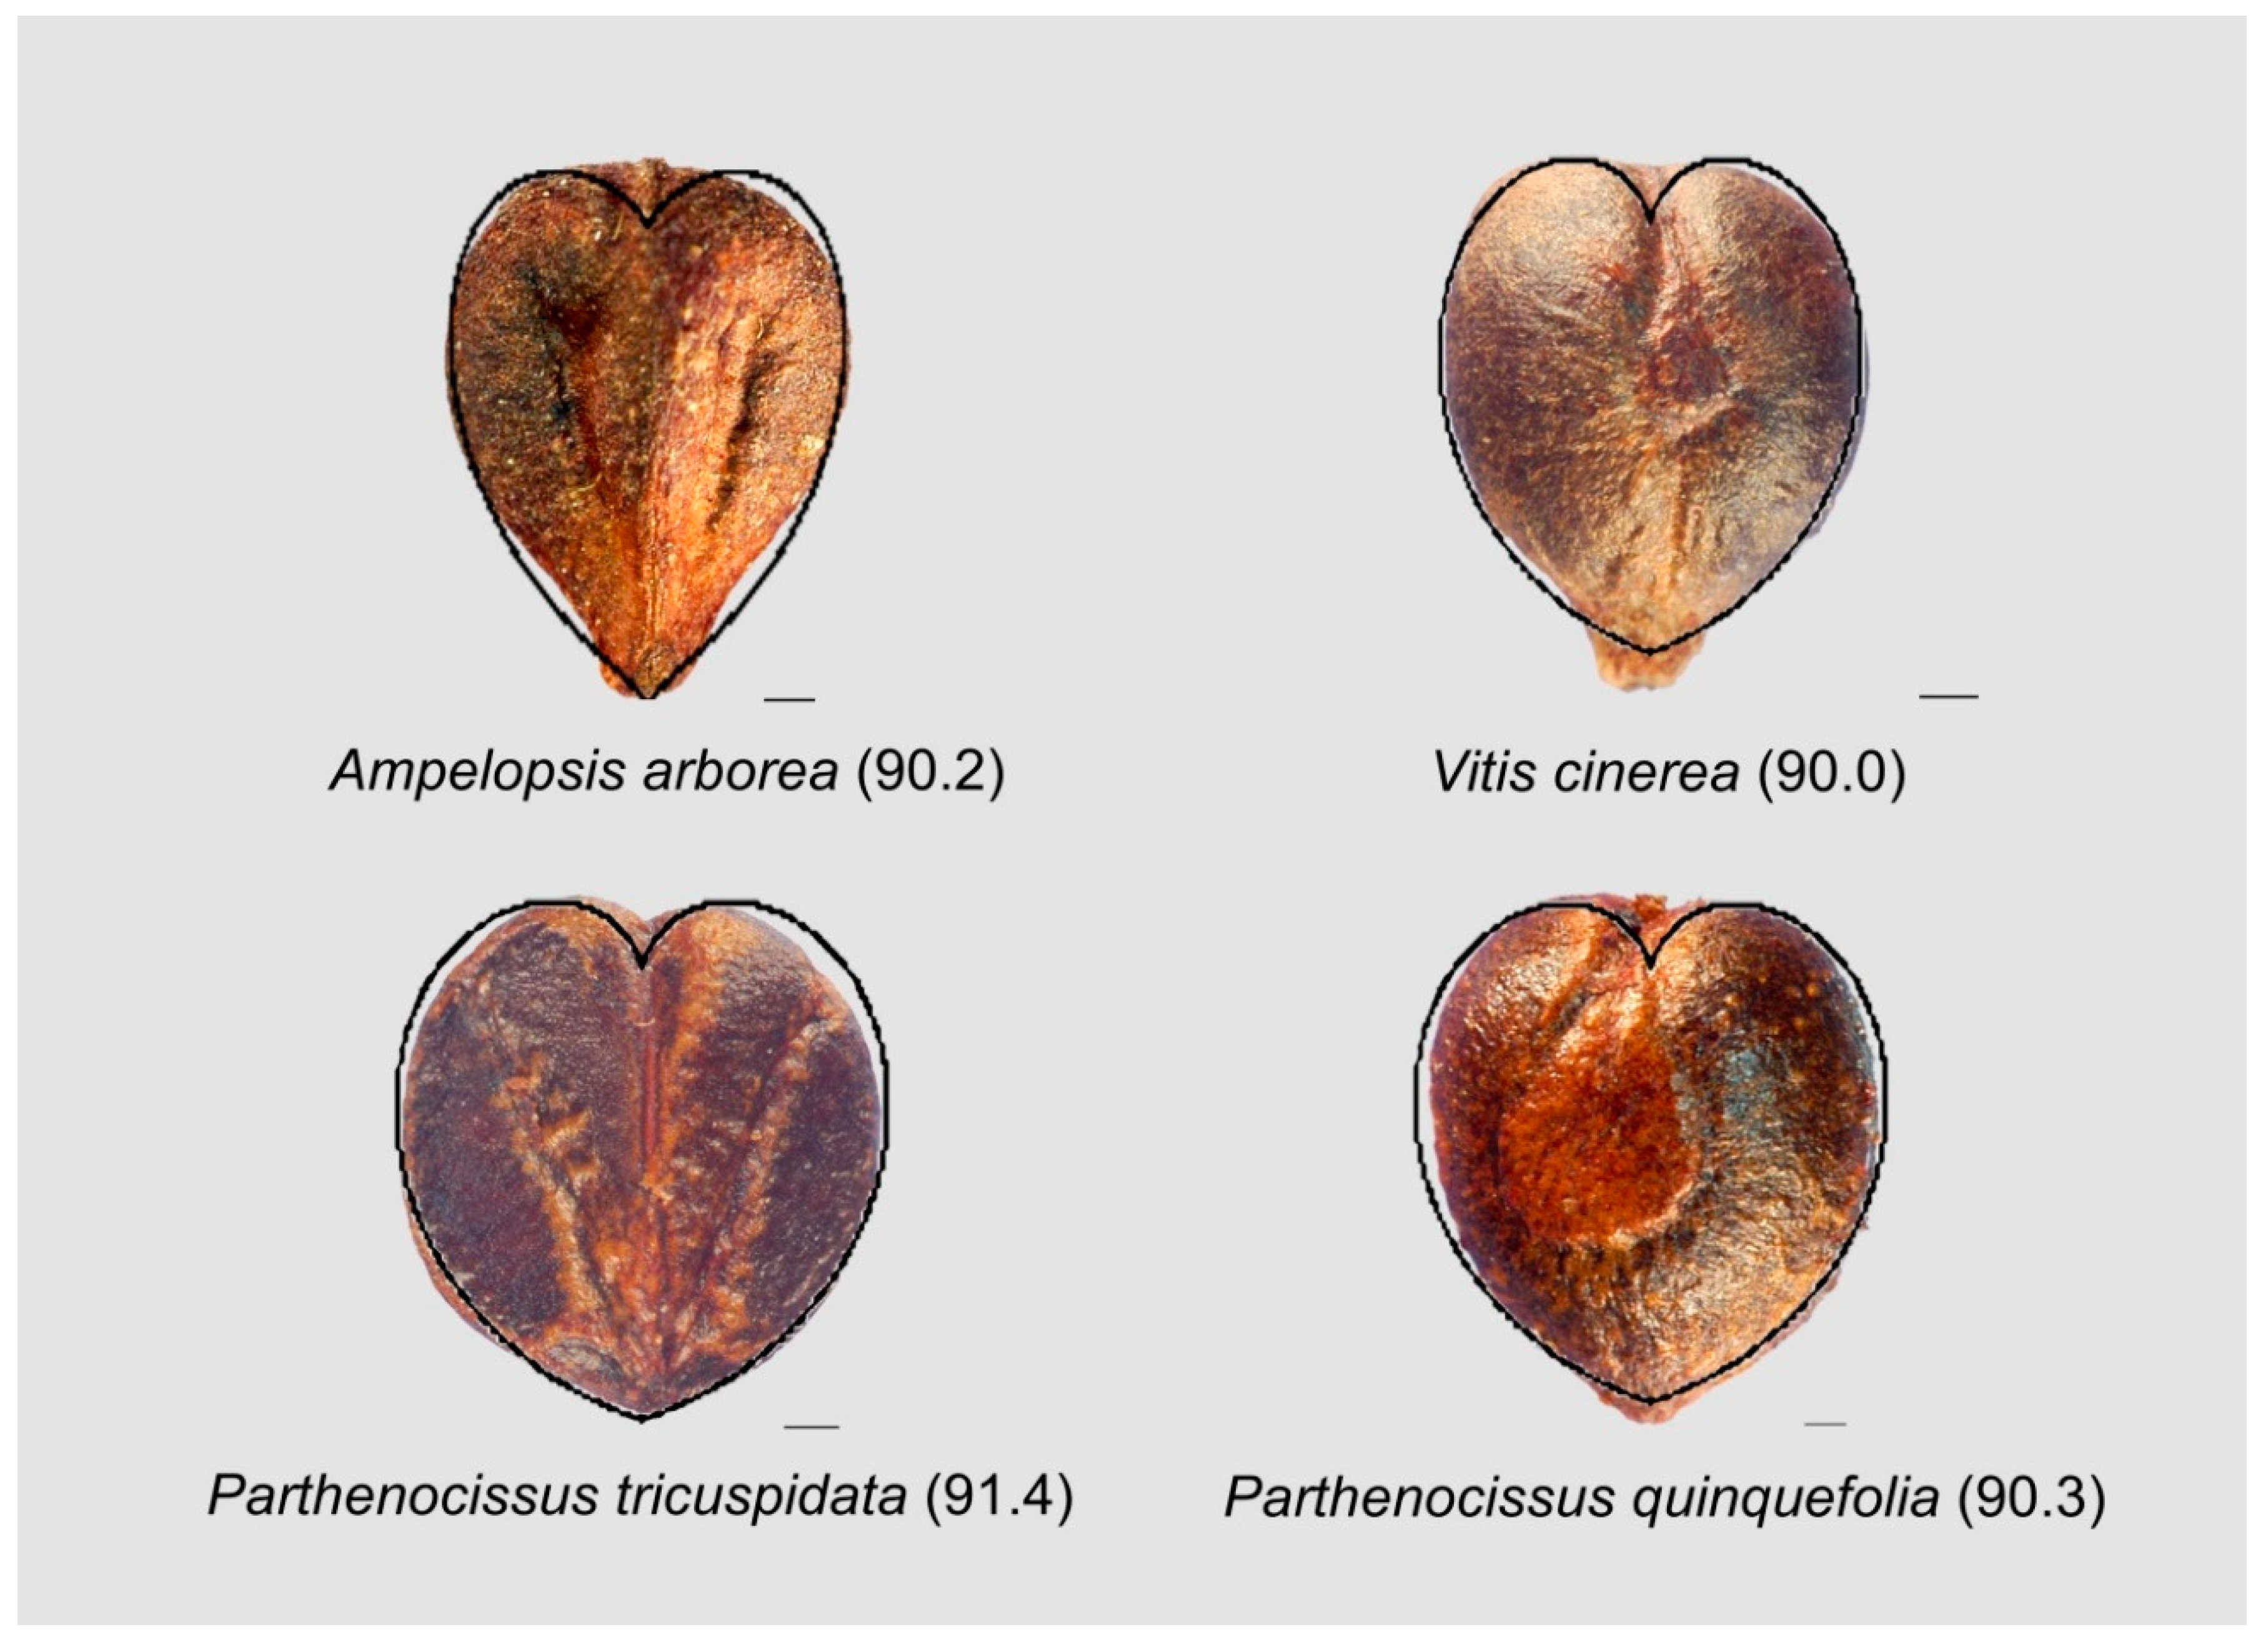
3.9.1. Heart-Shaped Curves
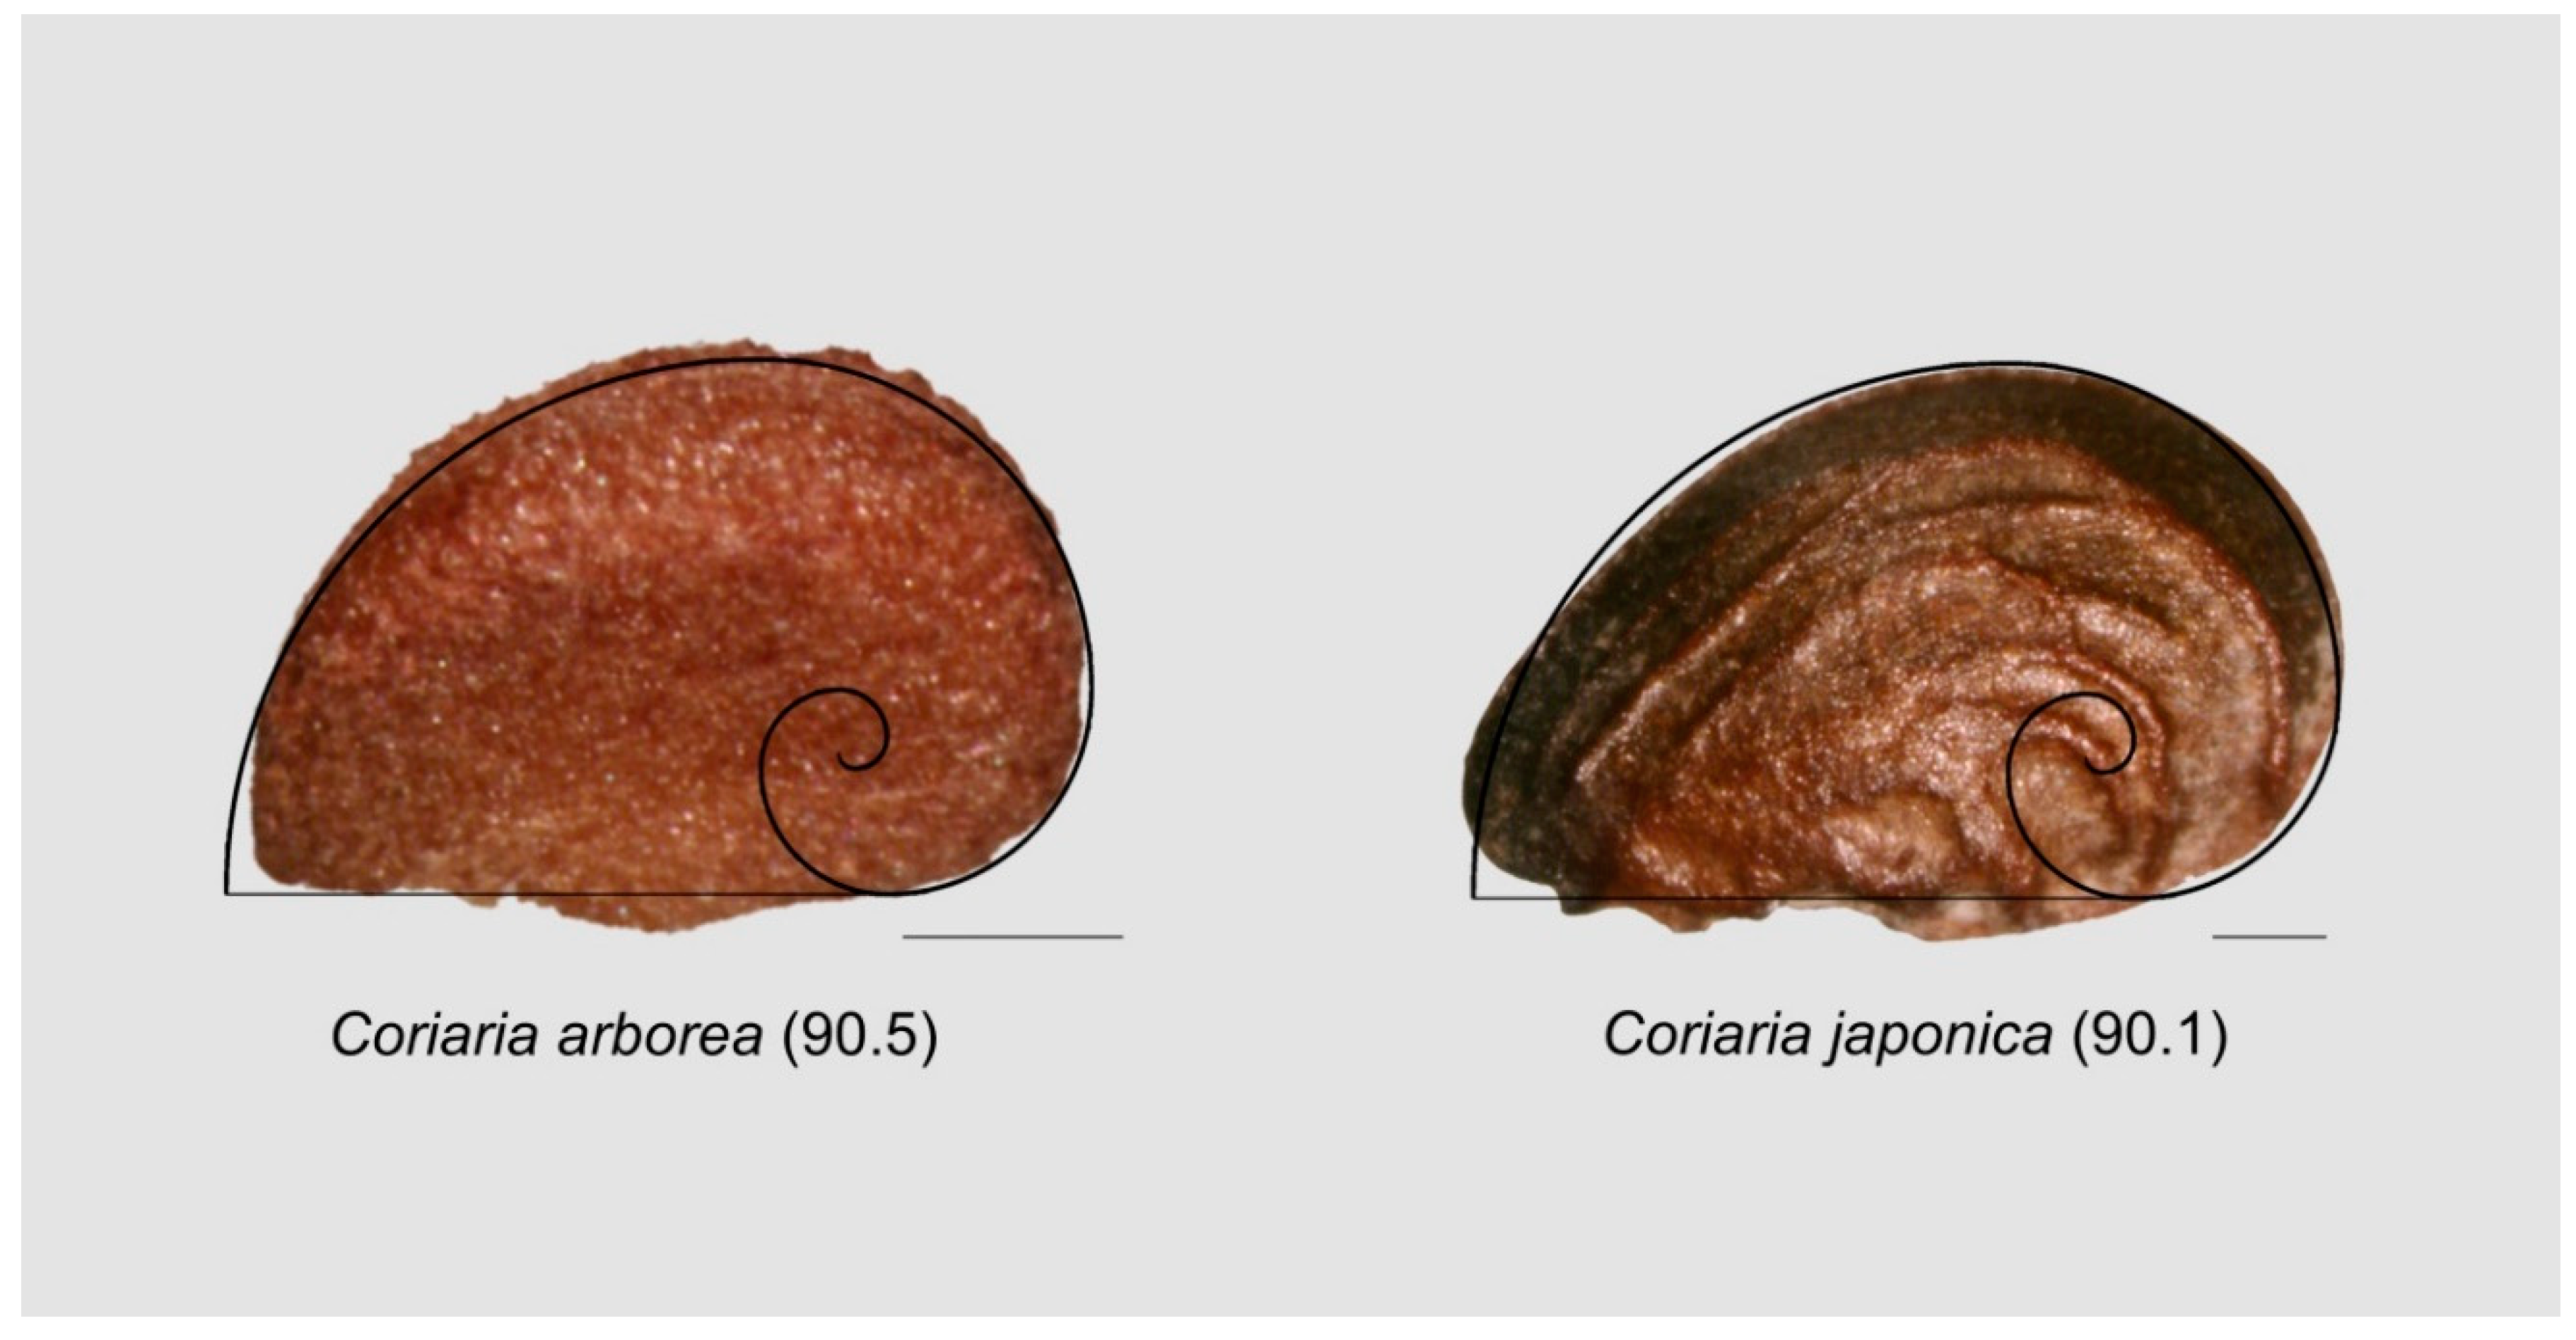
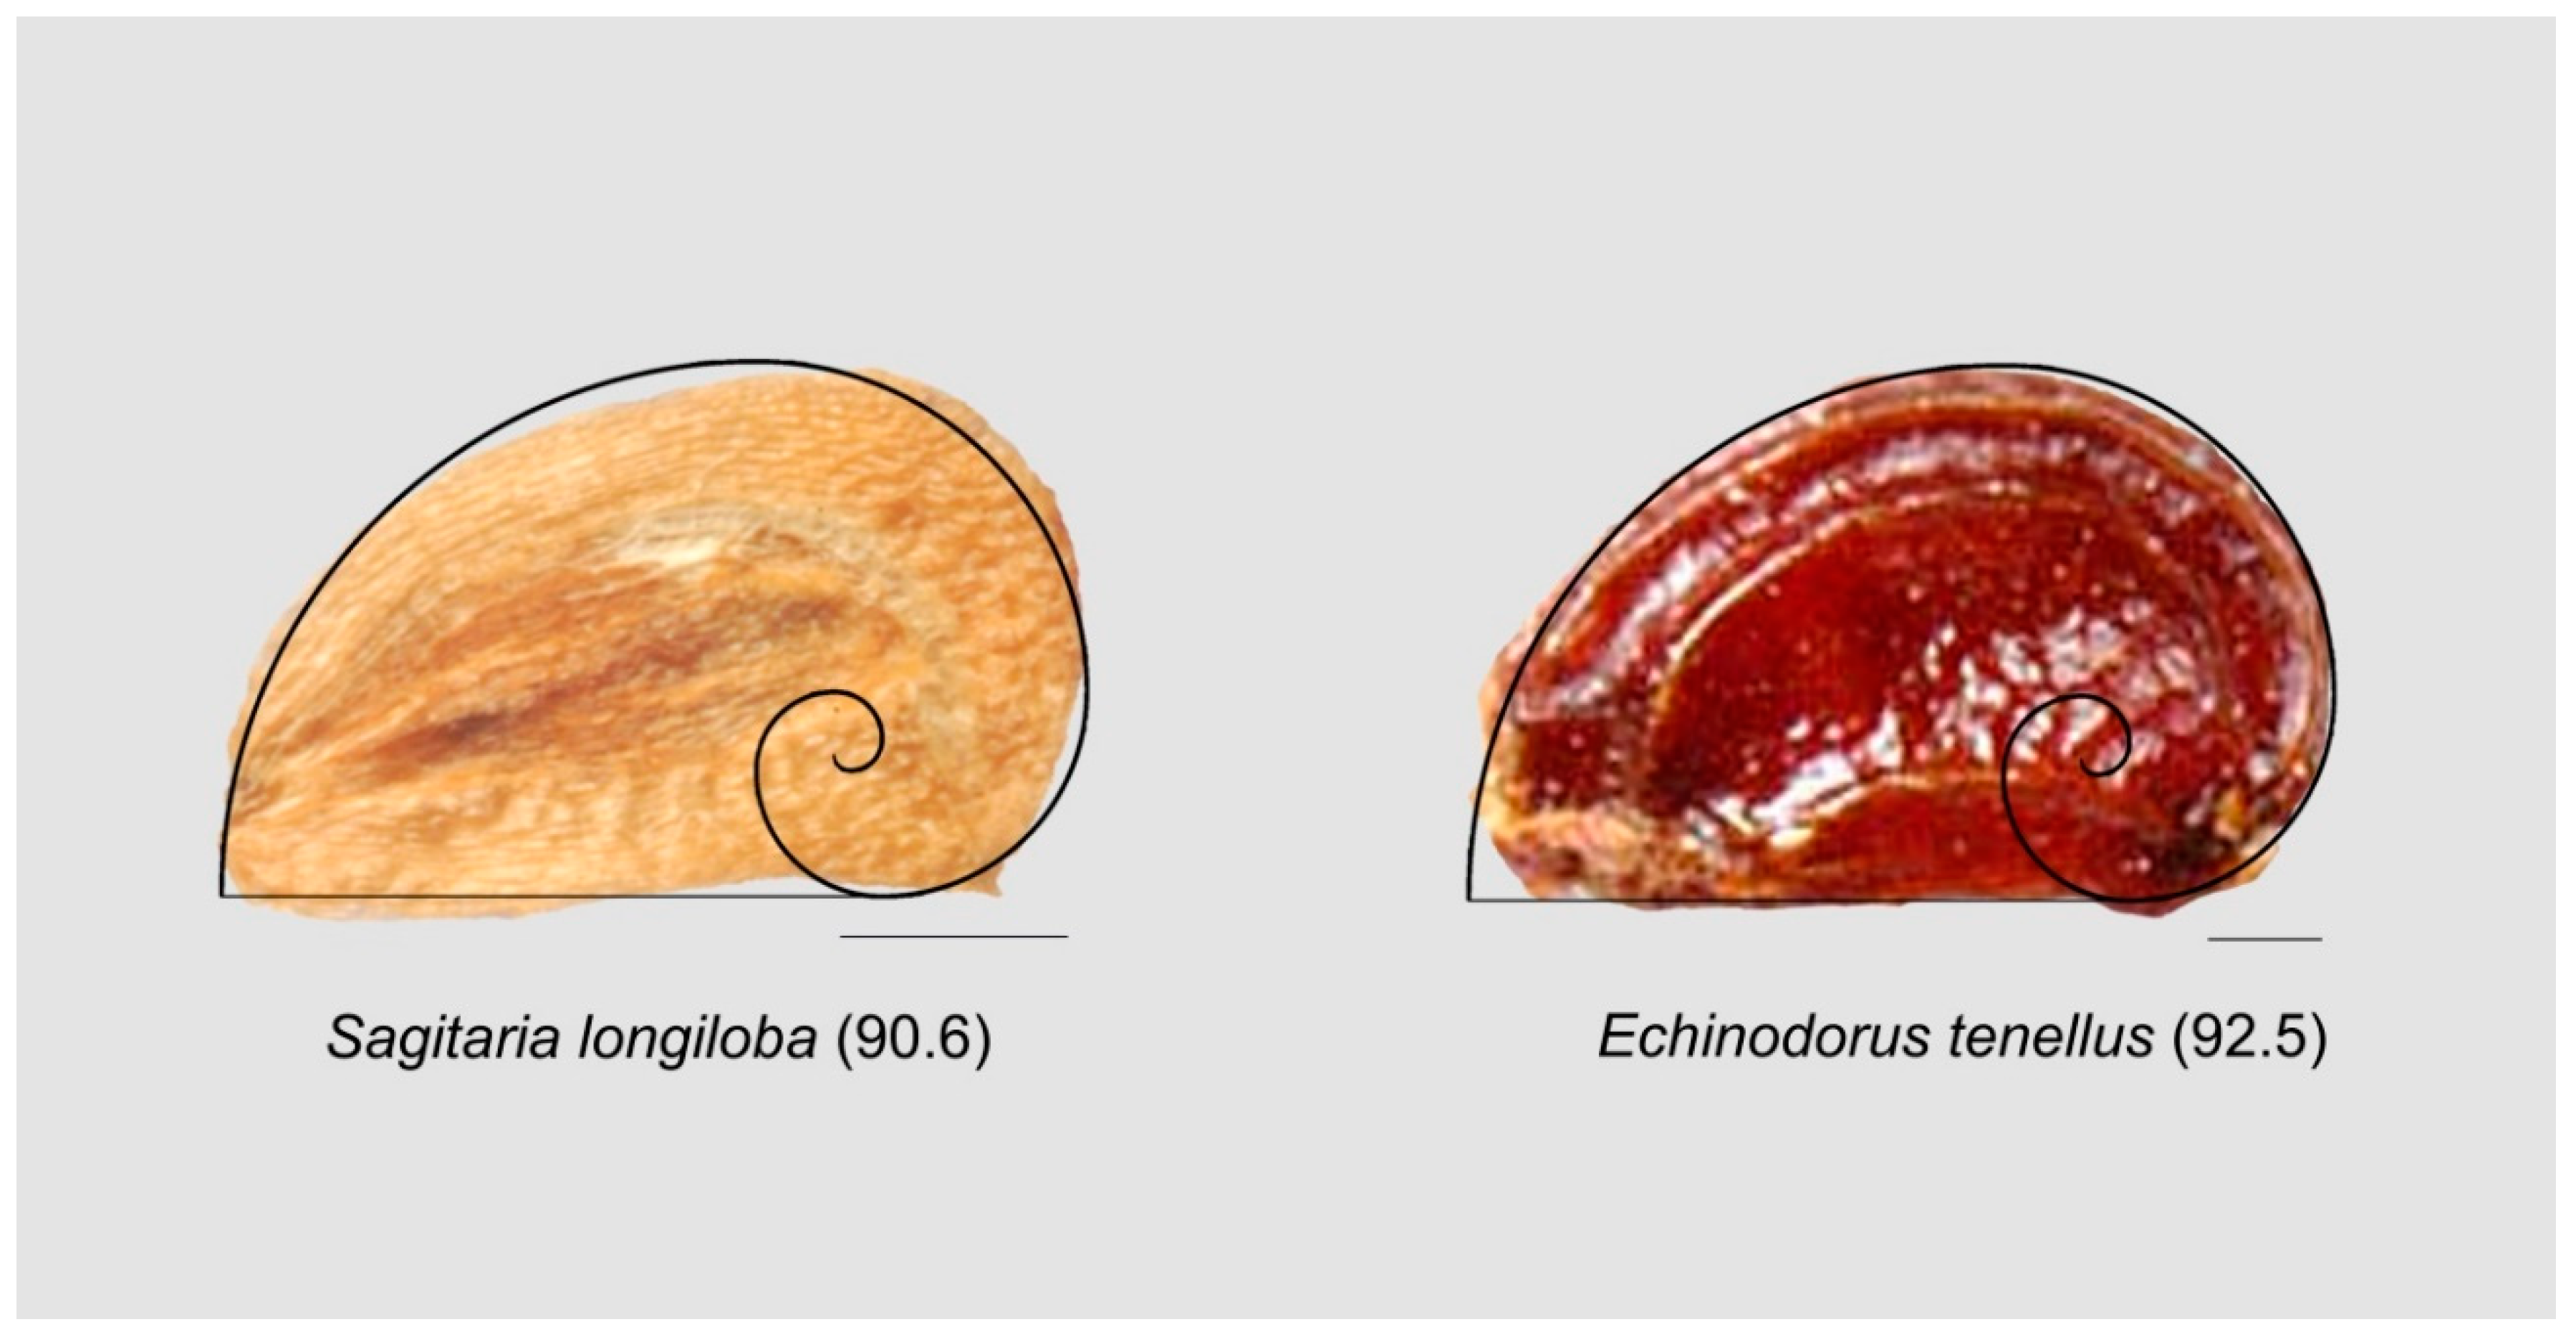
3.9.2. Seeds Resembling the Contour of Fibonacci’s Spiral
4. Discussion
5. Conclusions
Author Contributions
Funding
Acknowledgments
Conflicts of Interest
Appendix A. Origin of the Images Used in the Figures
References
- Minuto, L.; Fior, S.; Roccotiello, E.; Casazza, G. Seed morphology in Moehringia L. and its taxonomic significance in comparative studies within the Caryophyllaceae. Plant Syst. Evol. 2006. [Google Scholar] [CrossRef]
- Sukhorukov, A.P.; Mavrodiev, E.V.; Struwig, M.; Nilova, M.V.; Dzhalilova, K.K.; Balandin, S.A.; Erst, A.; Krinitsyna, A.A. One-Seeded Fruits in the Core Caryophyllales: Their Origin and Structural Diversity. PLoS ONE 2015, 10, e0117974. [Google Scholar] [CrossRef] [PubMed]
- Dadandi, M.Y.; Yildiz, K. Seed morphology of some Silene L. (Caryophyllaceae) species collected from Turkey. Turk. J. Bot. 2015, 39, 280–297. [Google Scholar] [CrossRef]
- Clifford, H.T.; Smith, W.K. Seed morphology and classification of Orchidaceae. Phytomorphology 1969, 19, 133–139. [Google Scholar]
- Sahai, K.; Kaur, H.; Pal, A. Macro-and micromorphological seed characteristics of some Cassia species and their taxonomic significance. Phytomorphology 1997, 47, 273–279. [Google Scholar]
- Benedict, J.C.; Smith, S.Y.; Collinson, M.E.; Škorničková, J.L.; Specht, C.D. Seed morphology and anatomy and its utility in recognizing subfamilies and tribes of Zingiberaceae. Am. J. Bot. 2015, 102, 1814–1841. [Google Scholar] [CrossRef] [Green Version]
- Harper, J.L.; Lovell, P.H.; Moore, K.G. The Shapes and Sizes of Seeds. Annu. Rev. Ecol. Syst. 1970, 1, 327–356. [Google Scholar] [CrossRef]
- Sonka, M.; Hlavac, V.; Boyle, R. Image Processing, Analysis, and Machine Vision; Thompson learning: Boston, Massachusetts, 2008. [Google Scholar]
- Rovner, I.; Gyulai, F. Computer-assisted morphometry: A new method for assessing and distinguishing morphological variation in wild and domestic seed populations. Econ. Bot. 2007, 61, 154–172. [Google Scholar] [CrossRef]
- Killiç, K.; Boyaci, I.H.; Koksel, H.; Kusmenoglu, I. A classification system for beans using computer vision system and artificial neural networks. J. Food Eng. 2007, 78, 897–904. [Google Scholar] [CrossRef]
- Venora, G.; Grillo, O.; Ravalli, C.; Cremonini, R. Tuscany beans landraces, on-line identification from seeds inspection by image analysis and Linear Discriminant Analysis. Agrochimica 2007, 51, 254–268. [Google Scholar]
- Pinna, M.S.; Grillo, O.; Mattana, E.; Cañadas, E.M.; Bacchetta, G. Inter-and intraspecific morphometric variability in Juniperus L. seeds (Cupressaceae). Syst. Biodivers. 2014, 12, 211–223. [Google Scholar] [CrossRef]
- Piras, F.; Grillo, O.; Venora, G.; Lovicu, G.; Campus, M.; Bacchetta, G. Effectiveness of a computer vision technique in the characterization of wild and farmed olives. Comput. Electron. Agric. 2016, 122, 86–93. [Google Scholar] [CrossRef]
- Cardioid—From Wolfram MathWorld. Available online: http://mathworld.wolfram.com/Cardioid.html (accessed on 19 August 2019).
- Thompson, D.W. On Growth and Form; Cambridge University Press: London, UK, 1917; p. 1116. [Google Scholar]
- Ellipse—From Wolfram MathWorld. Available online: http://mathworld.wolfram.com/Ellipse.html (accessed on 19 August 2019).
- Tyler, S.; Artois, T.; Schilling, S.; Hooge, M.; Bush, L.F. (Eds.) World List of turbellarian worms: Acoelomorpha, Catenulida, Rhabditophora. In Stylostomum Ellipse (Dalyell, 1853); Flanders Marine Institute: OOSTENDE, Belgium, 2006–2019; Available online: http://www.marinespecies.org/aphia.php?p=taxdetails&id=142822 (accessed on 19 August 2019).
- Oval—From Wolfram MathWorld. Available online: http://mathworld.wolfram.com/Oval.html (accessed on 19 August 2019).
- Wells, D. The Penguin Dictionary of Curious and Interesting Geometry; Penguin: London, UK, 1991; pp. 67–68. [Google Scholar]
- Livio, M. The Golden Ratio: The Story of Phi, the World’s Most Astonishing Number; Broadway Books: New York, NY, USA, 2002; pp. 116–120. [Google Scholar]
- Logarithmic Spiral—From Wolfram MathWorld. Available online: http://mathworld.wolfram.com/LogarithmicSpiral.html (accessed on 19 August 2019).
- Heart Curve—From Wolfram MathWorld. Available online: http://mathworld.wolfram.com/HeartCurve.html (accessed on 19 August 2019).
- Lens—From Wolfram MathWorld. Available online: http://mathworld.wolfram.com/Lens.html (accessed on 19 August 2019).
- About eucalypts. Available online: https://www.anbg.gov.au/cpbr/cd-keys/euclid3/euclidsample/html/learn.htm (accessed on 19 August 2019).
- Goriewa-Duba, K.; Duba, S.; Wachowska, U.; Wiwart, M. An Evaluation of Variation in the Morphometric Parameters of Grain of Six Triticum Species with the Use of Digital Image Analysis. Agronomy 2018, 8, 296. [Google Scholar] [CrossRef]
- Martín-Gómez, J.J.; Rewicz, A.; Goriewa-Duva, K.; Wiwart, M.; Tocino, Á.; Cervantes, E. Morphological description of wheat kernels based in geometric models. Agronomy 2019, 9, 399. [Google Scholar] [CrossRef]
- Hannachi, H.; Martín Gómez, J.J.; Saadaoui, E.; Cervantes, E. Stone diversity in wild and cultivated olive trees (Olea europaea L.). Dendrobiology 2017, 77, 19–32. [Google Scholar] [CrossRef]
- Saadaoui, E.; Martín-Gómez, J.J.; Bouazizi, R.; Romdhane, C.B.; Gira, M.; Abdelkabir, S.; Med, L.K.; Cervantes, E. Phenotypic variability and seed yield of Jatropha curcas L. introduced to Tunisia. Acta Bot. Mex. 2015, 110, 121–136. [Google Scholar] [CrossRef]
- Martín-Gómez, J.J.; Saadaoui, E.; Cervantes, E. Seed Shape of Castor Bean (Ricinus communis L.) Grown in Different Regions of Tunisia. J. Agric. Ecol. Res. Int. 2016, 8, 1–11. [Google Scholar]
- Saadaoui, E.; Martín-Gómez, J.J.; Ghazel, N.; Ben Yahia, K.; Tlili, N.; Cervantes, E. Genetic variation and seed yield in Tunisian castor bean (Ricinus communis, L.). Bot. Sci. 2017, 95, 271–281. [Google Scholar] [CrossRef]
- Léon-Kloosterziel, K.M.; Keijzer, C.K.; Koornneef, M. A Seed Shape Mutant of Arabidopsis That Is Affected in Integument Development. Plant Cell 1994, 6, 385–392. [Google Scholar] [CrossRef]
- Cervantes, E.; Martín-Gómez, J.J.; Ardanuy, R.; de Diego, J.G.; Tocino, Á. Modeling the Arabidopsis seed shape by a cardioid: Efficacy of the adjustment with a scale change with factor equal to the Golden Ratio and analysis of seed shape in ethylene mutants. J. Plant Physiol. 2010, 67, 408–410. [Google Scholar] [CrossRef]
- Cervantes, E.; Martín-Gómez, J.J.; Chan, P.K.; Gresshoff, P.M.; Tocino, Á. Seed shape in model legumes: Approximation by a cardioid reveals differences in ethylene insensitive mutants of Lotus japonicus and Medicago truncatula. J. Plant Physiol. 2012, 169, 1359–1365. [Google Scholar] [CrossRef]
- Cervantes, E.; Saadaoui, E.; Tocino, Á.; Martín Gómez, J.J. Seed shape quantification in the model legumes: Methods and applications. In The Model Legume Medicago Truncatula; de Bruijn, F., Ed.; Wiley-Blackwell: Hoboken, NJ, USA, 2019; in press. [Google Scholar]
- Saadaoui, E.; Martín-Gómez, J.J.; Cervantes, E. Seed morphology in Tunisian wild populations of Capparis spinosa L. Acta Biol. Crac. Ser. Bot. 2013, 55, 99–106. [Google Scholar] [CrossRef]
- Ben Yahia, K.; Martín-Gómez, J.J.; Saadaoui, E.; Cervantes, E. In preparation 2019.
- Cervantes, E.; Martín-Gómez, J.J.; Saadaoui, E. Updated Methods for Seed Shape Analysis. Scientifica (Cairo) 2016, 5691825. [Google Scholar] [CrossRef]
- Martín-Gómez, J.J.; Tocino, Á.; Ardanuy, R.; de Diego, J.G.; Cervantes, E. Dynamic analysis of Arabidopsis seed shape reveals differences in cellulose mutants. Acta Physiol. Plant. 2014, 36, 1585–1592. [Google Scholar] [CrossRef]
- Fici, S. Intraspecific variation and evolutionary trends in Capparis spinosa L. (Capparaceae). Plant Syst. Evol. 2001, 228, 123–141. [Google Scholar] [CrossRef]
- Higton, R.N.; Akeroyd, J.R. Variation in Capparis spinosa L. in Europe. Bot. J. Linn. Soc. 1991, 106, 104–112. [Google Scholar]
- Martín-Gómez, J.J.; Rewicz, A.; Cervantes, E. Seed Shape Variability in the Order Ranunculales. Horticulturae. In preparation 2019.
- Martín-Gómez, J.J.; Gutiérrez del Pozo, D.; Cervantes, E. Seed shape quantification in the Malvaceae reveals cardioid-shaped seeds predominantly in herbs. Bot. Lith. 2019, 25. in press. [Google Scholar]
- Martín-Gómez, J.J.; Gutiérrez del Pozo, D.; Cervantes, E. Seed shape quantification by a cardioid model in species of the order Caryophyllales: Relationship of seed shape with life style. In preparation 2019.
- Cervantes, E.; Martín-Gómez, J.J. Seed shape quantification in the order Cucurbitales. Mod. Phytomorphology 2018, 12, 1–13. [Google Scholar] [CrossRef]
- Cervantes, E.; Tocino, Á. Geometric analysis of Arabidopsis root apex reveals a new aspect of the ethylene signal transduction pathway in development. J. Plant Physiol. 2005, 162, 1038–1045. [Google Scholar] [CrossRef]
- Tocino, Á.; Cervantes, E. Curvature analysis reveals new functions for ethylene signaling pathway in shape determination of seed poles and root apices. Plant Signal. Behav. 2008, 3, 362–366. [Google Scholar] [CrossRef]
- Williamson, D.I. Caterpillars evolved from onychophorans by hybridogenesis. Proc. Natl. Acad. Sci. USA 2009. [Google Scholar] [CrossRef]
- Jiang, W.B.; Huang, H.Y.; Hu, Y.W.; Zhu, S.W.; Wang, Z.Y.; Lin, W.H. Brassinosteroid regulates seed size and shape in Arabidopsis. Plant Physiol. 2013, 162, 1965–1977. [Google Scholar] [CrossRef]
- Moore, C.R.; Gronwall, D.S.; Miller, N.D.; Spalding, E.P. Mapping Quantitative Trait Loci Affecting Arabidopsis thaliana Seed Morphology Features Extracted Computationally from Images. G3 (Bethesda) 2013, 3, 109–118. [Google Scholar] [CrossRef]
- He, X.; Feng, X.; Sun, D.; Liu, F.; Bao, Y.; He, Y. Rapid and Nondestructive Measurement of Rice Seed Vitality of Different Years Using Near-Infrared Hyperspectral Imaging. Molecules 2019, 24, 2227. [Google Scholar] [CrossRef]


| Plant Form | Number of Species | Maximum Value | Minimum Value | Standard Deviation | Mean Values of the Subsets Different for p = 0.05 | ||
|---|---|---|---|---|---|---|---|
| Trees | 20 | 87.6 | 50.0 | 10.0 | 70.1 (a) | ||
| Shrubs | 26 | 92.8 | 55.2 | 9.2 | 79.6 (b) | ||
| Herbs | 56 | 92.8 | 66.6 | 5.7 | 84.9 (c) | ||
© 2019 by the authors. Licensee MDPI, Basel, Switzerland. This article is an open access article distributed under the terms and conditions of the Creative Commons Attribution (CC BY) license (http://creativecommons.org/licenses/by/4.0/).
Share and Cite
Cervantes, E.; Martín Gómez, J.J. Seed Shape Description and Quantification by Comparison with Geometric Models. Horticulturae 2019, 5, 60. https://doi.org/10.3390/horticulturae5030060
Cervantes E, Martín Gómez JJ. Seed Shape Description and Quantification by Comparison with Geometric Models. Horticulturae. 2019; 5(3):60. https://doi.org/10.3390/horticulturae5030060
Chicago/Turabian StyleCervantes, Emilio, and José Javier Martín Gómez. 2019. "Seed Shape Description and Quantification by Comparison with Geometric Models" Horticulturae 5, no. 3: 60. https://doi.org/10.3390/horticulturae5030060