Precision Crop Load Management of Apple (Malus x domestica Borkh.) without Chemicals


Tasmanian Institute of Agriculture, University of Tasmania, Private Bag 98, Hobart, Tasmania 7001, Australia
Horticulturae 2019, 5(1), 3; https://doi.org/10.3390/horticulturae5010003
Submission received: 15 November 2018
/
Revised: 20 December 2018
/
Accepted: 21 December 2018
/
Published: 28 December 2018
(This article belongs to the Special Issue Food Safety Pertinent to Fresh Produce)
Abstract
:Fruit thinning is an important management practice in commercial apple production. The standard industry practice for crop load management in many countries is based on bloom and/or post-bloom chemical thinning (CT) followed up with hand thinning. However, the response to CT is unpredictable and there is an increasing awareness of the environmental impact of many chemicals. Hence there is a need to find alternate environmentally acceptable methods for managing crop load. Artificial bud extinction (ABE), a thinning method that imitates natural bud extinction by manually removing buds before bud break, has been suggested as a potential tool to replace chemical thinning, but there have been no studies comparing ABE and chemical thinning. Trials were established in Tasmania, Australia to determine how ABE technology compares with best practice CT programs in terms of yield, fruit quality, and cost of implementation. Results from these trials demonstrated consistent fruit set of both Gala and Fuji apple under ABE management compared with conventional management. Fruit weight was increased in all ABE treatments from 5% up to 38%. The four studies presented here have demonstrated that ABE is a feasible alternative to chemical thinning, improving reliability of crop load management with increased predictability of fruit size and yield. Trees are significantly thinned before flowering, controlling biennial bearing. In addition, bud position is optimised, fruit is well spaced and light distribution into the canopy is enhanced. In terms of costs, implementation of ABE is comparable to managing crop load with CT programs but has the advantage that crop load management costs reduce in subsequent years after the initial tree set-up. ABE is also suitable for use in organic apple orchards.
1. Introduction
Crop load management is undertaken in modern apple (Malus x domestica Borkh.) production to ensure regular bearing and good fruit quality, and according to Looney [1], fruit thinning is considered one of the most important orchard management practices. Thinning early in the season, before cell division is complete, enables maximisation of carbohydrate availability, optimising yield and fruit quality and reducing the risk of biennial bearing [2]. The standard industry practice for crop load management in many countries is based on chemical thinning (CT), with thinning chemicals applied during the bloom and post-bloom periods, followed up with hand thinning. However, the response to chemical thinning is very weather-dependent and there is considerable variation between cultivars in sensitivity to thinning chemicals [3].
This lack of predictability, combined with an increasing awareness of the environmental impact of many chemicals and the loss of registration of some chemicals, points to a need to find alternate environmentally acceptable methods for managing crop load [4]. Several different methods of crop manipulation have been described by Costa et al. [5], including mechanical thinning, flower thinning by hand, and bud extinction during the dormant winter period. Kirstein [6] also reports on the use of mechanical thinning as an alternative to chemical thinning.
Mechanical thinning has advantages in that the thinning result is immediately visible and environmental conditions do not affect efficacy [5]. However, there are also disadvantages such as damage to trees, lack of selectivity, and the risk of spreading disease [7]. For mechanical thinning to be effective, Kirstein [6] concluded that tree architecture needs to be suited to the particular machine and the orchard floor needs to be clean and level and recommended that, for future adoption of mechanical thinning, new orchards should be established with mechanisation in mind.
It was noted by Lauri et al. [8,9] that in cultivars expressing high natural spur extinction, defined as natural abortion of a proportion of growing buds, the remaining floral structures bear fruit and produce bourse shoots that flower the following season, known as the bourse-over-bourse phenomenon. Cultivars characterised by alternate bearing can be encouraged to produce more regularly by reducing the number of axillary shoots along the branches [10]. This is the basis of artificial bud extinction (ABE), which imitates natural bud extinction by reducing bud density through manual removal of floral buds during late winter or early spring. Buds are preferentially removed from the underside of limbs and shaded areas of the canopy. This allows for precision crop load management as it precisely defines not only how much fruit is set on each limb of the tree, but also where it is positioned.
Because the bulk of the thinning is completed prior to flowering, there is minimal resource wastage in ABE-managed trees. Hence, fruit size is greater than in conventionally-managed trees [11,12]. There is also a positive response in fruit set of individual buds with the proportion of buds failing to set fruit being reduced and an increased proportion of buds setting multiple fruit [11,13]. Higher yields have also been demonstrated on ABE trees over unmodified trees [14]. Lauri et al. [15] concluded that the elimination of shaded laterals and improved light distribution within the tree canopy that results from bud extinction not only improves fruit quality, but also promotes bud organogenesis, resulting in higher return bloom and reducing the risk of biennial bearing.
Several studies examining ABE have postulated that crop load management through ABE was preferable to conventional thinning programs [13,16,17,18], but these studies have used hand-thinning rather than CT for their conventional management practice, and do not provide evidence that ABE can outperform CT. As well as a lack of comparison of ABE with best practice CT programs, there is no information about the economics of ABE management. As growers are relatively comfortable with the use of CT as a crop load management tool, and ABE is a new tool requiring a paradigm shift, a comparison with CT is required. Several trials were established to determine how ABE technology compares with best practice CT programs in terms of yield, fruit quality, and cost.
2. Materials and Methods
Three small plot field trials (Trials 1–3) and one demonstration trial (Trial 4) were undertaken from 2013 to 2017 in commercial orchards in the Huon Valley in Tasmania to compare the effect of ABE and CT on yields and fruit quality. An economic analysis was undertaken on Trial 4. ‘Gala’ was selected in Trials 1, 2 and 4 as it is a cultivar that is widely grown in Australia. ‘Fuji’ was selected in Trial 3 as it has a strong propensity for biennial bearing.
All trees were on M26 rootstocks and trained to a central leader system. Row orientation was east/west and tree spacing was 4 m between rows and 1 m within the rows. Other trial details are shown in Table 1.
2.1. Treatment Design
Trial 1 was in a ‘Royal Gala’ trial block that was originally established in 2010 [19]. Crop management in this block was either by ABE or conventional in which trees received the same winter pruning as ABE trees but no bud extinction and crop load was manipulated by hand-thinning. To ascertain the effect of chemical thinning and time of hand-thinning on ABE trained trees, the following treatments were applied to both ABE and conventionally-managed trees within the orchard block with three different crop loads: [3, 4 or 5 fruit cm−2 limb cross-sectional area (LCSA)], three thinning methods [chemical thin (CT), hand-thin 5 weeks after full bloom (wAFB) (early HT), or hand-thin after final fruit drop at 9 wAFB (late HT)]. Treatment structure was a 2 (crop management regime) × 3 (crop load) × 3 (thinning method) factorial layout set out in a randomised complete block design.
Trials 2 & 3 consisted of four treatments in a 2 (crop management regime) × 2 (thinning method) factorial on two cultivars, ‘Alvina Gala’ and ‘Fiero Fuji’. Crop management was either conventional as described above or ABE, and the thinning method was either chemical thin or hand-thin only; trees receiving CT were also hand-thinned after final fruit drop to mimic normal commercial practice. Crop load was set at 5 buds cm−2 LCSA in 2015/16 and 6 buds in 2016/17 in the Gala and 6 buds/cm−2 LCSA in both years in the Fuji.
Trial 4 was established as a demonstration site to verify the results of Trials 1 to 3 on a larger semi-commercial scale and to determine comparative costs between ABE and CT. Treatments consisted of two pruning levels (standard ABE pruning vs. grower pruning (GP)) with or without CT. The grower pruning was included as most growers retain more limbs in a tree than is recommended for ABE management, and this allowed a comparison of the difference between ABE and the level of pruning that would be undertaken by most growers. An additional treatment was included to compare GP + CT as this was the standard crop load management in the orchard. A full row was dedicated to each treatment. Rows consisted of 67 trees and every 10th tree in each row was tagged and used for assessments.
The same assessments were undertaken for all trials, as discussed below.
2.2. Pruning and Tree Setup for ABE
All trees were pruned in late winter; unbalanced limbs were removed, limb numbers were reduced to a maximum of 6–7 limbs per metre of tree height, and spurs and small twiggy branches removed from the main trunk. Upright limbs were tied down to a more horizontal position.
On the ABE trees, floral bud density was set on the assumption of carrying one fruit per bud after hand thinning. Spur selection and spatial arrangement was achieved by removing weak, shaded and downward facing buds and shoots, leaving the strongest well positioned buds on each limb. Setting bud numbers before bud burst meant that trees commenced spring growth with reduced numbers of floral buds. Bud removal was performed in late winter immediately after pruning. Axillary floral buds were removed from one-year-old wood after bud burst. The number of flower clusters were recorded for each tree.
In Trial 4, the grower pruning regime had 9–10 limbs per m of tree height and the main trunk was left untouched. This meant that these treatments had more wood, allowing less light into trees.
2.3. Chemical Thinning
Trial 1—The program undertaken on trees tagged for chemical thinning consisted of the bloom thinner NAA (40 g L−1 naphthalene acetic acid, Gro-Chem, Melbourne, Australia) followed by the post-bloom thinner MaxCel® (20 g L−1 6-benzyladenine, Valent BioSciences, Epping, Australia). Table 2 details rates and application times.
Trials 2 & 3—The bloom thinners Ethrel® (720 g L−1 ethephon, Bayer CropScience Australia, Sydney, Australia) and NAA, and post-bloom thinner MaxCel® were applied as described in Table 2.
All sprays in Trials 1, 2 and 3 were applied using a backpack sprayer. Ethrel and NAA were applied to runoff and MaxCel applied to point of drip. The wetter Kendeen (Kendon Chemical & MNFG Co. Pty. Ltd., Melbourne, Australia) was included at the label rate for all applications.
Trial 4—The chemical thinning program consisted of bloom applications of Ethrel and NAA and a post-bloom tank mix application of MaxCel and carbaryl. All chemicals were applied using an airblast sprayer at 1000 L ha−1 water volume.
2.4. Flowering, Fruit Set and Hand-Thinning
In all trials, three representative mid-canopy limbs were tagged in each tree for assessment of flower number and fruit set. The number of blossom clusters was counted on each tagged limb just prior to bloom. Limb cross-sectional area was measured 2 cm from the base of each limb, and floral cluster density calculated for each limb; a tree mean was calculated using the individual limb densities.
Total fruit set was measured on all treatment trees prior to hand-thinning by recording the number of fruit within each cluster. Both ABE and conventional trees were hand-thinned to their final crop load after fruit set. The number of flower clusters that had set fruit were recorded on each tree. If fewer than the required number of buds bore fruit, two fruit per spur were retained on the strongest buds to achieve the required crop density per limb. In the conventionally-managed trees, fruit were thinned to one fruit per bud and then further reduced to achieve the required fruit densities. In Trial 1 the early HT treatments were thinned on 18 November (5 wAFB) and the late HT treatments on 17 December (9 wAFB) following the natural December drop. In Trials 2, 3 and 4, hand-thinning was completed on all treatments by 7 wAFB.
The flowering period in the first season for Trials 2 and 3 was extremely short, with flowering commencing on 2nd October and 100% bloom reached by 8th October; full bloom occurred on 6th October. In Trial 3, several of the ‘Fuji’ trees were experiencing an off-year in the first year of the study with low floral bud numbers.
2.5. Fruit Quality Assessments
All trees were harvested at normal commercial fruit maturity in March of the respective seasons and yield and fruit quality parameters measured. All fruits from each tree were counted and weighed and yield (kg per tree) calculated. After harvesting, a random sample of 50 fruit from each tree was selected. Fruit were returned to the laboratory and a subsample of 30 defect-free fruit taken for laboratory analysis of fruit quality and maturity. Fruit quality assessments undertaken were: weight, diameter (D), length (L), background colour (BGC), red blush coverage, flesh firmness, total soluble solids (TSS) content, malic acid (MA) content, starch pattern index (SPI) and percentage of dry matter content (DMC).
Fruit length and diameter were measured using Vernier calipers. Fruit flesh firmness was measured on pared flesh with an Effegi 11 mm penetrometer probe fitted to a Güss Model GS-20 Fruit Texture Analyser (Güss, Strand, South Africa). Juice expressed from the apples during firmness measurements was used to assess TSS concentration with an Atago PR-1 digital refractometer (Atago Co. Ltd., Tokyo, Japan). The starch-iodine test for apples was used to determine SPI; each fruit was cut transversely across the equator and the cut surface of the calyx end painted with a solution of 1 g potassium iodide plus 0.25 g iodine per 100 mL of water. The resulting pattern of starch hydrolysis was compared with the ENZA 6-point starch pattern chart (ENZA International Ltd., Hastings, New Zealand) and the pattern most similar to that of the fruit recorded. For DMC, two wedges were removed from opposite sides of each fruit, placed in labelled paper bags, weighed, oven dried at 60 °C to a constant weight, dry weight recorded and DMC calculated from dry weight/fresh weight. Juice pH and titratable acidity (TA) were determined using a Mettler Toledo G20 compact titrator. Malic acid content was calculated from the TA results.
Background colour in Trial 1 was estimated using ‘Royal Gala’ colour swatches (ENZA International Ltd., 10-point chart). In Trials 2, 3 and 4, background colour was assessed with a DA meter (Model FRM01, Sinteleia, Bologna, Italy) to estimate the amount of chlorophyll in the skin using the DA index (Difference of Absorbance between 670 and 720 nm).
Blush colour intensity was assessed using an 11-point colour chart (39CO2, ENZA New Zealand). Blush colour area (%) was measured for each fruit by estimating the percentage of fruit surface with a blush intensity of ≥5. To avoid bias, all assessments were performed by the same observer.
Return bloom was measured in the spring of the year following treatment using the same three tagged limbs in each plot. Limb basal cross-sectional area was measured, and the number of flower clusters recorded and used to calculate return bloom density.
2.6. Data Analysis
Data were subjected to analysis of variance using Genstat release 17.1 (VSN International Ltd., Hertfordshire, UK). Data are presented as mean values for each treatment and/or main effect. Significance was calculated at p = 0.05 and least significant difference (LSD) used for comparison of mean values in the tables and figures. Data was checked for normal distribution, and no data transformations were necessary.
2.7. Determining Costs for Comparison of ASE and Chemical Thinning
To compare the costs of the different regimes, the time taken to prune, complete the ABE setup (bud removal) and hand-thin were recorded and used to calculate the cost per hectare of each activity based on a labour cost of $25 per hour. The chemical thinning cost included the cost of chemicals, labour at $25 per hour and a machinery cost of $25 per hour for the tractor/sprayer.
3. Results
3.1. Fruit Set
In Trial 2, the ABE regime increased the percentage of flower clusters setting fruit in ‘Alvina Gala’ as well as increasing the number of fruit set per 100 blossom clusters compared with the conventional regime in both seasons (Table 3).
Chemical thinning had no effect on the number of flower clusters cm−2 LCSA (Table 3). Fruit set per 100 blossom clusters was reduced by chemical thinning in both years, but the percentage of flower clusters setting fruit was only reduced in the second season. There were no interactions between management regime and chemical thinning (results not presented).
The low number of flower clusters in the conventional regime in ‘Fiero Fuji’ (Trial 3) in 2015/16 demonstrates that these trees were in an off-year of a biennial bearing cycle (Table 4). The effect of treatments on fruit set in ‘Fiero Fuji’ (Table 4) was similar to the effect on ‘Alvina Gala’.
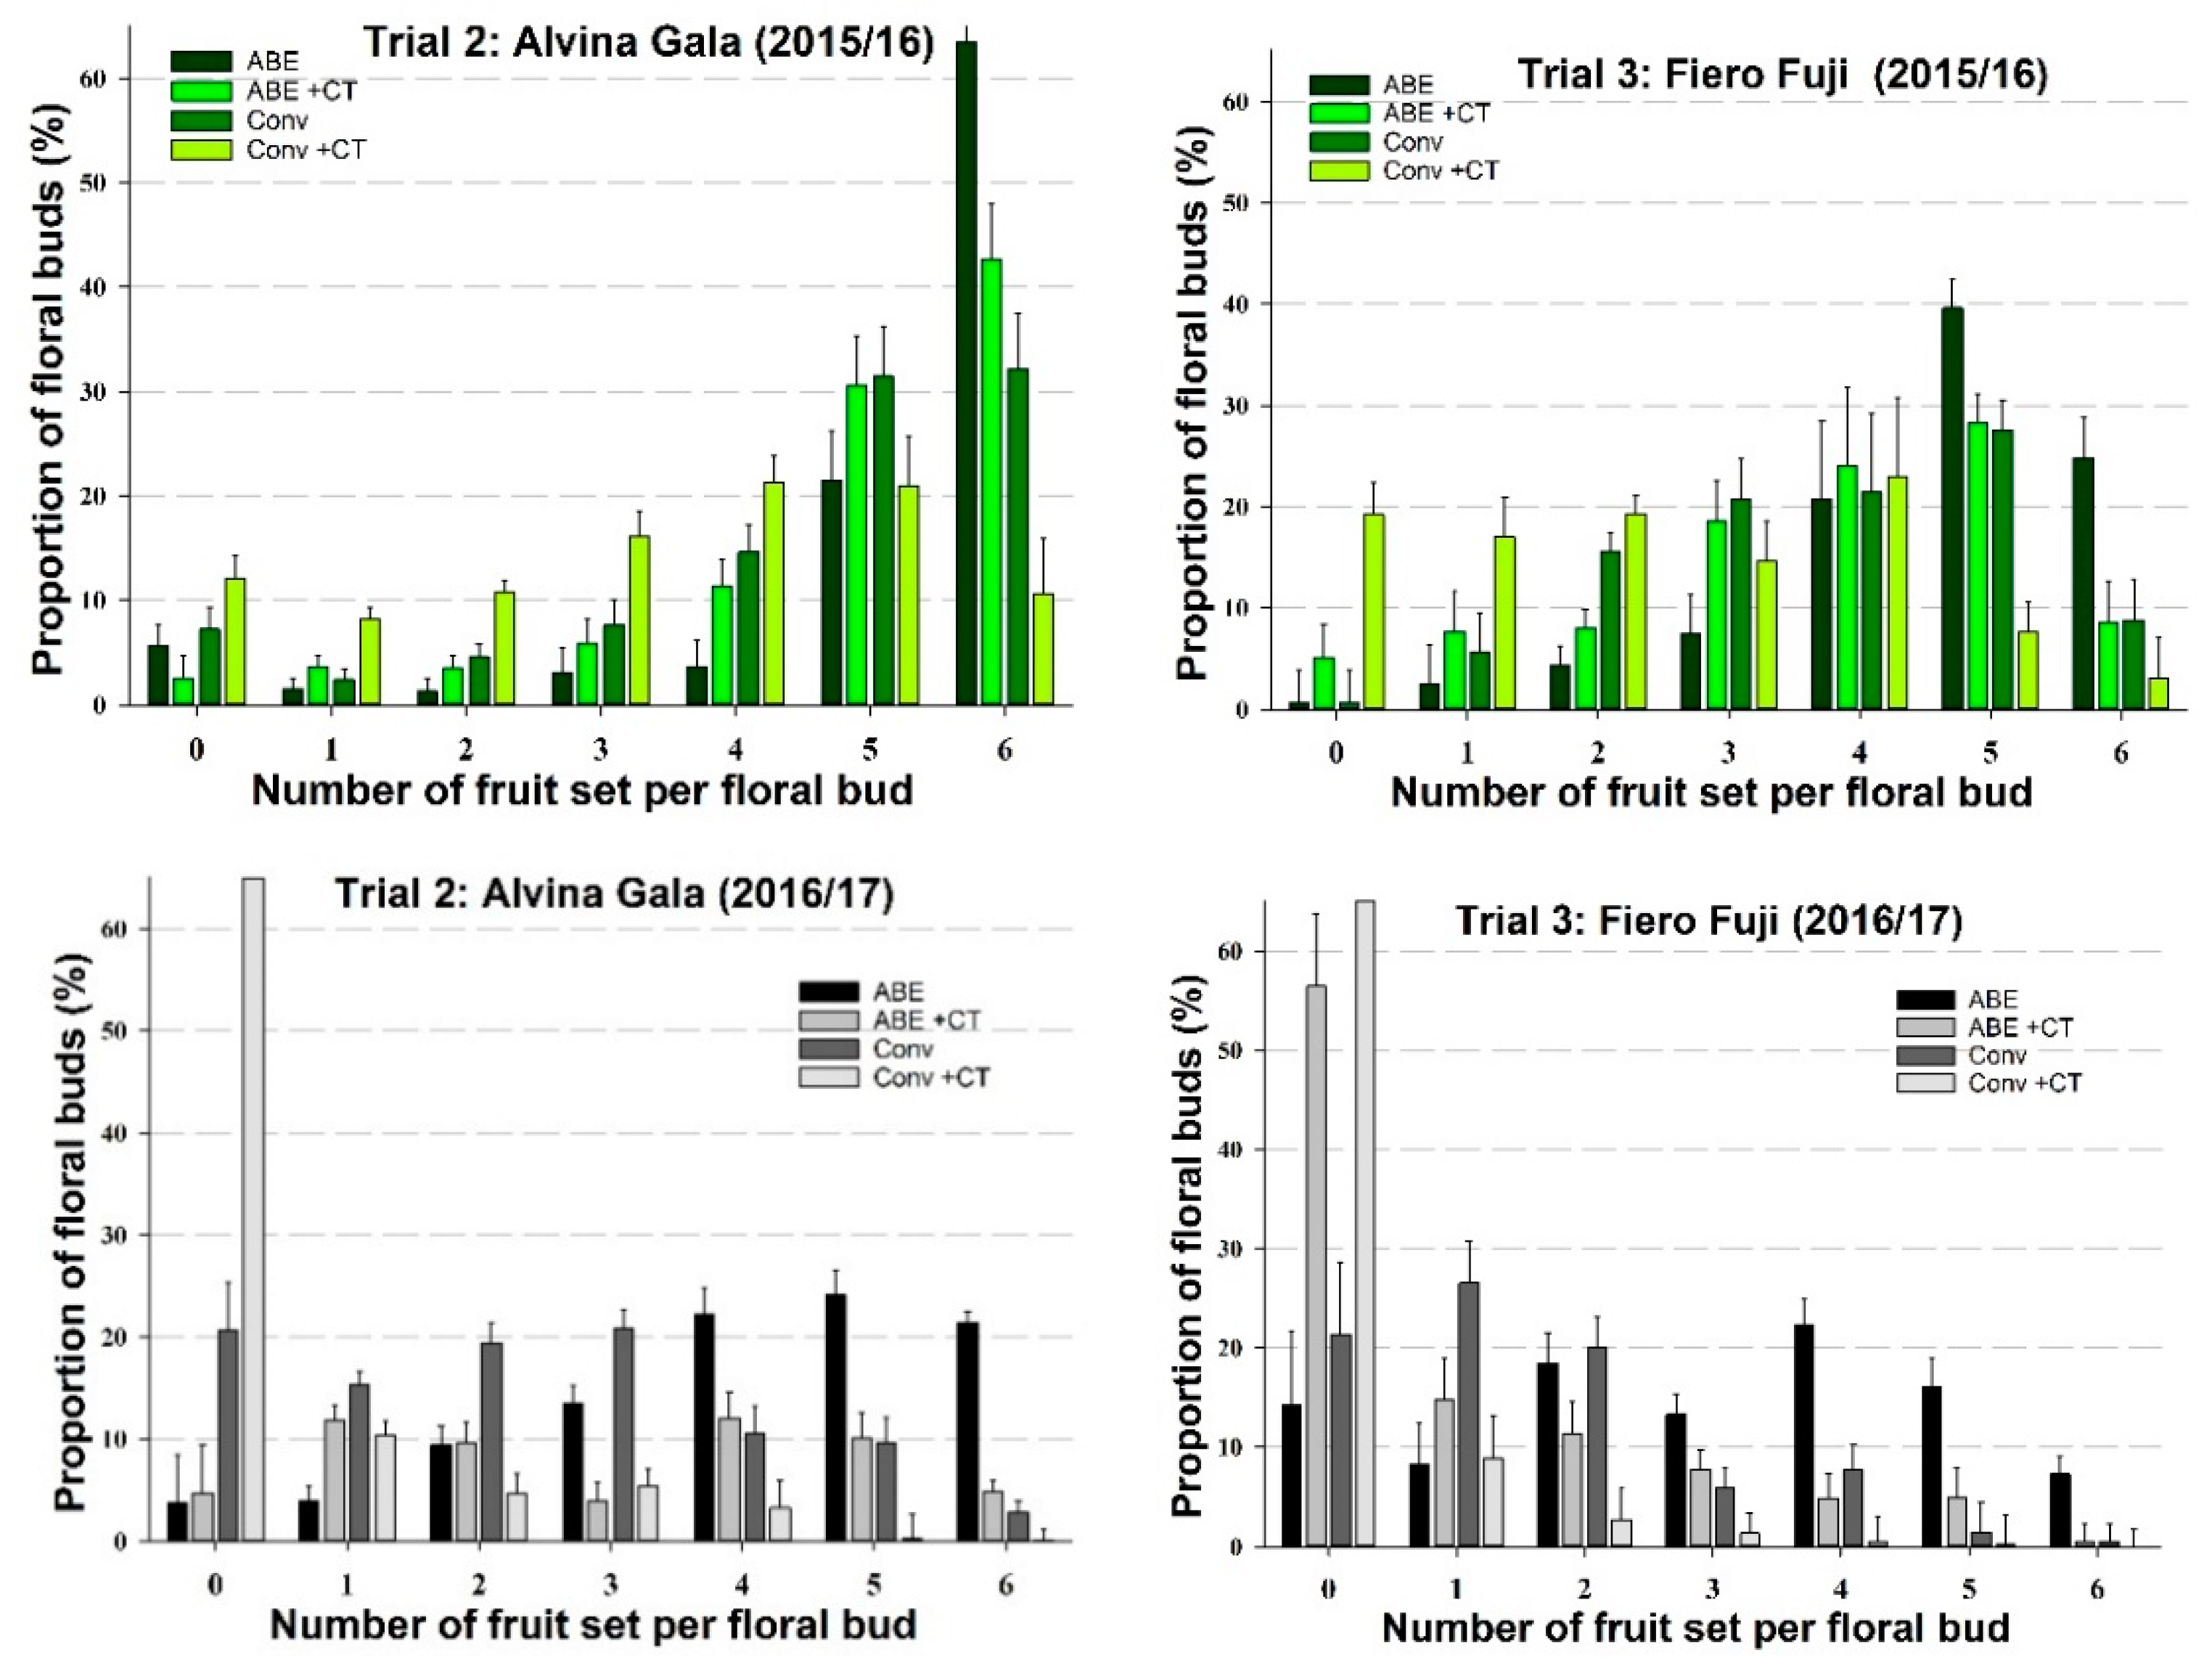
In both Trials 2 and 3, the number of fruit set per floral bud showed similar trends for both cultivars but there was variation between the two seasons (Figure 1). The length of the flowering period in season 1 was extremely short, only 6 days compared with a normal season where flowering extends over 4–6 weeks (results not presented). Generally, ABE treatments set the greatest number of multiple fruit per cluster. Chemical thinning increased the number of clusters with no fruit, with a greater effect in conventionally-managed than ABE-managed trees.
3.2. Yield and Return Bloom
In Trials 2 and 3 management regime and chemical thinning had no effect on yield of ‘Alvina Gala’ (Table 5) but yield of ‘Fiero Fuji’ was significantly increased in the ABE regime in both years, being 30% higher in year 1 and 100% higher than conventional management in year 2. Chemical thinning reduced yield in ‘Fiero Fuji’ in season 1. Return bloom was significantly higher in the conventional regime than for ABE for both cultivars, but there was still adequate return bloom in the ABE regime. There was a higher return bloom with chemical thinning in ‘Fiero Fuji’, but no difference between the plus/minus chemical thinning in ‘Alvina Gala’.
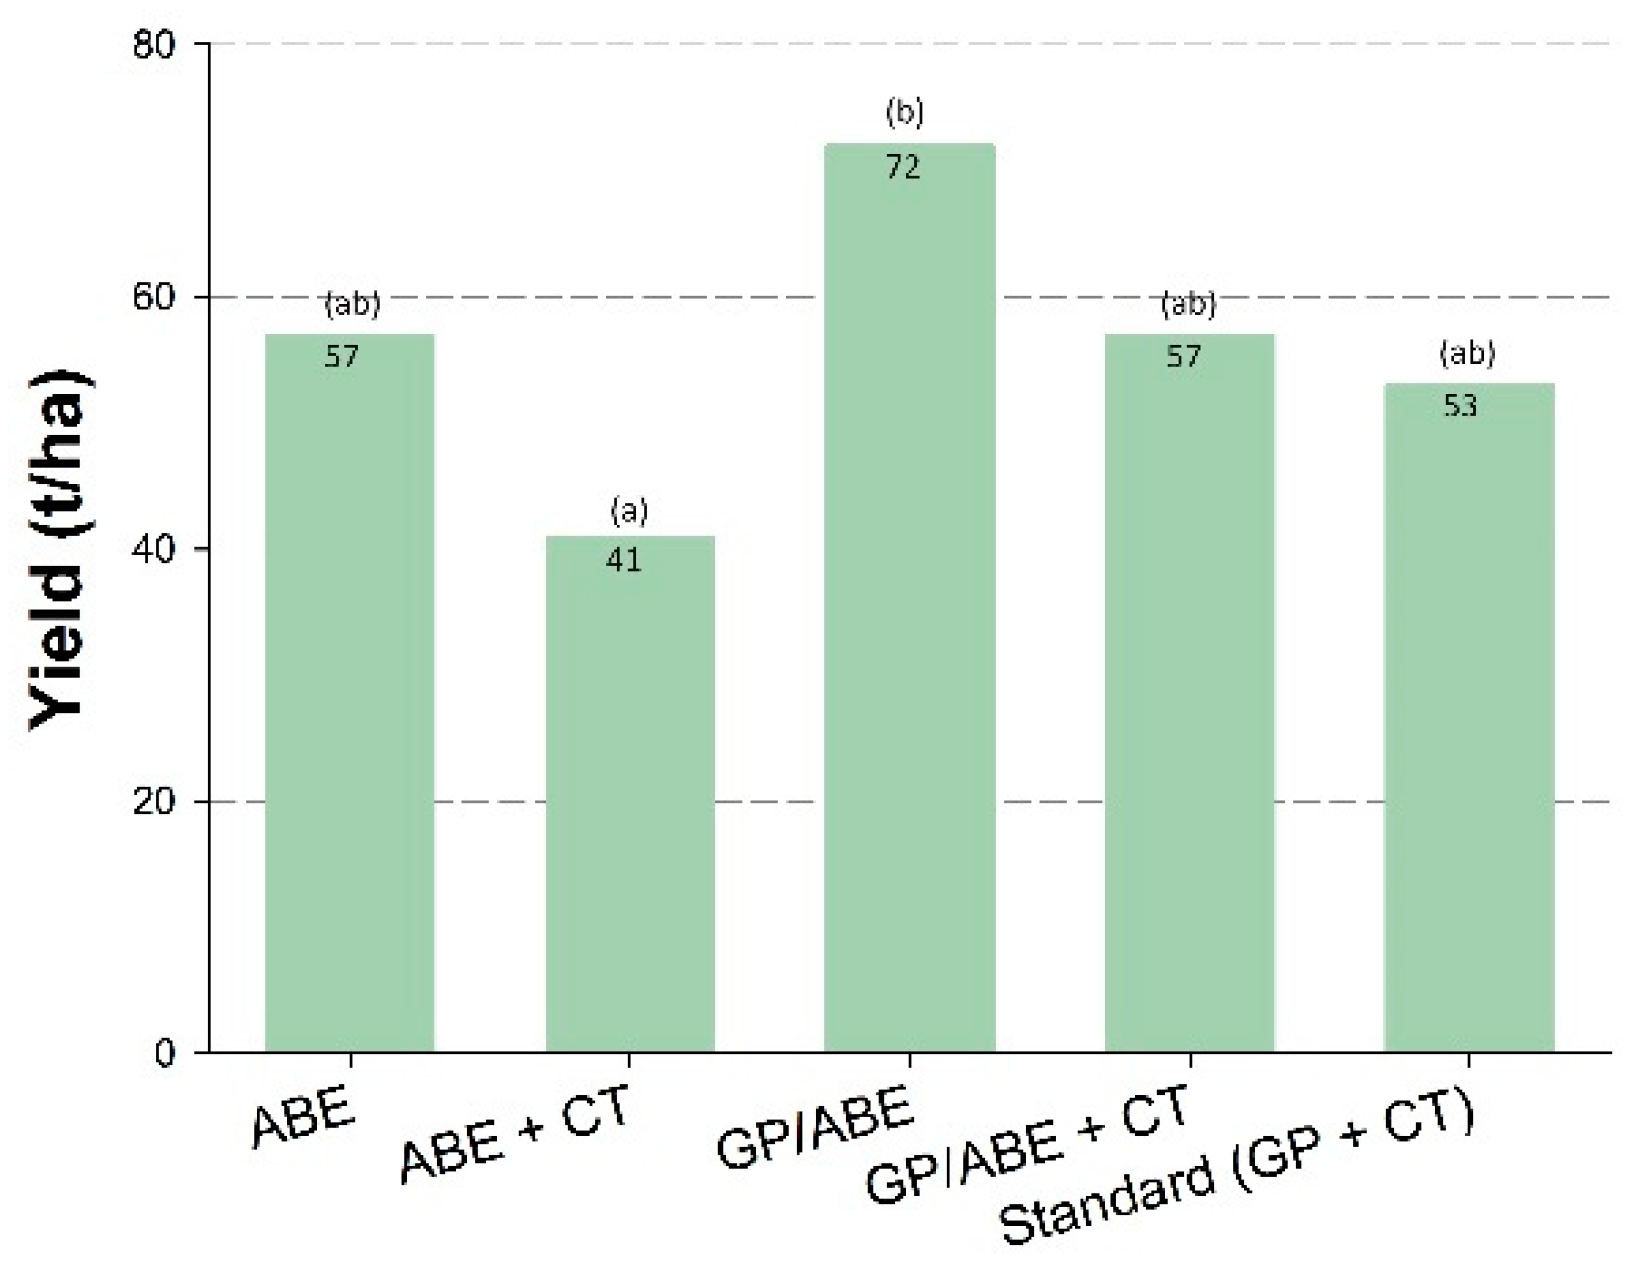
In the demonstration trial, yield ranged between 41 and 72 MT ha−1. The only two treatments to differ significantly in yield were the ABE + CT and the GP/ABE (Figure 2).
3.3. Fruit Quality
3.3.1. Trial 1
Final crop loads were close to set targets, although conventionally-managed trees carried 8% more fruit than ABE-managed trees (Table 6). There was no difference between the two regimes for fruit maturity measurements, skin background colour and SPI (Table 6). Skin background colour was greener at the highest crop load, but there was no significant difference in SPI between the three crop loads. Thinning method affected both maturity parameters, with late hand-thinning retarding skin background colour development and conversion of starch to sugar compared with the early hand- and chemical thinning treatments.
In relation to the fruit quality parameters assessed, management regime had no effect on blush intensity (Table 6), fruit firmness or TSS (Table 7), but malic acid content was higher in the ABE regime than the conventional. Fruit L/D ratio was higher in the conventional regime than ABE (Table 6), resulting in more elongated typy fruit.
Crop load significantly affected fruit quality, with fruit from the lowest crop load of 3 fruit cm−2 LCSA having the highest blush intensity (Table 6), firmness, TSS and malic acid content (Table 7). Total soluble solids and malic acid content were lowest at the higher crop load of 5 fruit cm−2 LCSA.
Thinning method had no effect on blush intensity or fruit shape (Table 6), or on DMC, firmness or malic acid content (Table 7). Both mean fruit weight and Fruit TSS were lower in the late hand-thinned treatments compared with the early hand-thinned and chemical thinned treatments (Table 7).
There were no interactions between the three main effects on any maturity or fruit quality parameters apart from fruit firmness, which showed an interaction at p = 0.01 between crop load and thinning method (results not presented).
3.3.2. Trials 2 and 3
In ‘Alvina Gala’, management regime impacted fruit maturity but there was no consistency across the two seasons; in the second season DA index showed less skin chlorophyll in conventional fruit than ABE fruit (Table 8); there was less starch conversion in conventional fruit in season 1 than ABE fruit. There was no effect on blush intensity. Chemical thinning had no effect on either DA index or blush intensity but did result in higher SPI in both seasons (Table 8).
In ‘Fiero Fuji’ management regime had no effect on DA index or red blush coverage (Table 9), but as in the “Alvina Gala’, SPI was higher in the ABE regime than the conventional. Chemical thinning had no effect on maturity indices or red blush coverage in either season.
There were no interactions between management regime and chemical thinning for either cultivar for skin background colour, starch pattern index or blush intensity (results not presented).
Fruit L/D ratio was higher, resulting in more typy fruit, in the ABE regime in ‘Alvina Gala’ in both seasons (Table 10) but had no effect on ‘Fiero Fuji’ (Table 11). Mean fruit weight was higher in the ABE regime in both seasons in ‘Alvina Gala’ (Table 10, Figure 3), but only season 1 in ‘Fiero Fuji’ (Table 11). There was no effect on fruit DMC in either cultivar.
Chemical thinning affected the fruit L/D ratio in ‘Alvina Gala’ reducing it in season 1 but increasing it in season 2. (Table 10). The mean fruit weight of ‘Alvina Gala’ was higher with chemical thinning in season 2, but there was no effect in season 1 (Table 10). Chemical thinning had no effect on the fruit L/D ratio of ‘Fiero Fuji’ but did increase fruit weight in season 2 and DMC in season 1 (Table 11).
Fruit firmness was lower in the ABE regime for both ‘Alvina Gala’ (Table 12) and ‘Fiero Fuji’ (Table 13) in season 1, but in season 2 only ‘Alvina Gala’ was affected by the regime. Regime had no effect on TSS (Table 12 and Table 13), and malic acid was only affected by regime in the ‘Alvina Gala’ in season 1.
Chemical thinning reduced fruit firmness of ‘Alvina Gala’ in season 1 (Table 12), but increased firmness of ‘Fiero Fuji’ (Table 13), with no effect on either cultivar in season 2. Total soluble solids content was not affected by chemical thinning in either cultivar. There was a significant decrease in malic acid content of ‘Alvina Gala’ in season 1, but no effect in season 2 or on ‘Fiero Fuji’.
There were no interactions between management regime and chemical thinning for any fruit quality parameters for either cultivar (results not presented).
3.3.3. Trial 4
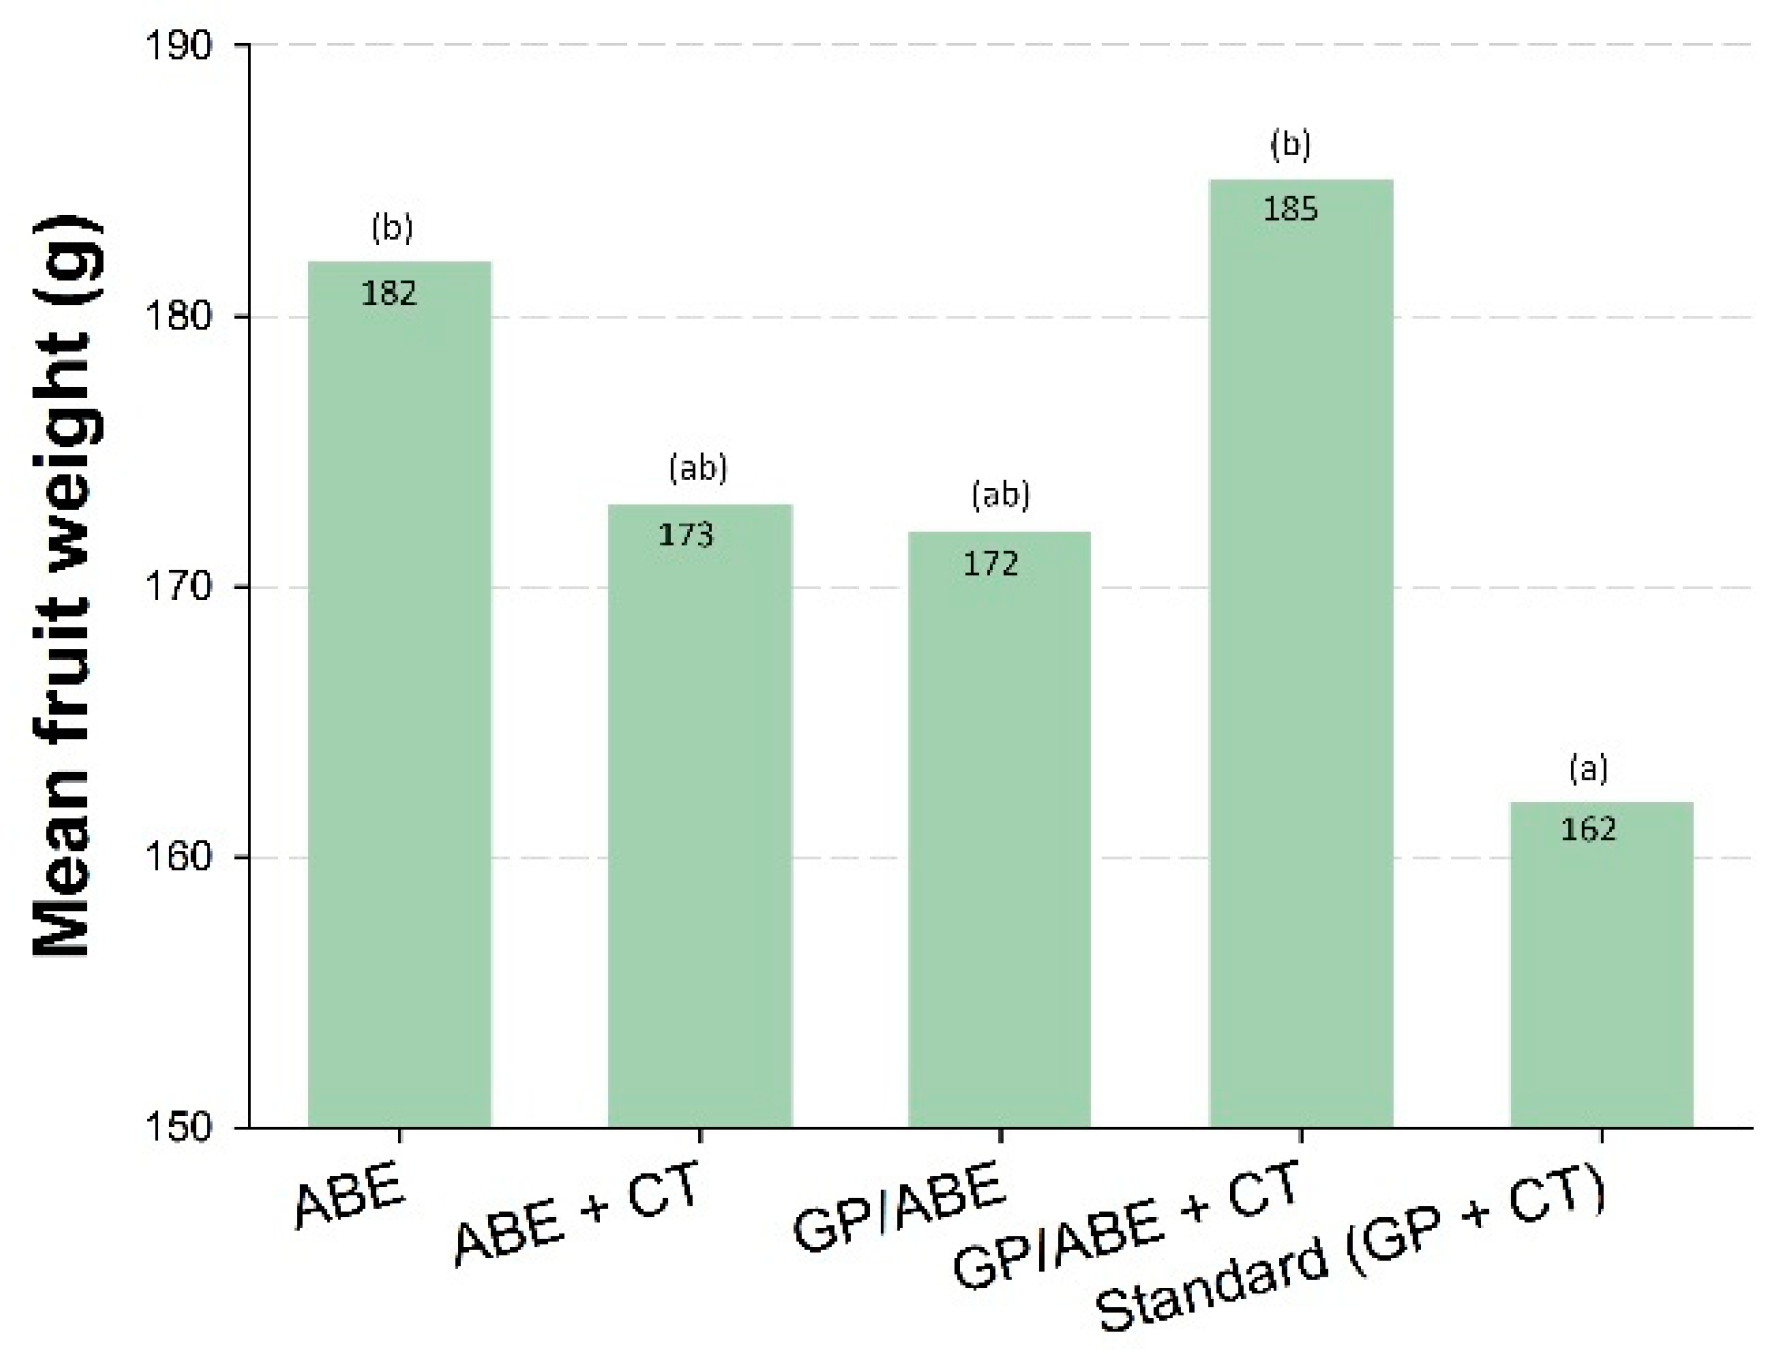
Mean fruit weight (Figure 4) was lower in the standard GP + CT treatment (162 g) than in the ABE (182 g) or GP/ABE + CT (185 g) treatments. There was no significant difference in fruit weight between any of the treatments managed by ABE.
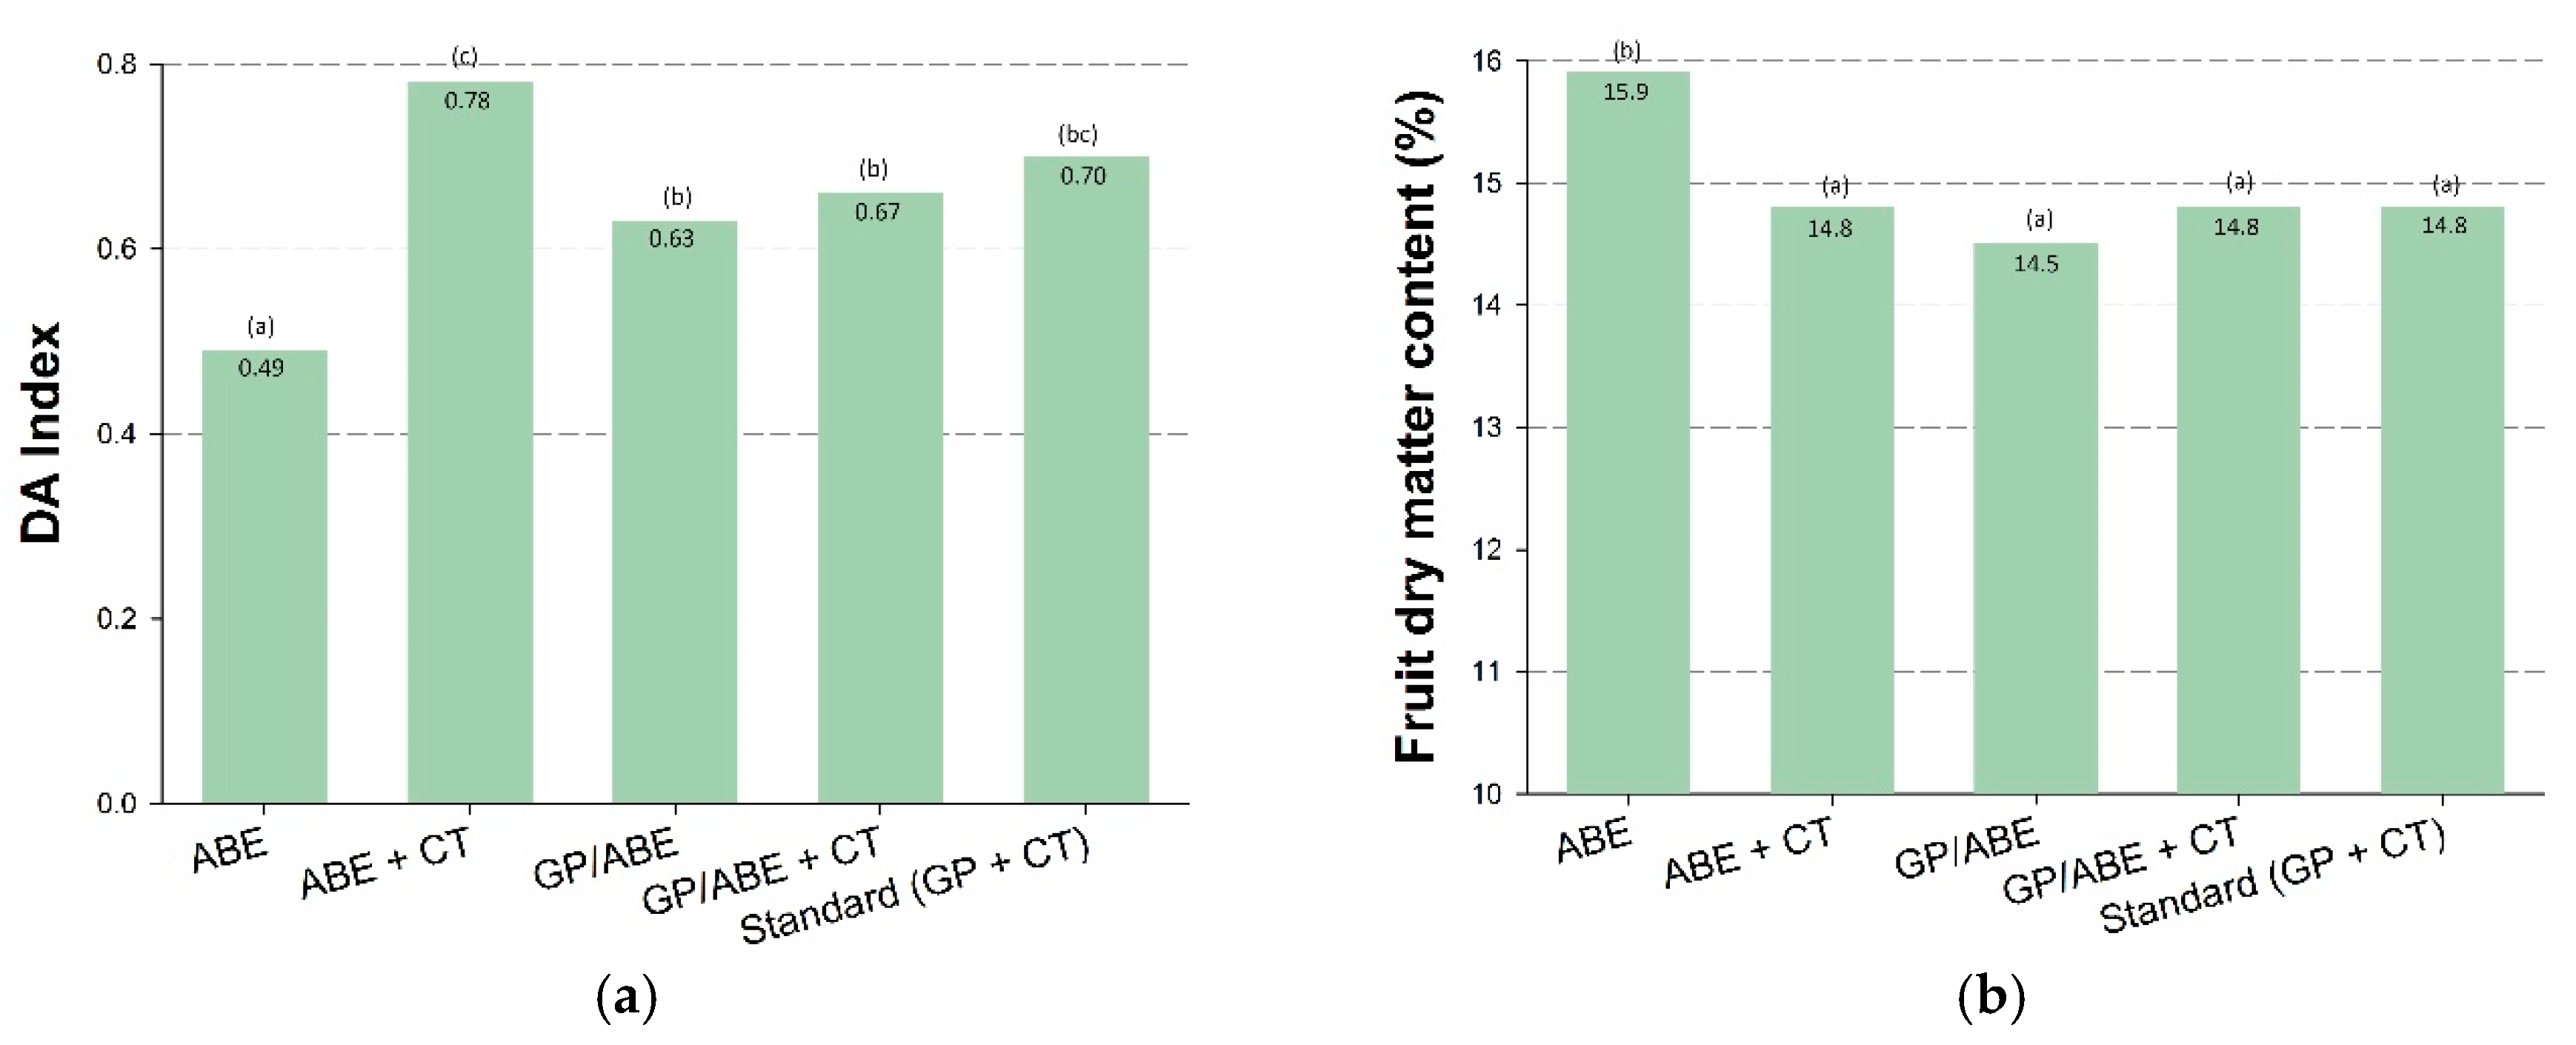
Fruit skin background colour, represented by DA Index (Figure 5a), was significantly yellower (more mature) in the ABE alone treatment (0.49) compared with all other treatments (0.63–0.78). Fruit in the ABE + CT treatment was greener than fruit from the two GP/ABE treatments. The ABE treatment had significantly higher DMC than all other treatments (15.9 cf 14.5–14.8) (Figure 5b).
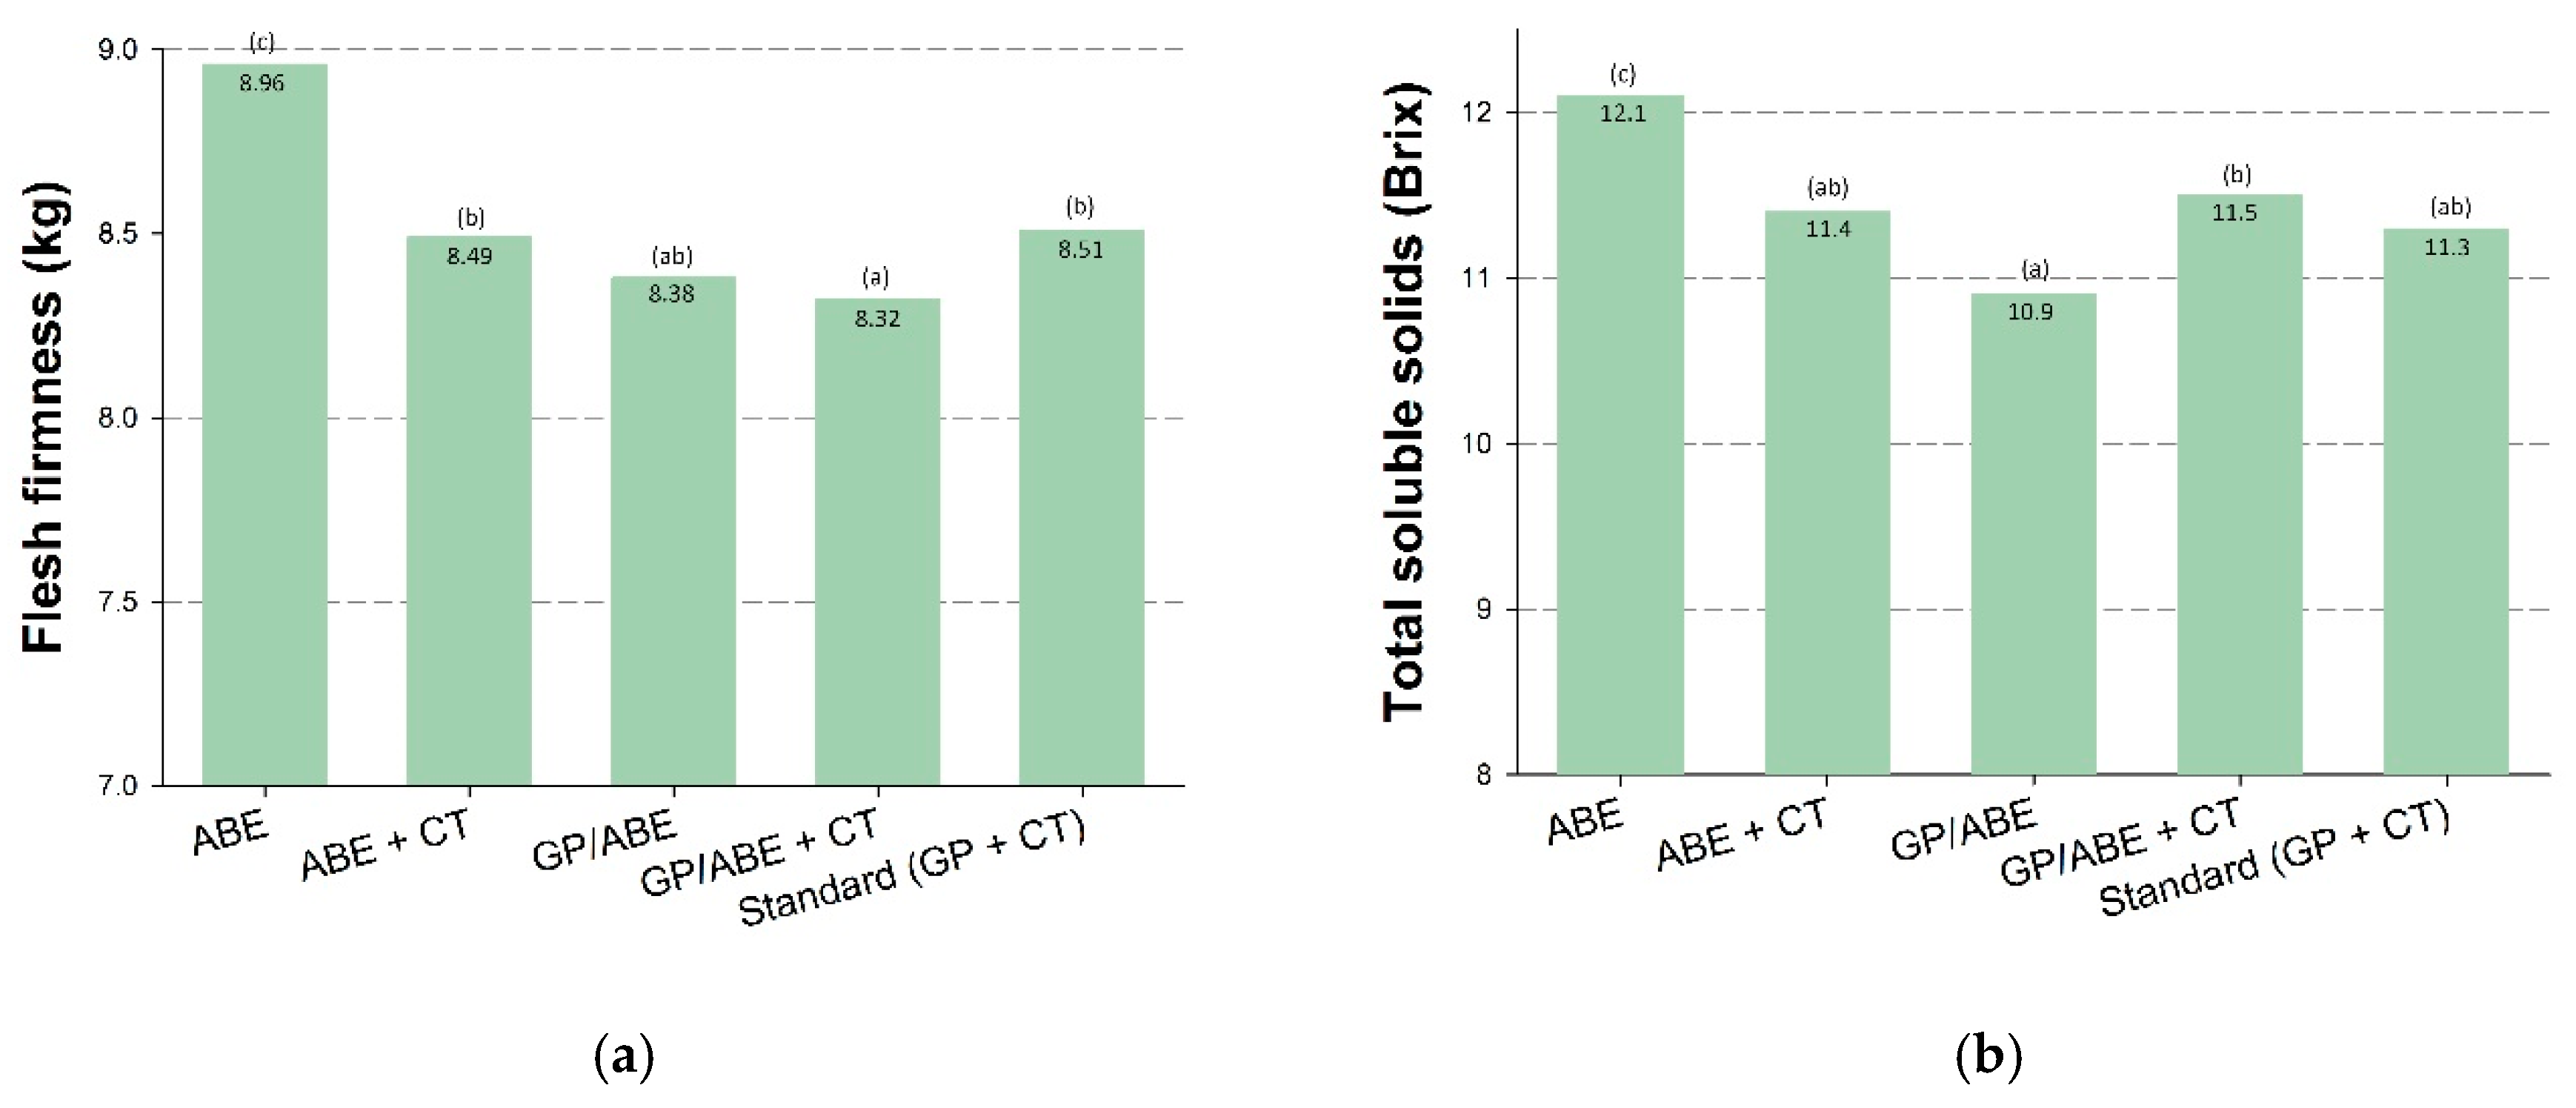
There were significant differences between treatments in fruit flesh firmness (Figure 6a), with ABE alone producing the firmest fruit (8.96 kg) compared with all other treatments (8.32–8.51 Kg). Fruit from the GP/ABE + CT treatment was less firm than the standard and ABE + CT treatments.
Total soluble solids content was higher in the ABE treatment compared with all other treatments (Figure 6b), and the GP + ABE treatment produced fruit with the lowest TSS.
3.4. Cost Comparison
The cost comparison presented in Table 14 demonstrates that the cost of implementing ABE in an established orchard is similar to the cost of a standard chemical thinning program, and after the initial year of tree set up (pruning and bud removal), the cost of crop load management declines, so that ABE management is cheaper than the standard practice of chemical thinning. The first year of ABE implementation is the most labour intensive. In subsequent years, pruning is reduced to the level that would normally be undertaken in the orchard and it is only necessary to remove buds on new wood, thus further reducing costs.
4. Discussion
The four studies presented here have demonstrated that ABE is a feasible alternative to chemical thinning for crop load management in apple, validating the suggestion by Tustin et al. [11] that ABE could replace chemical thinning as a crop load management tool. Additionally, there is good evidence to show that applying chemical thinners to ABE-managed trees can result in reduced fruit quality in terms of firmness, TSS and DMC, thus indicating that chemical thinning should not be used to complement ABE.
4.1. Flowering and Fruit Set
Replacing chemical thinning with ABE as a crop load management tool provides the benefit of predictable fruit set and crop load responses, removing the risk of biennial bearing that occurs with current crop load management practices. Tustin et al. [11] describe ABE as differing from conventional thinning by controlling the number of floral sites allowed to develop from the resumption of spring growth. This is clearly demonstrated in this study, with ABE trees carrying approximately 50% fewer floral clusters than conventional trees. The number of floral clusters in the ABE trees was also stable across seasons, with most floral buds setting fruit, compared with the conventionally-managed trees where there was variation, particularly in Fuji which is strongly biennial bearing.
In ABE-managed trees the number of floral buds (clusters) is reduced prior to bud burst, resulting in fewer buds than in conventionally-managed trees. However, the proportion of flower clusters setting fruit is higher than in conventional management, with a greater number of multiple fruit per cluster, consistent with the findings of Tustin et al. [11], Breen et al. [13,17] and Tabing et al. [18]. Under conventional tree management it is not uncommon to see 30–50% of spur and terminal buds failing to set fruit [13], while under ABE management the number of buds failing to set is often reduced to less than 5%. ABE produces precise fruit set outcomes despite differences in natural fruit set brought about by normal seasonal differences in environment [16].
Breen et al. [13] reported that as floral bud density is reduced, the proportion of buds failing to set fruit declines and the proportion setting multiple fruit increases. This was demonstrated in this study, even at crop loads as high as 6 fruit cm−2 LCSA. Flowering and early fruit development is a period of high demand for tree resources. Hence by removing competitive floral carbohydrate sinks before the spring growth period, there is less competition for resources, enabling an improved fruit set. This also carries through to flower initiation for the following season, as this occurs shortly after bloom. Bound et al. [20] reported a significant depletion in internal carbohydrate reserves in limbs of cherry trees thinned at 8 wAFB compared with trees in which buds were removed prior to bud-break. Costa et al. [5] states that thinning performed before fruit set may prevent biennial bearing, but fruit thinning performed after fruit set is normally ineffective. In the studies presented here, ABE-managed trees showed no signs of biennial bearing, with sufficient return boom to set a crop load of 6 fruit cm−2 limb cross-sectional area based on a single fruit per bud, unlike the conventional trees in which bud numbers varied between seasons. This supports the relationship between the extinction of growing points and regularity of bearing described by Lauri et al. [8,9,10].
4.2. Yield and Fruit Quality
The lack of difference in total yield observed between the ABE and conventional management regimes on the three Gala strains examined is similar to the findings of van Hooijdonk et al. [12] with ‘Scilate’, Breen et al. [16] with ‘Royal Gala’ and Tabing et al. [18] with ‘Kalei’. Tustin et al. [21] reported a reduction in yield of ‘Scifresh’ in the first year of ABE management. However, increases of 30% and 100% were observed in ‘Fiero Fuji’ yields over the two years of this study. As the ‘Fiero Fuji’ trial was situated 20 m from the ‘Alvina Gala’ trial and conducted in the same years, it is unlikely that other factors played a role in the different impact on yield between these two cultivars. Hence it is feasible that propensity for biennial bearing may influence impact of ABE on yield between cultivars.
In all four trials reported in this study, fruit weight was increased by 5–38% in all ABE-managed trees. The impact of ABE on fruit weight appears to be consistent across studies, with van Hooijdonk et al. [12], Breen et al. [12] and Tabing et al. [18] all reporting increased fruit weight under ABE management. This beneficial effect can be explained by a combination of increased carbohydrate production, as all buds are in a good light environment, and reduced wastage of resources, with carbohydrate partitioning to fruit that will remain on the tree rather than into non-setting flowers and/or fruit that is later removed. The increase in fruit weight, DMC, firmness and TSS observed with the reduction in crop load in Trial 1 confirms the effect of increased competition for carbohydrate resources on fruit quality. A similar effect of crop load on cherry fruit quality was also reported by Bound et al. [20]. The reduction in fruit weight and soluble solids content following late hand thinning also suggests that considerable carbohydrate resources are wasted in fruit that is later removed from the tree, confirming the importance of early thinning on fruit quality.
While the impact of ABE on fruit weight was consistent, reports on the impact of ABE on other fruit quality parameters are variable. In a two-year study, Tabing et al. [18] found no effects on firmness, soluble solids, dry matter content, blush intensity, background colour or starch pattern index on ‘Kalei’. Breen et al. [16] found no difference in starch pattern index or dry matter content of ‘Royal Gala’ in another two-year study. The effect of ABE on fruit soluble solids, dry matter content, starch pattern index and background colour in the studies reported here was either positive or there was no effect. However, a reduction in fruit firmness was observed in Trial 2, with no effect in Trials 1 and 3 and an increase in Trial 4. It is difficult to explain the reduction in firmness, but several authors have reported variable results on fruit firmness in multiple year studies, with firmness increased in some years, decreased in others or having no effect. It is possible that climatic differences between seasons play a role in these observed variations.
No effects were observed on fruit colour in this study. Tabing et al. [18] reported an increase in red blush coverage in the second year of a two-year study. A consistent increase of 6–7% in red blush coverage of ‘Scilate’ across all years of a three-year study was reported by van Hooijdonk et al. [12]. These authors also found increased fruit dry matter content in two of the three years and concluded that the improved canopy and fruit illumination brought about by the reduction in spur density contributed to the improvement in colour and dry matter content. Tabing et al. [18] also concluded that the increase in colour was due to improved bud positioning and increase in light within the canopy. This is a logical assumption as, under ABE management, buds in shaded areas and on the underside of limbs are removed, hence the buds remaining on the tree are in exposed positions and consequently receive more light. With more exposed fruit, it is not unreasonable to expect an increased risk of sunburn on fruit, although sunburn was not observed in this study, nor has it been reported in other studies. One reason may be that fruit that is exposed to direct sunlight throughout its development is less susceptible to sunburn [22].
Even though ABE does not always result in an improvement in all fruit quality parameters, it should be noted that it is well recognised that most of the chemicals used as chemical thinning agents can have detrimental impacts on fruit quality. For example, NAA can result in formation of pygmy fruit [23] and can cause fruit russet under humid conditions [3], ethephon can depress fruit size, counteracting the benefits gained by early thinning and it also tends to flatten fruit [3], and application of any chemical after a prolonged cool wet period can induce russet [2,3].
Although models have been developed for predicting the response of thinning chemicals [24], chemical thinning will never be able to provide consistent predictable crop loads. Additionally, apart from the negative impacts of chemicals on fruit quality, other downsides of chemical thinning include the short time frame for chemical application, unpredictable spring weather that makes application difficult and often ineffective and increasing environmental concerns with chemical use.
4.3. Cost Comparison
The cost comparison between ABE and chemical thinning for crop load management has confirmed that implementation of ABE is economically viable for orchardists. The cost in the year of implementation is comparable to conventional crop load management methods with chemical thinning agents, and in subsequent years, when the tree is already ‘set up’, ABE management is more economical than conventional chemical thinning.
Although the first year of ABE implementation is labour intensive as it involves some restructuring of trees, and removing buds across the entire tree, this is compensated by the reduction in hand-thinning. A major advantage of ABE is that spacing, position and number of clusters are already determined during the bud removal process, so all that is required when hand-thinning is to break up bunches and remove fruit with defects. Thus, the hand-thinning process is considerably simplified when compared with conventional management. Even though most flower clusters set fruit, ABE-managed trees do not express late fruitlet drop as there is no excessive fruit set that invokes fruit shedding, so hand thinning to adjust crop load to the final desired numbers can be started within three to four weeks of flowering rather than waiting for fruit drop 8–10 weeks after bloom.
While it should be noted that the cost of implementation of ABE will vary depending on the age and structure of the trees, there is the added benefit that trees can be set up with a pre-determined crop load with reasonable accuracy, thus enabling improved management of fruit size. In addition, bud position is optimised in ABE, fruit is well spaced and light distribution into the canopy is enhanced.
5. Conclusions
The four studies presented here have demonstrated that ABE is a feasible alternative to chemical thinning, improving reliability of crop load management with a move away from chemical use and increasing predictability of fruit size and yield. As bud numbers are set in late winter, trees are significantly thinned before flowering, controlling biennial bearing. In addition, bud position is optimised, fruit is well spaced and light distribution into the canopy is enhanced, ensuring optimal fruit development with respect to size and quality. As well as eliminating the need for chemical thinning, ABE has the added advantages that it is not weather dependent and removes the risk of negative impacts that chemical thinners can have on fruit size, shape and skin finish. ABE is also suitable for use in organic production systems.
In terms of costs, implementation of ABE is comparable to managing crop load through chemical thinning programs, but has the advantage that costs reduce in subsequent years after the initial tree set-up.
Author Contributions
S.A.B. conceived, planned, established and maintained the experiments; collected, analysed and interpreted the data; and wrote, edited and revised the manuscript.
Funding
This study was conducted as part of the Australian apple and pear industry Productivity Irrigation Pests and Soils (PIPS) flagship program, and funded by Hort Innovation using the apple and pear levy and voluntary contributions from the Institute of New Zealand Plant & Food Research Limited, and matched funds from the Australian Government.
Acknowledgments
Thanks are due to Scott Price from Rookwood Orchards for provision of trees and donation of fruit. Technical assistance was provided by Steve Paterson. The New Zealand team of Stuart Tustin, Ben van Hooijdonk and Ken Breen provided assistance with setting up the original ABE studies. The manuscript was reviewed prior to submission by Robert Nissen and Dugald Close.
Conflicts of Interest
The author declares no conflict of interest.
References
- Looney, N.E. Chemical thinning of apple: Some new strategies and important refinements to old procedures. Acta Hortic. 1986, 179, 597–604. [Google Scholar] [CrossRef]
- Jones, K.M.; Bound, S.A.; Miller, P. Crop Regulation of Pome Fruit in Australia; Tasmanian Institute of Research: Hobart, Australia, 1998; ISBN 1-86295-027-X. [Google Scholar]
- Bound, S.A. Managing crop load. In Crop Management and Postharvest Handling of Horticultural Products; Dris, R., Niskanen, R., Jain, M., Eds.; Oxford & IBH Publishing Co., Pvt. Ltd.: New Delhi, India, 2001; Volume 1, pp. 89–109. ISBN 1-57808-140-8. [Google Scholar]
- Bound, S.A. Alternate thinning chemicals for apples. Acta Hortic. 2010, 884, 229–236. [Google Scholar] [CrossRef]
- Costa, G.D.; Blanke, M.M.; Widmer, A. Principles of thinning in fruit tree crops—Needs and novelties. Acta Hortic. 2013, 998, 17–26. [Google Scholar] [CrossRef]
- Kirstein, D.L. Mechanical Thinning of Pome Fruit. Master’s Thesis, Faculty of AgriSciences, Stellenbosch University, Stellenbosch, South Africa, 2015. [Google Scholar]
- Greene, D.S.; Costa, G.D. Fruit thinning in pome- and stone-fruit: State of the art. Acta Hortic. 2013, 998, 93–102. [Google Scholar] [CrossRef]
- Lauri, P.-E.; Terouanne, E.; Lespinasse, J.-M.; Regnard, J.-L.; Kelner, J.-J. Genotypic differences in the axillary bud growth and fruiting pattern of apple fruiting branches over several years—An approach to regulation of fruit bearing. Sci. Hortic. 1995, 64, 265–281. [Google Scholar] [CrossRef]
- Lauri, P.-E.; Terouanne, E.; Lespinasse, J.-M. Relationship between the early development of apple fruiting branches and the regularity of bearing—An approach to the strategies of various cultivars. J. Hortic. Sci. 1997, 72, 519–530. [Google Scholar] [CrossRef]
- Lauri, P.-E.; Lespinasse, J.-M. Apple tree training in France: Current concepts and practical implications. Fruits 1999, 54, 441–449. [Google Scholar]
- Tustin, D.S.; Dayatilake, G.A.; Breen, K.C.; Oliver, M.J. Fruit Set Responses to Changes in Floral Bud Load—A New Concept for Crop Load Regulation. Acta Hortic. 2012, 932, 195–202. [Google Scholar] [CrossRef]
- Van Hooijdonk, B.M.; Tustin, D.S.; Oliver, M.J.; Breen, K.C.; Dayatilake, G.A. Modification of Canopy Architecture Imposed by Artificial Spur Extinction Promotes Reliable Cropping Behaviour and Enhances Fruit Quality of ‘Scilate’ Apple Trees. Acta Hortic. 2014, 1058, 63–70. [Google Scholar] [CrossRef]
- Breen, K.C.; van Hooijdonk, B.M.; Tustin, D.S.; Wilkie, J.D.; Bound, S.A.; Middleton, S.G.; Close, D.C. Changes in fruit set of ‘Gala’ apple in response to environment and artificial spur extinction. Acta Hortic. 2014, 1058, 77–83. [Google Scholar] [CrossRef]
- Breen, K.C.; Palmer, J.W.; Tustin, D.S.; Close, D.C. Artificial spur extinction alters light interception by ‘Royal Gala’ apple trees. Acta Hortic. 2016, 1130, 265–271. [Google Scholar] [CrossRef]
- Lauri, P.-E.; Crete, X.; Ferre, G. Centrifugal training in apple—Appraisal of a two-year experiment on cv. ‘Galaxy’ in southeast France. Acta Hortic. 2007, 732, 391–396. [Google Scholar] [CrossRef]
- Breen, K.C.; Tustin, D.S.; Palmer, J.W.; Close, D.C. Method of manipulating floral bud density affects fruit set responses in apple. Sci. Hortic. 2015, 197, 244–253. [Google Scholar] [CrossRef]
- Breen, K.C.; Tustin, D.S.; Palmer, J.W.; Hedderley, D.I.; Close, D.C. Effects of environment and floral intensity on fruit set behaviour and annual flowering in apple. Sci. Hortic. 2016, 210, 258–267. [Google Scholar] [CrossRef]
- Tabing, O.; Parkes, H.A.; Middleton, S.G.; Tustin, D.S.; Breen, K.C.; van Hooijdonk, B.M. Artificial spur extinction to regulate crop load and fruit quality of ‘Kalei’ apple. Acta Hortic. 2016, 1130, 273–277. [Google Scholar] [CrossRef]
- Breen, K.; van Hooijdonk, B.; Tustin, S.; Bound, S.; Wilkie, J.; Parkes, H.; Tabling, O.; Middleton, S.; Close, D. Chapter 2: Tree structure, crop load management and orchard light interception. In Interim Final Report AP09031 PIPS Productivity Program; Horticulture Australia Limited: Sydney, Australia, 2015. [Google Scholar]
- Bound, S.A.; Close, D.C.; Quentin, A.G.; Measham, P.F.; Whiting, M.D. Crop load and time of thinning interact to affect fruit quality in sweet cherry. J. Agric. Sci. 2013, 5, 216–230. [Google Scholar] [CrossRef]
- Tustin, D.S.; Dayatilake, G.A.; Henriod, R.E.; Breen, K.C.; Oliver, M. Changes in fruiting behaviour and vegetative development of ‘Scifresh’ apple in response to artificial spur extinction using centrifugal training. Acta Hortic. 2011, 903, 603–610. [Google Scholar] [CrossRef]
- Lolicata, S. Sun Protection for Fruit: A Practical Manual for Preventing Sunburn on Fruit; Department of Primary Industries, Farm Services Victoria Division: Melbourne, Australia, 2011. [Google Scholar]
- Bound, S.A.; Jones, K.M.; Koen, T.B.; Oakford, M.J.; Barret, M.H.; Stone, N.E. The interaction of Cytolin and NAA on cropping red Delicious. J. Hortic. Sci. 1991, 66, 559–567. [Google Scholar] [CrossRef]
- Robinson, T.L.; Lakso, A.N. Predicting chemical thinner response with a carbohydrate model. Acta Hortic. 2008, 903, 743–750. [Google Scholar] [CrossRef]
Figure 1.
Proportion of floral buds setting 0, 1, 2, 3, 4, 5 and 6 fruit per bud in response to treatments in Trials 2 and 3. ABE = artificial bud extinction; CT = chemical thinning; Conv = conventional management regime. Error bars are standard error of the mean.
Figure 1.
Proportion of floral buds setting 0, 1, 2, 3, 4, 5 and 6 fruit per bud in response to treatments in Trials 2 and 3. ABE = artificial bud extinction; CT = chemical thinning; Conv = conventional management regime. Error bars are standard error of the mean.

Figure 2.
Effect of artificial bud extinction (ABE), pruning level and chemical thinning (CT) on yield of ‘Buckeye Gala’ in Trial 4. Letters above bars indicate mean separation. GP = grower pruned.
Figure 2.
Effect of artificial bud extinction (ABE), pruning level and chemical thinning (CT) on yield of ‘Buckeye Gala’ in Trial 4. Letters above bars indicate mean separation. GP = grower pruned.

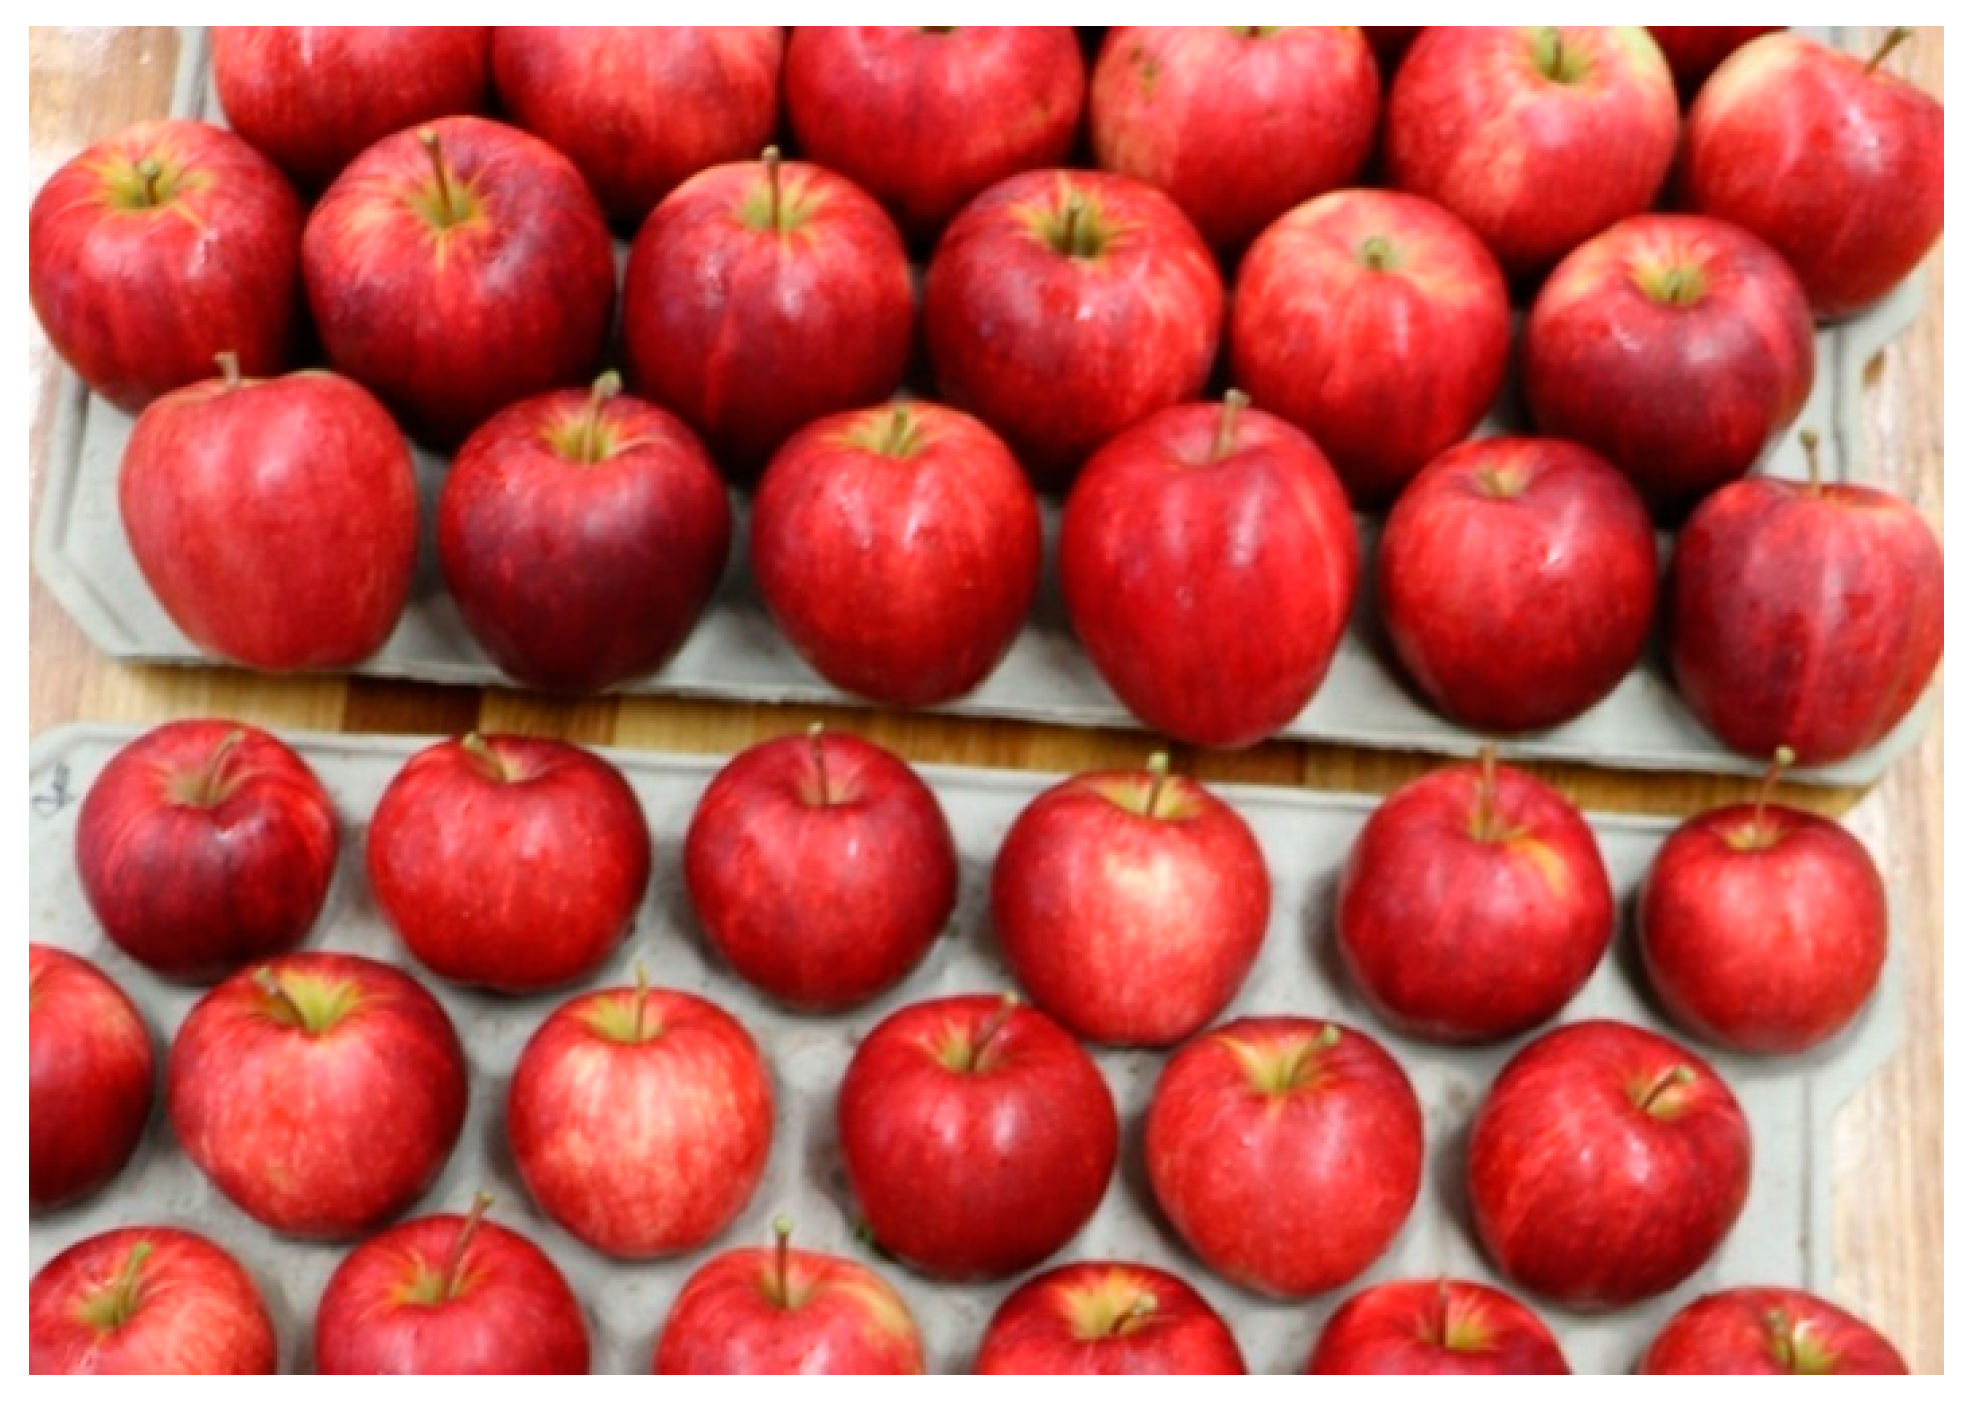
Figure 3.
‘Alvina Gala’ fruit from Trial 2. Upper tray shows fruit from trees managed through Artificial Bud Extinction (ABE) and lower tray shows fruit from the conventional regime with no chemical thinning.
Figure 3.
‘Alvina Gala’ fruit from Trial 2. Upper tray shows fruit from trees managed through Artificial Bud Extinction (ABE) and lower tray shows fruit from the conventional regime with no chemical thinning.

Figure 4.
Effect of artificial bud extinction (ABE), pruning level and chemical thinning (CT) on mean fruit weight of ‘Buckeye Gala’. Letters above bars indicate mean separation at p = 0.05.
Figure 4.
Effect of artificial bud extinction (ABE), pruning level and chemical thinning (CT) on mean fruit weight of ‘Buckeye Gala’. Letters above bars indicate mean separation at p = 0.05.

Figure 5.
Effect of artificial bud extinction (ABE), pruning level and chemical thinning (CT) on (a) skin chlorophyll content (represented by DA Index) and (b) fruit dry matter content of ‘Buckeye Gala’. Letters above bars indicate mean separation at p = 0.05.
Figure 5.
Effect of artificial bud extinction (ABE), pruning level and chemical thinning (CT) on (a) skin chlorophyll content (represented by DA Index) and (b) fruit dry matter content of ‘Buckeye Gala’. Letters above bars indicate mean separation at p = 0.05.

Figure 6.
Effect of artificial bud extinction (ABE), pruning level and chemical thinning (CT) on (a) fruit flesh firmness and (b) total soluble solids content of ‘Buckeye Gala’. Letters above bars indicate mean separation at p = 0.05.
Figure 6.
Effect of artificial bud extinction (ABE), pruning level and chemical thinning (CT) on (a) fruit flesh firmness and (b) total soluble solids content of ‘Buckeye Gala’. Letters above bars indicate mean separation at p = 0.05.


Table 1.
Cultivars, tree age, trial duration and establishment dates for Trials 1 to 4.
| Trial 1 | Trial 2 | Trial 3 | Trial 4 | |
|---|---|---|---|---|
| Cultivar | Royal Gala | Alvina Gala | Fiero Fuji | Buckeye Gala |
| Trial established | Aug 2013 | Aug 2015 | Aug 2015 | Aug 2016 |
| Trial duration | 1 year | 2 years | 2 years | 1 year |
| Number of replicates | 5 | 6 | 6 | 6 |
| Tree age | 11 years | 5 years | 5 years | 6 years |
| Tree height | 3 m | 2.5 m | 2.5 m | 2.5 m |
Table 2.
Chemical thinning program applied to ‘Gala’ and ‘Fuji’ trial trees in Trials 1, 2 and 3.
| Chemical | Rate | Application Time | Date Applied Season 1 | Date Applied Season 2 | |
|---|---|---|---|---|---|
| Royal Gala (Trial 1) | NAA (4%) | 10 mg L−1 | FB z | 14 Oct 2013 | - |
| MaxCel | 9 L ha−1 | 25 dAFB | 9 Nov 2013 | ||
| Alvina Gala (Trial 2) | Ethrel | 400 mL ha−1 | FB | 7 Oct 2015 | 13 Oct 2016 |
| NAA (4%) | 10 mg L−1 | 7 dAFB | 14 Oct 2015 | 19 Oct 2016 | |
| MaxCel | 9 L ha−1 | 16 dAFB | 27 Oct 2015 | 29 Oct 2016 | |
| Fiero Fuji (Trial 3) | Ethrel | 400 mL ha−1 | FB | 7 Oct 2015 | 13 Oct 2016 |
| MaxCel | 9 L ha−1 | 16 dAFB | 27 Oct 2015 | 29 Oct 2016 |
z FB = full bloom; dAFB = days after full bloom.
Table 3.
Effect of management regime and thinning method on number of flower clusters and fruit set of ‘Alvina Gala’ (Trial 2). LCSA = limb cross-sectional area.
Table 3.
Effect of management regime and thinning method on number of flower clusters and fruit set of ‘Alvina Gala’ (Trial 2). LCSA = limb cross-sectional area.
| No. Flower Clusters cm−2 LCSA | % Flower Clusters Set | Fruit Set Per 100 Blossom Clusters | ||||
|---|---|---|---|---|---|---|
| 2015/16 | 2016/17 | 2015/16 | 2016/17 | 2015/16 | 2016/17 | |
| (i) Management regime | ||||||
| Artificial bud extinction | 6.7 a z | 7.1 a | 96 b | 76 b | 499 b | 310 b |
| Conventional | 11.0 b | 12.4 b | 90 a | 51 a | 388 a | 140 a |
| LSD (p = 0.05) | 2.9 | 3.1 | 4 | 10 | 31 | 50 |
| (ii) Chemical thin (CT) | ||||||
| Nil | 8.3 | 9.5 | 94 | 88 b | 480 b | 321 b |
| Plus CT | 9.3 | 10 | 93 | 39 a | 407 a | 128 a |
| LSD (p = 0.05) | ns | ns | ns | 10 | 31 | 50 |
z Within each column and main effect, means followed by different letters are significantly different according to the LSD means comparison test at p = 0.05.
Table 4.
Effect of management regime and thinning method on fruit set and final crop load of ‘Fiero Fuji’ (Trial 3). LCSA = limb cross-sectional area.
Table 4.
Effect of management regime and thinning method on fruit set and final crop load of ‘Fiero Fuji’ (Trial 3). LCSA = limb cross-sectional area.
| No. Flower Clusters cm−2 LCSA | % Flower Clusters Set | Fruit Set per 100 Blossom Clusters | ||||
|---|---|---|---|---|---|---|
| 2015/16 | 2016/17 | 2015/16 | 2016/17 | 2015/16 | 2016/17 | |
| (i) Management regime | ||||||
| Artifical bud extinction | 5.9 | 6.2 a z | 96 b | 65 b | 415 b | 203 b |
| Conventional | 8.3 | 13.3 b | 86 a | 37 a | 311 a | 73 a |
| LSD (p = 0.05) | ns | 5.6 | 9 | 13 | 52 | 57 |
| (ii) Chemical thin (CT) | ||||||
| Nil | 8 | 6.3 a | 97 b | 74 b | 419 b | 212 b |
| Plus CT | 6.2 | 13.5 b | 85 a | 29 a | 307 a | 64 a |
| LSD (p = 0.05) | ns | 5.6 | 9 | 13 | 52 | 57 |
z Within each column and main effect, means followed by different letters are significantly different according to the LSD means comparison test at p = 0.05.
Table 5.
Effect of management regime and thinning method on yield and return bloom of ‘Alvina Gala’ and ‘Fiero Fuji’ (Trials 2 and 3). LCSA = limb cross-sectional area.
Table 5.
Effect of management regime and thinning method on yield and return bloom of ‘Alvina Gala’ and ‘Fiero Fuji’ (Trials 2 and 3). LCSA = limb cross-sectional area.
| Yield—‘Alvina Gala’ (Tonnes ha−1) | Yield—‘Fiero Fuji’ (Tonnes ha−1) | Return Bloom (Floral Buds cm−2 LCSA) | ||||
|---|---|---|---|---|---|---|
| 2015/16 | 2016/17 | 2015/16 | 2016/17 | ‘Alvina Gala’ | ‘Fiero Fuji’ | |
| (i) Management regime | ||||||
| Artificial bud extinction | 62.3 | 54.1 | 52.8 b z | 45.9 b | 7.2 a | 6.2 a |
| Conventional | 66.1 | 46.6 | 39.5 a | 23.4 a | 12.4 b | 13.5 b |
| LSD (p = 0.05) | ns | ns | 9.9 | 15.5 | 3.1 | 5.6 |
| (ii) Chemical thin (CT) | ||||||
| Nil | 64.5 | 54.5 | 54.6 b | 32.6 | 9.5 | 6.2 a |
| Plus CT | 63.8 | 46.2 | 37.7 a | 36.7 | 10.0 | 13.5 b |
| LSD (p = 0.05) | ns | ns | 9.9 | ns | Ns | 5.6 |
z Within each column and main effect, means followed by different letters are significantly different according to the LSD means comparison test at p = 0.05.
Table 6.
Effect of management regime, crop load and thinning method on crop load, fruit maturity (skin background colour and starch pattern index), blush intensity and shape (length/diameter ratio) of ‘Royal Gala’ (Trial 1). LCSA = limb cross-sectional area; wAFB = weeks after full bloom.
Table 6.
Effect of management regime, crop load and thinning method on crop load, fruit maturity (skin background colour and starch pattern index), blush intensity and shape (length/diameter ratio) of ‘Royal Gala’ (Trial 1). LCSA = limb cross-sectional area; wAFB = weeks after full bloom.
| Fruit Harvested cm−2 LCSA | Skin Background Colour | Starch Pattern Index | Blush Intensity | Fruit Length/Diameter Ratio | |
|---|---|---|---|---|---|
| (i) Management regime | |||||
| Artificial bud extinction | 3.4 a z | 5.87 | 3.62 | 7.54 | 0.874 a |
| Conventional | 3.7 b | 5.71 | 3.60 | 7.63 | 0.883 b |
| LSD (p = 0.05) | 0.2 | ns | ns | ns | 0.006 |
| (ii) Crop load (CL) | |||||
| 3 fruit/cm2 LCSA | 2.7 a | 6.00 b | 3.67 | 8.03 b | 0.883 |
| 4 fruit/cm2 LCSA | 3.6 b | 5.84 b | 3.69 | 7.61 ab | 0.876 |
| 5 fruit/cm2 LCSA | 4.5 c | 5.43 a | 3.47 | 7.11 a | 0.877 |
| LSD (p = 0.05) | 0.3 | 0.30 | ns | 0.57 | |
| (iii) Thinning method | |||||
| Chemical thin | 3.5 a | 5.88 b | 3.78 b | 7.99 | 0.876 |
| Hand-thin 5 wAFB | 3.4 a | 6.07 b | 3.81 b | 7.43 | 0.882 |
| Hand-thin 9 wAFB | 3.9 b | 5.43 a | 3.24 a | 7.33 | 0.878 |
| LSD (p = 0.05) | 0.3 | 0.30 | 0.22 | ns | ns |
z Within each column and main effect, means followed by different letters are significantly different according to the LSD means comparison test at p = 0.05.
Table 7.
Effect of training regime, crop load and thinning method on apple fruit quality of ‘Royal Gala’ (Trial 1). LCSA = limb cross-sectional area; wAFB = weeks after full bloom.
Table 7.
Effect of training regime, crop load and thinning method on apple fruit quality of ‘Royal Gala’ (Trial 1). LCSA = limb cross-sectional area; wAFB = weeks after full bloom.
| Mean Fruit Weight (g) | Dry Matter Content (%) | Fruit Firmness (kg) | Total Soluble Solids (Brix) | Malic Acid Content (g L−1) | |
|---|---|---|---|---|---|
| (i) Management regime | |||||
| Artificial bud extinction | 162 b z | 15.2 | 9.70 | 12.1 | 3.81 b |
| Conventional | 154 a | 14.9 | 9.71 | 11.9 | 3.71 a |
| LSD (p = 0.05) | 54 | ns | ns | ns | 0.09 |
| (ii) Crop load (CL) | |||||
| 3 fruit/cm2 LCSA | 169 c | 15.7 c | 9.86 b | 12.6 c | 3.98 c |
| 4 fruit/cm2 LCSA | 159 b | 15.0 b | 9.65 a | 12.0 b | 3.71 b |
| 5 fruit/cm2 LCSA | 147 a | 14.5 a | 9.60 a | 11.5 a | 3.58 a |
| LSD (p = 0.05) | 6 | 0.4 | 0.08 | 0.3 | 0.11 |
| (iii) Thinning method | |||||
| Chemical thin | 158 b | 15.1 | 9.74 | 12.2 b | 3.70 |
| Hand-thin 5 wAFB | 167 c | 15.1 | 9.65 | 12.2 b | 3.75 |
| Hand-thin 9 wAFB | 150 a | 15.0 | 9.73 | 11.7 a | 3.82 |
| LSD (p = 0.05) | 6 | ns | ns | 0.3 | ns |
z Within each column and main effect, means followed by different letters are significantly different according to the LSD means comparison test at p = 0.05.
Table 8.
Effect of management regime and thinning method on fruit maturity and blush intensity of ‘Alvina Gala’ (Trial 2). ABE = artificial bud extinction.
Table 8.
Effect of management regime and thinning method on fruit maturity and blush intensity of ‘Alvina Gala’ (Trial 2). ABE = artificial bud extinction.
| Skin Background Colour (DA Index z) | Starch Pattern Index | Blush Intensity | ||||
|---|---|---|---|---|---|---|
| 2015/16 | 2016/17 | 2015/16 | 2016/17 | 2015/16 | 2016/17 | |
| (i) Management regime | ||||||
| ABE | 0.74 | 0.74 b y | 2.7 b | 0.7 | 8.6 | 7.8 |
| Conventional | 0.60 | 0.58 a | 1.7 a | 0.9 | 8.7 | 8.2 |
| LSD (p = 0.05) | ns | 0.11 | 0.4 | ns | ns | ns |
| (ii) Chemical thin (CT) | ||||||
| Nil | 0.65 | 0.68 | 1.7 a | 0.6 a | 8.5 | 7.8 |
| Plus CT | 0.68 | 0.64 | 2.7 b | 0.9 b | 8.8 | 8.2 |
| LSD (p = 0.05) | ns | ns | 0.4 | 0.2 | ns | ns |
z DA index = Difference of Absorbance between 670 and 720 nm. y Within each column and main effect, means followed by different letters are significantly different according to the LSD means comparison test at p = 0.05.
Table 9.
Effect of management regime and thinning method on fruit maturity and blush intensity of ‘Fiero Fuji’ (Trial 3). ABE = artificial bud extinction.
Table 9.
Effect of management regime and thinning method on fruit maturity and blush intensity of ‘Fiero Fuji’ (Trial 3). ABE = artificial bud extinction.
| Skin Background Colour (DA Index z) | Starch Pattern Index | Red Blush Coverage (%) | ||||
|---|---|---|---|---|---|---|
| 2015/16 | 2016/17 | 2015/16 | 2016/17 | 2015/16 | 2016/17 | |
| (i) Management regime | ||||||
| ABE | 1.12 | 1.04 | 4.2 b y | 3.2 | 57 | 78 |
| Conventional | 1.07 | 0.95 | 3.8 a | 3.1 | 56 | 78 |
| LSD (p = 0.05) | Ns | ns | 0.3 | ns | ns | ns |
| (ii) Chemical thin (CT) | ||||||
| Nil | 1.21 | 0.98 | 3.8 | 3.1 | 57 | 77 |
| Plus CT | 0.98 | 1.01 | 4.1 | 3.3 | 56 | 80 |
| LSD (p = 0.05) | ns | ns | ns | ns | ns | ns |
z DA index = Difference of Absorbance between 670 and 720 nm. y Within each column and main effect, means followed by different letters are significantly different according to the LSD means comparison test at p = 0.05.
Table 10.
Effect of management regime and thinning method on fruit shape, weight and dry matter content of ‘Alvina Gala’ (Trial 2). ABE = artificial bud extinction.
Table 10.
Effect of management regime and thinning method on fruit shape, weight and dry matter content of ‘Alvina Gala’ (Trial 2). ABE = artificial bud extinction.
| Length/Diameter Ratio | Mean Fruit Weight (g) | Dry Matter Content (%) | ||||
|---|---|---|---|---|---|---|
| 2015/16 | 2016/17 | 2015/16 | 2016/17 | 2015/16 | 2016/17 | |
| (i) Management regime | ||||||
| ABE | 0.95 b z | 0.98 b | 234 b | 175 b | 14.4 | 14.6 |
| Conventional | 0.90 a | 0.93 a | 170 a | 149 a | 14.9 | 14.9 |
| LSD (p = 0.05) | 0.01 | 0.01 | 13 | 13 | ns | ns |
| (ii) Chemical thin (CT) | ||||||
| Nil | 0.93 b | 0.94 a | 198 | 147 a | 14.9 | 14.7 |
| Plus CT | 0.91 a | 0.97 b | 207 | 176 b | 14.5 | 14.8 |
| LSD (p = 0.05) | 0.01 | 0.01 | ns | 13 | ns | ns |
z Within each column and main effect, means followed by different letters are significantly different according to the LSD means comparison test at p = 0.05.
Table 11.
Effect of management regime and thinning method on fruit shape, weight and dry matter content of ‘Fiero Fuji’ (Trial 3). ABE = artificial bud extinction.
Table 11.
Effect of management regime and thinning method on fruit shape, weight and dry matter content of ‘Fiero Fuji’ (Trial 3). ABE = artificial bud extinction.
| Length/Diameter Ratio | Mean Fruit Weight (g) | Dry Matter Content (%) | ||||
|---|---|---|---|---|---|---|
| 2015/16 | 2016/17 | 2015/16 | 2016/17 | 2015/16 | 2016/17 | |
| (i) Management regime | ||||||
| ABE | 0.89 | 0.91 | 189 b z | 156 | 15.2 | 14.8 |
| Conventional | 0.88 | 0.90 | 137 a | 148 | 15.6 | 14.9 |
| LSD (p = 0.05) | ns | ns | 21 | ns | ns | ns |
| (ii) Chemical thin (CT) | ||||||
| Nil | 0.88 | 0.90 | 155 | 141 a | 14.5 a | 14.5 |
| Plus CT | 0.88 | 0.91 | 173 | 163 b | 16.2 b | 15.3 |
| LSD (p = 0.05) | ns | ns | ns | 16 | 1.1 | ns |
z Within each column and main effect, means followed by different letters are significantly different according to the LSD means comparison test at p = 0.05.
Table 12.
Effect of management regime and thinning method on fruit firmness, total soluble solids and malic acid content of ‘Alvina Gala’ (Trial 2). ABE = artificial bud extinction.
Table 12.
Effect of management regime and thinning method on fruit firmness, total soluble solids and malic acid content of ‘Alvina Gala’ (Trial 2). ABE = artificial bud extinction.
| Flesh Firmness (kg) | Total Soluble Solids (Brix) | Malic Acid Content (g L−1) | ||||
|---|---|---|---|---|---|---|
| 2015/16 | 2016/17 | 2015/16 | 2016/17 | 2015/16 | 2016/17 | |
| (i) Management regime | ||||||
| ABE | 7.6 a z | 8.7 a | 12.3 | 10.9 | 3.11 a | 3.82 |
| Conventional | 8.6 b | 9.0 b | 12.1 | 11.1 | 3.26 b | 3.81 |
| LSD (p = 0.05) | 0.4 | 0.3 | ns | Ns | 0.13 | ns |
| (ii) Chemical thin (CT) | ||||||
| Nil | 8.3 b | 8.9 | 12.2 | 10.9 | 3.29 b | 3.83 |
| Plus CT | 7.9 a | 8.8 | 12.3 | 11.1 | 3.09 a | 3.78 |
| LSD (p = 0.05) | 0.4 | ns | ns | Ns | 0.13 | ns |
z Within each column and main effect, means followed by different letters are significantly different according to the LSD means comparison test at p = 0.05.
Table 13.
Effect of management regime and thinning method on fruit firmness, total soluble solids and malic acid content of ‘Fiero Fuji’ (Trial 3). ABE = artificial bud extinction.
Table 13.
Effect of management regime and thinning method on fruit firmness, total soluble solids and malic acid content of ‘Fiero Fuji’ (Trial 3). ABE = artificial bud extinction.
| Flesh Firmness (kg) | Total Soluble Solids (Brix) | Malic Acid Content (g L−1) | ||||
|---|---|---|---|---|---|---|
| 2015/16 | 2016/17 | 2015/16 | 2016/17 | 2015/16 | 2016/17 | |
| (i) Management regime | ||||||
| ABE | 8.3 a z | 8.9 | 11.7 | 12.7 | 4.15 | 4.78 |
| Conventional | 8.8 b | 9.0 | 11.9 | 12.9 | 4.20 | 5.33 |
| LSD (p = 0.05) | 0.3 | ns | ns | ns | ns | ns |
| (ii) Chemical thin (CT) | ||||||
| Nil | 8.1 a | 9.2 | 11.4 | 12.7 | 4.13 | 5.15 |
| Plus CT | 9.0 b | 8.8 | 12.3 | 12.9 | 4.22 | 4.96 |
| LSD (p = 0.05) | 0.3 | ns | ns | ns | ns | ns |
z Within each column and main effect, means followed by different letters are significantly different according to the LSD means comparison test at p = 0.05.
Table 14.
Cost comparison for treatments applied in Trial 4. ABE = Artificial Spur Extinction, GP = grower prune, CT = chemical thinning.
Table 14.
Cost comparison for treatments applied in Trial 4. ABE = Artificial Spur Extinction, GP = grower prune, CT = chemical thinning.
| Costs ($/ha) | |||||
|---|---|---|---|---|---|
| Pruning | ABE Setup | Hand-Thinning | Chemical Thinning | Total | |
| (i) Year 1 (initial ABE implementation) | |||||
| ABE | 2604 | 2604 | 5208 | - | 10,417 |
| ABE + CT | 2604 | 2604 | 4688 | 623 | 10,519 |
| GP/ABE | 1823 | 2865 | 6354 | - | 11,042 |
| GP/ABE + CT | 1823 | 2865 | 6250 | 623 | 11,561 |
| GP + CT (standard) | 1823 | - | 7813 | 623 | 10,258 |
| (ii) Year 2 | |||||
| ABE | 1823 | 1302 | 5208 | - | 8333 |
| Standard (GP + CT) | 1823 | - | 7813 | 623 | 10,258 |
© 2018 by the author. Licensee MDPI, Basel, Switzerland. This article is an open access article distributed under the terms and conditions of the Creative Commons Attribution (CC BY) license (http://creativecommons.org/licenses/by/4.0/).
Share and Cite
MDPI and ACS Style
Bound, S.A. Precision Crop Load Management of Apple (Malus x domestica Borkh.) without Chemicals. Horticulturae 2019, 5, 3. https://doi.org/10.3390/horticulturae5010003
AMA Style
Bound SA. Precision Crop Load Management of Apple (Malus x domestica Borkh.) without Chemicals. Horticulturae. 2019; 5(1):3. https://doi.org/10.3390/horticulturae5010003
Chicago/Turabian StyleBound, Sally A. 2019. "Precision Crop Load Management of Apple (Malus x domestica Borkh.) without Chemicals" Horticulturae 5, no. 1: 3. https://doi.org/10.3390/horticulturae5010003
Note that from the first issue of 2016, this journal uses article numbers instead of page numbers. See further details here.